which miners are facing up to the low-carbon challenge
TRANSCRIPT

Digging deep
Authors: Tarek Soliman, Luke Fletcher and Tom Crocker
July 2017
Which miners are facing up to the low-carbon challenge?Executive Summary

2
Authors:Tarek Soliman, CFALuke FletcherTom Crocker
CDP’s sector research for investors provides the most comprehensive climate and water-related data
and analysis on the market. The Extel IRRI survey ranked CDP the number one global research house
for climate change and as having the most innovative SRI research product for its sector research
series in 2015 and 2016. Investment Week also awarded it best SRI research for 2016.
CDP’s sector research series takes an in-depth look at high impact industries one-by-one. Reports are
now available on the automotive industry, electric utilities, diversified chemicals, diversified mining,
cement, steel, and oil and gas.
Full sector reports are exclusively available to CDP investor signatories through the online investor
dashboard and include detailed analysis, company insights and methodology. To become a CDP
signatory and gain access to the full reports and other tools, including CDP company disclosure data,
please contact [email protected].
For more information see:
https://www.cdp.net/en/investor/sector-research
https://www.cdp.net/en/dashboards/investor

3
Linking climate-related metrics to earnings for diversified miners
This report updates CDP’s research and League Table for diversified miners, first published in November 2015. It ranks 12 of the largest publicly listed diversified miners (by market capitalization) on business readiness for a low-carbon economy transition. The companies in aggregate represent 66% of the global seaborne market in iron ore, 53% in copper, 42% in metallurgical coal and 28% in thermal coal.
Mining companies represent the start of the value chain for several sectors set to undergo significant change as part of the transition to a low-carbon economy including utilities, industrials and transport. This economy-wide transition represents opportunities through demand created for materials needed to drive carbon abatement; however, it also poses risks associated with shifts away from some incumbent commodity use.
There are four key areas assessed in the League Table, which are aligned with recommendations for company reporting from the G20 Financial Stability Board’s Task Force on Climate-related Financial Disclosures (TCFD):
Transition risks: We assess companies’ earnings exposure to various commodities and estimate implied risks from downstream industry carbon regulation and changing demand patterns. We also rank companies on cost efficiency metrics such as energy and emissions intensity.
Physical risks: We map company asset level current and projected future (2030) indicators of water stress risk using WRI’s Aqueduct Water Risk Atlas. We compare this water stress exposure with companies’ water withdrawal intensity, use of water recycling, and water governance frameworks as a proxy for potential revenue disruption.
Transition opportunities: We assess companies’ progress and strategy in shifting towards a low-carbon economy by looking at CAPEX allocation across commodities, capital flexibility and innovative solutions such as smart and renewable energy infrastructure.
Climate governance and strategy: We analyze companies’ governance frameworks including emissions reduction targets, alignment of governance and remuneration structures with low-carbon objectives, and actions taken in supporting or opposing policies to achieve a low-carbon transition.
Key findings { The mining sector shows signs of progress in
its operational emissions management, reduced exposure to thermal coal and capital allocation in the context of a low-carbon transition.
{ However, significant risks remain for the sector, as a supplier to emissions-intensive industries, from downstream regulation and changing consumption patterns.
{ Operational emissions are on an improving trend as the miners come through their recent cost cutting exercise – 9 of 12 companies have taken steps to reduce the emissions intensity of operations.
{ Around 45% of company capital expenditure is being spent on commodities which will benefit from low-carbon technologies such as copper and nickel; however, this is partially offset by 25% of CAPEX going on fossil fuels particularly oil & gas.
{ The mining industry has significant potential exposure to carbon emissions regulation in its value chain where Scope 3 emissions from downstream customers is estimated at an average of 10x and up to 30x higher than operational emissions.
{ Carbon pricing regulation is on the rise with China’s emissions trading scheme (ETS) likely is to be most disruptive to demand patterns of commodities – Chile introduced carbon pricing this year with Canada and South Africa coming on stream in 2018.
{ China could play a pivotal role in the demand for “low-carbon” commodities and disrupt demand in the seaborne bulks as it adopts a leadership role in climate change regulation.
{ Investor demands for greater transparency on climate risks will continue to test the sector where scenario planning is in its infancy and requires more standardized reporting against climate constrained pathways.
{ By 2030, 27% of production and up to US$50bn of revenues is likely to be exposed to high levels of water stress risk. Miners are resorting to using greater amounts of seawater, desalination technology and water recycling to hedge against disruption to operations.
{ Highest ranked companies are Vale, Boliden and BHP. Lowest ranked companies are Freeport-McMoRan, First Quantum Minerals and Vedanta Resources.
{ Glencore was the largest gainer, Teck and Vedanta Resources had the largest falls in league table rankings relative to 2015.
4
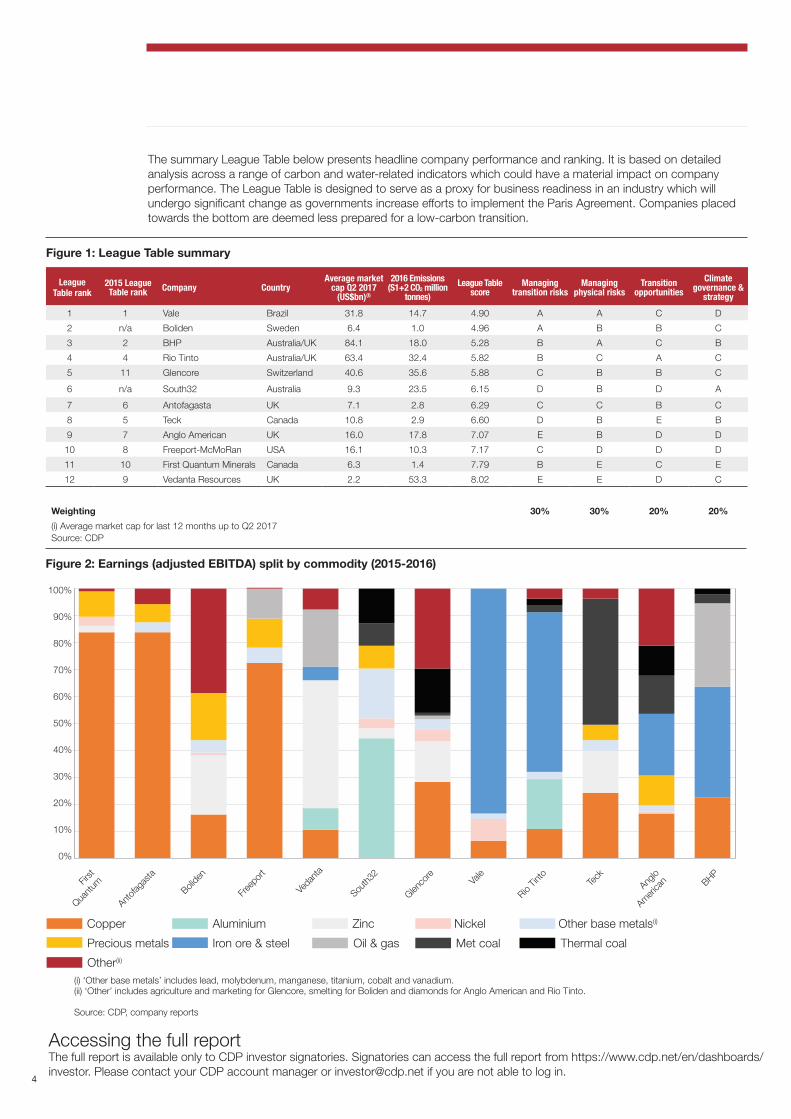
The summary League Table below presents headline company performance and ranking. It is based on detailed analysis across a range of carbon and water-related indicators which could have a material impact on company performance. The League Table is designed to serve as a proxy for business readiness in an industry which will undergo significant change as governments increase efforts to implement the Paris Agreement. Companies placed towards the bottom are deemed less prepared for a low-carbon transition.
Figure 1: League Table summary
League Table rank
2015 League Table rank Company Country
Average market cap Q2 2017
(US$bn)(i)
2016 Emissions (S1+2 CO2 million
tonnes)League Table
scoreManaging
transition risksManaging
physical risksTransition
opportunitiesClimate
governance & strategy
1 1 Vale Brazil 31.8 14.7 4.90 A A C D
2 n/a Boliden Sweden 6.4 1.0 4.96 A B B C
3 2 BHP Australia/UK 84.1 18.0 5.28 B A C B
4 4 Rio Tinto Australia/UK 63.4 32.4 5.82 B C A C
5 11 Glencore Switzerland 40.6 35.6 5.88 C B B C
6 n/a South32 Australia 9.3 23.5 6.15 D B D A
7 6 Antofagasta UK 7.1 2.8 6.29 C C B C
8 5 Teck Canada 10.8 2.9 6.60 D B E B
9 7 Anglo American UK 16.0 17.8 7.07 E B D D
10 8 Freeport-McMoRan USA 16.1 10.3 7.17 C D D D
11 10 First Quantum Minerals Canada 6.3 1.4 7.79 B E C E
12 9 Vedanta Resources UK 2.2 53.3 8.02 E E D C
Weighting 30% 30% 20% 20%
(i) Average market cap for last 12 months up to Q2 2017 Source: CDP
Figure 2: Earnings (adjusted EBITDA) split by commodity (2015-2016)
100%
90%
80%
70%
60%
50%
40%
30%
20%
10%
0%
Anglo
Ameri
can
Freep
ort
Glenco
reTe
ckFirst
Quantu
m
Antofag
asta
Rio Tin
to
Bolide
n
Veda
nta
South3
2Va
leBHP
(i) ‘Other base metals’ includes lead, molybdenum, manganese, titanium, cobalt and vanadium.(ii) ‘Other’ includes agriculture and marketing for Glencore, smelting for Boliden and diamonds for Anglo American and Rio Tinto. Source: CDP, company reports
Copper
Oil & gas Met coal
Other(ii)
Thermal coal
Aluminium Zinc
Precious metals Iron ore & steel
Nickel Other base metals(i)
Accessing the full reportThe full report is available only to CDP investor signatories. Signatories can access the full report from https://www.cdp.net/en/dashboards/investor. Please contact your CDP account manager or [email protected] if you are not able to log in.
60
CDP contacts
Frances WayCo-Chief Operating Officer
Rick StathersHead of Investor Initiatives+44 (0) 20 3818 [email protected]
Cynthia SimonSenior Manager, Investor Initiatives North America+1 646 517 [email protected]
Emma HenningssonSenior Account Manager,Investor Initiatives+46 (0) 705 [email protected]
Agnes Terestchenko, CFASenior Manager,Investor Initiatives North America+1 646 668 [email protected]
Brendan BakerSenior Manager,Investor Initiatives+44 (0) 203 818 [email protected]
Henry Repard Account Manager,Investor Initiatives+44 (0) 203 818 [email protected]
Sebastian O’ConnorSenior Project Officer,Investor Initiatives+44 (0) 20 3818 [email protected]
CDP Investor Research
Carole FergusonHead of Investor Research+44 (0) 20 3818 3956 [email protected]
Tarek Soliman, CFASenior Analyst+44 (0) 20 3818 [email protected]
Drew Fryer, CFASenior Analyst+44 (0) 20 3818 3935drew. [email protected]
Luke FletcherAnalyst+44 (0) 20 3818 [email protected]
James [email protected]
CDP Board of Trustees
Chairman: Alan Brown
Jane Ambachtsheer
Jeremy Burke
Stephen Chow
Kate Hampton
Jeremy Smith
Takejiro Sueyoshi
Martin Wise
CDP UK71 Queen Victoria StreetLondon EC4V 4AYUnited KingdomTel: +44 (0) 203 818 3900
Important Notice:
CDP is not an investment advisor, and makes no representation regarding the advisability of investing in any particular company or investment fund or other vehicle. A decision to invest in any such investment fund or other entity should not be made in reliance on any of the statements set forth in this publication. While CDP has obtained information believed to be reliable, it makes no representation or warranty (express or implied) as to the accuracy or completeness of the information and opinions contained in this report, and it shall not be liable for any claims or losses of any nature in connection with information contained in this document, including but not limited to, lost profits or punitive or consequential damages.
The contents of this report may be used by anyone providing acknowledgement is given to CDP. This does not represent a license to repackage or resell any of the data reported to CDP and presented in this report. If you intend to repackage or resell any of the contents of this report, you need to obtain express permission from CDP before doing so.