which model is best? - university of western...
TRANSCRIPT
1
Copyright © Andrew W. Moore Slide 1
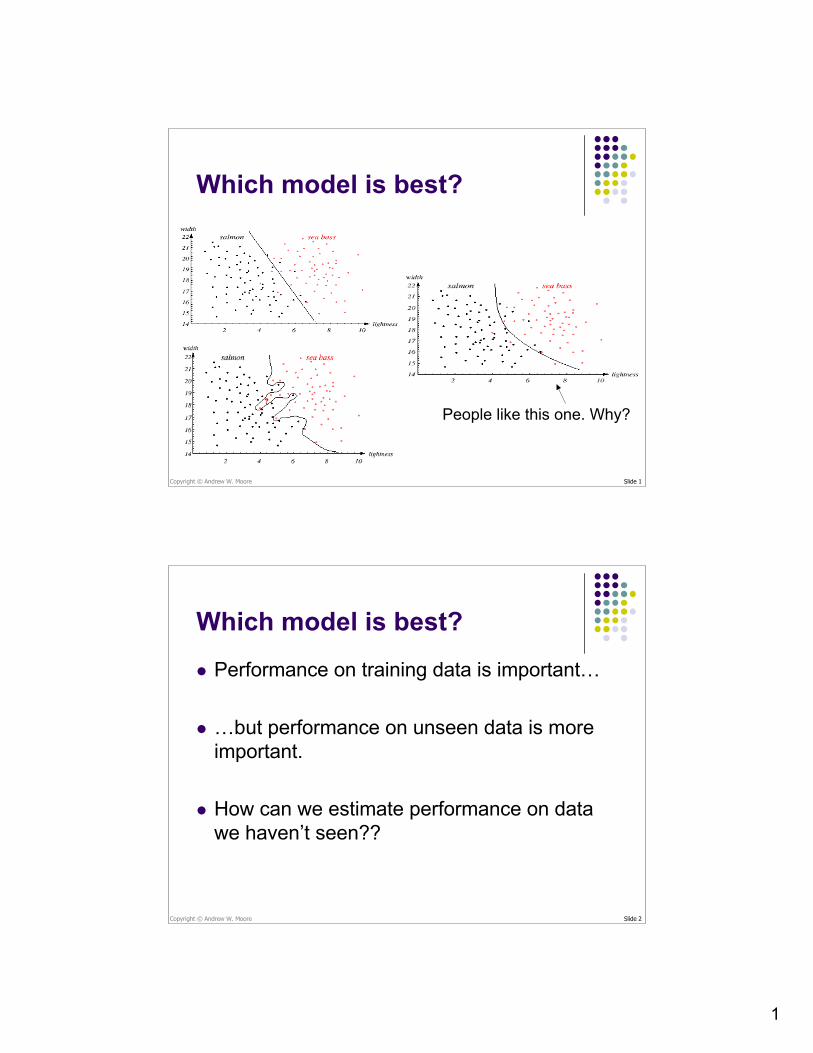
Which model is best?
People like this one. Why?
Copyright © Andrew W. Moore Slide 2
Which model is best?
Performance on training data is important…
…but performance on unseen data is moreimportant.
How can we estimate performance on datawe haven’t seen??

2
Copyright © Andrew W. Moore Slide 3
Which model is best? How can we estimate performance on data
we haven’t seen?? PAC bounds VC Dimension / structural risk minimization
These are useful, but weak sometimes Not clear how to apply them to regression Now we’ll look at a technique that is widely
applicable and commonly used
Copyright © Andrew W. Moore Slide 4
Cross-validation fordetecting and preventing
overfittingAndrew W. Moore
ProfessorSchool of Computer ScienceCarnegie Mellon University
www.cs.cmu.edu/[email protected]
412-268-7599
Note to other teachers and users ofthese slides. Andrew would be delightedif you found this source material useful ingiving your own lectures. Feel free to usethese slides verbatim, or to modify themto fit your own needs. PowerPointoriginals are available. If you make useof a significant portion of these slides inyour own lecture, please include thismessage, or the following link to thesource repository of Andrew’s tutorials:http://www.cs.cmu.edu/~awm/tutorials .Comments and corrections gratefullyreceived.
Alpaydin Chapter 14.1 - 14.2

3
Copyright © Andrew W. Moore Slide 5
Pause: Switching to regression• Instead of looking at a classification problem, we
are going to use regression as our exampleproblem. Alpaydin pp. 73-83
• DON’T PANIC
• Only difference is continuous vs. discrete labels• This difference does not matter for the issues we’re
talking about today.• The regression example is kind of cool.• Instead of y = sign(x·w + b), we’ll have have y = x·w + b
• Don’t stress over the math; look at the pictures.
Copyright © Andrew W. Moore Slide 6
A Regression Problem
x
y
y = f(x) + noise
Can we learn f from this data?
Let’s consider three methods…

4
Copyright © Andrew W. Moore Slide 7
Linear Regression
x
y
Objective: Minimize the
Sum of Squared Errors
i.e. sum of squared differences
between y values
and the green line
y = w0 + w1·x
Copyright © Andrew W. Moore Slide 8
Linear RegressionUnivariate Linear regression with a constant term:
::3173
YX
:13
:37X= y=
x1=(3).. y1=7..

5
Copyright © Andrew W. Moore Slide 9
Linear RegressionUnivariate Linear regression with a constant term:
::3173
YX
:13
:37X= y=
x1=(3).. y1=7..
13
:11
:37
Z= y=
z1=(1,3)..
zk=(1,xk)
y1=7..
Copyright © Andrew W. Moore Slide 10
Linear RegressionUnivariate Linear regression with a constant term:
::3173
YX
:13
:37X= y=
x1=(3).. y1=7..
13
:11
:37
Z= y=
z1=(1,3)..
zk=(1,xk)
y1=7..
w=(ZTZ)-1(ZTy)
yest = w0+ w1 x
Alpaydin 2.6
6
Copyright © Andrew W. Moore Slide 11
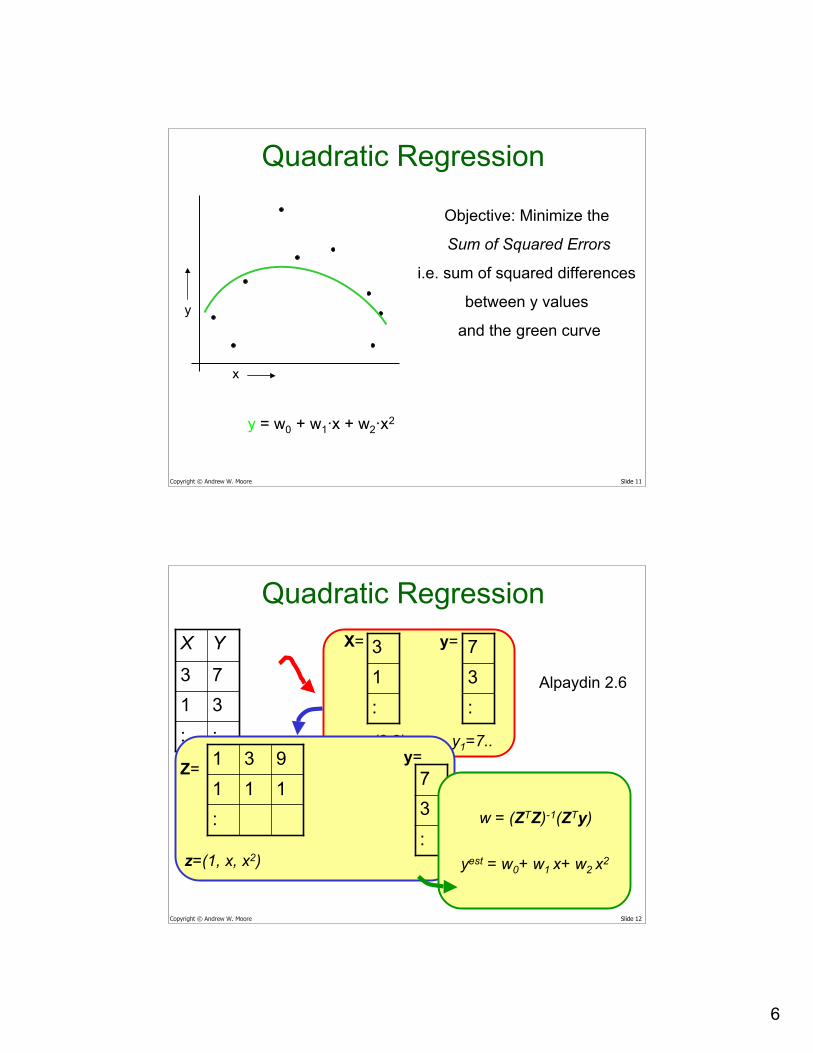
Quadratic Regression
x
y
Objective: Minimize the
Sum of Squared Errors
i.e. sum of squared differences
between y values
and the green curve
y = w0 + w1·x + w2·x2
Copyright © Andrew W. Moore Slide 12
Quadratic Regression
::3173
YX
:13
:37X= y=
x1=(3,2).. y1=7..
19
13
:11
:37Z=
y=
z=(1, x, x2)
w = (ZTZ)-1(ZTy)
yest = w0+ w1 x+ w2 x2
Alpaydin 2.6

7
Copyright © Andrew W. Moore Slide 13
Join-the-dots
x
y
Also known as piecewiselinear nonparametric
regression if that makesyou feel better
y = complicated
Copyright © Andrew W. Moore Slide 14
Which is best?
x
y
x
y
Why not choose the method with thebest fit to the data?

8
Copyright © Andrew W. Moore Slide 15
What do we really want?
x
y
x
y
Why not choose the method with thebest fit to the data?
“How well are you going to predictfuture data drawn from the same
distribution?”
Copyright © Andrew W. Moore Slide 16
The test set method
x
y
1. Randomly choose 30%of the data to be in a testset
2. The remainder is atraining set

9
Copyright © Andrew W. Moore Slide 17
The test set method
x
y
1. Randomly choose 30%of the data to be in a testset
2. The remainder is atraining set
3. Perform yourregression on the trainingset
(Linear regression example)
Copyright © Andrew W. Moore Slide 18
The test set method
x
y
1. Randomly choose 30%of the data to be in a testset
2. The remainder is atraining set
3. Perform yourregression on the trainingset
4. Estimate your futureperformance with the testset
(Linear regression example)
Mean Squared Error = 2.4

10
Copyright © Andrew W. Moore Slide 19
The test set method
x
y
1. Randomly choose 30%of the data to be in a testset
2. The remainder is atraining set
3. Perform yourregression on the trainingset
4. Estimate your futureperformance with the testset
(Quadratic regression example)
Mean Squared Error = 0.9
Copyright © Andrew W. Moore Slide 20
The test set method
x
y
1. Randomly choose 30%of the data to be in a testset
2. The remainder is atraining set
3. Perform yourregression on the trainingset
4. Estimate your futureperformance with the testset
(Join the dots example)
Mean Squared Error = 2.2

11
Copyright © Andrew W. Moore Slide 21
The test set methodGood news:
•Very very simple
•Can then simply choose the method withthe best test-set score
Bad news:
•What’s the downside?
Copyright © Andrew W. Moore Slide 22
The test set methodGood news:
•Very very simple
•Can then simply choose the method withthe best test-set score
Bad news:
•Wastes data: we get an estimate of thebest method to apply to 30% less data
•If we don’t have much data, our test-setmight just be lucky or unlucky
We say the“test-setestimator ofperformancehas highvariance”

12
Copyright © Andrew W. Moore Slide 23
LOOCV (Leave-one-out Cross Validation)
x
y
For k=1 to R
1. Let (xk,yk) be the kth record
Copyright © Andrew W. Moore Slide 24
LOOCV (Leave-one-out Cross Validation)
x
y
For k=1 to R
1. Let (xk,yk) be the kth record
2. Temporarily remove (xk,yk)from the dataset

13
Copyright © Andrew W. Moore Slide 25
LOOCV (Leave-one-out Cross Validation)
x
y
For k=1 to R
1. Let (xk,yk) be the kth record
2. Temporarily remove (xk,yk)from the dataset
3. Train on the remaining R-1datapoints
Copyright © Andrew W. Moore Slide 26
LOOCV (Leave-one-out Cross Validation)For k=1 to R
1. Let (xk,yk) be the kth record
2. Temporarily remove (xk,yk)from the dataset
3. Train on the remaining R-1datapoints
4. Note your error (xk,yk)
x
y

14
Copyright © Andrew W. Moore Slide 27
LOOCV (Leave-one-out Cross Validation)For k=1 to R
1. Let (xk,yk) be the kth record
2. Temporarily remove (xk,yk)from the dataset
3. Train on the remaining R-1datapoints
4. Note your error (xk,yk)
When you’ve done all points,report the mean error.
x
y
Copyright © Andrew W. Moore Slide 28
LOOCV (Leave-one-out Cross Validation)For k=1 to R
1. Let (xk,yk) bethe kth
record
2. Temporarilyremove(xk,yk) fromthe dataset
3. Train on theremainingR-1datapoints
4. Note yourerror (xk,yk)
When you’vedone all points,report the meanerror.
x
y
x
y
x
y
x
y
x
y
x
y
x
y
x
y
x
y
MSELOOCV= 2.12

15
Copyright © Andrew W. Moore Slide 29
LOOCV for Quadratic RegressionFor k=1 to R
1. Let (xk,yk) bethe kth
record
2. Temporarilyremove(xk,yk) fromthe dataset
3. Train on theremainingR-1datapoints
4. Note yourerror (xk,yk)
When you’vedone all points,report the meanerror.
x
y
x
y
x
y
x
y
x
y
x
y
x
y
x
y
x
y
MSELOOCV=0.962
Copyright © Andrew W. Moore Slide 30
LOOCV for Join The DotsFor k=1 to R
1. Let (xk,yk) bethe kth
record
2. Temporarilyremove(xk,yk) fromthe dataset
3. Train on theremainingR-1datapoints
4. Note yourerror (xk,yk)
When you’vedone all points,report the meanerror.
x
y
x
y
x
y
x
y
x
y
x
y
x
y
x
y
x
y
MSELOOCV=3.33

16
Copyright © Andrew W. Moore Slide 31
Which kind of Cross Validation?
Doesn’twaste data
Expensive.Has some weirdbehavior
Leave-one-out
CheapVariance: unreliableestimate of futureperformance
Test-setUpsideDownside
..can we get the best of both worlds?
Copyright © Andrew W. Moore Slide 32
k-fold CrossValidation
x
y
Randomly break the dataset into kpartitions (in our example we’ll have k=3partitions colored Red Green and Blue)

17
Copyright © Andrew W. Moore Slide 33
k-fold CrossValidation
x
y
Randomly break the dataset into kpartitions (in our example we’ll have k=3partitions colored Red Green and Blue)
For the red partition: Train on all thepoints not in the red partition. Findthe test-set sum of errors on the redpoints.
Copyright © Andrew W. Moore Slide 34
k-fold CrossValidation
x
y
Randomly break the dataset into kpartitions (in our example we’ll have k=3partitions colored Red Green and Blue)
For the red partition: Train on all thepoints not in the red partition. Findthe test-set sum of errors on the redpoints.
For the green partition: Train on all thepoints not in the green partition.Find the test-set sum of errors onthe green points.

18
Copyright © Andrew W. Moore Slide 35
k-fold CrossValidation
x
y
Randomly break the dataset into kpartitions (in our example we’ll have k=3partitions colored Red Green and Blue)
For the red partition: Train on all thepoints not in the red partition. Findthe test-set sum of errors on the redpoints.
For the green partition: Train on all thepoints not in the green partition.Find the test-set sum of errors onthe green points.
For the blue partition: Train on all thepoints not in the blue partition. Findthe test-set sum of errors on theblue points.
Copyright © Andrew W. Moore Slide 36
k-fold CrossValidation
x
y
Randomly break the dataset into kpartitions (in our example we’ll have k=3partitions colored Red Green and Blue)
For the red partition: Train on all thepoints not in the red partition. Findthe test-set sum of errors on the redpoints.
For the green partition: Train on all thepoints not in the green partition.Find the test-set sum of errors onthe green points.
For the blue partition: Train on all thepoints not in the blue partition. Findthe test-set sum of errors on theblue points.
Then report the mean errorLinear RegressionMSE3FOLD=2.05

19
Copyright © Andrew W. Moore Slide 37
k-fold CrossValidation
x
y
Randomly break the dataset into kpartitions (in our example we’ll have k=3partitions colored Red Green and Blue)
For the red partition: Train on all thepoints not in the red partition. Findthe test-set sum of errors on the redpoints.
For the green partition: Train on all thepoints not in the green partition.Find the test-set sum of errors onthe green points.
For the blue partition: Train on all thepoints not in the blue partition. Findthe test-set sum of errors on theblue points.
Then report the mean errorQuadratic RegressionMSE3FOLD=1.11
Copyright © Andrew W. Moore Slide 38
k-fold CrossValidation
x
y
Randomly break the dataset into kpartitions (in our example we’ll have k=3partitions colored Red Green and Blue)
For the red partition: Train on all thepoints not in the red partition. Findthe test-set sum of errors on the redpoints.
For the green partition: Train on all thepoints not in the green partition.Find the test-set sum of errors onthe green points.
For the blue partition: Train on all thepoints not in the blue partition. Findthe test-set sum of errors on theblue points.
Then report the mean errorJoint-the-dotsMSE3FOLD=2.93
20
Copyright © Andrew W. Moore Slide 39
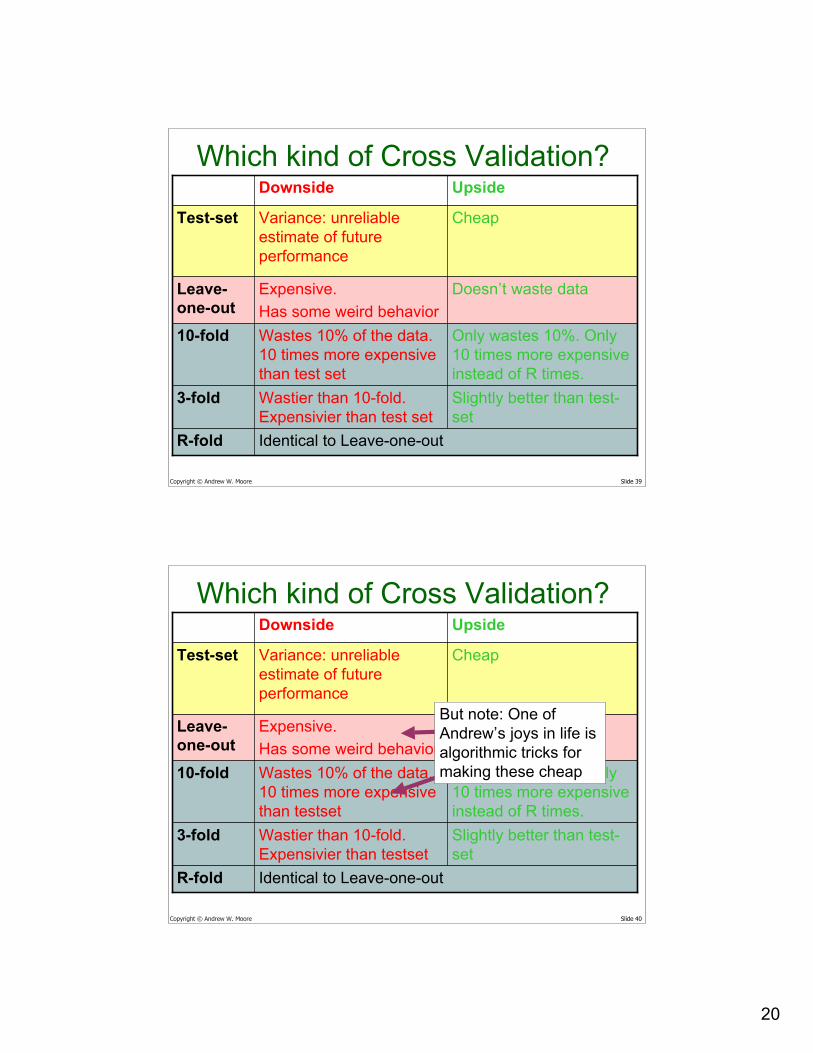
Which kind of Cross Validation?
Doesn’t waste dataExpensive.Has some weird behavior
Leave-one-out
Only wastes 10%. Only10 times more expensiveinstead of R times.
Wastes 10% of the data.10 times more expensivethan test set
10-fold
Slightly better than test-set
Wastier than 10-fold.Expensivier than test set
3-fold
Identical to Leave-one-outR-fold
CheapVariance: unreliableestimate of futureperformance
Test-set
UpsideDownside
Copyright © Andrew W. Moore Slide 40
Which kind of Cross Validation?
Doesn’t waste dataExpensive.Has some weird behavior
Leave-one-out
Only wastes 10%. Only10 times more expensiveinstead of R times.
Wastes 10% of the data.10 times more expensivethan testset
10-fold
Slightly better than test-set
Wastier than 10-fold.Expensivier than testset
3-fold
Identical to Leave-one-outR-fold
CheapVariance: unreliableestimate of futureperformance
Test-set
UpsideDownside
But note: One ofAndrew’s joys in life isalgorithmic tricks formaking these cheap

21
Copyright © Andrew W. Moore Slide 41
CV-based Model Selection• We’re trying to decide which algorithm to use.• We train each machine and make a table…
f44f55f66
√f33f22f11
Choice10-FOLD-CV-ERRTRAINERRfii
Copyright © Andrew W. Moore Slide 42
CV-based Model Selection• Example: Choosing maxPchance for decision tree pruning• Step 1: Compute 10-fold CV error for six different model
classes:
maxPchance 0.07
maxPchance 0.09
maxPchance 0.11
√maxPchance 0.05
maxPchance 0.03
maxPchance 0.01Choice10-FOLD-CV-ERRTRAINERRPruning
• Step 2: Whichever model class gave best CV score: train itwith all the data, and that’s the predictive model you’ll use.
22
Copyright © Andrew W. Moore Slide 43
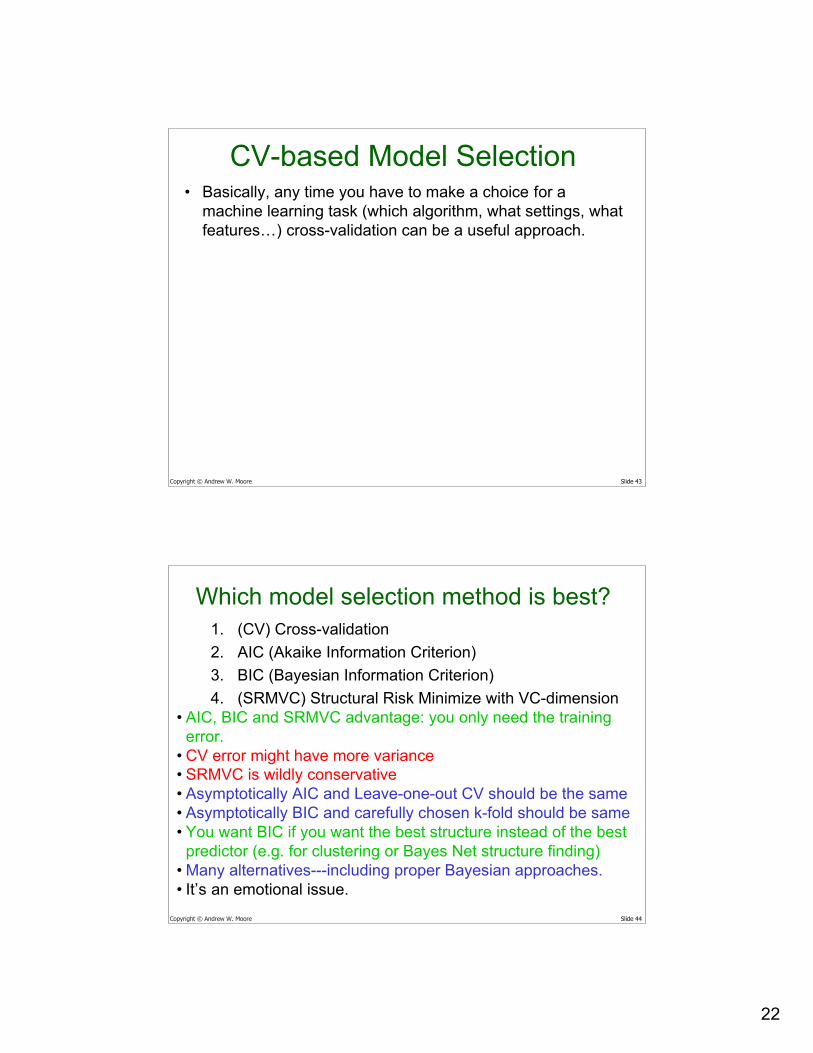
CV-based Model Selection• Basically, any time you have to make a choice for a
machine learning task (which algorithm, what settings, whatfeatures…) cross-validation can be a useful approach.
Copyright © Andrew W. Moore Slide 44
Which model selection method is best?1. (CV) Cross-validation2. AIC (Akaike Information Criterion)3. BIC (Bayesian Information Criterion)4. (SRMVC) Structural Risk Minimize with VC-dimension
• AIC, BIC and SRMVC advantage: you only need the trainingerror.
• CV error might have more variance• SRMVC is wildly conservative• Asymptotically AIC and Leave-one-out CV should be the same• Asymptotically BIC and carefully chosen k-fold should be same• You want BIC if you want the best structure instead of the best
predictor (e.g. for clustering or Bayes Net structure finding)• Many alternatives---including proper Bayesian approaches.• It’s an emotional issue.

23
Copyright © Andrew W. Moore Slide 45
Feature Selection• Suppose you have a learning algorithm LA
and a set of input attributes { X1 , X2 .. Xm }• You expect that your learner will only find
some subset of the attributes useful.• Question: How can we use cross-validation
to find a useful subset?• Four ideas:
• Forward selection• Backward elimination• Hill Climbing• Stochastic search (Simulated Annealing or GAs)
Another fun area in whichAndrew has spent a lot of his
wild youth
Copyright © Andrew W. Moore Slide 46
What you should know• Why you can’t use “training-set-error” to
estimate the quality of your learningalgorithm on your data.
• Why you can’t use “training set error” tochoose the learning algorithm
• Test-set cross-validation• Leave-one-out cross-validation• k-fold cross-validation