(which was not certified by peer review) is the author/funder. it ......2020/07/15 · 23...
TRANSCRIPT

1
Title: 1
High-density Neural Recordings from Feline Sacral Dorsal Root Ganglia with Thin-film Array 2
Authors: 3
Zachariah J. Sperry1,2, Kyounghwan Na3, James Jun4, Lauren R. Madden1,2, Alec Socha2,3, 4
Eusik Yoon1,3,5, John P. Seymour1,3,6,7, Tim M. Bruns1,2,* 5
Author Affiliations: 6
1. Biomedical Engineering, University of Michigan, Ann Arbor, MI, USA 7
2. Biointerfaces Institute, University of Michigan, Ann Arbor, MI, USA 8
3. Electrical Engineering and Computer Science, University of Michigan, Ann Arbor, MI, USA 9
4. Flatiron Institute, Simons Foundation, New York City, NY, USA 10
5. Center for Nanomedicine, Institute for Basic Science (IBS) and Graduate Program of Nano 11 Biomedical Engineering (NanoBME), Advanced Science Institute, Yonsei University, Seoul, 12 Korea. 13 6. Health Science Center, University of Texas, Houston, TX, USA 14
7. Department of Neurosurgery, Rice University, Houston, TX, USA 15
*Corresponding author 16
Contact info: 17
Dr. Tim Bruns, [email protected] 18
19
.CC-BY-NC-ND 4.0 International licensemade available under a(which was not certified by peer review) is the author/funder, who has granted bioRxiv a license to display the preprint in perpetuity. It is
The copyright holder for this preprintthis version posted July 15, 2020. ; https://doi.org/10.1101/2020.07.14.199653doi: bioRxiv preprint

2
Abstract: 20
Dorsal root ganglia (DRG) are promising sites for recording sensory activity. Current 21
technologies for DRG recording are stiff and typically do not have sufficient site density for 22
high-density neural data techniques. We demonstrate neural recordings in feline sacral DRG 23
using a flexible polyimide microelectrode array with 30-40 µm site spacing. We delivered 24
arrays into DRG with ultrananocrystalline diamond shuttles designed for high stiffness with 25
small footprint. We recorded neural activity during sensory activation, including cutaneous 26
brushing and bladder filling. We successfully delivered arrays in 5/6 experiments and 27
recorded sensory activity in 4. Median signal amplitude was 55 μV and the maximum unique 28
units recorded at one array position was 260, with 157 driven by sensory or electrical 29
stimulation. We used specialized high-density neural signal analysis software to sort neural 30
signals and, in one experiment, track 8 signals as the array was retracted ~500 μm. This 31
study is the first demonstration of ultrathin, flexible, high-density electronics delivered into 32
DRG, with capabilities for recording and tracking sensory information that are a significant 33
improvement over conventional DRG interfaces. 34
.CC-BY-NC-ND 4.0 International licensemade available under a(which was not certified by peer review) is the author/funder, who has granted bioRxiv a license to display the preprint in perpetuity. It is
The copyright holder for this preprintthis version posted July 15, 2020. ; https://doi.org/10.1101/2020.07.14.199653doi: bioRxiv preprint

3
Dorsal root ganglia (DRG) are neural structures with tremendous potential as 35
bioelectrical interface sites, but current technologies available to access, map, and utilize 36
the dense sensory information they contain are limited. As peripheral nerves enter the 37
central nervous system, sensory neurons first coalesce at each spinal level into bilateral 38
dorsal spinal nerves. These nerves, or dorsal roots, each contain a single ganglion, or DRG, 39
which in turn contain the unmyelinated cell bodies of all sensory neurons entering that 40
spinal level. When conducting an action potential, these cell bodies generate a relatively 41
large extracellular potential detectable at single-unit fidelity by nearby recording electrodes 42
[1]. The sensory information that can be decoded from these signals can be used as 43
feedback to control, for example, neural stimulation for bladder control or walking [2]–[7]. 44
However, much remains unknown about the intrinsic anatomy of DRG. Previous 45
studies have presented some evidence of functional organization within individual DRG [8], 46
[9], but the overall structure-function relationship still remains unclear. In comparison, 47
functional organization relationships in the brain and spinal cord have been well-48
characterized, possibly allowing for the development of selectively targeted neural 49
interfaces for particular applications. Presently DRG can be targeted to choose a ganglion at 50
a particular spinal level, such as sacral DRG for bladder-related applications or lumbar DRG 51
for lower limb neuroprostheses. Within-DRG interfacing for selective access to individual 52
peripheral nerve pathways generally depends on the random nature of inserted 53
microelectrodes being located near axons of interest, however. Tools to study the 54
organization of DRG in vivo could lead to more selective targeting within these structures. 55
The current standard for in vivo recording of DRG neurons is the Utah array, a 56
commercially available, silicon-based, penetrating microelectrode array. Previous studies 57
have successfully demonstrated the capability of Utah arrays to record a variety of sensory 58
neurons in the DRG, including populations related to urinary tract function, joint flexion, and 59
skin sensation [2]–[7]. However, the mechanical mismatch between silicon and neural tissue 60
causes tissue damage and scarring in vivo [10]. Additionally, from a neural mapping 61
perspective, a Utah array shank is only capable of recording from a single depth at a given 62
location in the DRG, with a site spacing of no less than 400 µm. Floating microelectrode 63
arrays (FMAs), which allow for custom shank lengths and tip impedances, have been used 64
for DRG recording and stimulation with a minimum 250 µm site spacing [11]–[14], and also 65
have scarring around electrode shanks for chronic in vivo implants [15]. Both Utah arrays 66
.CC-BY-NC-ND 4.0 International licensemade available under a(which was not certified by peer review) is the author/funder, who has granted bioRxiv a license to display the preprint in perpetuity. It is
The copyright holder for this preprintthis version posted July 15, 2020. ; https://doi.org/10.1101/2020.07.14.199653doi: bioRxiv preprint
4
and FMAs are unable to track neurons that shift away from electrode sites, such as due to 67
electrode micromotion or scar tissue buildup. The smallest site spacing reported as used in 68
DRG was a stiff single-shank silicon probe with 50 µm electrode-site spacing (a “Michigan 69
probe”) [16]. While a Michigan probe may track vertical shifts in neuron position, a smaller 70
electrode site spacing would allow for over-sampling of neurons. Furthermore, the stiff 71
nature of these probes will also have a chronic tissue-scarring response as has been 72
reported in the brain [17]. An ideal mapping technology would have a reduced stiffness and 73
be able to record from multiple depths at multiple locations to maximize the number of 74
sampled neurons. 75
Based on these constraints, a flexible and high-density electrode array would be the 76
preferred interface for mapping within DRG. One way to achieve this is with planar 77
electrode arrays with a thin-film polymer substrate, first described for high-fidelity neural 78
recording in the brain by Rousche et al. (2001) [18]. We previously reported the use of a 79
high-density non-penetrating polyimide array for single-unit neural recording from the 80
surface of lumbosacral DRG [19], and studies have used other technologies to record from 81
the DRG surface, [20]–[22] but biophysical limitations suggest that no units would be 82
recorded below about 200 µm below the surface. Though anatomical analysis suggests that 83
the highest density of somata reside in this outer dorsal region of the DRG [23], [24], 84
selective mapping or microstimulation requires a technology interfacing with the interior of 85
DRG. 86
In this study, we demonstrate high-density recording and mapping applications in 87
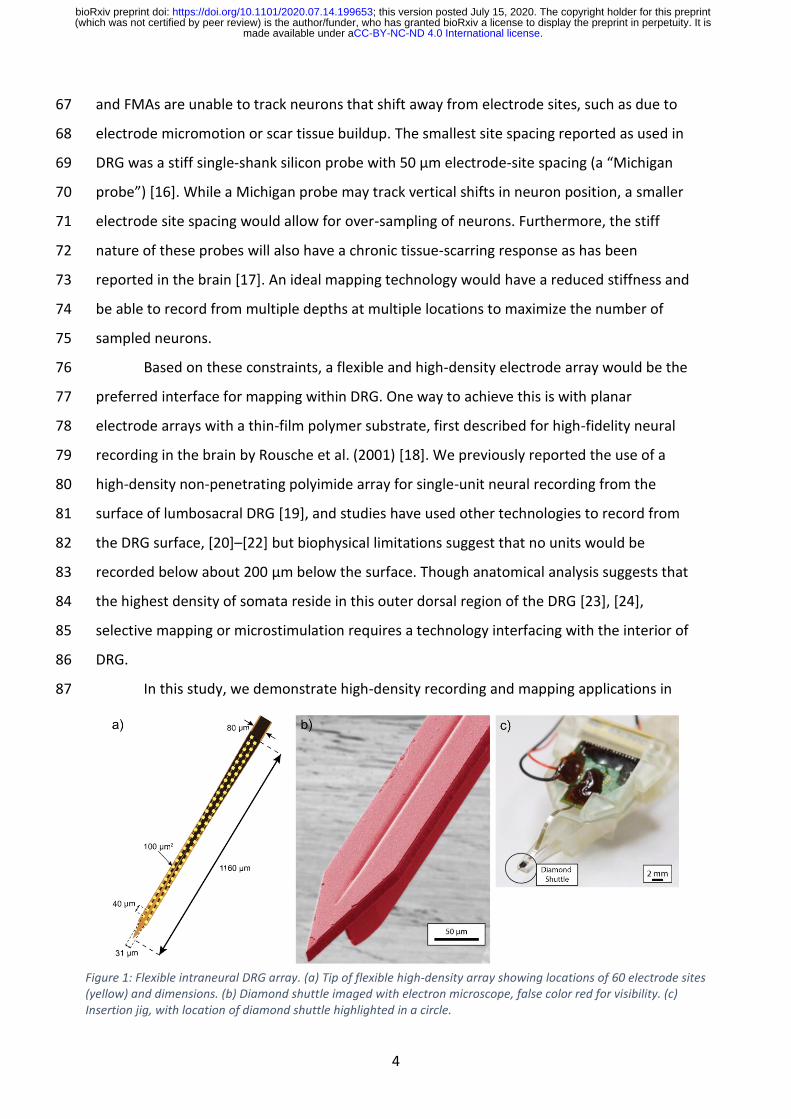
Figure 1: Flexible intraneural DRG array. (a) Tip of flexible high-density array showing locations of 60 electrode sites (yellow) and dimensions. (b) Diamond shuttle imaged with electron microscope, false color red for visibility. (c) Insertion jig, with location of diamond shuttle highlighted in a circle.
.CC-BY-NC-ND 4.0 International licensemade available under a(which was not certified by peer review) is the author/funder, who has granted bioRxiv a license to display the preprint in perpetuity. It is
The copyright holder for this preprintthis version posted July 15, 2020. ; https://doi.org/10.1101/2020.07.14.199653doi: bioRxiv preprint

5
sacral feline DRG using a flexible polymer array developed by Na et al. at the University of 88
Michigan [25]. The array was similar in design to the one reported in Sperry et al. (2017) 89
[19], but was delivered into the DRG with a novel structurally-stiffened diamond shuttle. 90
Sacral DRG were targeted because of their potential use as interface sites for bladder 91
neuroprosthetic devices, though the technology could be directly transferred to other spinal 92
levels or neural interface sites. We successfully delivered arrays in 5/6 experiments and 93
recorded high-density sensory neural activity in 4 of these experiments. We used this high-94
density information to efficiently sort the neural signals and to track individual neurons as 95
the array was moved through the DRG to simulate the extremes of chronic recording 96
conditions. 97
98
Results: 99
In this study we recorded high numbers of sensory neurons from feline sacral DRG, 100
identifying single-unit activity from a range of stimuli. The high-density array layout allowed 101
for oversampling of units across electrode sites for enhanced sorting capabilities and 102
tracking of units while the array was retracted. The thin-film polyimide array shown in 103
Figure 1(a) was introduced into DRG adhered to an ultrananocrystalline diamond shuttle 104
with a T-shaped profile, shown in Figure 1(b). A 3D-printed insertion jig, pictured in Figure 105
1(c) allowed the array, shuttle, and electronics to be mounted and delivered into DRG using 106
a linear insertion motor. The physical range of channels, physical range of units, number of 107
units, peak-to-peak amplitude, and signal-to-noise ratio (SNR) are reported in Table 1. 108
The median peak-to-peak amplitude of recorded units was typically on the order of 109
50-60 µV, though the maximum observed cluster center had an amplitude of 1334 µV (a 110
tonically activated unit in experiment 3 with 2.2 ± 0.48 Hz firing rate, modulated to ~3 Hz by 111
anus brushing). The minimum observed single-unit cluster center with sensory correlation 112
had a mean amplitude of 20.5 µV and SNR of 4.21 (bladder-pressure modulated unit in 113
experiment 2, correlation 0.64). This was an example of neural activity that might not have 114
been detected using traditional neural unit sorting on individual channels. Other multi-unit 115
activity was observed with smaller mean amplitude, but the unit shapes were poorly 116
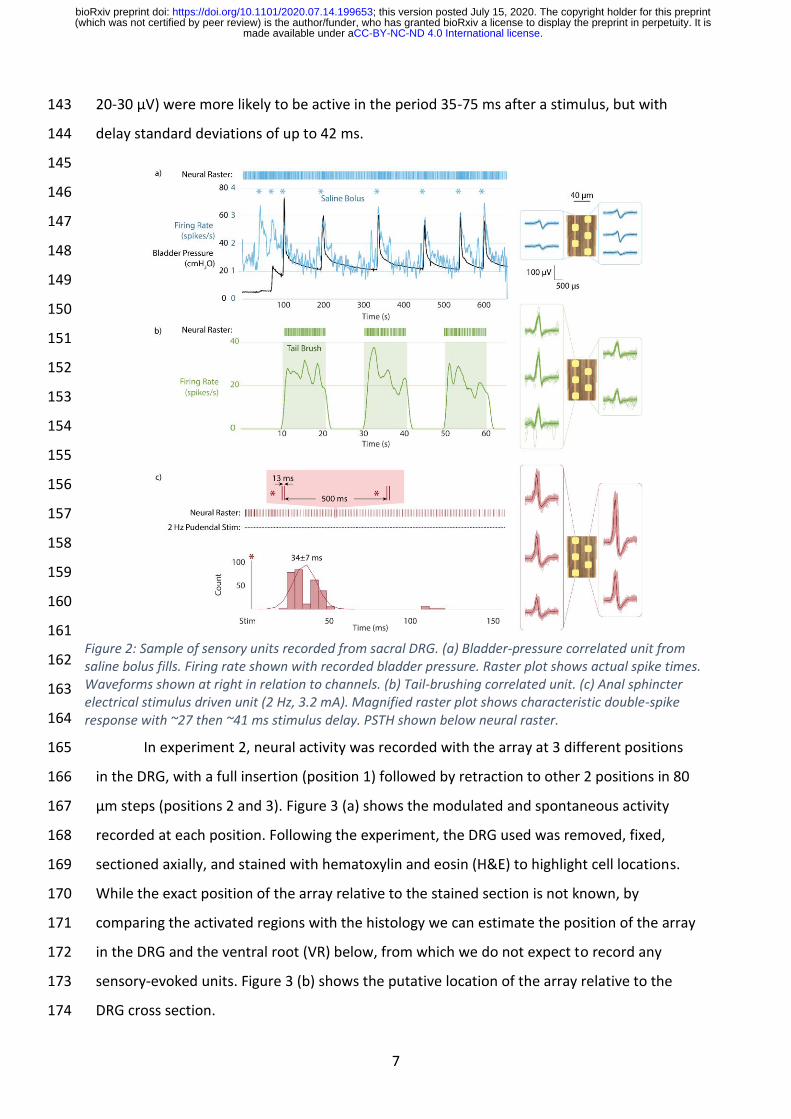
correlated. Bladder pressure related units were observed in 2 of the experiments. An 117
example bladder unit is shown in Figure 2 (a), with the waveforms at the five highest 118
amplitude channels shown on the right. Cutaneous brushing units were observed in all 4 119
.CC-BY-NC-ND 4.0 International licensemade available under a(which was not certified by peer review) is the author/funder, who has granted bioRxiv a license to display the preprint in perpetuity. It is
The copyright holder for this preprintthis version posted July 15, 2020. ; https://doi.org/10.1101/2020.07.14.199653doi: bioRxiv preprint
6
experiments with neural activity. Units were observed with correlation to scrotal brushing, 120
anal brushing, and brushing the dorsal base of the tail. An example unit related to tail 121
brushing is shown in Figure 2 (b). 122
123
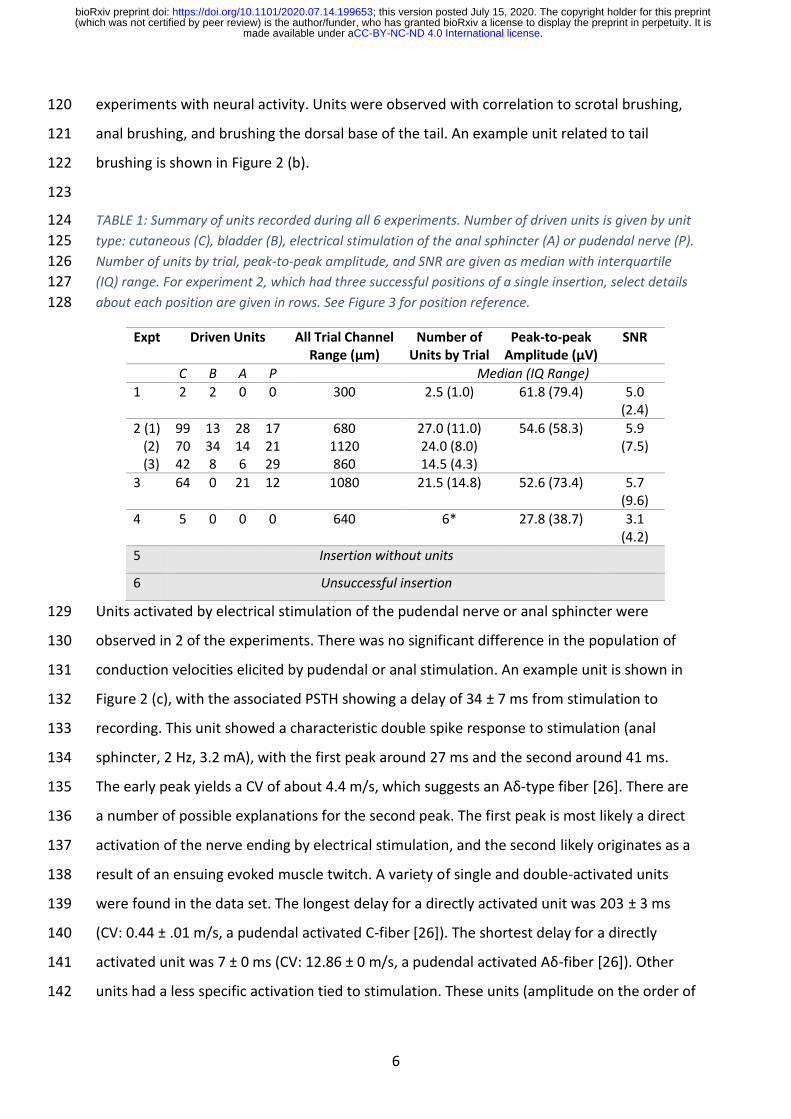
TABLE 1: Summary of units recorded during all 6 experiments. Number of driven units is given by unit 124
type: cutaneous (C), bladder (B), electrical stimulation of the anal sphincter (A) or pudendal nerve (P). 125
Number of units by trial, peak-to-peak amplitude, and SNR are given as median with interquartile 126
(IQ) range. For experiment 2, which had three successful positions of a single insertion, select details 127
about each position are given in rows. See Figure 3 for position reference. 128
Units activated by electrical stimulation of the pudendal nerve or anal sphincter were 129
observed in 2 of the experiments. There was no significant difference in the population of 130
conduction velocities elicited by pudendal or anal stimulation. An example unit is shown in 131
Figure 2 (c), with the associated PSTH showing a delay of 34 ± 7 ms from stimulation to 132
recording. This unit showed a characteristic double spike response to stimulation (anal 133
sphincter, 2 Hz, 3.2 mA), with the first peak around 27 ms and the second around 41 ms. 134
The early peak yields a CV of about 4.4 m/s, which suggests an Aδ-type fiber [26]. There are 135
a number of possible explanations for the second peak. The first peak is most likely a direct 136
activation of the nerve ending by electrical stimulation, and the second likely originates as a 137
result of an ensuing evoked muscle twitch. A variety of single and double-activated units 138
were found in the data set. The longest delay for a directly activated unit was 203 ± 3 ms 139
(CV: 0.44 ± .01 m/s, a pudendal activated C-fiber [26]). The shortest delay for a directly 140
activated unit was 7 ± 0 ms (CV: 12.86 ± 0 m/s, a pudendal activated Aδ-fiber [26]). Other 141
units had a less specific activation tied to stimulation. These units (amplitude on the order of 142
Expt Driven Units All Trial Channel Range (µm)
Number of Units by Trial
Peak-to-peak Amplitude (µV)
SNR
C B A P Median (IQ Range)
1 2 2 0 0 300 2.5 (1.0) 61.8 (79.4) 5.0 (2.4)
2 (1) (2) (3)
99 70 42
13 34 8
28 14 6
17 21 29
680 1120 860
27.0 (11.0) 24.0 (8.0) 14.5 (4.3)
54.6 (58.3) 5.9 (7.5)
3 64 0 21 12 1080 21.5 (14.8) 52.6 (73.4) 5.7 (9.6)
4 5 0 0 0 640 6* 27.8 (38.7) 3.1 (4.2)
5 Insertion without units
6 Unsuccessful insertion
.CC-BY-NC-ND 4.0 International licensemade available under a(which was not certified by peer review) is the author/funder, who has granted bioRxiv a license to display the preprint in perpetuity. It is
The copyright holder for this preprintthis version posted July 15, 2020. ; https://doi.org/10.1101/2020.07.14.199653doi: bioRxiv preprint
7
20-30 µV) were more likely to be active in the period 35-75 ms after a stimulus, but with 143
delay standard deviations of up to 42 ms. 144
145
146
147
148
149
150
151
152
153
154
155
156
157
158
159
160
161
162
163
164
In experiment 2, neural activity was recorded with the array at 3 different positions 165
in the DRG, with a full insertion (position 1) followed by retraction to other 2 positions in 80 166
µm steps (positions 2 and 3). Figure 3 (a) shows the modulated and spontaneous activity 167
recorded at each position. Following the experiment, the DRG used was removed, fixed, 168
sectioned axially, and stained with hematoxylin and eosin (H&E) to highlight cell locations. 169
While the exact position of the array relative to the stained section is not known, by 170
comparing the activated regions with the histology we can estimate the position of the array 171
in the DRG and the ventral root (VR) below, from which we do not expect to record any 172
sensory-evoked units. Figure 3 (b) shows the putative location of the array relative to the 173
DRG cross section. 174
Figure 2: Sample of sensory units recorded from sacral DRG. (a) Bladder-pressure correlated unit from saline bolus fills. Firing rate shown with recorded bladder pressure. Raster plot shows actual spike times. Waveforms shown at right in relation to channels. (b) Tail-brushing correlated unit. (c) Anal sphincter electrical stimulus driven unit (2 Hz, 3.2 mA). Magnified raster plot shows characteristic double-spike response with ~27 then ~41 ms stimulus delay. PSTH shown below neural raster.
.CC-BY-NC-ND 4.0 International licensemade available under a(which was not certified by peer review) is the author/funder, who has granted bioRxiv a license to display the preprint in perpetuity. It is
The copyright holder for this preprintthis version posted July 15, 2020. ; https://doi.org/10.1101/2020.07.14.199653doi: bioRxiv preprint

8
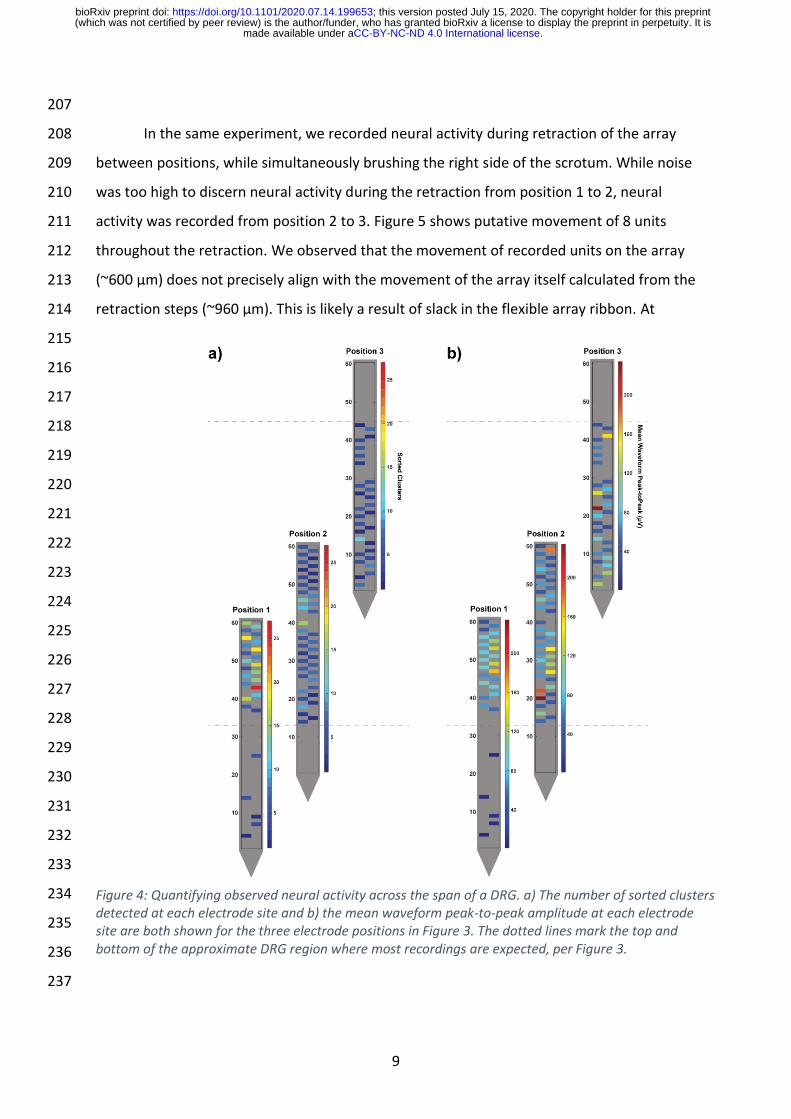
Figure 4 (a) shows the number of identified clusters that were detected at each 175
electrode site for the three primary locations in Experiment 2. For these array locations, 176
there appeared to be a greater count of clusters closer to the ventral part of the DRG. Other 177
array positions across our experiments did not have a clear trend. The average waveform 178
peak-to-peak amplitude for each electrode site across these array positions is shown in 179
Figure 4 (b). Visually, there was a greater number of mean waveforms above 100 µV peak-180
to-peak closer to the ventral part of the DRG in this data, aligning with the greater number 181
of clusters observed in these electrode placements. The inconsistent nature of per-182
electrode site neural activity within and across experiments prevented statistical analyses of 183
any trends. Across other experiment array placements, no clear signal amplitude 184
relationships were observed. 185
186
187
188
189
190
191
192
193
194
195
196
197
198
199
200
201
202
203
204
205
206
Figure 3: Summary of neural units recorded at different positions in DRG in one experiment. (a) Three different vertical positions of the array in one experiment showing the locations of recorded units (note: horizontal position is not relevant, points jittered for clarity). (b) Putative position of the array relative to histology of sacral DRG from same experiment. Lighter pink region at bottom is ventral root (VR), which does not contain sensory cell bodies for recording. Electrode sites with observed activity are highlighted in yellow, rest are gray. Horizontal position of array does not indicate horizontal movement.
.CC-BY-NC-ND 4.0 International licensemade available under a(which was not certified by peer review) is the author/funder, who has granted bioRxiv a license to display the preprint in perpetuity. It is
The copyright holder for this preprintthis version posted July 15, 2020. ; https://doi.org/10.1101/2020.07.14.199653doi: bioRxiv preprint
9
207
In the same experiment, we recorded neural activity during retraction of the array 208
between positions, while simultaneously brushing the right side of the scrotum. While noise 209
was too high to discern neural activity during the retraction from position 1 to 2, neural 210
activity was recorded from position 2 to 3. Figure 5 shows putative movement of 8 units 211
throughout the retraction. We observed that the movement of recorded units on the array 212
(~600 µm) does not precisely align with the movement of the array itself calculated from the 213
retraction steps (~960 µm). This is likely a result of slack in the flexible array ribbon. At 214
215
216
217
218
219
220
221
222
223
224
225
226
227
228
229
230
231
232
233
234
235
236
237
Figure 4: Quantifying observed neural activity across the span of a DRG. a) The number of sorted clusters detected at each electrode site and b) the mean waveform peak-to-peak amplitude at each electrode site are both shown for the three electrode positions in Figure 3. The dotted lines mark the top and bottom of the approximate DRG region where most recordings are expected, per Figure 3.
.CC-BY-NC-ND 4.0 International licensemade available under a(which was not certified by peer review) is the author/funder, who has granted bioRxiv a license to display the preprint in perpetuity. It is
The copyright holder for this preprintthis version posted July 15, 2020. ; https://doi.org/10.1101/2020.07.14.199653doi: bioRxiv preprint

10
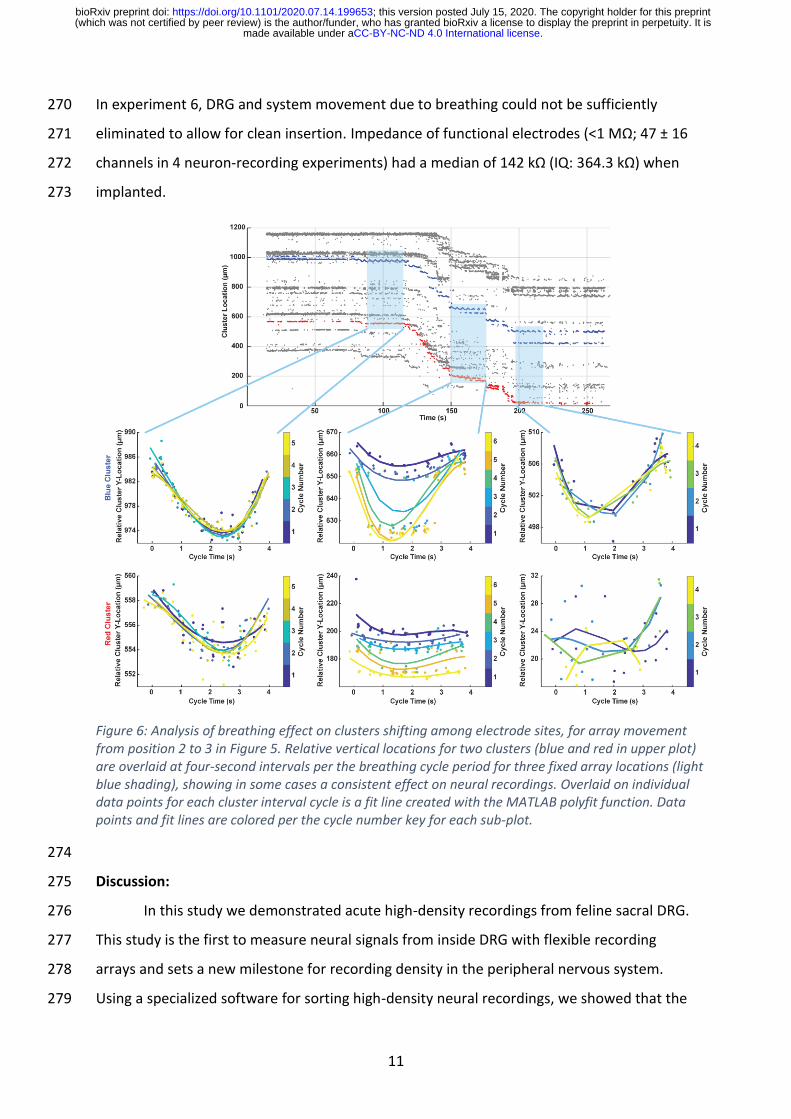
certain array positions we observed that clusters would shift among electrode sites in a 238
periodic manner, covering a distance on the array of 10-20 µm. This effect is investigated in 239
Figure 6, for the experimental recording session when the array was retracted in steps 240
(Figure 5). Upon closer inspection we determined that the periodic shifting of the recordings 241
generally cycled at a rate which matched the respiration interval (15 breaths per minute = 1 242
cycle every 4 seconds). For the blue cluster after 150 s and after 200 s in this sequence, 243
there were non-functioning electrode sites within the vertical span that the cluster covered. 244
This led to gaps within the plotting of cluster locations over time shown within Figure 6. As 245
shown in Table 1, we attempted insertion of arrays in 6 different feline experiments. In 246
experiment 6, successful insertion of the array was not achieved. The PEG adhesive used to 247
temporarily adhere the array to the shuttle dissolves quickly. The region around the DRG 248
often had fluid which regularly shifted with breathing. In the first experiment, touching the 249
array to fluid prior to insertion could not be avoided, and the array would not stay adhered 250
for insertion in 2 of 3 insertion attempts. As the temporary adhesion of the array to the 251
shuttle was only briefly successful in experiment 1 and our primary goal in these 252
experiments was to examine DRG mapping capabilities with the array, we subsequently 253
moved to using cyanoacrylate to bond the array to the shuttle for insertion. In experiment 5, 254
while insertion of the array was achieved, no neural activity was observed. 255
256
257
258
259
260
261
262
263
264
265
266
267
268
269
Figure 5: Units tracked across array during withdrawal from position 2 to position 3 (see Figure 3 and inset). As array is withdrawn from DRG, units move relative to the array (toward the tip). Eight units are shown, with movement of approximately 500-600 μm. Waveforms of several of these units are shown at position 2 (left) and position 3 (right) to show similarity of shape.
.CC-BY-NC-ND 4.0 International licensemade available under a(which was not certified by peer review) is the author/funder, who has granted bioRxiv a license to display the preprint in perpetuity. It is
The copyright holder for this preprintthis version posted July 15, 2020. ; https://doi.org/10.1101/2020.07.14.199653doi: bioRxiv preprint
11
In experiment 6, DRG and system movement due to breathing could not be sufficiently 270
eliminated to allow for clean insertion. Impedance of functional electrodes (<1 MΩ; 47 ± 16 271
channels in 4 neuron-recording experiments) had a median of 142 kΩ (IQ: 364.3 kΩ) when 272
implanted. 273
274
Discussion: 275
In this study we demonstrated acute high-density recordings from feline sacral DRG. 276
This study is the first to measure neural signals from inside DRG with flexible recording 277
arrays and sets a new milestone for recording density in the peripheral nervous system. 278
Using a specialized software for sorting high-density neural recordings, we showed that the 279
Figure 6: Analysis of breathing effect on clusters shifting among electrode sites, for array movement from position 2 to 3 in Figure 5. Relative vertical locations for two clusters (blue and red in upper plot) are overlaid at four-second intervals per the breathing cycle period for three fixed array locations (light blue shading), showing in some cases a consistent effect on neural recordings. Overlaid on individual data points for each cluster interval cycle is a fit line created with the MATLAB polyfit function. Data points and fit lines are colored per the cycle number key for each sub-plot.
.CC-BY-NC-ND 4.0 International licensemade available under a(which was not certified by peer review) is the author/funder, who has granted bioRxiv a license to display the preprint in perpetuity. It is
The copyright holder for this preprintthis version posted July 15, 2020. ; https://doi.org/10.1101/2020.07.14.199653doi: bioRxiv preprint

12
array was capable of recording neural signals related to bladder pressure and cutaneous 280
brushing in the sacral dermatome, as well as neurons which fire in response to electrical 281
stimulation of the pudendal nerve or anal sphincter. We recorded neural units with peak 282
amplitudes ranging from 20 µV to 1334 µV. Also, we were able to track neural units while 283
the array was physically moved, by using the specialized software that took advantage of 284
the closely-spaced electrode sites. This work shows the potential for high-fidelity interfaces 285
with DRG that can yield new mapping information while being unaffected by relative 286
changes in neuron vertical positions with respect to the array. 287
A variety of other high-density or special-geometry microelectrodes have been 288
developed for use in the brain [27]. Our work here is an extension of those studies to DRG, 289
examining an over-sampling of local signals to obtain a greater resolution of underlying 290
neural activity. With our high-density probe, we showed that recordings of single units could 291
be achieved on multiple sites for a variety of afferents (Figure 2) and tracked using 292
specialized software as the array moved over ~1 mm (Figure 5). Units which appeared only 293
on a single channel here would have only a ~15% chance of being recorded with a 400 µm 294
pitch Utah array. One recent technology for high-density recording in the brain is the 295
Neuropixels probe, originally reported by Jun et al. (2017) [28]. This is a stiff silicon 296
electrode array with 960 sites spaced at 20 µm. The array has been demonstrated for high-297
density single-unit recording in the brains of both head-fixed and chronic freely-behaving 298
mice [28], [29]. While the challenges of implanting, fixing, and recording in DRG are very 299
different from brain, the data processing goals and requirements can be very similar. In fact, 300
the same software suite utilized in our study was also utilized in Jun et al. for faster-than-301
real-time processing on their very high channel count probes [28]. 302
This study is the also first demonstration of high-density recording at this scale in 303
DRG (40 µm site spacing), and one of very few in the peripheral neural system. Previously, 304
the highest density recordings inside DRG used Utah arrays with site spacing of 400 µm [6], 305
[10], [30], [31], except for a single study with 50 µm-spaced electrodes and no report of unit 306
oversampling [16]. While the types of units recorded from sacral DRG in some of these 307
studies were similar (cutaneous, bladder-related, pudendal-stimulation driven), there was 308
no evidence of unit oversampling on neighboring sites. Higher density recordings have been 309
made from the surface of DRG, down to 25 µm electrode site pitch, [19]–[22], but despite 310
the potential advantages of non-penetrating arrays these were fundamentally limited to 311
.CC-BY-NC-ND 4.0 International licensemade available under a(which was not certified by peer review) is the author/funder, who has granted bioRxiv a license to display the preprint in perpetuity. It is
The copyright holder for this preprintthis version posted July 15, 2020. ; https://doi.org/10.1101/2020.07.14.199653doi: bioRxiv preprint
13
recording single-unit activity from the shallowest ~150 µm of the DRG [19]. Slightly higher-312
density recordings have been reported in the peripheral nervous system. For example, 200 313
µm pitch Utah arrays have been used to record from the sciatic nerve of rats and the 314
pudendal nerve of cats [32], [33]. Transverse intrafascicular multichannel electrodes (TIME), 315
which penetrate across the nerve axis and could hypothetically be used in DRG, have 316
achieved peripheral nerve recordings with sites spaced at ~230 µm [34]. The recordings 317
achieved in our study therefore set a new milestone for recording density in DRG and the 318
peripheral nervous system. 319
This study, in conjunction with a report focused on the insertion shuttle technology 320
[25], is the first demonstration of flexible bioelectronics delivered into DRG for neural 321
interfacing. Even in an acute experiment, this approach has potential benefits over the 322
standard Utah array, in potentially reducing bleeding or damage from impact of the 323
pneumatic insertion required for Utah array implant [35]–[37]. In chronic experiments, the 324
mechanical mismatch between stiff materials and soft tissue is expected to result in tissue 325
encapsulation of the shank tip, killing or pushing away neurons in the immediate 40-150 µm 326
vicinity [36], [38], [39]. Our chosen delivery method, the small but stiff diamond shuttle with 327
T-shaped profile, was selected based on the unique challenges of delivering a flexible 328
electrode into DRG through the epineurium. In brain implants, flexible probes can utilize less 329
stiff shuttles because the tough dura mater is typically removed in part prior to insertion for 330
animal models larger than a mouse, exposing the significantly softer parenchyma below 331
[40]. In DRG, however, the tough layer of epineurium cannot be easily removed without 332
damage to the underlying neural tissue. Our UNCD shuttle, with its stiffened T-profile, 333
addresses the need for high stiffness this while maintaining a minimal footprint that reduces 334
damage to underlying tissue and blood vessels [25]. 335
The primary analysis suite used in this study, Ironclust, is an open-source MATLAB 336
package specifically designed to take advantage of neural unit oversampling to increase the 337
speed and accuracy of spike sorting [41], [42]. While no specific comparison between 338
manual spike sorting was made in this study, a few general observations can be made from 339
the authors’ prior experience with commercial spike sorting software. By considering units 340
identified on clusters of channels, the software saved the effort of separating the same unit 341
on several channels, which was a large time saving. It also mostly eliminated the danger of 342
yield overestimation. One major benefit for those comfortable with coding (the suite is 343
.CC-BY-NC-ND 4.0 International licensemade available under a(which was not certified by peer review) is the author/funder, who has granted bioRxiv a license to display the preprint in perpetuity. It is
The copyright holder for this preprintthis version posted July 15, 2020. ; https://doi.org/10.1101/2020.07.14.199653doi: bioRxiv preprint

14
available in a variety of code languages) was the ability to add features and analysis 344
platforms as needed for a particular study. For example, because of this study’s focus on 345
unit drift, we added a platform to split units not only in principal component space but also 346
based on spatial center. The open-source nature of the project meant that we were able to 347
integrate useful features into the publicly available package which are now available to 348
other researchers. 349
There was not a consistent clear trend of high cluster count or high signal amplitude 350
near the DRG edge across experiments. Figure 5 suggests a possible increase in detected 351
large-amplitude signals towards the ventral aspect of the DRG within that experiment. Prior 352
work by our group has shown that cell bodies are packed around the DRG perimeter [23], 353
[24], which may yield regions with larger signal amplitude recordings. In our experiments 354
here we may not have been activating all neurons within a region. Additionally, some 355
electrode sites may have been close to active axon nodes, which would cause a lower 356
number of individual clusters to be observed. We were not able to estimate source sizes 357
based on the span of array sites that a cluster appeared on, as our recording array was fixed 358
in a two-dimensions and prevented source localization that we accomplished previously 359
with a flexible array on the curved DRG surface [19]. A better understanding of the types of 360
extracellular waveforms that can be recorded near DRG cell bodies, stem axons, and 361
peripheral axons, through computational modeling, may give more insight into the types of 362
neural elements detected in our recordings. 363
Loss of signal for chronic intraneural experiments is a common problem [10], [36]. 364
We have observed signal loss or signals reappearing over time with single-site electrode 365
shanks chronically implanted in DRG [10]. This may be due to micromotion of the array, scar 366
tissue development, and/or changing of tissue encapsulation over time. The novel array 367
used in this study could mitigate that effect given its small dimensions and flexibility but 368
needs further evidence. We tracked clusters as the electrode was intentionally pulled 369
rostrally 100s of microns (Figure 5). Furthermore, the high density of our array and the 370
IronClust algorithm allowed for clusters to continually be tracked during small changes in 371
electrode site location. In our case, the relative micromotion of the DRG with respect to the 372
array due to breathing led to visible shifts in cluster locations that were easily tracked across 373
the array (Figure 6). We expect that our combination of a high-density flexible interface with 374
.CC-BY-NC-ND 4.0 International licensemade available under a(which was not certified by peer review) is the author/funder, who has granted bioRxiv a license to display the preprint in perpetuity. It is
The copyright holder for this preprintthis version posted July 15, 2020. ; https://doi.org/10.1101/2020.07.14.199653doi: bioRxiv preprint

15
the use of the advanced sorting algorithm for unit tracking will allow for a greater long-term 375
signal yield during chronic in vivo studies. 376
This study, while a successful demonstration of high-density flexible penetrating 377
arrays in DRG, also highlighted some important challenges for future studies, especially any 378
that would proceed to chronic implant and recording. The deployment system was designed 379
to temporarily adhere the array to the shuttle with a dissolvable PEG adhesive during 380
insertion followed by removal of the intact shuttle immediately following array release. 381
Supplemental Video 1 shows a successful deployment of the array in vivo to the right S2 382
DRG in experiment 2. In practice, however, fluid in the surgical cavity could wet the 383
adhesive and cause the array to peel away from the shuttle before insertion. While the 384
system achieved successful delivery in experiment 1, all successful deliveries in following 385
experiments were achieved with permanent cyanoacrylate adhesive to avoid inadvertent 386
early wetting. While we [25] and others [43] demonstrated PEG in rodents, a shuttle 387
inserted through the electrode tip similar to Luan [44] may be more reliable in feline 388
experiments. A future design could use an array with a small loop at the tip to go over the 389
shuttle, which would drive in the array even if the adhesive started to dissolve. The stylet 390
approach has a long history and recently demonstrated on a microscale in the so-called 391
“neural sewing machine” [45]. 392
Another issue with our approach was that, due to large breathing motions following 393
insertion, we not able to successfully withdraw the shuttle without breakage prior to the 394
use of cyanoacrylate. These motions are visible in Supplementary Video 1. We attempted to 395
address this by briefly suspending the breathing cycle during array deployment, but there 396
was insufficient time for the array to fully release from the shuttle before breathing needed 397
to resume. Since the lack of stiff materials in the DRG is one of the primary advantages of 398
our flexible electrodes for chronic use, this issue would need to be solved prior to a long-399
term implant. One possibility would be to design the shuttle with a controlled breakage 400
point to allow for removal with forceps after the array is securely in place. The natural 401
breakage point of the current shuttle was flush with the DRG surface, making removal 402
difficult. Alternatively, larger “barbs” fabricated as part of the array [46] could hold the array 403
in place during shuttle withdrawal, allowing the shuttle to be removed more quickly. 404
Assuming these key issues can be addressed, a future chronic study with parallel 405
implant of Utah arrays would be needed to demonstrate the comparative advantage of this 406
.CC-BY-NC-ND 4.0 International licensemade available under a(which was not certified by peer review) is the author/funder, who has granted bioRxiv a license to display the preprint in perpetuity. It is
The copyright holder for this preprintthis version posted July 15, 2020. ; https://doi.org/10.1101/2020.07.14.199653doi: bioRxiv preprint

16
technology in both recording longevity and biological response as determined through 407
histological analyses. Continuous neural recording during awake behavior would 408
demonstrate whether the unit tracking demonstrated in this study during array movement 409
would be feasible long-term. This would be a useful feature in developing stable neural 410
decoding for closed-loop neuroprosthesis research. A previous chronic feline study with 411
Utah arrays demonstrated tracking of a bladder DRG neuron over the course of 23 days [10], 412
and computational algorithms can decode bladder pressure from neural firing of one or 413
several units [2], [3], but the long-term stability of these algorithms depends on the ability 414
to monitor multiple bladder neurons over a long period. 415
While only single arrays were implanted in this study, broader mapping of DRG 416
afferents would require multiple arrays implanted in parallel. This could mean a single 417
device with multiple shanks and/or multiple devices implanted next to each other. Further, 418
this penetrating array could be used in conjunction with previously demonstrated surface 419
arrays [19]. To simplify the implant process, it is possible to envision a combined 420
penetrating-surface interface that would unfold onto the DRG surface during insertion. A 421
similar approach has been previously demonstrated for chronic brain recording in a rat 422
model [39]. This approach could provide an anchor for the surface array, a challenge 423
discussed in our previous study [19]. 424
Outlook 425
This study was the first to demonstrate the use of flexible microelectrode arrays to 426
record from within DRG, and to our knowledge the highest-density electrode array reported 427
for use in the DRG or peripheral nervous system. In this study, we recorded a variety of 428
cutaneous, bladder, and electrical-stimulus-driven neural signals from feline sacral DRG in 429
acute anesthetized experiments. We used the high-density data along with specialized 430
open-source software to detect individual neurons recorded on clusters of channels, and to 431
track the “movement” of neural units as an array was slowly withdrawn from the DRG. In 432
the future, we will use these arrays to monitor neurons long-term in awake behavioral 433
studies as we continue to drive the development of neuroprosthetic systems for individuals 434
with neural injury and disease. 435
Methods 436
The primary purpose of this study was to explore the recording and mapping 437
capabilities of a high-density microelectrode array in feline sacral DRG. Arrays were 438
.CC-BY-NC-ND 4.0 International licensemade available under a(which was not certified by peer review) is the author/funder, who has granted bioRxiv a license to display the preprint in perpetuity. It is
The copyright holder for this preprintthis version posted July 15, 2020. ; https://doi.org/10.1101/2020.07.14.199653doi: bioRxiv preprint
17
fabricated in the Lurie Nanofabrication facility utilizing the same process described for the 439
ganglionic surface electrode arrays in Sperry et al. 2018 [19]. In brief, platinum electrode 440
sites were patterned and connected with gold/platinum traces sandwiched in the middle of 441
a 4.5 µm thick flexible polyimide substrate. In this study, each of the 60 sites were 442
approximately square, with an area of 400 µm2, and arranged in 2 off-set columns. The pitch 443
between electrodes was 40 µm. The active portion of the array was 1160 µm long and 444
tapered from 80 µm wide to 55-µm wide for most of the length of the shank. Figure 1(a) 445
shows a schematic of the array. 446
Each array was bonded to a custom printed circuit board (PCB) for interfacing with 447
the neural recording system. To reduce site impedance prior to recording, array channels 448
were coated with poly(3,4-ethylenedioxythiophene) polystyrene sulfonate (PEDOT:pSS) as 449
described in Patel et al., with the current adjusted for the electrode site area [47]. To verify 450
all deposition and coating steps, impedance measurements were taken with a PGSTAT12 451
Autolab (EcoChemie, Utrecht, Netherlands), controlled by vendor supplied NOVA software. 452
Measurements were obtained by applying a 1 kHz 10 mVrms signal. Custom MATLAB 453
(Mathworks, Natick, MA) scripts were used to determine frequency-specific impedance 454
values. The PCB board was placed in a custom 3D-printed jacket and mounted to a 3D-455
printed insertion jig (Form2 3D printer, Formlabs, Somerville, MA) (Figure 1(c)). 456
For delivery into DRG, the flexible array was temporarily adhered to an 457
ultrananocrystalline diamond (UNCD) shuttle with water-soluble polyethylene glycol (PEG; 458
12,000 MW) or ultraviolet-cured cyanoacrylate glue. The shuttle was fabricated with a 459
stiffened T-profile by UNCD deposition over a trench which was etched away to form the 460
final shape (fabrication details and characterization in Na et al. 2020) [25]. The shuttle was 461
65 µm wide, with a planar 11 µm thickness. The T-profile extended 27.5 µm from the back 462
with a width diminishing from 16 µm to 2 µm. This material and profile increased the 463
buckling load of the shuttle by a factor of 13 as compared to a planar silicon shuttle without 464
the T-stiffened profile [25]. This design allowed for array insertion without removal of the 465
tough epineural layer surrounding the DRG, but with presumably less damage to the 466
surrounding tissue. A colorized close-up of the shuttle is shown in Figure 1 (b). The shuttle 467
was glued to the end of the insertion jig prior to adhering the array. The combined array, 468
PCB, jacket, shuttle, and insertion jig will be collectively referred to as the insertion 469
assembly. Figure 1 (c) shows the insertion jig close-up. 470
.CC-BY-NC-ND 4.0 International licensemade available under a(which was not certified by peer review) is the author/funder, who has granted bioRxiv a license to display the preprint in perpetuity. It is
The copyright holder for this preprintthis version posted July 15, 2020. ; https://doi.org/10.1101/2020.07.14.199653doi: bioRxiv preprint

18
In Vivo Deployment and Neural Recording 471
Neural recordings were performed in the DRG of intact, domestic, short-haired adult 472
cats (Liberty Research, Inc., Waverly, NY). All procedures were approved by the University of 473
Michigan Institutional Animal Care and Use Committee, in accordance with the National 474
Institute of Health's guidelines for the care and use of laboratory animals. Animals were 475
free-range housed prior to use with 0–3 other male cats in a 413 ft2 room with controlled 476
temperature (19 °C–21 °C) and relative humidity (35%–60%), food and water available ad 477
lib, a 12 h light/dark cycle, and enrichment via toys and daily staff interaction. 478
Initial anesthesia was induced with an intramuscular dose of ketamine (6.6 mg kg−1)-479
butorphanol (0.66 mg kg−1)-dexmedetomidine (0.033 mg kg−1) intramuscular (IM) dose. 480
Animals were intubated, then maintained on isoflurane anesthesia (2%–4%) during the 481
remainder of the procedure. Respiratory rate, heart rate, end-tidal CO2, O2 perfusion, 482
temperature, and intra-arterial blood pressure were monitored continuously using a 483
Surgivet vitals monitor (Smiths Medical, Dublin, OH). Intravenous (IV) lines were inserted 484
into one or both cephalic veins for infusion of drugs and intravenous fluids (1:1 ratio of 485
lactated Ringers solution and 5% dextrose, 5–30 ml kg-1 h-1). 486
A laminectomy (removal of dorsal spinal column bone) was performed to expose the 487
lumbosacral spinal cord and sacral DRG (typically S1–S2). Following laminectomy, the cat’s 488
pelvis was suspended from a custom support frame (80/20 Inc., Columbia City, IN) with 489
stainless steel wire and bilateral bone screws in the superior posterior pelvic crest to 490
minimize spinal motion during breathing and bladder filling. A separate stabilizing frame 491
consisting of optomechanical components (Thor Lab, Newton, New Jersey) and custom 3D-492
printed components was assembled around the animal to support a 3-axis 493
micromanipulator (502600, World Precision Instruments, Sarasota, FL) and linear actuator 494
(M-235.5DD, Physik Instrumente, Karlsruhe, Germany). The insertion assembly was 495
mounted to the end of the linear actuator, aimed at either the S1 or S2 DRG, and inserted at 496
2 mm s-1. Insertion was monitored with a USB microscope camera. 497
The reference wire (and ground wire, when not shorted to the reference on the PCB) 498
was connected to a 12-gauge stainless steel needle inserted under the skin on the flank. 499
Neural activity was recorded at 30 kHz using the Ripple Grapevine Neural Interface 500
Processor and associated Trellis software (Ripple Neuro, Salt Lake City, UT). We 501
simultaneously monitored bladder pressure at 1 kHz through the urethral catheter with a 502
.CC-BY-NC-ND 4.0 International licensemade available under a(which was not certified by peer review) is the author/funder, who has granted bioRxiv a license to display the preprint in perpetuity. It is
The copyright holder for this preprintthis version posted July 15, 2020. ; https://doi.org/10.1101/2020.07.14.199653doi: bioRxiv preprint

19
pressure transducer (DPT-100, Utah Medical Products, Midvale, UT) and analog amplifier 503
(SYS-TBM4M, World Precision Instruments, Sarasota, FL). 504
A variety of sensory stimuli were applied to activate sacral afferent neurons, to map 505
the location of different neuronal types along the array and to demonstrate the array’s 506
potential usefulness for neural prosthesis research. To activate skin afferents, the skin was 507
brushed using a cotton applicator in the sacral dermatome associated with the DRG of 508
interest, including regions of the tail, the anus, the perineum, the external meatus of the 509
penis, and the scrotum [30], [48]. These trials typically involved brushing in bouts of 10 s 510
with 10 s rest periods between bouts. Visceral afferents of the urethra were activated by 511
sliding a catheter back and forth in the orifice. To activate bladder afferents, room-512
temperature saline was infused through the urethral catheter in sequential boluses of 10 mL 513
each. 514
For measurements of nerve conduction velocity (CV), electrical stimulation was 515
applied (biphasic, 1:2 charge balanced, cathode-leading, 200 µs pulse-width) at low levels 516
(15–300 µA) to the ipsilateral pudendal nerve via an implanted bipolar nerve cuff (2.0 mm 517
inner diameter Silastic 508-009 tubing; 0.4 mm stainless steel Cooner wire contacts [10]). As 518
an alternative stimulation site, a pair of fine-wire electrodes (stainless steel, 50 µm 519
diameter, Model EMT-2-30, Microprobes, Gaithersburg, MD) was inserted near the anal 520
sphincter and stimulated with a similar waveform at a higher amplitude to generate muscle 521
twitch (0.3-4mA). 522
At the end of each experiment, euthanasia was achieved with an intravenous dose of 523
sodium pentobarbital (390 mg ml−1) under deep isoflurane anesthesia, followed by bilateral 524
pneumothorax. To add context to recordings, DRG from some experiments were removed 525
and fixed in formalin, processed into parafinn blocks, stained with hematoxylin and eosion, 526
and imaged with an inverted microscope (IX83, Olympus, Shinjuku, Tokyo City, Tokyo, 527
Japan), with the brightfield setting at 10 times magnification and Nikon (Minato, Tokyo City, 528
Tokyo, Japan) Element BR 3.2 Software. 529
Data Analysis 530
In order to efficiently handle the large data sets generated by these recordings, we 531
chose to use the open source IronClust suite for MATLAB, which is specifically optimized for 532
high-density probes that oversample individual neurons [41]. Our spike-sorting workflow 533
using IronClust (developed by James Jun and teams at the Janelia Research Campus and the 534
.CC-BY-NC-ND 4.0 International licensemade available under a(which was not certified by peer review) is the author/funder, who has granted bioRxiv a license to display the preprint in perpetuity. It is
The copyright holder for this preprintthis version posted July 15, 2020. ; https://doi.org/10.1101/2020.07.14.199653doi: bioRxiv preprint

20
Flatiron Institute) consists of 1) preprocessing, 2) spike detection & feature extraction, 3) 535
density-graph clustering, and 4) manual clustering. We chose IronClust for its real-time 536
processing speed with a GPU and its ability to accurately handle the potential probe drift on 537
flexible probes. Each recorded channel was band-pass filtered (300-6000 Hz) and the 538
narrow-band noise peaks were automatically removed in the frequency domain if they 539
exceeded 10 MAD (median absolute deviation) above the median trend curve. 540
Subsequently, the common-mode noise was removed by subtracting each channel by the 541
average across all channels. The remaining motion artifact primarily due to analog-to-digital 542
conversion saturation was rejected by computing the standard deviation of the filtered 543
signals across all channels in each time bin (5 ms duration), and the spike detection was 544
disabled in the time bins exceeding a MAD threshold of 20. The spikes were detected at 545
their negative peaks exceeding 5 MAD threshold [49], and duplicate spikes from the same 546
and neighboring channels were removed if larger peaks were detected within their 547
spatiotemporal neighborhood (50 µm, 0.3 ms). Spike waveforms (1 ms width) surrounding 548
each peak event are extracted from a fixed number of adjacent channels (80 µm). For each 549
spike, we also extracted spike waveforms centered at its secondary peak channel to account 550
for the random jitters of the peak channel due to recording noise and probe drift. Two 551
principal component features were extracted from each channel using a common set of 552
principal vectors for all channels. 553
In order to handle the probe drift, time bins where the probe occupied similar 554
anatomical locations were grouped together based on the similarity of the 2D histogram of 555
the spike amplitudes and positions. Anatomical snapshots were computed at regular spike-556
count intervals such that each snapshot contains an equal number of spike events from all 557
channels (20 s average duration). For each snapshot, a 2D histogram representing the 558
anatomical features was computed by counting spikes based on their amplitude quantiles (8 559
bins) and center-of-mass positions on the probe. Each time bin was grouped with 14 other 560
time bins exhibiting high similarity scores to form a 300 s average duration. k-nearest 561
neighbor (kNN, k=30) distances (dknn) were computed between spikes whose peak appeared 562
in channel c and time bin s with the neighboring spikes whose peak or second peak 563
appeared in channel c and time bins that were anatomically grouped with s. 564
Density-graph clustering was performed based on the kNN [50], [51] by considering a 565
fixed number of local neighbors to achieve a linear scaling. For each spike j, the local density 566
.CC-BY-NC-ND 4.0 International licensemade available under a(which was not certified by peer review) is the author/funder, who has granted bioRxiv a license to display the preprint in perpetuity. It is
The copyright holder for this preprintthis version posted July 15, 2020. ; https://doi.org/10.1101/2020.07.14.199653doi: bioRxiv preprint

21
score was calculated (⍴j =1/dknn,j), and the distance separation score (𝛅j= dmin,j / dknn,j) was 567
calculated where dmin,j is the distance in the principal component feature space to the 568
nearest spike k having a greater density score (min(djk | ⍴k >⍴j )). Local density peak points 569
were identified based on a density separation criterion (𝛅>1) and the cluster memberships 570
were recursively assigned to the nearest points toward a decreasing density gradient. To 571
minimize false splitting errors due to drift or bursting, units exhibiting similar waveform 572
shapes were merged (Pearson correlation > 0.985). Finally, clusters were manually split, 573
merged, or deleted by using a set of multiple interactive views in the MATLAB-based GUI. 574
To understand the relationship between sensory inputs and neural activity, we 575
calculated the correlation of either bladder pressure or cutaneous brushing (coded as a 576
continuous binary on/off signal). We used a correlation threshold of >0.4 for bladder 577
pressure or >0.6 for cutaneous brushing to identify related units. In a small number of 578
bladder pressure trials, there was a clear visual relationship between the bladder pressure 579
and the firing rate which did not yield a high correlation, and these units were also included. 580
The signal to noise ratio (SNR) was defined as the unit peak-to-peak amplitude divided by 581
the root mean square voltage of the channel during the entire trial. 582
For trials with electrical stimulation, a post-stimulus time histogram (PSTH) was 583
generated for each detected unit. If a firing unit had stimulus-locked timing, we used a 584
normal distribution fitted to the PSTH to determine the mean and standard deviation of the 585
delay. To calculate conduction velocity (CV), we assumed a pudendal nerve to sacral DRG 586
length of 9 cm and an anal sphincter to sacral DRG length of 12 cm based on previous 587
measurements [10]. 588
References: 589
[1] Y. Aoyagi, R. B. Stein, A. Branner, K. G. Pearson, and R. A. Normann, “Capabilities of a 590
penetrating microelectrode array for recording single units in dorsal root ganglia of the cat,” 591
J. Neurosci. Methods, vol. 128, pp. 9–20, 2003. 592
[2] S. E. Ross, Z. Ouyang, S. Rajagopalan, and T. M. Bruns, “Evaluation of Decoding 593
Algorithms for Estimating Bladder Pressure from Dorsal Root Ganglia Neural 594
Recordings,” Ann. Biomed. Eng., vol. 46, no. 2, pp. 233–246, Feb. 2018. 595
[3] Z. Ouyang, Z. J. Sperry, N. D. Barrera, and T. M. Bruns, “Real-time Bladder Pressure 596
Estimation for Closed-loop Control in a Detrusor Overactivity Model,” IEEE Trans. 597
Neural Syst. Rehabil. Eng., vol. 27, no. 6, pp. 1209–1216, 2019. 598
.CC-BY-NC-ND 4.0 International licensemade available under a(which was not certified by peer review) is the author/funder, who has granted bioRxiv a license to display the preprint in perpetuity. It is
The copyright holder for this preprintthis version posted July 15, 2020. ; https://doi.org/10.1101/2020.07.14.199653doi: bioRxiv preprint

22
[4] R. B. Stein et al., “Coding of position by simultaneously recorded sensory neurones in 599
the cat dorsal root ganglion.,” J. Physiol., vol. 560, no. 3, pp. 883–896, 2004. 600
[5] B. J. Holinski, D. G. Everaert, V. K. Mushahwar, and R. B. Stein, “Real-time control of 601
walking using recordings from dorsal root ganglia.,” J. Neural Eng., vol. 10, no. 5, p. 602
056008, 2013. 603
[6] D. J. Weber, R. B. Stein, D. G. Everaert, and A. Prochazka, “Limb-state feedback from 604
ensembles of simultaneously recorded dorsal root ganglion neurons.,” J. Neural Eng., 605
vol. 4, no. 3, pp. S168–S180, 2007. 606
[7] J. Rigosa, D. J. Weber, A. Prochazka, R. B. Stein, and S. Micera, “Neuro-fuzzy decoding 607
of sensory information from ensembles of simultaneously recorded dorsal root 608
ganglion neurons for functional electrical stimulation applications,” J. Neural Eng., 609
vol. 8, no. 4, p. 046019, 2011. 610
[8] W. J. T. Wessels, H. K. P. Feirabend, and E. Marani, “Evidence for a rostrocaudal 611
organization in dorsal root ganglia during development as demonstrated by intra-612
uterine WGA-HRP injections into the hindlimb of rat fetuses,” Dev. Brain Res., vol. 54, 613
no. 2, pp. 273–281, 1990. 614
[9] W. J. T. Wessels, H. K. P. Feirabend, and E. Marani, “Somatotopic organization in the 615
sensory innervation of the rat hindlimb during development, using half dorsal root 616
ganglia as subsegmental units.,” Eur. J. Morphol., vol. 28, no. 2–4, pp. 394–403, 1990. 617
[10] A. Khurram et al., “Chronic monitoring of lower urinary tract activity via a sacral 618
dorsal root ganglia interface,” J. Neural Eng., vol. 14, no. 3, p. 036027, 2017. 619
[11] L. E. Fisher, C. A. Ayers, M. Ciollaro, V. Ventura, D. J. Weber, and R. A. Gaunt, “Chronic 620
recruitment of primary afferent neurons by microstimulation in the feline dorsal root 621
ganglia,” J. Neural Eng., vol. 11, no. 3, p. 036007, 2014. 622
[12] C. A. Ayers, L. E. Fisher, R. A. Gaunt, and D. J. Weber, “Microstimulation of the lumbar 623
DRG recruits primary afferent neurons in localized regions of lower limb,” J. 624
Neurophysiol., vol. 116, no. 1, pp. 51–60, 2016. 625
[13] A. C. Nanivadekar, C. A. Ayers, R. A. Gaunt, D. J. Weber, and L. E. Fisher, “Selectivity of 626
afferent microstimulation at the DRG using epineural and penetrating electrode 627
arrays,” J. Neural Eng., vol. 17, no. 1, 2020. 628
[14] K. W. King et al., “DRG microstimulation evokes postural responses in awake, 629
standing felines,” J. Neural Eng., vol. 17, no. 1, 2020. 630
.CC-BY-NC-ND 4.0 International licensemade available under a(which was not certified by peer review) is the author/funder, who has granted bioRxiv a license to display the preprint in perpetuity. It is
The copyright holder for this preprintthis version posted July 15, 2020. ; https://doi.org/10.1101/2020.07.14.199653doi: bioRxiv preprint

23
[15] C. L. Kolarcik et al., “Host tissue response to floating microelectrode arrays chronically 631
implanted in the feline spinal nerve,” J. Neural Eng., vol. 17, no. 4, p. 046012, Jul. 632
2020. 633
[16] A. E. Snellings, P. B. Yoo, and W. M. Grill, “Urethral flow-responsive afferents in the 634
cat sacral dorsal root ganglia.,” Neurosci. Lett., vol. 516, no. 1, pp. 34–38, 2012. 635
[17] G. C. McConnell, H. D. Rees, A. I. Levey, C. A. Gutekunst, R. E. Gross, and R. V. 636
Bellamkonda, “Implanted neural electrodes cause chronic, local inflammation that is 637
correlated with local neurodegeneration,” J. Neural Eng., vol. 6, no. 5, 2009. 638
[18] P. J. Rousche, D. S. Pellinen, D. P. Pivin, J. C. Williams, R. J. Vetter, and D. R. Kipke, 639
“Flexible polyimide-based intracortical electrode arrays with bioactive capability,” 640
IEEE Trans. Biomed. Eng., vol. 48, no. 3, pp. 361–371, 2001. 641
[19] Z. J. Sperry et al., “Flexible microelectrode array for interfacing with the surface of 642
neural ganglia,” J. Neural Eng., vol. 15, no. 3, p. 036027, 2018. 643
[20] R. A. Gaunt, T. M. Bruns, D. J. Crammond, N. D. Tomycz, J. J. Moossy, and D. J. Weber, 644
“Single- and multi-unit activity recorded from the surface of the dorsal root ganglia 645
with non-penetrating electrode arrays,” Proc. Annu. Int. Conf. IEEE Eng. Med. Biol. 646
Soc. EMBS, pp. 6713–6716, 2011. 647
[21] A. I. Kashkoush, R. A. Gaunt, L. E. Fisher, T. M. Bruns, and D. J. Weber, “Recording 648
single- and multi-unit neuronal action potentials from the surface of the dorsal root 649
ganglion,” Sci. Rep., vol. 9, no. 1, p. 2786, 2019. 650
[22] W.-C. Huang et al., “Ultracompliant Hydrogel-Based Neural Interfaces Fabricated by 651
Aqueous-Phase Microtransfer Printing,” Adv. Funct. Mater., p. 1801059, 2018. 652
[23] A. K. Ostrowski, Z. J. Sperry, G. Kulik, and T. M. Bruns, “Quantitative models of feline 653
lumbosacral dorsal root ganglia cell density,” Neurosci. Methods, vol. 290, pp. 116–654
124, 2017. 655
[24] Z. J. Sperry, R. D. Graham, N. Peck-Dimit, S. F. Lempka, and T. M. Bruns, “Spatial 656
models of cell distribution in human lumbar dorsal root ganglia,” J. Comp. Neurol., 657
vol. 528, pp. 1644–1659, 2020. 658
[25] K. Na et al., “Novel diamond shuttle to deliver flexible bioelectronics with reduced 659
tissue compression,” Microsystems Nanoeng., vol. 6 p. 37, 2020. 660
[26] E. P. Gardner and K. O. Johnson, “The Somatosensory System: Receptors and Central 661
Pathways,” in Principles of Neural Science, Fifth Edition, New York, NY: McGraw-Hill 662
.CC-BY-NC-ND 4.0 International licensemade available under a(which was not certified by peer review) is the author/funder, who has granted bioRxiv a license to display the preprint in perpetuity. It is
The copyright holder for this preprintthis version posted July 15, 2020. ; https://doi.org/10.1101/2020.07.14.199653doi: bioRxiv preprint

24
Education, 2014. 663
[27] J. P. Seymour, F. Wu, K. D. Wise, and E. Yoon, “State-of-the-art MEMS and 664
microsystem tools for brain research,” Microsystems Nanoeng., vol. 3, no. March 665
2016, pp. 1–16, 2017. 666
[28] J. J. Jun et al., “Fully integrated silicon probes for high-density recording of neural 667
activity,” Nature, vol. 551, no. 7679, pp. 232–236, 2017. 668
[29] A. Juavinett, G. Bekheet, and A. Churchland, “Chronically-implanted Neuropixels 669
probes enable high yield recordings in freely moving mice,” Elife, vol. 8, p. e47188, 670
2019. 671
[30] T. M. Bruns, R. A. Gaunt, and D. J. Weber, “Multielectrode array recordings of bladder 672
and perineal primary afferent activity from the sacral dorsal root ganglia,” J. Neural 673
Eng., vol. 8, no. 5, p. 056010, Oct. 2011. 674
[31] D. J. Weber, R. B. Stein, D. G. Everaert, and A. Prochazka, “Decoding sensory feedback 675
from firing rates of afferent ensembles recorded in cat dorsal root ganglia in normal 676
locomotion,” IEEE Trans. Neural Syst. Rehabil. Eng., vol. 14, no. 2, pp. 240–243, 2006. 677
[32] H. A. C. C. Wark et al., “A new high-density (25 electrodes/mm2) penetrating 678
microelectrode array for recording and stimulating sub-millimeter neuroanatomical 679
structures,” J. Neural Eng., vol. 10, no. 4, p. 045003, 2013. 680
[33] K. S. Mathews et al., “Acute monitoring of genitourinary function using intrafascicular 681
electrodes: selective pudendal nerve activity corresponding to bladder filling, bladder 682
fullness, and genital stimulation.,” Urology, vol. 84, no. 3, pp. 722–9, Sep. 2014. 683
[34] T. Boretius et al., “A transverse intrafascicular multichannel electrode (TIME) to 684
interface with the peripheral nerve.,” Biosens. Bioelectron., vol. 26, no. 1, pp. 62–69, 685
Sep. 2010. 686
[35] P. J. Rousche and R. A. Normann, “A method for pneumatically inserting an array of 687
penetrating electrodes into cortical tissue,” Ann. Biomed. Eng., vol. 20, no. 4, pp. 413–688
422, 1992. 689
[36] A. Branner, R. B. Stein, E. Fernandez, Y. Aoyagi, and R. A. Normann, “Long-Term 690
Stimulation and Recording with a Penetrating Microelectrode Array in Cat Sciatic 691
Nerve,” IEEE Trans. Biomed. Eng., vol. 51, no. 1, pp. 146–157, 2004. 692
[37] M. B. Christensen, S. M. Pearce, N. M. Ledbetter, D. J. Warren, G. A. Clark, and P. A. 693
Tresco, “The foreign body response to the Utah Slant Electrode Array in the cat sciatic 694
.CC-BY-NC-ND 4.0 International licensemade available under a(which was not certified by peer review) is the author/funder, who has granted bioRxiv a license to display the preprint in perpetuity. It is
The copyright holder for this preprintthis version posted July 15, 2020. ; https://doi.org/10.1101/2020.07.14.199653doi: bioRxiv preprint

25
nerve,” Acta Biomater., vol. 10, no. 11, pp. 4650–4660, 2014. 695
[38] H. A. C. Wark, K. S. Mathews, R. A. Normann, and E. Fernandez, “Behavioral and 696
cellular consequences of high-electrode count Utah Arrays chronically implanted in 697
rat sciatic nerve.,” J. Neural Eng., vol. 11, no. 4, p. 046027, 2014. 698
[39] D. McCreery, S. Cogan, S. Kane, and V. Pikov, “Correlations between histology and 699
neuronal activity recorded by microelectrodes implanted chronically in the cerebral 700
cortex,” J. Neural Eng., vol. 13, no. 3, p. 036012, 2016. 701
[40] T. D. Y. Kozai et al., “Reduction of neurovascular damage resulting from 702
microelectrode insertion into the cerebral cortex using in vivo two-photon mapping,” 703
J. Neural Eng., vol. 7, no. 4, p. 046011, 2010. 704
[41] J. J. Jun, C. Mitelut, C. Lai, S. L. Gratiy, C. A. Anastassiou, and T. D. Harris, “Real-time 705
spike sorting platform for high-density extracellular probes with ground-truth 706
validation and drift correction,” bioRxiv, p. 101030, 2017. 707
[42] J. Magland et al., “SpikeForest, reproducible web-facing ground-truth validation of 708
automated neural spike sorters,” Elife, vol. 9, p. 2020.01.14.900688, May 2020. 709
[43] T. Suzuki, K. Mabuchi, and S. Takeuchi, “A 3D flexible parylene probe array for 710
multichannel neural recording,” in First International IEEE EMBS Conference on Neural 711
Engineering, 2003. Conference Proceedings., 2003, pp. 154–156. 712
[44] L. Luan et al., “Ultraflexible nanoelectronic probes form reliable, glial scar–free neural 713
integration,” Sci. Adv., vol. 3, no. 2, p. e1601966, 2017. 714
[45] T. L. Hanson, C. A. Diaz-Botia, V. Kharazia, M. M. Maharbiz, and P. N. Sabes, “The 715
‘sewing machine’ for minimally invasive neural recording,” bioRxiv, p. 578542, 2019. 716
[46] V. Gaillet et al., “Spatially selective activation of the visual cortex via intraneural 717
stimulation of the optic nerve,” Nat. Biomed. Eng., 2019. 718
[47] P. R. Patel et al., “Chronic in vivo stability assessment of carbon fiber microelectrode 719
arrays,” J. Neural Eng., vol. 13, no. 6, p. 066002, Dec. 2016. 720
[48] R. A. Kuhn, “Organization of Tactile Dermatomes in Cat and Monkey,” J. 721
Neurophysiol., vol. 16, pp. 169–182, 1952. 722
[49] R. Q. Quiroga, Z. Nadasdy, and Y. Ben-Shaul, “Unsupervised Spike Detection and 723
Sorting with Wavelets and Superparamagnetic Clustering,” Neural Comput., vol. 16, 724
no. 8, pp. 1661–1687, 2004. 725
[50] A. Rodriguez and A. Laio, “Clustering by fast search and find of density peaks,” Science 726
.CC-BY-NC-ND 4.0 International licensemade available under a(which was not certified by peer review) is the author/funder, who has granted bioRxiv a license to display the preprint in perpetuity. It is
The copyright holder for this preprintthis version posted July 15, 2020. ; https://doi.org/10.1101/2020.07.14.199653doi: bioRxiv preprint

26
(80-. )., vol. 344, no. 6191, pp. 1492–1496, 2014. 727
[51] A. Rodriguez, M. D’Errico, E. Facco, and A. Laio, “Computing the Free Energy without 728
Collective Variables,” J. Chem. Theory Comput., vol. 14, no. 3, pp. 1206–1215, 2018. 729
730
Acknowledgements: 731
We acknowledge all members of Dr. Bruns’ Peripheral Neural Engineering and Urodynamics 732
Laboratory and Dr. Yoon’s Solid-State Electronics Laboratory for valuable assistance in 733
experiments and technology development, especially Aileen Ouyang, Dr. Ahmad Jiman, and 734
Dr. Lauren Zimmerman. Dr. Paras Patel and Elissa Welle assisted in technical aspects of 735
PEDOT coating electrodes. Dr. Mihaly Voroslakos assisted in the design of the array delivery 736
system. Arrays and shuttles were manufactured in the Lurie Nanofabrication Facility at the 737
University of Michigan. Funding for the project was provided by the following: the University 738
of Michigan MiBrain Initiative; the University of Michigan Rackham Predoctoral Fellowship 739
Program; the National Institutes of Health (SPARC awards U18EB021760 and OT2OD023873, 740
and grant 5R21EB020811); the National Science Foundation (Grant # 1653080). 741
Author Contributions: 742
Planned study – Z.J.S., K.N., E.Y., J.P.S., T.M.B. Fabricated arrays and shuttles – K.N., 743
J.P.S. Performed surgeries and collected data – Z.J.S., T.M.B. Developed software analysis – 744
Z.J.S., J.J. Analyzed data – Z.J.S., L.R.M., A.S. Drafted manuscript – Z.J.S., L.R.M., T.M.B. 745
Reviewed manuscript and approved final version – Z.J.S., K.N., L.R.M., A.S., E.Y., J.J., J.P.S., 746
T.M.B. Supervised project – E.Y., J.P.S., T.M.B. 747
Data Availability Statement: 748
The raw neural and analog recording data that support the findings of this study and 749
will be available with associated metadata from the Blackfynn Discovery platform at doi: 750
10.26275/vzxw-kwdu after curation by the NIH SPARC Data Resource Center. This includes 751
all data used to generate Figures 2-6, as well as summary data. 752
Code Availability Statement: 753
All analysis in this study was performed using ironclust, a neural spike sorting 754
package for MATLAB developed at Flatiron Institute, based on JRCLUST (Janelia Rocket 755
Cluster). The current version of this software, which includes features developed for this 756
study, can be found at https://github.com/flatironinstitute/ironclust. 757
Competing Interests: 758
.CC-BY-NC-ND 4.0 International licensemade available under a(which was not certified by peer review) is the author/funder, who has granted bioRxiv a license to display the preprint in perpetuity. It is
The copyright holder for this preprintthis version posted July 15, 2020. ; https://doi.org/10.1101/2020.07.14.199653doi: bioRxiv preprint
27
T.M.B. is a named inventor on a granted patent (US9622671B2; assigned to 759
University of Pittsburgh) which is on the monitoring of physiological states via 760
microelectrodes at DRG. The authors declare no other personal or institutional interest with 761
regards to the authorship and/or publication of this manuscript. 762
.CC-BY-NC-ND 4.0 International licensemade available under a(which was not certified by peer review) is the author/funder, who has granted bioRxiv a license to display the preprint in perpetuity. It is
The copyright holder for this preprintthis version posted July 15, 2020. ; https://doi.org/10.1101/2020.07.14.199653doi: bioRxiv preprint