whigs and tories: party representation in …dbogart/partyrepdec272013.pdf0 whigs and tories: party...
TRANSCRIPT
0
Whigs and Tories:
Party Representation in English and Welsh
Constituencies, 1690-1740
Dan Bogart
Department of Economics, UC Irvine
This Draft December 2013
Abstract
The Whig and Tory parties played an important role in British politics in the decades following
the Glorious Revolution. This paper builds on the The History of Parliament and introduces new
data on the political affiliation of all MPs serving in England and Wales between 1690 and 1740.
It then measures the strength of Whig and Tory representation across English and Welsh
constituencies and for the first time present maps of party representation. The Whigs are shown
to be more strongly represented in southeastern municipal boroughs, especially those with small
or narrow electorates. The Tories were strongest in Midland counties and were weaker in
counties with a higher percentage of dissenters from the Church of England. The patterns are
broadly similar during the Rage of Party (1690 to 1721) and the Walpole Era (1722 to 1740).
The main difference is that the Whigs lost strength in the North and gained in Wales during the
Walpole Era. The Whigs also lost strength in counties with more dissenters.
JEL Code: N43, P16, D72
Keywords: Political Parties, Whigs, Tories, Rage of Party, Walpole, Glorious Revolution
1 I would like to thank the many research assistants who helped on this project, specifically Robert Oandasan,
Dorothy Cheng, Amanda Compton, Alina Shiotsu, Tom Wheeler, and Larry Bush.

1
Britain’s transition to more representative government following the Glorious Revolution of
1688-89 exposed divisions within society. The most poignant example is the conflict between the
Whigs and Tories. Political parties emerged in the 1670s and 80s during the Exclusion crisis.
The Whigs favored excluding James Stuart from the throne because of his Catholicism and views
on the monarchy. The Tories formed to oppose exclusion because it represented too great an
incursion into royal authority. After the Glorious Revolution, the Whigs and Tories were
engaged in a frequent and close struggle for control over the House Commons. During the ‘Rage
of Party’, between 1690 and 1714, there were ten elections and the majority party in the
Commons changed six times. Party conflict was fueled by differences in economic and social
interests. The Tories represented a significant portion of the landowning interest and on national
issues they protected the interests of the Church of England and favored lower taxes. The Whigs
generally represented larger landowners and financial interests. They favored religious toleration
for dissenters from the Church of England and an aggressive foreign policy supported by a well-
funded army. The two parties also differed in leadership. The Tories’ best known leader was
Robert Harley who served as Lord Treasurer from 1711 to 1714. The Whigs were led by a small
group known as the ‘Junto’ who dominated the king’s ministry for much of the 1690s.
There was a significant turn in British politics after 1715 when the intensity of party
competition weakened and changed in character. The Tories were damaged by their links with
the failed Rebellion of 1715, which aimed to overthrow the Hanoverian monarchy and reinstall
James Stuart to the throne. Religious tensions also weakened, giving less salience to the Tory
critique of ‘Church in Danger’. The emergence of Robert Walpole as the leader of the Whig
party was another important development. Walpole used the 1715 Jacobite Rebellion to portray
the Tories as a threat to the Revolutionary settlement of 1689. Walpole also courted a new group

2
of Whigs by offering government offices and other perks. Walpole was successful in that he
helped to maintain a Whig majority in the Commons from 1721 to 1743, but he could not keep
all Whigs tied to his government. Some became dissatisfied and formed a group known as the
Opposition Whigs in the early 1730s. It was the beginning of the party disintegration that was
commonplace in the mid eighteenth century.
The shifting fortunes of the Whig and Tory parties are thought to be crucial to the evolution
of Britain’s policies after the Glorious Revolution. In their studies of politics under King William
and Queen Anne, Horowitz (1977) and Holmes (1967) show how the relative influence of the
Whigs and Tories influenced the fate of key bills in the Commons. Pincus (2009) extends this
view and argues that the Whigs and Tories had fundamentally different visions of political
economy, leading the Whigs to adopt policies favoring a manufacturing economy and the Tories
an agrarian economy. David Stasavage (2003) has made a similar argument that Whig majorities
signaled a more credible commitment to protect the rights of government bondholders compared
to Tory majorities. Collectively such works have severely questioned the view of historians, like
Walcott (1956), who argue that parties were largely irrelevant for policy making.
Although Britain’s early political parties have been extensively studied and discussed there is
still much that is not known, especially concerning their representation across constituencies.
The aim of this paper is to provide a new quantitative basis for the study of Britain’s early
political parties. Much of the recent literature makes use of The History of Parliament, a series of
volumes devoted to the histories of individual Members of Parliament, constituencies, and
parliaments. The most recent edition, The House of Commons: 1690-1714, edited by
Cruickshanks, Handley, and Hayton (2002), makes a number of key contributions to our
collective knowledge of politics during the Rage of Party. First, it estimates party strength across
3
parliaments. Second, it provides a narrative of electoral politics in each constituency. Third, it
gives a biography of every Member of Parliament (henceforth MP) in the House of Commons
from 1690 to 1715. The House of Commons: 1690-1714 is an impressive work and historians
owe a great debt to its editors and contributors. Nevertheless there is a significant limitation in
the data it provides. In the introductory survey, Hayton (2002) gives the total number of MPs in
each party and in each parliament but does not provide tabular data on the party affiliation of
each MP. In other words, nowhere in their volume can one find a list of MPs by name and by
party. The same data limitation applies to the subsequent edition, The House of Commons: 1715-
1754, edited by Sedgwick (1970). Total counts of Whig, Tory, and Opposition Whig MPs are
given in each parliament from 1715 to 1741, but not in tabular form for individual MPs. Speck’s
(1970) study of party politics in English and Welsh constituencies also suffers from the same
problem. Speck gives electoral totals for each party from 1701 to 1715 and provides a list of safe
seats for each party, yet no data on individual MPs is given to reconstruct these figures.
This paper addresses this issue by introducing newly created data on the political
affiliation of all MPs serving constituencies in England and Wales between 1690 and 1740.
Specifically the data codes whether every MP was part of the majority party in each parliament.
The interest in the majority party stems from the idea that it usually has a great advantage in
implementing its legislative goals compared to opposition parties. The early eighteenth century
was also the period when the ministry became inter-connected with the majority party in the
Commons (Cox 2011). The strength of the Whig and Tory parties across constituencies is also of
interest. Various theories on where and in which types of constituencies each party drew its
electoral strength are tested. The differences between the Rage of Party and the Walpole Era are
also of interest as politics changed over this period.
4
Like previous studies, this paper uses division lists to identify party affiliation. One type
of division list addresses a particular bill of importance, like the Peerage bill of 1719, and
identifies which MPs voted for or against. A second type of division list comes from party
leaders who list all MPs that belong to their party or are considered reliable. An example is the
Worsley List which classifies the party affiliation of all MPs in the 1713 and 1715 parliaments.
Although extremely valuable, the problem with these sources is that MPs may not fit the Whig or
Tory model of voting on all division lists in a parliament. To address this issue an algorithm is
developed that combines information from two or more division lists. The approach here is
‘conservative’ in that majority party status is assigned only to MPs who never deviate from the
majority party line for all division lists in a parliament. As a robustness check the size and
composition of the majority party is examined when MPs are allowed to deviate from the
majority once in a Parliament or when less divisive bills are dropped.
The new classification of party representation shows that a ‘true’ majority party (having
more than 50 percent of MPs in the Commons) existed in 5 of the 14 of the parliaments from
1690 to 1740. The Tories had a true majority in the 1702, 1710, and 1713 parliaments. The
Whigs had a true majority in the 1708 and 1722 parliaments. In 5 of the 14 parliaments the
largest party was very close to a majority with at least 46 percent of MPs belonging to it. In the 4
remaining parliaments the largest party had between 37 and 43 percent of MPs affiliated. These
included the 1690 parliament when parties were re-forming after the Revolution, the two short-
lived parliaments of 1701, and the 1715 parliament which was unusual as explained below.
Perhaps the most important contribution of this paper is a new summary statistic for Whig
and Tory Party Strength in all English and Welsh constituencies between 1690 and 1740. Whig
party strength is measured by the fraction of MPs in each constituency affiliated with the Whigs
5
when the Whigs were in the majority. Tory party strength is measured analogously. To the
author’s knowledge this is the first constituency-level measure of party strength in the literature
on early eighteenth century politics.
The paper goes further by identifying whether Whig and Tory strength was statistically
different across constituency types and regions. The Whigs are found to be stronger in municipal
boroughs and those with small and narrow electorates especially in the Era of Walpole (1722 to
1740). The Tories were stronger in county constituencies and in boroughs with large and more
democratic electorates. Across regions the Whigs were always stronger in the Southeast. The
Tories were always stronger in the West Midlands. Elsewhere there was an evolution over time.
During the Rage of Party the Whigs were weaker in the Southwest, East Midlands, and Wales,
where the Tories were strong. But in the Walpole Era, the Whigs gained some ground in these
three regions although not enough to make them strongholds. The Whigs also lost strength in the
North under Walpole where earlier they were stronger. Overall there was a more even
geographic distribution of party strength under Walpole.
Differences in the religious affiliation of the population were another factor. During the Rage
of Party the Tories were weaker in counties where ‘dissenters’ from the Church of England were
more populous and the Whigs were stronger in these counties. The results are consistent with
arguments emphasizing the religious differences between the two parties.
The data have a number of applications for research on English and Welsh history. One of
the most exciting involves the use of Geographic Information Systems or GIS. Each constituency
in England and Wales has been mapped or geo-coded so that party representation can be
analyzed across space. To illustrate the spatial patterns, map 1 shows the new index for Whig

6
party strength in English counties. Darker shades correspond to greater Whig strength and lighter
shades represent lower Whig strength. Map 2 illustrates the index for Whig party strength across
municipal boroughs. The data show the geographic strength of the Whig party in a way that has
never been seen before (to my knowledge, this is the first time that maps of party representation
have been created for the early eighteenth century). More importantly, the data can be used to
analyze the spatial connection between party representation and social, political, or economic
outcomes opening new avenues for research in English and Welsh history.

7
Map 1: Whig Strength in English and Welsh Counties.

8
Map 2 Whig Strength in English and Welsh Boroughs.

9
I.
In the introductory volume to The House of Commons: 1690-1714, Hayton (2002) gives total
counts of Whig MPs, Tory MPs, and MPs not classified for each parliament from 1690 to 1713.
The figures are drawn from data presented in all the volumes edited by Cruickshanks, Handley,
and Hayton (2002). These party counts are referred to as Cruickshanks, Handley, and Hayton’s
(henceforth CHH) estimates. Sedgwick (1970), editor of The House of Commons: 1715-1754,
gives similar counts for Whig MPs, Tory MPs, and opposition Whigs in each parliament from
1715 to 1734. Together these statistics are extremely important because they identify which party
had the majority in any parliament and by how much. The following table gives their counts at
the beginning of each parliament.
Table 1: Classifications of Party Strength, 1690-1740
Parliament by
starting year
Number of
Tories
Number of
Whigs
Number of
Unclassified
Opposition
Whig
Majority
Party
1690 243 241 28
Tory
1695 203 257 53
Whig
1698 208 246 59
Whig
Feb. 1701 249 219 45
Tory
Dec. 1701 240 248 24
Whig
1702 298 184 31
Tory
1705 260 233 20
Tory
1708 225 268 20
Whig
1710 329 168 14
Tory
1713 354 148 11
Tory
1715 217 341
Whig
1722 178 379
Whig
1727 128 415
15 Whig
1734 149 326
83 Whig
Sources: Cruickshanks, Handley, and Hayton (2002), pp. 218-233 and Sedgwick (1970), pp. 33-
57.

10
CHH and Sedgwick also provide a biography of every MP that sat in the House of
Commons. The biography describes each MPs’ politics, education, profession, positions held,
and other characteristics. Unfortunately, the biography does not give an indicator for party
affiliation that would correspond to the totals given in table 1. A researcher interested in a
disaggregated analysis of party representation must read every biography and infer party
affiliation from the description. For example, the biographical entry for Thomas Lamplugh,
representing Cockermouth from 1702 to 1708, contains over 1000 words. Towards the end of the
Lamplugh entry it is stated that ‘an analysis of the Commons in early 1708 classed him as a
Whig.’2 On the basis of this biographic entry, a researcher could classify Lamplugh as a Whig,
but as a general approach it is not ideal. The difficulty is that the relevant passages in CHH and
Sedgwick are not always easy to find and once identified the inferences based on their text could
lead to judgment errors. Moreover a researcher is tied to CHH and Sedgwick’s description of an
individual MPs party affiliation. If their classification was not accurate there is little a researcher
can do to identify the error unless they return to the primary sources.
The aim in this paper is to create new and comprehensive data on the party affiliation of
MPs. It follows the tradition in the literature of using division lists to classify the party affiliation
of MPs. Many division lists have survived and are printed. Others can be consulted in archives.
Fortunately, all division lists for the period from 1690 to 1715 do not need to be located or
collected. The archivists at the History of Parliament trust have retained a red ledger in which
CHH reproduce the data contained in numerous division lists.3 The red ledger is similar to a
spreadsheet with the voting records of each MP or their classification as Whigs or Tories in the
2 See http://www.historyofparliamentonline.org/volume/1690-1715/member/lamplugh-thomas-1656-1737 authored
by Eveline Cruickshanks and Richard Harrison. 3 I thank Stuart Handley for kindly sharing the ledger.

11
columns. After 1715 printed division lists in sources identified by Sedgwick (1970) are used. I
also draw on the secondary literature to identify party affiliation. Studies by Synder (1972),
Speck (1964), and Horrowitz (1977) classify many MPs as Whigs or Tories. These studies are
based on division lists and provide useful summaries and so their information is incorporated.
Methodology
Namier (1961) in his classic work on British parties c.1760 identified a key methodological
problem in classifying party strength. Namier pointed out that a division list could classify an
MP as being with a party, but in reality they have a weak connection to party leaders. Suppose
for example an MP is thought to be a Whig but they voted against Whig leaders on some key
bill. Should the historian still classify them as a Whig? The methodological problem is most
acute when there are multiple division lists in a parliament. In such cases, there are at least two
metrics by which to judge the party affiliation of an MP and it is not obvious whether one list
should be favored or all should be treated equally.
Following Namier historians began to use division lists more carefully. An effort was made
to identify how many MPs consistently voted with the Whig or Tory position. That is, if there
were two division lists in a parliament a consistent voting pattern would show up as two Whig
votes or two Tory votes (see Horwitz 1966, Burton, Riley, and Rowlands 1968, Newman 1970).
The approach here builds on the idea that a consistent voting record meant than an MP was
affiliated with a party. I begin by identifying the majority party, either Whig or Tory, in each
parliament. As shown in table 1, one can infer the majority party from CHH and Sedgwick’s
counts of MPs. Next I adopt a general rule for classifying an MP as being with the majority party
in each parliament. The MP has to vote with or be listed with the majority party and they cannot

12
vote against a bill promoted by majority party leaders in any division list for that parliament. In
other words, one vote against the majority party disqualifies an MP from being coded as a
majority party MP. An MP can be absent on some vote and still be classified as a majority party
MP if they consistently vote with the majority party on other bills and/or they were classified as
being with a party. MPs can switch parties across Parliaments, but not within Parliaments. In
other words, an MP can vote with the Whig majority in one parliament and get classified as
being with the Whig majority, but in the next parliament they can deviate from the Whig
majority on some vote and hence are not classified as with the majority party.
It was not uncommon for MPs to go unclassified in all division lists published during a given
Parliament. Here I feel that the best approach is to use classifications or voting records in nearby
Parliaments, usually the previous parliament. If nearby parliaments fail to produce any
information then the biographies in CHH and Sedgwick are consulted. If the biographies do not
give clear information on party affiliation, then MPs are labeled as not with the majority party.
The present approach to classifying MPs is ‘conservative.’ If an MP voted with the majority
party on most but not all bills then they are not classified with the majority party. Thus my
classification provides an indication of whether an MP was closely connected to the majority
party. As an extension one could consider less conservative approaches which allow an MP to be
classified with the majority party even if they did not always vote with the majority. The results
of the two methods are summarized below.
It is important to note that my approach cannot classify the size of the opposition party in
each parliament because it does not classify the political affiliation of MPs who are not with the
majority. For example, if an MP is not classified with the Whig majority in a parliament they are

13
not labeled a Tory in the same parliament. It should be noted that there is a potential to classify
MPs as Whig if they were not classified with the majority party during Tory majorities and they
were classed with the majority party under Whig majorities. Similarly an MP could be classified
as Tory if were not classified with Whig majorities and they were classified with Tory majorities.
However, this method would require an MP to sit in more than one parliament and the majority
party would have to change during their tenure. I leave this application to future research.
The following sub-sections describe how political affiliation is determined in each parliament
using the available division lists. When it is useful the columns in the red leger provided by CHH
are noted.
1690 Parliament
CHH find that the 1690 Parliament started with a Tory majority, although as they emphasize
there is some uncertainty about party alignments from 1690 to 1694. There is a division list
attributed to Lord Carmarthen, the President of the King’s council and a prominent Tory, in
March 1690 (column 1 in the red ledger). The Carmarthen list gives MPs a numerical coding:
1=Whig, 2=Tory, and 3=Doubtful. There is another list attributed to Carmarthen (column 3 in
the red ledger) which labels some MPs as probable supporters of Carmarthen. There were 38
MPs that could not be found on the Carmarthen list, but for which I was able to code as being
with the Tories based on their voting in the 1695 session. There were 26 MPs for which I could
not determine their political affiliation based on voting in other sessions, so here the biographies
in CHH are referenced. Keep in mind that a typical parliament before 1700 had at least 513 MPs
and usually more as some died or vacated their seat before the next election.
1695 Parliament

14
The 1695 parliament saw a clear shift in the majority to the Whigs who also became known
as the Court party based on their close link with King William. CHH argue that party lines
become clear from 1695 based on several division lists. One division (column 18 in the red
leger) concerned the bill of attainder for Sir John Fenwick in November 1696. Fenwick was
accused of an assassination attempt against King William. The Whig leaders supported the
attainder of Fenwick and the Tories did not. P indicates a vote for the attainder and C against. A
second division concerned the proposed council of trade in January 1696 (column 15). The
council of trade bill revised the navigation laws and was supported by the Whig leadership. P
indicates an MP was likely to support the court on the trade bill and C likely to oppose the court.
A third division concerned whether an MP signed or refused to sign the association of the first
(column 16). The association was a document pledging to take revenge against William’s
enemies. The Whig leaders supported the association and signed quickly. The Tories did not. P
indicates the MP signed the association of first and C indicates they did not. As there are three
divisions, I had to decide how to aggregate the information. Following the conservative
approach, an MP was identified as a Whig if they always voted with the Whig leaders, meaning
they supported the Fenwick attainder, the council on trade bill, or signed the association of the
first. Whig MPs are allowed to be absent on one or two of these divisions, meaning if they voted
with the Whigs on any one and were absent for the rest they were stilled classified as a Whig.
There were 22 MPs which are not reported in any of these divisions, but were classified based on
voting in 1690 or the 1698 session. For 6 MPs the biographies in CHH were consulted.
1698 Parliament
The Whigs maintained a majority in the House of Commons in the 1698 session. There is a
division list that distinguishes between the court party and the country party in September 1698
15
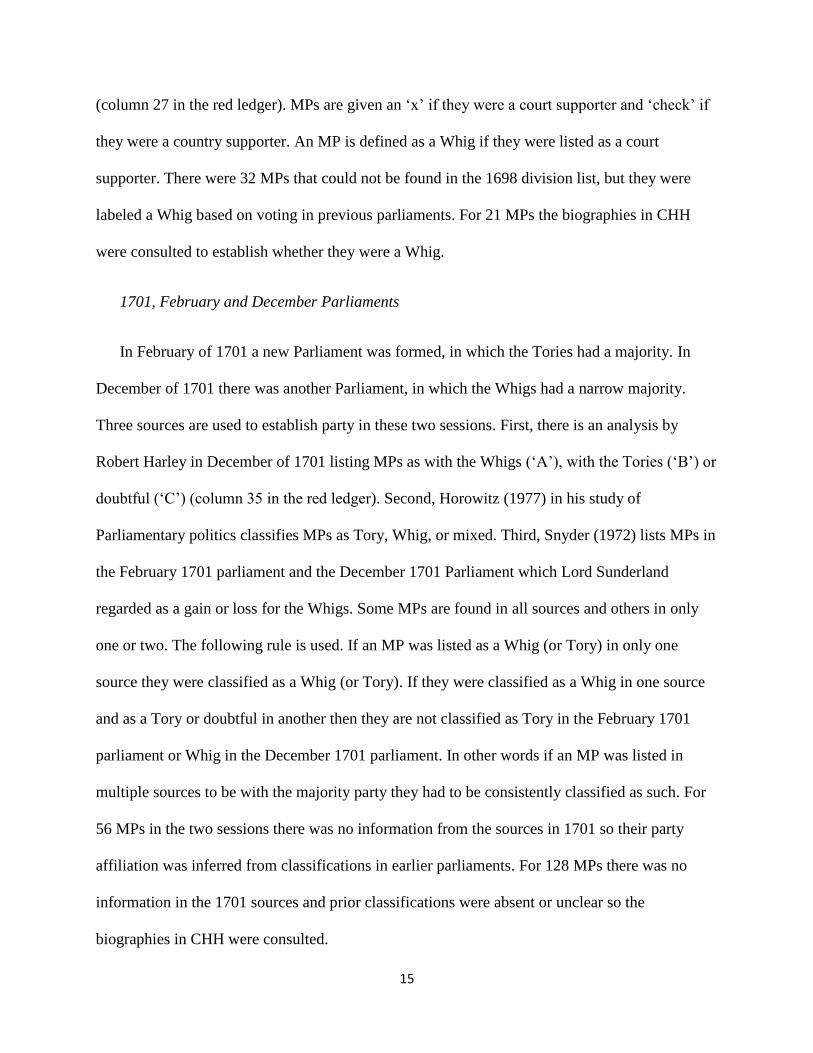
(column 27 in the red ledger). MPs are given an ‘x’ if they were a court supporter and ‘check’ if
they were a country supporter. An MP is defined as a Whig if they were listed as a court
supporter. There were 32 MPs that could not be found in the 1698 division list, but they were
labeled a Whig based on voting in previous parliaments. For 21 MPs the biographies in CHH
were consulted to establish whether they were a Whig.
1701, February and December Parliaments
In February of 1701 a new Parliament was formed, in which the Tories had a majority. In
December of 1701 there was another Parliament, in which the Whigs had a narrow majority.
Three sources are used to establish party in these two sessions. First, there is an analysis by
Robert Harley in December of 1701 listing MPs as with the Whigs (‘A’), with the Tories (‘B’) or
doubtful (‘C’) (column 35 in the red ledger). Second, Horowitz (1977) in his study of
Parliamentary politics classifies MPs as Tory, Whig, or mixed. Third, Snyder (1972) lists MPs in
the February 1701 parliament and the December 1701 Parliament which Lord Sunderland
regarded as a gain or loss for the Whigs. Some MPs are found in all sources and others in only
one or two. The following rule is used. If an MP was listed as a Whig (or Tory) in only one
source they were classified as a Whig (or Tory). If they were classified as a Whig in one source
and as a Tory or doubtful in another then they are not classified as Tory in the February 1701
parliament or Whig in the December 1701 parliament. In other words if an MP was listed in
multiple sources to be with the majority party they had to be consistently classified as such. For
56 MPs in the two sessions there was no information from the sources in 1701 so their party
affiliation was inferred from classifications in earlier parliaments. For 128 MPs there was no
information in the 1701 sources and prior classifications were absent or unclear so the
biographies in CHH were consulted.

16
1702 Parliament
The 1702 parliament had a large Tory majority. As many MPs in 1702 were in Parliament in
1701 the same sources as 1701 are used to classify party here. I also use one additional division
list indicating whether MPs voted for or against the ‘Tack’ in November 1704 (column 51). The
Tack was the occasional conformity bill (pushed by Tories favoring the Church of England) and
was tacked onto the land tax bill in 1704. I start with the Tack. If an MP voted for the Tack then
they were a Tory and if they voted against they were not classified as a Tory. Next I used
Sunderland’s list of gains and losses for the Whigs (Synder 1972). If an MP was classed as a loss
to the Whigs they were a Tory and if a gain to the Whigs they were not. If an MP did not vote on
the Tack and was not in Sunderland’s list the classification from the 1701 Parliaments is used to
determine whether they were a Tory. There were 35 MPs with no information in the Tack or
previous parliaments so the biographies in CHH were consulted.
1705 Parliament
The Tories maintained a majority in the 1705 parliament. Speck (1964) gives the voting
record for many MPs in the 1705 session. They are assigned 1T, 2T, 3T, and 4T if they voted
one, two, three, or four times for Tory positions between 1702 and 1714. MPs are assigned 1W,
2W,…7W if they voted one, two, and up to seven times for Whig positions. Speck also indicates
if MPs voted for some Whig and some Tory positions and how many. Lastly, Speck gives MPs
an ‘N’ if they do not occur on any list he consulted. An MP is classified as Tory if they always
voted Tory according to Speck. In other words, if they ever voted Whig they were not classified
as Tory. If any MP was listed as N by Speck the biographies in CHH were consulted to establish
whether they were Tory. For 91 MPs I inferred their voting record from previous parliaments.

17
1708 Parliament
The 1708 parliament saw the return of the Whigs as the majority party in the Commons. Here
four division lists are used. First, there are two lists in early 1708 identifying MPs as either Whig
or Tory (columns 58 and 59 in the red ledger). The two lists overlap with respect to most MPs
but not all. Second, there is a division list indicating whether MPs supported the naturalizations
of Palatines (column 61 in the red ledger). Support was taken to be a Whig position. Third, there
was a division list indicating whether an MP voted for or against the impeachment of Dr.
Sacheverell (column 62). Voting for was a Whig position. If an MP was labeled a Whig in the
two analyses of Parliament and voted for the impeachment then they were classified as a Whig.
If the MP was labeled a Tory then they were not classified as a Whig. If the MP was not labeled
in the first two lists and either supported the naturalization of palatines or voted for the
impeachment they were labeled a Whig. If they voted against the Whig position on naturalization
or against the impeachment of Dr. Sacheverell they were not labeled as a Whig. For 12 MPs not
on any list the biographies in CHH are consulted.
1710 Parliament
In the 1710 parliament the Tories returned to the majority. Three division lists are used to
classify MPs. First, the Hanoverian list in 1710 describes MPs as Tory, Whig, or doubtful
(column 67 in the red ledger). Second, the White List identifies ‘Tory Patriots’ in 1711 (column
68). Third, there is a division list concerning the French Commerce bill (column 75). A vote for
the French Commerce bill indicated a Tory position. If an MP was identified as a Tory on the
Hanoverian list and the White list and they voted for the French Commerce bill they were
classified as a Tory. If they were not identified on the first two lists but did vote for the
18
commerce bill they were also classified as a Tory. For 95 MPs there was no information on these
three lists and their political affiliation was classified based on prior voting. For 27 MPs I use the
biographies in CHH because they were not identified in any division list.
1713 Parliament
The 1713 parliament continued to have a Tory majority. The Worsley list is very useful in
classifying MPs in the 1713 session. Worsley identifies whether an MP was a Tory or Whig and
whether an MP sometimes voted against their party. The Worsley List is reprinted in Sedgwick
(1970) along with Sedgwick’s corrections to a few errors in the Worsley List. I classified an MP
as a Tory if they were listed as such by Worsley and they were not identified as an MP that
would sometimes vote against their party. There were 3 MPs where prior voting was used to
determine party. For 8 MPs the biographies in CHH are consulted.
1715 Parliament
The Whigs gained a majority again in the 1715 Parliament. The Worsley list provides an
indicator for every MPs party affiliation at the start of the 1715 parliament. The Worsley list
becomes less useful after 1718 when there is a split in the Whig leadership due to a quarrel
between the King and the Prince of Wales. Whig leaders like Sunderland, Stanhope, and
Cadogan remained as ministers while Townshend and Walpole left the ministry and formed a
Whig opposition. The Whig opposition voted against the government on several key bills. One
bill was meant to repeal a provision of the Occasional Conformity Act requiring public office
holders to take the sacrament. A list of MPs voting for and against the so-called Protestant
Interest bill is given by Cobbet, Parliamentary History, vol. vii, pp. 585-88. A second bill was to
prevent the Prince from expanding the peerage upon succession. It is known as the Peerage bill

19
and a list is reprinted in Chandler, History and Proceedings of the House of Commons, vol. viii,
pp. 285-295. Both the Protestant Interest bill and the Peerage bill were supported by the Whig-
led Sunderland-Stanhope-Cadogan ministry. For this parliament a Whig must support the Whig
ministry throughout. Thus I classify an MP as being a Whig if they were classified as a Whig in
the Worsley list and if they did not vote against the repeal of the Occasional Conformity Act or
the Peerage bill. For 86 MPs I used the biographies in Sedgwick.
1722 Parliament
Identifying party affiliation for the 1722 parliament is difficult as there were no new division
lists from 1722 to 1727 according to Sedgwick (1970). Here the voting records from the previous
parliament are used whenever possible. MPs that were Whig in the 1715 parliament were
classified as Whig again if they sat in the 1722 Parliament. Whigs that supported the Sunderland-
Stanhope ministry also supported the Walpole ministry that formed in 1721 and continued in the
1722 parliament. If an MP was classified as a Tory in the Worsley list from 1715 then they were
not classified as a Whig if they sat in the 1722 parliament. Tories rarely switched to the Whig
side. The more difficult group are MPs that were classified as Whig in the Worsley list but were
not classified as Whig in the 1715 parliament due to the split. Robert Walpole is in this group for
example because he split from the Sunderland-Stanhope-Cadogan ministry. Here I consult the
biographies in Sedgwick to see if they were considered to be Whigs throughout the 1722
parliament. I also consult the biographies in Sedgwick if the MP served in the 1722 parliament
for the first time. In total the biographies in Sedgwick were used to classify 208 MPs serving in
the 1722 parliament.

20
1727 Parliament
There is a rich set of division lists to identify party affiliation in the 1727 parliament where
the Whigs again held the majority. The first involved a bill to make good on the arrears to the
Civil List in 1727. The Civil List funded the King’s household and thus was crucial to the
government and the Whigs. A list of MPs voting for and against the Civil List is reprinted in
Chandler, History, vol. viii, appendix. The second was a supply bill to fund Hessian soldiers.
Like the Civil List, voting for the Hessian bill represented a vote for the Whig position. A list of
the MPs that voted for and against the Hessian bill was printed in 1730 (Great Britain, 1730).
The third was a bill to repeal the Septennial Act in 1731. The Septennial Act dictated that
Parliaments could sit for 7 years before an election. The Whigs were perceived as benefitting
from the Septennial Act, so a vote against the Repeal represented a vote for the Whig position. A
list of MPs voting for or against the Repeal is printed in Cobbett, Parliamentary History, vol. ix,
pp. 479-482. The fourth division list involved the excise bill which proposed to increase excise
taxes. The excise tax was proposed by Walpole and would improve the fiscal position of the
government. Voting for the excise bill represented a vote for the Whig position. A list of MPs
voting for and against the Excise bill is reprinted in Chandler, History, vol. viii, appendix. As all
these bills were quite important to the Whig leaders a strict standard was adopted for classifying
Whigs in the 1727 parliament. If an MP voted with the Whigs on at least one of these four bills
and never voted against the Whigs on any of these four bills they were classified as a Whig. Thus
a vote against the Whig position automatically meant an MP was not classified as a Whig. There
were 102 MPs in the 1727 parliament that are not identified on any of the 4 division lists and
therefore the biographies in Sedgwick were used to classify party affiliation.
1734 Parliament
21
There are two main division lists for the 1734 parliament and both are printed in Chandler,
History, vol. vii, appendix. The first is a division on a motion to address the Spanish Convention
in 1739. The Spanish Convention was an agreement between the Spanish King and English
merchants who were accused of violating trade agreements in the Americas. Walpole proposed
the agreement but it was not popular among many MPs. Voting for the motion to address the
Spanish Convention represented a Whig position. The second is a division list describing
whether MPs voted for or against the Place bill of 1740. Voting against the Place bill represented
a Whig position. There were 105 MPs in the 1734 Parliament that could not be identified in
either of the two division lists. In these cases, the biographies in Sedgwick are consulted. Note
there were also 50 MPs classified as opposition Whigs by Sedgwick. Opposition Whigs are not
classified as Whig in my methodology.
Summary of Majority Party Classifications
By way of summary, for each MP an indicator variable is created for majority party
affiliation in every parliament starting in 1690 up to and including the 1734 parliament. A
spreadsheet will be made available which lists every MP by constituency in each Parliament. It
will also give the party classification, the MPs identity in any division list, secondary sources,
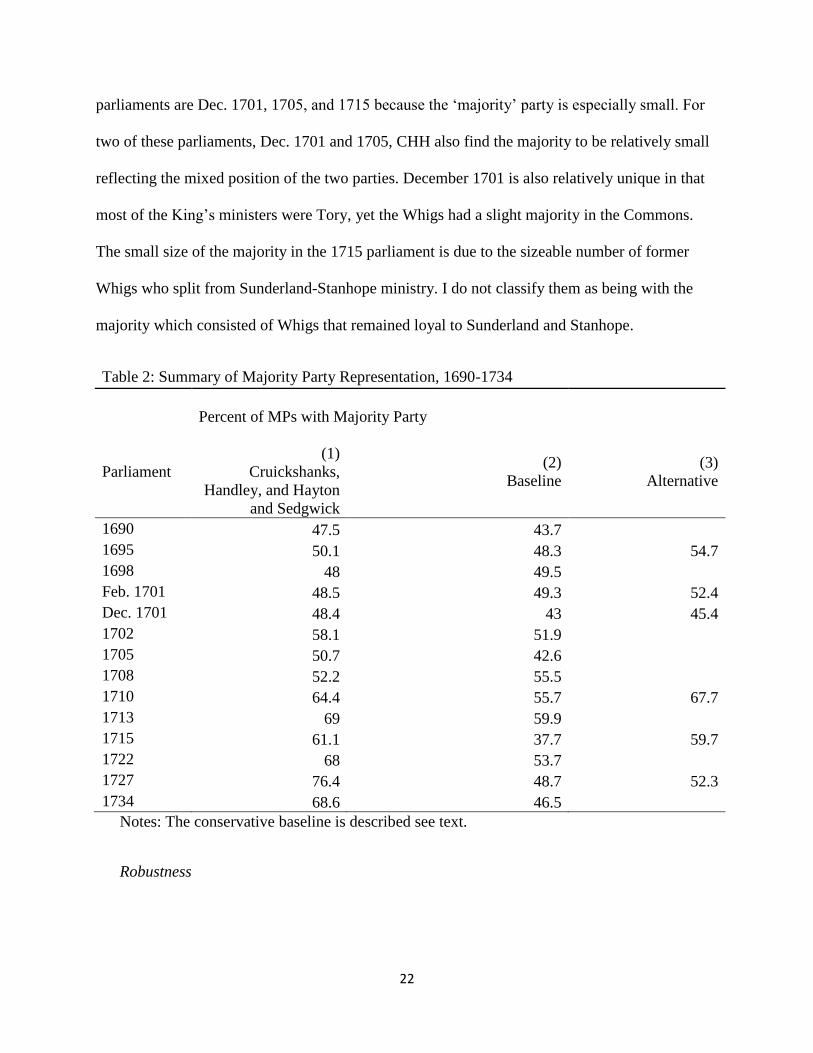
and in some cases the party classification in CHH or Sedgwick. Table 2 gives a summary of the
‘baseline’ estimates for the size of the majority party. CHH and Sedgwick’s figures are also
shown for comparison. The new baseline estimates imply that the majority party had an actual
majority (more than 50 percent of MPs) in 5 of the 14 parliaments. The largest party was close to
having a majority in 4 other parliaments (1695, 1698, Feb. 1701, and 1727). Thus technically
there was no majority party here, but as it was so close and given the non-trivial number of
independent MPs I still consider these parliaments as having a majority party. The problematic
22
parliaments are Dec. 1701, 1705, and 1715 because the ‘majority’ party is especially small. For
two of these parliaments, Dec. 1701 and 1705, CHH also find the majority to be relatively small
reflecting the mixed position of the two parties. December 1701 is also relatively unique in that
most of the King’s ministers were Tory, yet the Whigs had a slight majority in the Commons.
The small size of the majority in the 1715 parliament is due to the sizeable number of former
Whigs who split from Sunderland-Stanhope ministry. I do not classify them as being with the
majority which consisted of Whigs that remained loyal to Sunderland and Stanhope.
Table 2: Summary of Majority Party Representation, 1690-1734
Percent of MPs with Majority Party
Parliament
(1)
Cruickshanks,
Handley, and Hayton
and Sedgwick
(2)
Baseline
(3)
Alternative
1690 47.5 43.7
1695 50.1 48.3 54.7
1698 48 49.5
Feb. 1701 48.5 49.3 52.4
Dec. 1701 48.4 43 45.4
1702 58.1 51.9
1705 50.7 42.6
1708 52.2 55.5
1710 64.4 55.7 67.7
1713 69 59.9
1715 61.1 37.7 59.7
1722 68 53.7
1727 76.4 48.7 52.3
1734 68.6 46.5
Notes: The conservative baseline is described see text.
Robustness
23
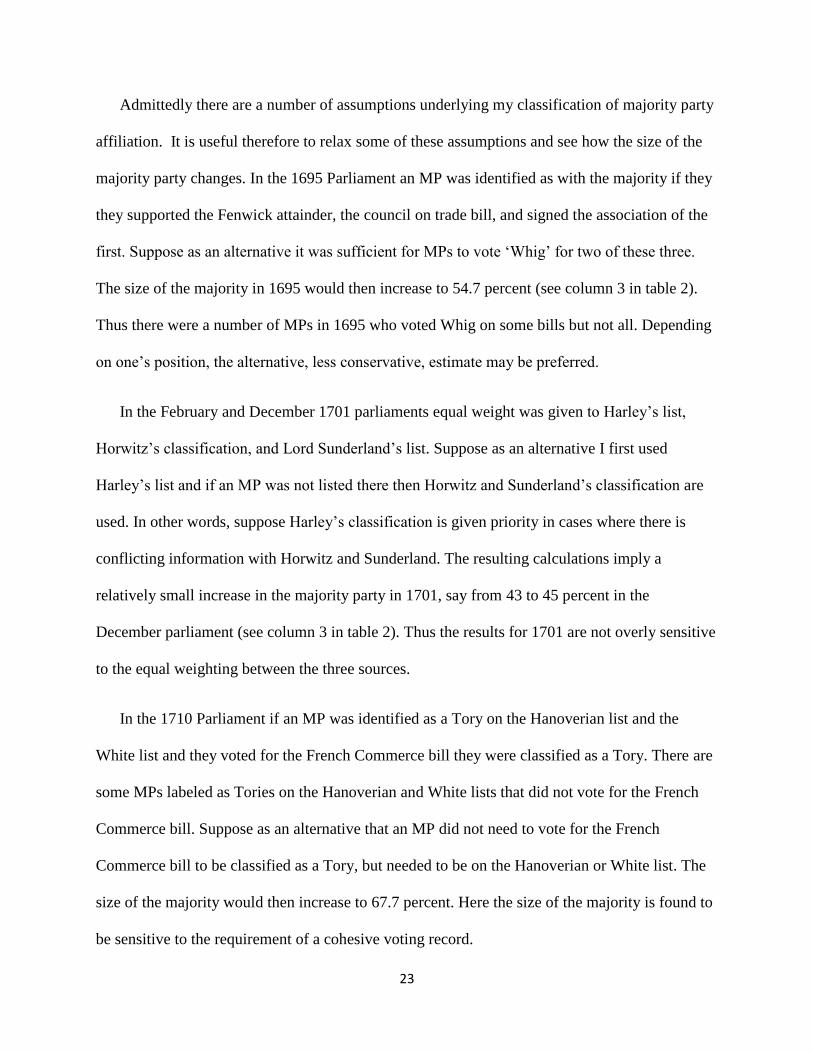
Admittedly there are a number of assumptions underlying my classification of majority party
affiliation. It is useful therefore to relax some of these assumptions and see how the size of the
majority party changes. In the 1695 Parliament an MP was identified as with the majority if they
they supported the Fenwick attainder, the council on trade bill, and signed the association of the
first. Suppose as an alternative it was sufficient for MPs to vote ‘Whig’ for two of these three.
The size of the majority in 1695 would then increase to 54.7 percent (see column 3 in table 2).
Thus there were a number of MPs in 1695 who voted Whig on some bills but not all. Depending
on one’s position, the alternative, less conservative, estimate may be preferred.
In the February and December 1701 parliaments equal weight was given to Harley’s list,
Horwitz’s classification, and Lord Sunderland’s list. Suppose as an alternative I first used
Harley’s list and if an MP was not listed there then Horwitz and Sunderland’s classification are
used. In other words, suppose Harley’s classification is given priority in cases where there is
conflicting information with Horwitz and Sunderland. The resulting calculations imply a
relatively small increase in the majority party in 1701, say from 43 to 45 percent in the
December parliament (see column 3 in table 2). Thus the results for 1701 are not overly sensitive
to the equal weighting between the three sources.
In the 1710 Parliament if an MP was identified as a Tory on the Hanoverian list and the
White list and they voted for the French Commerce bill they were classified as a Tory. There are
some MPs labeled as Tories on the Hanoverian and White lists that did not vote for the French
Commerce bill. Suppose as an alternative that an MP did not need to vote for the French
Commerce bill to be classified as a Tory, but needed to be on the Hanoverian or White list. The
size of the majority would then increase to 67.7 percent. Here the size of the majority is found to
be sensitive to the requirement of a cohesive voting record.

24
In the 1715 parliament an MP classified as a Whig on the Worsley list would not be
classified as with the majority Whigs in the parliament if they voted against the repeal of the
Occasional Conformity Act or the Peerage bill. The last two bills were key pieces of legislation
for the Whig leaders, Stanhope and Sunderland, and contributed to a split in the Whig party. To
see their significance, suppose I drop the requirement that a Whig in the Worsley list never vote
against either the Occasional Conformity Act or the Peerage bill to be classified as a Whig. The
size of the majority in the 1715 parliament would then increase substantially to 59.7 percent.
Again the size of the majority is found to be sensitive to the requirement of a cohesive voting
record.
Finally in the 1727 parliament there were four bills and an MP in the Whig majority could
not vote against the Whig position on any of the four. Suppose alternatively that an MP only
needed to vote with the Whigs on more than half of the four bills, say three of four or two of
three, to be classified as a Whig majority MP. In this case, the size of the majority increases from
48.7 percent to 52.3 percent. The requirement of a consistent voting record again has some
effect.
Another way of checking the assumptions is to compare my coding with a classification
based on the biographical entries in CHH and Sedgwick. A one percent random of MPs was
drawn and based on my reading of the biographies in CHH and Sedgwick an MP was identified
as a Whig, Tory, or unclassified. Then the MP was assigned to the majority party depending on
whether the Whigs or Tories had the majority in that parliament (see table 1). I implemented this
‘biography’ method without consulting the baseline coding of the MPs to ensure the biographical
information gave an independent source of information. Table 3 shows the number of MPs
sampled in each parliament and the percent of MPs that were coded similarly in the two

25
methods. There were some differences, but on the whole it is remarkable how the coding was
similar. In close to 90 percent of MPs, the coding is the same. The upshot is that my method does
not give substantially different results from the more exhaustive approach of reading and
interpreting every biographical entry in the House of Commons.
Table 3: Coding of Majority Party Representation using Biographical entries, 1690-1734
Parliament number MPs sampled
% of MPs where majority party
classification is coded the same in the
‘biography’ method and my method
1690 3 100
1695 5 100
1698 3 66.7
Feb. 1701 7 85.7
Dec. 1701 2 100
1702 8 75
1705 7 71.4
1708 6 100
1710 9 100
1713 3 66.7
1715 6 100
1722 3 100
1727 8 100
1734 9 88.9
All 79 89.9
II.
The size of the majority party was ultimately determined by elections in constituencies.
Much like modern democracies some constituencies in this period were more favorable to one
party over the other. In this section, it is established which types of constituencies the Whigs
were more strongly represented and the same for the Tories. I also examine whether they
changed from the Rage of Party (1690 to 1721) to the Walpole Era (1722 to 1740).

26
Party strength in a constituency is measured by four variables for each parliament. The first
variable is called ‘MAJORITY STRENGTH WHIG.’ It measures the average fraction of MPs
with the majority party in parliaments where the Whigs were in the majority. The average is
calculated over all months in a parliament as some MPs die or leave the House. The second
variable is called ‘MAJORITY STRENGTH TORY.’ It equals the average fraction of MPs with
the majority party in parliaments where the Tories were in the majority. As an example, at the
beginning of January 1713 the borough of Chester had one MP with the majority Tories and one
MP that was not with the majority Tories. The same two MPs represented Chester throughout the
1713 parliament so Chester’s value for MAJORITY STRENGTH TORY is 0.5 in the 1713
Parliament. In the 1695 Parliament, Chester started with one MP with the majority Whigs and
one MP that was not. In January of 1698 one of Chester’s MPs died. The new MP was not
classified as a Whig so the fraction of MPs with the Whigs fell to zero in that month. Across all
months in the 1695 parliament, the average fraction of MPs with the majority party was 0.406 for
Chester. Thus the value for MAJORITY STRENGTH WHIG is 0.406 in the 1698 parliament.
The third variable measuring party strength is simply called ‘WHIG STRENGTH.’ It equals
the variable MAJORITY STRENGTH WHIG in parliaments where the Whigs were in the
majority and one minus MAJORITY STRENGTH TORY in parliaments where the Tories were
in the majority. Thus WHIG STRENGTH combines the previous two variables into a single
index ranging between 0 and 1, summarizing the strength of Whig representation in the
constituency. An analogous variable for Tory strength could be calculated, but it provides no
new information, as it equals one minus WHIG STRENGTH. Readers should note that in
calculating WHIG STRENGTH an assumption is made. In a parliament with a Tory majority an
MP that is not a Tory is identified as a Whig. However, some MPs may have been independent

27
rather than being Whigs. Thus the existence of independent MPs will bias WHIG STRENGTH
upwards when the Tories are in the majority. When the Whigs are in the majority there is no bias
as independent MPs will be correctly identify as not Whig.
The fourth variable is called ‘SWING-STRONGHOLD-INDEPENDENT.’ It equals the
average of MAJORITY STRENGTH WHIG across all parliaments with Whig majorities plus the
average of MAJORITY STRENGTH TORY across all parliaments with Tory majorities.
SWING-STRONGHOLD-INDEPENDENT is close to 0 if a constituency usually had
‘independent’ MPs. That is it rarely had any MPs with the majority party. The variable equals 1
if the constituency was a party stronghold and always had MPs with either the Whigs or Tories.
Finally SWING-STRONGHOLD-INDEPENDENT is close to 2 if the constituency was a swing,
having mostly majority parties MPs irrespective of the party in the majority.
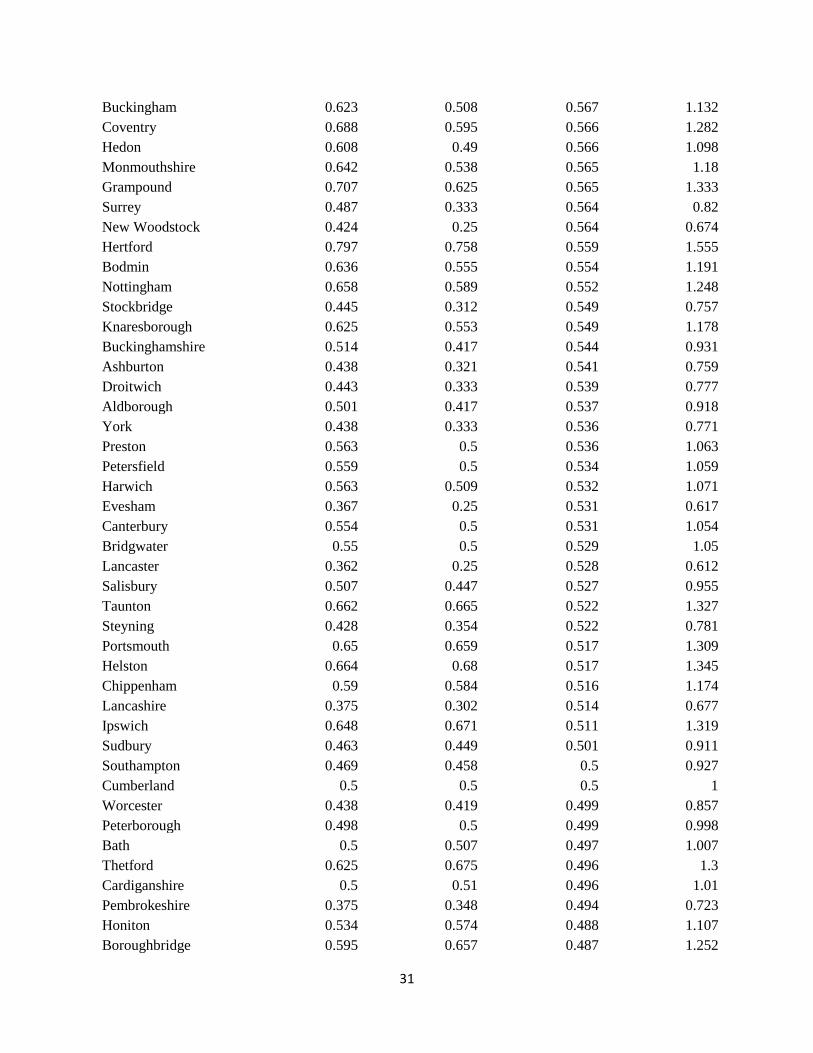
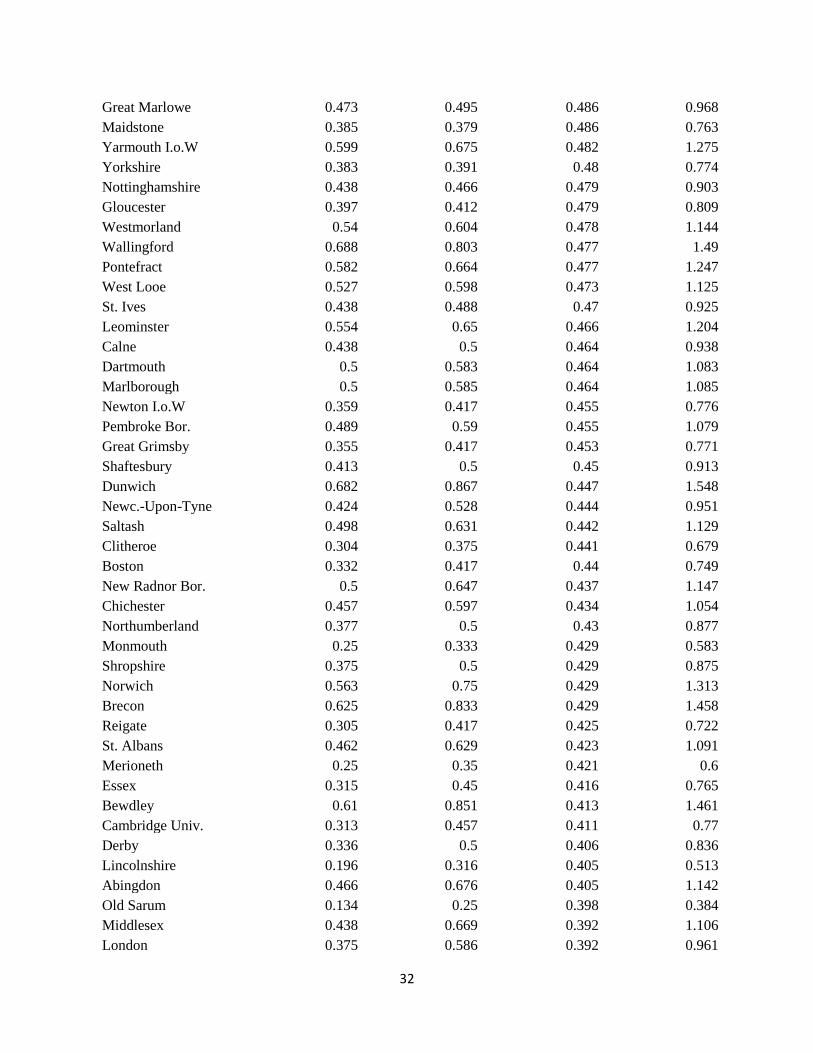
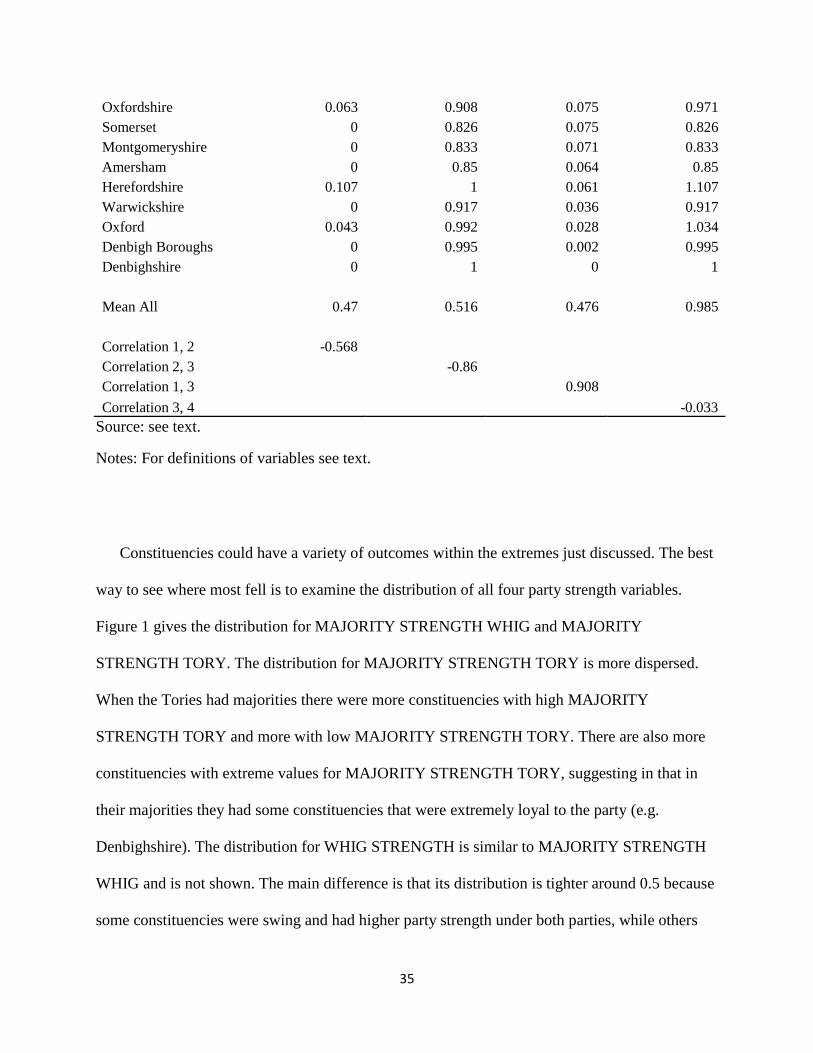
Table 4 lists all four variables for each constituency averaged across all parliaments from
1690 to 1740. MAJORITY STRENGTH TORY is higher than MAJORITY STRENGTH WHIG
suggesting that Tories had higher party strength on average. The mean for SWING-
STRONGHOLD-INDEPENDENT is close to 1 indicating the average constituency was closer to
a stronghold. The distribution for this variable is more interesting as shall be discussed
momentarily. As expected, MAJORITY STRENGTH TORY is negatively correlated with
MAJORITY STRENGTH WHIG and the composite variable WHIG STRENGTH. There is little
correlation between the party strength variables and SWING-STRONGHOLD-INDEPENDENT.
Some examples further illustrate the various measures. Lyme Regis, a borough in
Dorsetshire, was a Whig stronghold. It had a high value for MAJORITY STRENGTH WHIG
and low value for MAJORITY STRENGTH TORY. Also its SWING-STRONGHOLD-
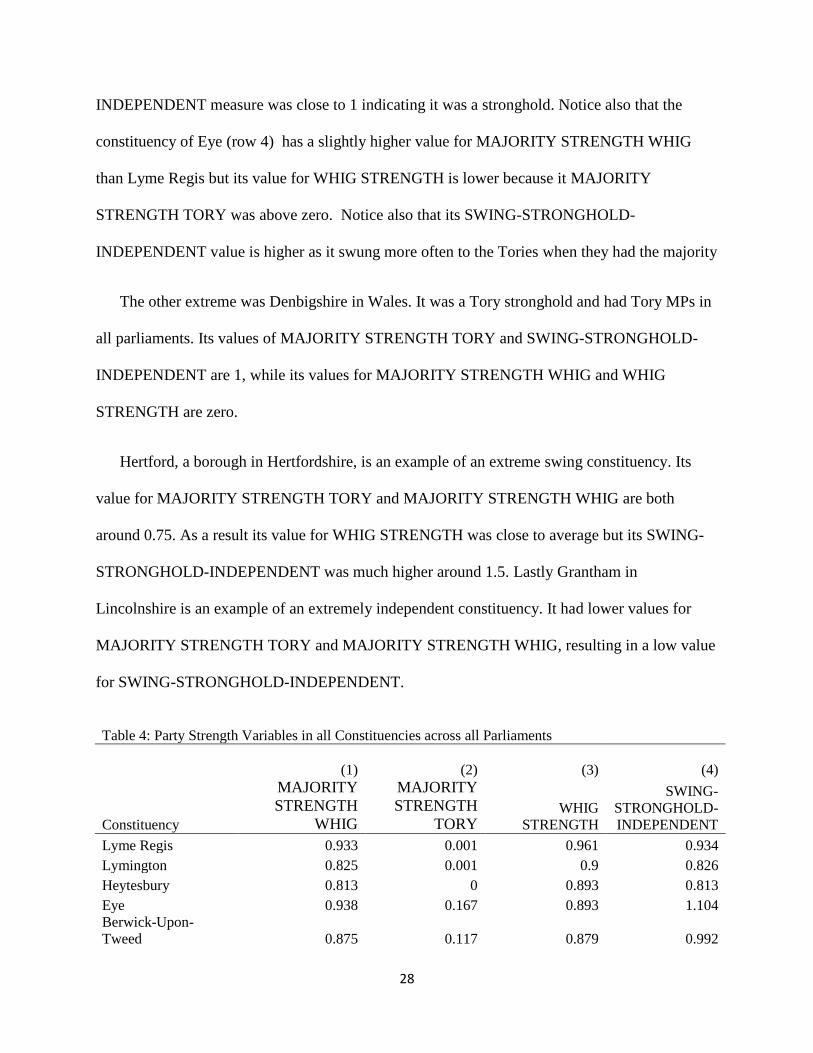
28
INDEPENDENT measure was close to 1 indicating it was a stronghold. Notice also that the
constituency of Eye (row 4) has a slightly higher value for MAJORITY STRENGTH WHIG
than Lyme Regis but its value for WHIG STRENGTH is lower because it MAJORITY
STRENGTH TORY was above zero. Notice also that its SWING-STRONGHOLD-
INDEPENDENT value is higher as it swung more often to the Tories when they had the majority
The other extreme was Denbigshire in Wales. It was a Tory stronghold and had Tory MPs in
all parliaments. Its values of MAJORITY STRENGTH TORY and SWING-STRONGHOLD-
INDEPENDENT are 1, while its values for MAJORITY STRENGTH WHIG and WHIG
STRENGTH are zero.
Hertford, a borough in Hertfordshire, is an example of an extreme swing constituency. Its
value for MAJORITY STRENGTH TORY and MAJORITY STRENGTH WHIG are both
around 0.75. As a result its value for WHIG STRENGTH was close to average but its SWING-
STRONGHOLD-INDEPENDENT was much higher around 1.5. Lastly Grantham in
Lincolnshire is an example of an extremely independent constituency. It had lower values for
MAJORITY STRENGTH TORY and MAJORITY STRENGTH WHIG, resulting in a low value
for SWING-STRONGHOLD-INDEPENDENT.
Table 4: Party Strength Variables in all Constituencies across all Parliaments
(1) (2) (3) (4)
Constituency
MAJORITY
STRENGTH
WHIG
MAJORITY
STRENGTH
TORY WHIG
STRENGTH
SWING-
STRONGHOLD-
INDEPENDENT
Lyme Regis 0.933 0.001 0.961 0.934
Lymington 0.825 0.001 0.9 0.826
Heytesbury 0.813 0 0.893 0.813
Eye 0.938 0.167 0.893 1.104
Berwick-Upon-
Tweed 0.875 0.117 0.879 0.992

29
Plympton Erle 0.817 0.04 0.878 0.857
Bletchingley 0.782 0 0.875 0.782
Bere Alston 0.807 0.043 0.871 0.85
Kingston-Upon-Hull 0.813 0.083 0.857 0.896
Wilton 1 0.338 0.855 1.338
Malton 0.75 0.008 0.854 0.758
Malmesbury 0.803 0.091 0.848 0.894
Hastings 0.92 0.252 0.846 1.173
Winchester 0.835 0.164 0.835 0.999
Seaford 0.891 0.25 0.83 1.141
King's Lynn 0.813 0.167 0.821 0.979
Tiverton 0.875 0.252 0.82 1.127
Lewes 0.779 0.175 0.798 0.954
New Windsor 0.873 0.305 0.797 1.177
Hampshire 0.89 0.335 0.794 1.225
Sandwich 0.807 0.235 0.789 1.042
Colchester 0.821 0.254 0.788 1.075
Castle Rising 0.753 0.167 0.788 0.92
Winchelsea 0.673 0.083 0.778 0.757
Whitchurch 0.857 0.333 0.776 1.19
Cockermouth 0.663 0.083 0.772 0.747
Northallerton 0.674 0.109 0.767 0.784
Andover 0.77 0.258 0.758 1.029
Arundel 0.681 0.141 0.757 0.822
Chipping Wycombe 0.641 0.088 0.757 0.728
Scarborough 0.79 0.297 0.753 1.087
Bristol 0.75 0.25 0.75 1
Tewkesbury 0.688 0.168 0.749 0.855
Poole 0.625 0.087 0.748 0.712
Carmarthenshire 0.682 0.167 0.747 0.849
Dover 0.677 0.167 0.744 0.843
Bedfordshire 0.732 0.25 0.74 0.982
Morpeth 0.688 0.197 0.737 0.884
Guildford 0.688 0.197 0.737 0.885
Horsham 0.924 0.525 0.731 1.449
Bishop's Castle 0.699 0.238 0.726 0.937
Rye 0.625 0.155 0.719 0.78
Much Wenlock 0.575 0.111 0.71 0.686
Westminster 0.866 0.5 0.709 1.366
Brackley 0.676 0.256 0.705 0.932
Wendover 0.691 0.284 0.702 0.974
New Shoreham 0.595 0.167 0.697 0.761
Bedford 0.657 0.25 0.697 0.907

30
Milborne Port 0.577 0.154 0.692 0.732
Thirsk 0.646 0.251 0.69 0.898
Liverpool 0.708 0.335 0.69 1.042
Plymouth 0.624 0.24 0.682 0.864
Tregony 0.643 0.267 0.682 0.91
Gloucestershire 0.689 0.333 0.68 1.023
Southwark 0.438 0.002 0.678 0.44
Cambridgeshire 0.655 0.306 0.672 0.961
Carlisle 0.695 0.365 0.669 1.061
Wareham 0.527 0.144 0.668 0.671
Newark 0.821 0.537 0.667 1.357
Queenborough 0.792 0.5 0.667 1.292
Bury St. Edmunds 0.631 0.308 0.657 0.939
Loswithiel 0.725 0.439 0.655 1.165
Richmond 0.638 0.333 0.65 0.971
Huntingdon 0.513 0.181 0.644 0.694
Sussex 0.813 0.583 0.643 1.396
Newport I.o.W 0.751 0.51 0.639 1.261
Devizes 0.759 0.523 0.638 1.283
Huntingdonshire 0.563 0.277 0.631 0.839
East Retford 0.689 0.461 0.625 1.151
Beverley 0.456 0.167 0.618 0.623
Truro 0.527 0.264 0.617 0.791
Gatton 0.447 0.167 0.613 0.614
New Romney 0.435 0.152 0.612 0.587
Weymouth/ Melc.
Regis 0.666 0.462 0.611 1.128
Downton 0.625 0.414 0.608 1.039
Aylesbury 0.625 0.417 0.607 1.042
Bramber 0.656 0.458 0.607 1.114
Grantham 0.313 0.007 0.604 0.319
Tavistock 0.552 0.333 0.601 0.885
Reading 0.537 0.333 0.592 0.87
Hythe 0.75 0.62 0.591 1.37
Bossiney 0.688 0.543 0.589 1.23
Bridport 0.525 0.333 0.586 0.858
Rochester 0.709 0.583 0.584 1.292
Mitchell 0.688 0.558 0.582 1.246
Cricklade 0.51 0.333 0.577 0.844
Cheshire 0.445 0.25 0.576 0.695
Norfolk 0.563 0.417 0.571 0.979
Northampton 0.566 0.425 0.57 0.991
Weobley 0.497 0.333 0.57 0.83
31
Buckingham 0.623 0.508 0.567 1.132
Coventry 0.688 0.595 0.566 1.282
Hedon 0.608 0.49 0.566 1.098
Monmouthshire 0.642 0.538 0.565 1.18
Grampound 0.707 0.625 0.565 1.333
Surrey 0.487 0.333 0.564 0.82
New Woodstock 0.424 0.25 0.564 0.674
Hertford 0.797 0.758 0.559 1.555
Bodmin 0.636 0.555 0.554 1.191
Nottingham 0.658 0.589 0.552 1.248
Stockbridge 0.445 0.312 0.549 0.757
Knaresborough 0.625 0.553 0.549 1.178
Buckinghamshire 0.514 0.417 0.544 0.931
Ashburton 0.438 0.321 0.541 0.759
Droitwich 0.443 0.333 0.539 0.777
Aldborough 0.501 0.417 0.537 0.918
York 0.438 0.333 0.536 0.771
Preston 0.563 0.5 0.536 1.063
Petersfield 0.559 0.5 0.534 1.059
Harwich 0.563 0.509 0.532 1.071
Evesham 0.367 0.25 0.531 0.617
Canterbury 0.554 0.5 0.531 1.054
Bridgwater 0.55 0.5 0.529 1.05
Lancaster 0.362 0.25 0.528 0.612
Salisbury 0.507 0.447 0.527 0.955
Taunton 0.662 0.665 0.522 1.327
Steyning 0.428 0.354 0.522 0.781
Portsmouth 0.65 0.659 0.517 1.309
Helston 0.664 0.68 0.517 1.345
Chippenham 0.59 0.584 0.516 1.174
Lancashire 0.375 0.302 0.514 0.677
Ipswich 0.648 0.671 0.511 1.319
Sudbury 0.463 0.449 0.501 0.911
Southampton 0.469 0.458 0.5 0.927
Cumberland 0.5 0.5 0.5 1
Worcester 0.438 0.419 0.499 0.857
Peterborough 0.498 0.5 0.499 0.998
Bath 0.5 0.507 0.497 1.007
Thetford 0.625 0.675 0.496 1.3
Cardiganshire 0.5 0.51 0.496 1.01
Pembrokeshire 0.375 0.348 0.494 0.723
Honiton 0.534 0.574 0.488 1.107
Boroughbridge 0.595 0.657 0.487 1.252
32
Great Marlowe 0.473 0.495 0.486 0.968
Maidstone 0.385 0.379 0.486 0.763
Yarmouth I.o.W 0.599 0.675 0.482 1.275
Yorkshire 0.383 0.391 0.48 0.774
Nottinghamshire 0.438 0.466 0.479 0.903
Gloucester 0.397 0.412 0.479 0.809
Westmorland 0.54 0.604 0.478 1.144
Wallingford 0.688 0.803 0.477 1.49
Pontefract 0.582 0.664 0.477 1.247
West Looe 0.527 0.598 0.473 1.125
St. Ives 0.438 0.488 0.47 0.925
Leominster 0.554 0.65 0.466 1.204
Calne 0.438 0.5 0.464 0.938
Dartmouth 0.5 0.583 0.464 1.083
Marlborough 0.5 0.585 0.464 1.085
Newton I.o.W 0.359 0.417 0.455 0.776
Pembroke Bor. 0.489 0.59 0.455 1.079
Great Grimsby 0.355 0.417 0.453 0.771
Shaftesbury 0.413 0.5 0.45 0.913
Dunwich 0.682 0.867 0.447 1.548
Newc.-Upon-Tyne 0.424 0.528 0.444 0.951
Saltash 0.498 0.631 0.442 1.129
Clitheroe 0.304 0.375 0.441 0.679
Boston 0.332 0.417 0.44 0.749
New Radnor Bor. 0.5 0.647 0.437 1.147
Chichester 0.457 0.597 0.434 1.054
Northumberland 0.377 0.5 0.43 0.877
Monmouth 0.25 0.333 0.429 0.583
Shropshire 0.375 0.5 0.429 0.875
Norwich 0.563 0.75 0.429 1.313
Brecon 0.625 0.833 0.429 1.458
Reigate 0.305 0.417 0.425 0.722
St. Albans 0.462 0.629 0.423 1.091
Merioneth 0.25 0.35 0.421 0.6
Essex 0.315 0.45 0.416 0.765
Bewdley 0.61 0.851 0.413 1.461
Cambridge Univ. 0.313 0.457 0.411 0.77
Derby 0.336 0.5 0.406 0.836
Lincolnshire 0.196 0.316 0.405 0.513
Abingdon 0.466 0.676 0.405 1.142
Old Sarum 0.134 0.25 0.398 0.384
Middlesex 0.438 0.669 0.392 1.106
London 0.375 0.586 0.392 0.961

33
Ilchester 0.429 0.667 0.388 1.096
Wigan 0.375 0.595 0.388 0.97
Liskeard 0.49 0.75 0.387 1.24
Newport 0.301 0.5 0.386 0.801
Penryn 0.386 0.614 0.386 1
Higham Ferrers 0.167 0.333 0.381 0.501
Bridgnorth 0.287 0.5 0.378 0.787
Lichfield 0.529 0.833 0.374 1.362
Great Bedwyn 0.439 0.715 0.373 1.154
Leicester 0.25 0.501 0.357 0.751
East Grinstead 0.498 0.833 0.356 1.331
Rutland 0.304 0.576 0.355 0.88
Hereford 0.369 0.667 0.354 1.036
Tamworth 0.359 0.654 0.353 1.013
Appleby 0.253 0.513 0.353 0.766
Great Yarmouth 0.289 0.579 0.345 0.868
Ripon 0.222 0.5 0.341 0.722
Ludlow 0.355 0.679 0.341 1.034
Durham City 0.5 0.874 0.34 1.374
Camelford 0.553 0.955 0.335 1.508
East Looe 0.46 0.833 0.334 1.293
Hindon 0.25 0.56 0.331 0.81
Stafford 0.279 0.599 0.331 0.878
Kent 0.378 0.742 0.326 1.12
Midhurst 0.273 0.609 0.323 0.882
Carmarthen 0.313 0.667 0.322 0.98
Cambridge 0.125 0.417 0.321 0.542
Dorchester 0.307 0.678 0.313 0.985
St. Mawes 0.415 0.832 0.309 1.247
Haslemere 0.25 0.614 0.308 0.864
Leicestershire 0.396 0.812 0.307 1.208
Cardigan Boroughs 0.284 0.667 0.305 0.951
Maldon 0.382 0.819 0.296 1.2
Flint Boroughs 0.125 0.48 0.294 0.605
Worcestershire 0.259 0.667 0.291 0.926
Christchurch 0.375 0.828 0.288 1.203
Berkshire 0.25 0.667 0.286 0.917
Breconshire 0.25 0.667 0.286 0.917
Caernarvon
Boroughs 0.375 0.833 0.286 1.208
Radnorshire 0.5 1 0.286 1.5
Minehead 0.353 0.816 0.28 1.169
Orford 0.302 0.75 0.279 1.052

34
Newc.-Under-Lyme 0.296 0.757 0.273 1.053
Durham County 0.188 0.613 0.273 0.801
St. Germans 0.261 0.713 0.272 0.974
Caernarvonshire 0.474 1 0.271 1.474
Totnes 0.438 0.99 0.254 1.428
Montgomery
Boroughs 0.25 0.784 0.235 1.034
Cornwall 0.25 0.793 0.232 1.043
Wootton Bassett 0.313 0.88 0.23 1.193
Corfe Castle 0.33 0.917 0.224 1.246
Cirencester 0.188 0.74 0.219 0.928
Suffolk 0.063 0.583 0.214 0.646
Northamptonshire 0.125 0.667 0.214 0.792
Wiltshire 0.313 0.917 0.214 1.229
Ludgershall 0.281 0.889 0.208 1.17
Hertfordshire 0.047 0.582 0.206 0.629
Cardiff Boroughs 0.125 0.704 0.198 0.829
Callington 0.27 0.913 0.192 1.184
Anglesey 0.306 0.97 0.188 1.275
Glamorgan 0.194 0.829 0.184 1.023
Barnstaple 0.134 0.75 0.184 0.884
Stamford 0.078 0.678 0.183 0.756
Exeter 0.257 0.917 0.182 1.173
Fowey 0.317 1 0.181 1.317
Derbyshire 0.125 0.75 0.179 0.875
Westbury 0.098 0.738 0.169 0.836
Aldeburgh 0.284 1 0.162 1.284
Shrewsbury 0.27 1 0.155 1.27
Newton 0 0.654 0.148 0.654
Lincoln 0.133 0.833 0.147 0.966
Flintshire 0 0.662 0.145 0.662
Banbury 0.25 1 0.143 1.25
Wells 0.247 1 0.141 1.247
Chester 0.051 0.742 0.139 0.793
Haverfordwest 0.118 0.833 0.139 0.951
Okehampton 0 0.725 0.118 0.725
Beaumaris 0 0.742 0.11 0.742
Launceston 0.097 0.876 0.109 0.973
Dorset 0.063 0.833 0.107 0.896
Warwick 0.063 0.838 0.105 0.901
Devon 0 0.8 0.086 0.8
Staffordshire 0.063 0.888 0.084 0.951
Oxford University 0 0.825 0.075 0.825
35
Oxfordshire 0.063 0.908 0.075 0.971
Somerset 0 0.826 0.075 0.826
Montgomeryshire 0 0.833 0.071 0.833
Amersham 0 0.85 0.064 0.85
Herefordshire 0.107 1 0.061 1.107
Warwickshire 0 0.917 0.036 0.917
Oxford 0.043 0.992 0.028 1.034
Denbigh Boroughs 0 0.995 0.002 0.995
Denbighshire 0 1 0 1
Mean All 0.47 0.516 0.476 0.985
Correlation 1, 2 -0.568
Correlation 2, 3 -0.86
Correlation 1, 3
0.908
Correlation 3, 4 -0.033
Source: see text.
Notes: For definitions of variables see text.
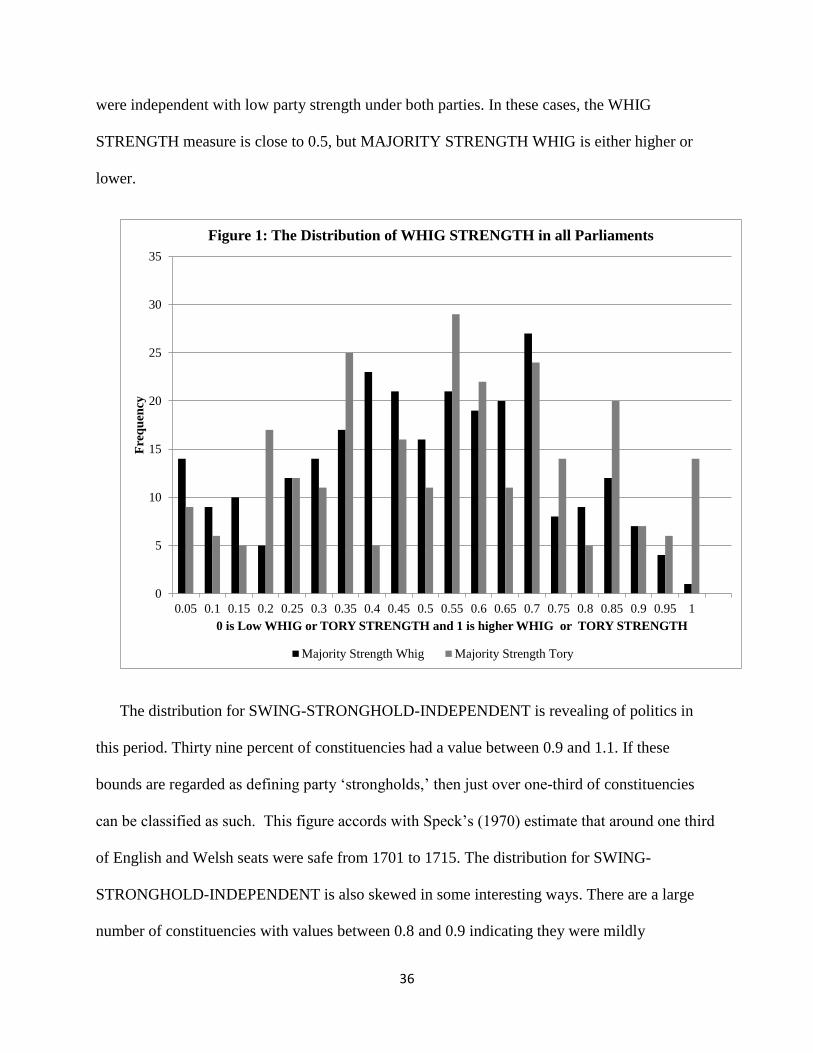
Constituencies could have a variety of outcomes within the extremes just discussed. The best
way to see where most fell is to examine the distribution of all four party strength variables.
Figure 1 gives the distribution for MAJORITY STRENGTH WHIG and MAJORITY
STRENGTH TORY. The distribution for MAJORITY STRENGTH TORY is more dispersed.
When the Tories had majorities there were more constituencies with high MAJORITY
STRENGTH TORY and more with low MAJORITY STRENGTH TORY. There are also more
constituencies with extreme values for MAJORITY STRENGTH TORY, suggesting in that in
their majorities they had some constituencies that were extremely loyal to the party (e.g.
Denbighshire). The distribution for WHIG STRENGTH is similar to MAJORITY STRENGTH
WHIG and is not shown. The main difference is that its distribution is tighter around 0.5 because
some constituencies were swing and had higher party strength under both parties, while others
36
were independent with low party strength under both parties. In these cases, the WHIG
STRENGTH measure is close to 0.5, but MAJORITY STRENGTH WHIG is either higher or
lower.
The distribution for SWING-STRONGHOLD-INDEPENDENT is revealing of politics in
this period. Thirty nine percent of constituencies had a value between 0.9 and 1.1. If these
bounds are regarded as defining party ‘strongholds,’ then just over one-third of constituencies
can be classified as such. This figure accords with Speck’s (1970) estimate that around one third
of English and Welsh seats were safe from 1701 to 1715. The distribution for SWING-
STRONGHOLD-INDEPENDENT is also skewed in some interesting ways. There are a large
number of constituencies with values between 0.8 and 0.9 indicating they were mildly
0
5
10
15
20
25
30
35
0.05 0.1 0.15 0.2 0.25 0.3 0.35 0.4 0.45 0.5 0.55 0.6 0.65 0.7 0.75 0.8 0.85 0.9 0.95 1
Fre
qu
ency
0 is Low WHIG or TORY STRENGTH and 1 is higher WHIG or TORY STRENGTH
Figure 1: The Distribution of WHIG STRENGTH in all Parliaments
Majority Strength Whig Majority Strength Tory

37
independent of the two parties. There were also a fair number of constituencies with values
between 1.3 and 1.4 indicating they would swing to both parties depending on who was in the
majority. If 1.2 is regarded as the lower bound for swing constituencies, then around 25 percent
can be classified as such.
Testing for Differences in Party Strength by Constituency Type
The Whigs and Tories drew electoral support from different groups. In this section I establish
in which types of constituencies each party was strong. I also identify which constituencies were
more independent, party strongholds, or swing. It is useful to begin with the two general types of
constituencies: counties and municipal boroughs. Counties generally represented rural areas and
agricultural interests, while boroughs were cities and towns and therefore they tended to
0
5
10
15
20
25
30
35
0.05 0.15 0.25 0.35 0.45 0.55 0.65 0.75 0.85 0.95 1.05 1.15 1.25 1.35 1.45 1.55 1.65 1.75 1.85 1.95
Fre
qu
ency
0 is Independent 1 is Stronghold 2 is Swing
Figure 2: Swing-Stronghold-Independent Frequency

38
represented urban interests. These generalizations are not exact as some boroughs were quite
small by the early eighteenth century and were later known as ‘rotten’ boroughs. Nevertheless
boroughs were more reflective of urban interests than counties.
The first set of rows in table 4 report the means of MAJORITY STRENGTH WHIG and
MAJORITY STRENGTH TORY for each type. The next set of rows shows the t-statistic and p-
value testing for the difference in means. The means for counties and boroughs are based on the
average values for each constituency across all parliaments from 1690 to 1734. Recall that
MAJORITY STRENGTH WHIG is only calculated when the Whigs have a majority and the
same rule is applied for MAJORITY STRENGTH TORY
One immediate finding is that MAJORITY STRENGTH WHIG is 0.16 higher for municipal
boroughs compared to counties. The difference is statistically significant. The opposite pattern is
found for MAJORITY STRENGTH TORY with county constituencies have a significantly
higher value. The last finding is consistent with the view that the Tories were more popular in
counties because of voter characteristics. In the counties any freeholder possessing property
worth more than 40 shillings a year had the right to vote. As the Tories were generally supported
by country gentlemen or small landowners, the typical county voter was a Tory voter. This
electoral match translated into greater representation for the Tories. On the Whig side, the results
would seem to be consistent with their greater connections with mercantile and financial interests
as these groups tended to be stronger in cities. However, once I distinguish between the boroughs
based on the size of their electorate that interpretation is less clear.
To examine this point further consider that boroughs with smaller electorates were generally
smaller towns. The opposite generally holds for boroughs with large electorates. An example is
39
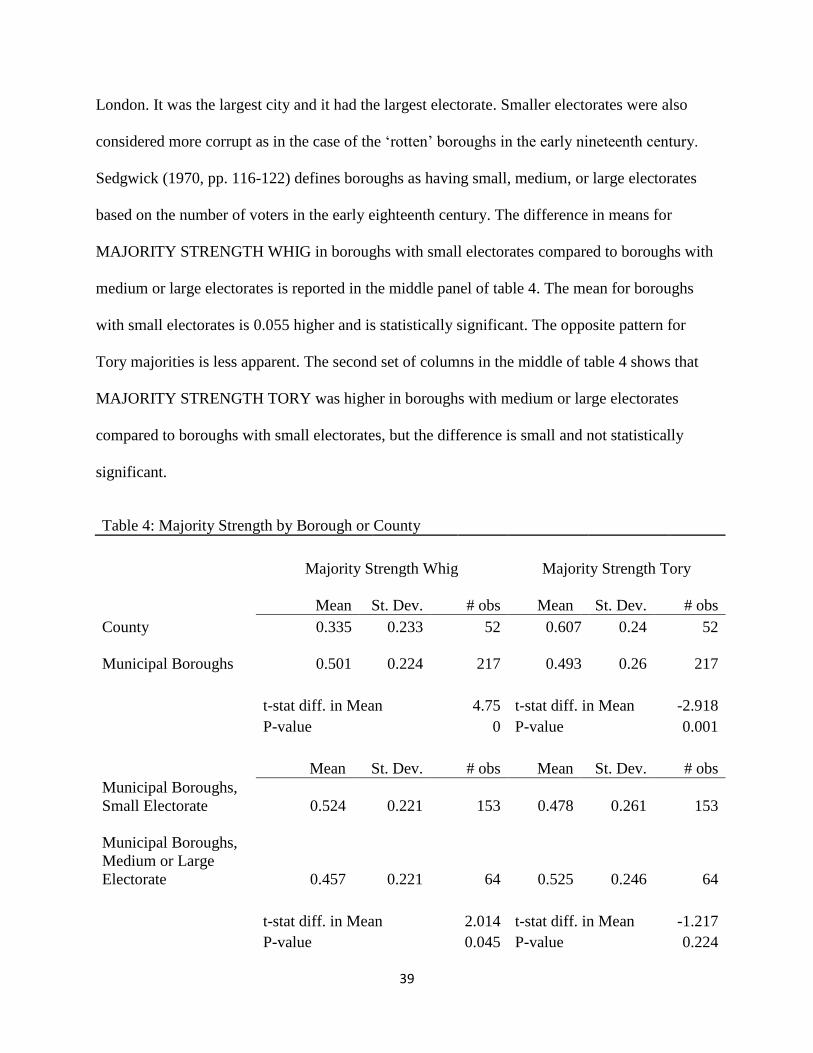
London. It was the largest city and it had the largest electorate. Smaller electorates were also
considered more corrupt as in the case of the ‘rotten’ boroughs in the early nineteenth century.
Sedgwick (1970, pp. 116-122) defines boroughs as having small, medium, or large electorates
based on the number of voters in the early eighteenth century. The difference in means for
MAJORITY STRENGTH WHIG in boroughs with small electorates compared to boroughs with
medium or large electorates is reported in the middle panel of table 4. The mean for boroughs
with small electorates is 0.055 higher and is statistically significant. The opposite pattern for
Tory majorities is less apparent. The second set of columns in the middle of table 4 shows that
MAJORITY STRENGTH TORY was higher in boroughs with medium or large electorates
compared to boroughs with small electorates, but the difference is small and not statistically
significant.
Table 4: Majority Strength by Borough or County
Majority Strength Whig Majority Strength Tory
Mean St. Dev. # obs Mean St. Dev. # obs
County 0.335 0.233 52 0.607 0.24 52
Municipal Boroughs 0.501 0.224 217 0.493 0.26 217
t-stat diff. in Mean 4.75 t-stat diff. in Mean -2.918
P-value
0 P-value
0.001
Mean St. Dev. # obs Mean St. Dev. # obs
Municipal Boroughs,
Small Electorate 0.524 0.221 153 0.478 0.261 153
Municipal Boroughs,
Medium or Large
Electorate 0.457 0.221 64 0.525 0.246 64
t-stat diff. in Mean 2.014 t-stat diff. in Mean -1.217
P-value
0.045 P-value
0.224

40
Mean St. Dev. # obs Mean St. Dev. # obs
Boroughs, Franchise
in Householder 0.455 0.185 12 0.586 0.204 12
Boroughs, franchise in
Freeman or Freeholder 0.488 0.222 110 0.512 0.277 110
Boroughs, franchise in
Scot and Lot 0.491 0.229 36 0.479 0.257 36
Boroughs, franchise in
corporation 0.594 0.204 27 0.472 0.21 27
Boroughs, franchise in
burgage holders 0.52 0.238 30 0.414 0.228 30
Freeman and Freeholder vs.
Corporation and Burgage
Freeman and Freeholder vs.
Corporation and Burgage
t-stat diff. in Mean 1.828 t-stat diff. in Mean -1.659
P-value 0.069 P-value 0.099
Notes: for variable definitions see text.
The legal nature of the franchise is a related dimension revealing differences between the two
parties. Boroughs where the franchise was held by corporation members or burgage holders
usually had a relatively narrow or oligarchical electorate. Corporation members could be
restricted to a small group of families. Burgage holders were individuals who had the right to
vote because they owned a specific piece of property in the borough. These properties were often
scarce and were purchased almost entirely because they conferred the right to vote. By
comparison, if the franchise was held by freeholders, freeman, or households the electorate was
usually broader or more democratic. Freeholders included small and medium landowners.
Freeman often included shopkeepers and guildsman and thus a broader segment of the city.
Households were the most encompassing category of all. Scot and Lot boroughs occupy a mixed
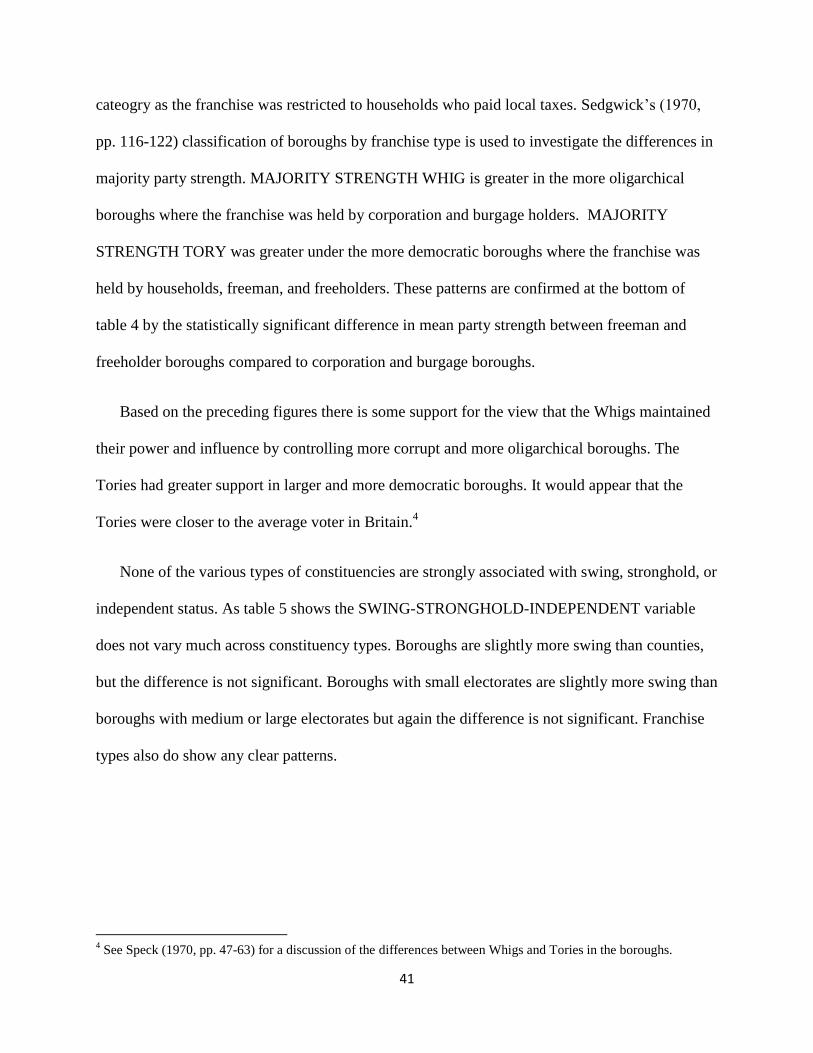
41
cateogry as the franchise was restricted to households who paid local taxes. Sedgwick’s (1970,
pp. 116-122) classification of boroughs by franchise type is used to investigate the differences in
majority party strength. MAJORITY STRENGTH WHIG is greater in the more oligarchical
boroughs where the franchise was held by corporation and burgage holders. MAJORITY
STRENGTH TORY was greater under the more democratic boroughs where the franchise was
held by households, freeman, and freeholders. These patterns are confirmed at the bottom of
table 4 by the statistically significant difference in mean party strength between freeman and
freeholder boroughs compared to corporation and burgage boroughs.
Based on the preceding figures there is some support for the view that the Whigs maintained
their power and influence by controlling more corrupt and more oligarchical boroughs. The
Tories had greater support in larger and more democratic boroughs. It would appear that the
Tories were closer to the average voter in Britain.4
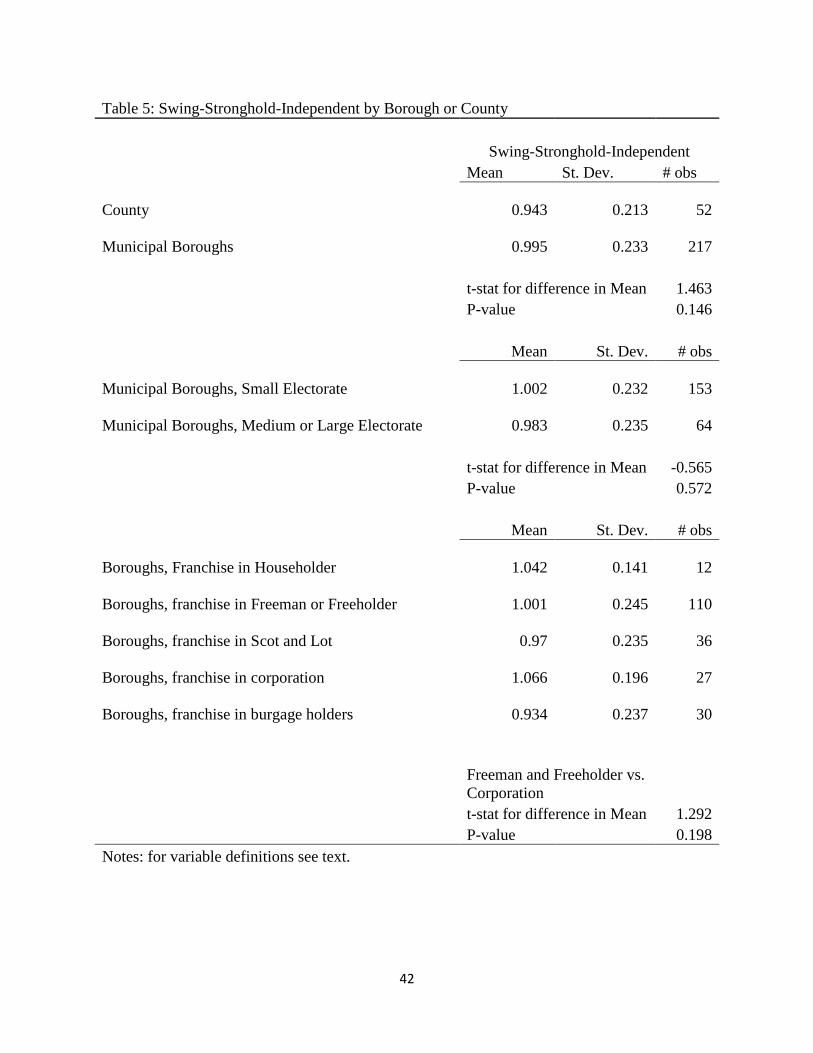
None of the various types of constituencies are strongly associated with swing, stronghold, or
independent status. As table 5 shows the SWING-STRONGHOLD-INDEPENDENT variable
does not vary much across constituency types. Boroughs are slightly more swing than counties,
but the difference is not significant. Boroughs with small electorates are slightly more swing than
boroughs with medium or large electorates but again the difference is not significant. Franchise
types also do show any clear patterns.
4 See Speck (1970, pp. 47-63) for a discussion of the differences between Whigs and Tories in the boroughs.
42
Table 5: Swing-Stronghold-Independent by Borough or County
Swing-Stronghold-Independent
Mean St. Dev. # obs
County 0.943 0.213 52
Municipal Boroughs 0.995 0.233 217
t-stat for difference in Mean 1.463
P-value
0.146
Mean St. Dev. # obs
Municipal Boroughs, Small Electorate 1.002 0.232 153
Municipal Boroughs, Medium or Large Electorate 0.983 0.235 64
t-stat for difference in Mean -0.565
P-value
0.572
Mean St. Dev. # obs
Boroughs, Franchise in Householder 1.042 0.141 12
Boroughs, franchise in Freeman or Freeholder 1.001 0.245 110
Boroughs, franchise in Scot and Lot 0.97 0.235 36
Boroughs, franchise in corporation 1.066 0.196 27
Boroughs, franchise in burgage holders 0.934 0.237 30
Freeman and Freeholder vs.
Corporation
t-stat for difference in Mean 1.292
P-value 0.198
Notes: for variable definitions see text.

43
Party Strength across Space
One of the most important differences among constituencies was their location. Economic
interests and political traditions varied across space and as it turns out the Whigs and Tories had
different strengths in certain regions. Map 1 shown earlier illustrates WHIG STRENGTH across
counties. Map 2 illustrates WHIG STRENGTH in municipal boroughs. The maps suggest a
general pattern where the Whigs were stronger in southeastern and northern counties and weaker
in midland, Welsh, and southwestern counties. The patterns are similar in boroughs. The Whigs
were stronger in southeastern and northern boroughs and less elsewhere. The regional patterns
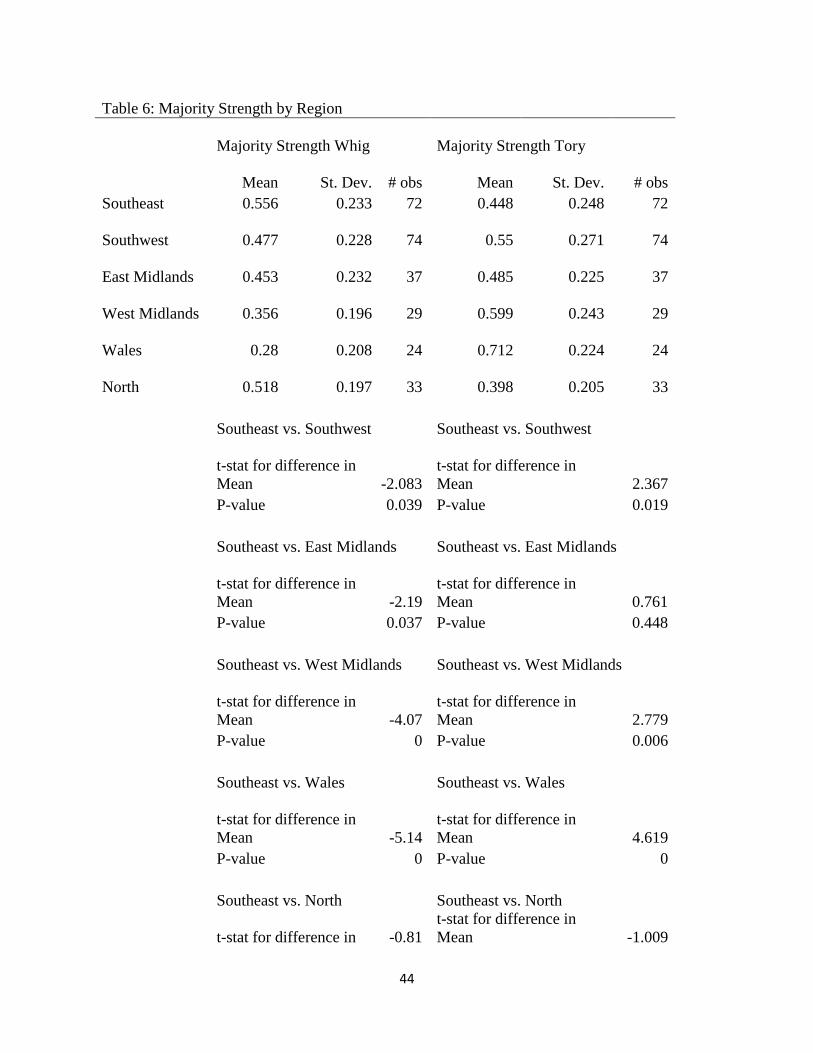
are also evident after assigning constituencies to one of five exclusive regions: the Southeast, the
Southwest, The East Midlands, the West Midlands, Wales, and the North. The averages for
MAJORITY STRENGTH WHIG and MAJORITY STRENGTH TORY in each region are
reported in table 6. MAJORITY STRENGTH WHIG is highest in the Southeast and the North
across all parliaments. It is lowest in Wales and the West Midlands. The Southwest and East
Midlands are close to the national average but still below the Southeast. MAJORITY
STRENGTH TORY shows the opposite pattern being low in the Southeast and North and
highest in Wales. The bottom of table 6 shows that the difference between MAJORITY
STRENGTH WHIG in the Southeast and other regions is statistically significant except for the
North where they are nearly identical. MAJORITY STRENGTH TORY is statistically different
in the Southeast compared to other regions except for the North and East Midlands.
44
Table 6: Majority Strength by Region
Majority Strength Whig Majority Strength Tory
Mean St. Dev. # obs Mean St. Dev. # obs
Southeast 0.556 0.233 72 0.448 0.248 72
Southwest 0.477 0.228 74 0.55 0.271 74
East Midlands 0.453 0.232 37 0.485 0.225 37
West Midlands 0.356 0.196 29 0.599 0.243 29
Wales 0.28 0.208 24 0.712 0.224 24
North 0.518 0.197 33 0.398 0.205 33
Southeast vs. Southwest Southeast vs. Southwest
t-stat for difference in
Mean -2.083
t-stat for difference in
Mean 2.367
P-value
0.039 P-value
0.019
Southeast vs. East Midlands Southeast vs. East Midlands
t-stat for difference in
Mean -2.19
t-stat for difference in
Mean 0.761
P-value
0.037 P-value
0.448
Southeast vs. West Midlands Southeast vs. West Midlands
t-stat for difference in
Mean -4.07
t-stat for difference in
Mean 2.779
P-value
0 P-value
0.006
Southeast vs. Wales
Southeast vs. Wales
t-stat for difference in
Mean -5.14
t-stat for difference in
Mean 4.619
P-value
0 P-value
0
Southeast vs. North
Southeast vs. North
t-stat for difference in -0.81
t-stat for difference in
Mean -1.009

45
Mean
P-value 0.414 P-value 0.315
Notes: for variable definitions see text.
The greater representation by the Whigs in the Southeast fits with the Whigs’ close ties to
financial and mercantile interests in London. Also a number of port and naval cities in the
Southeast would have benefitted from the Whig’s more aggressive stance on foreign policy. The
Tories’ greater representation in Wales and the West Midlands is consistent with these regions
being more conservative in terms of foreign policy. The prominence of the gentry in the West
Midlands might also explain the strength of the Tories there. Speck (1970, p. 67) also notes that
Wales and the West were bastions of the Royalist cause during the Civil War suggesting a long
term link to the Tories in this region.
Differences in religion are another reason party strength varied across regions. Recall that the
Tories were more strongly allied with the Church of England and the Whigs were more closely
connected to ‘dissenter’ religions. The relationship between party strength and religion can be
studied more systematically using Watts’ (1978) estimates for the percent of the population who
were dissenters (e.g. Presbyterians, Independents, Baptists, and Quakers). Watts data is given for
each county during the early eighteenth century. The average size of the dissenting population
across counties is just above 6 percent with the southeastern and southwestern counties generally
having higher dissenting populations than the Midlands, North, and Wales. The dissenter
percentage in each county was matched to its county constituency and to the municipal boroughs
by the county of location. A regression of majority party strength in each constituency on the
percent of dissenting population shows the connection between religion and majority party
strength.

46
The results are reported in table 7. In the first two columns MAJORITY STRENGTH WHIG
is the dependent variable. In column one there are no other variables except the Percent Dissenter
population in County and the relationship is found to be positive and significant. When dummy
variables for region, county or borough, size of electorate, and type of borough franchise are
added in column 2 the relationship between dissenters and Whig strength weakens and becomes
statistically insignificant. Thus it appears that the dissenting population is correlated with
constituency types and region and that the latter explain variation in Whig strength better.
The connection between dissenting population and Tory strength is shown in columns 3 and
4 where the dependent variable is MAJORITY STRENGTH TORY. Here the results show a
robust and negative relationship between the dissenting population and Tory party strength. It
appears that Tory strength was more sensitive to the size of religious groups in the electorate.
Presumably Tory candidates were less appealing in counties with high dissenter populations
because they were more aggressive in supporting the Church of England.
Table 7: The Connection between Dissenters and Majority Strength
Majority Strength Whig Majority Strength Tory
(1)
Coefficient
(2)
Coefficient
(3)
Coefficient
(4)
Coefficient
Variable Stand. Err. Stand. Err. Stand. Err. Stand. Err.
Percent Dissenter population in
County 0.009 0.007 -0.013 -0.013
0.004** 0.004 0.005*** 0.005***
Dummy variables for Constituency
Type No Yes No Yes
Dummy variables for Region No Yes No Yes
N 269 269 269 269
R-Square 0.14 0.22 0.085 0.17

47
Notes: Robust Standard errors are reported. ** and *** indicate statistical significance at the 5
and 1 percent confidence level respectfully.
Sources: For percent of dissenter population see Watts (1978, pp. 509-510.)
III.
Britain’s party system changed after the 1715 parliament. The Tories became a weaker party
and were not a strong opposition. On the Whig side, Walpole emerged as a charismatic leader,
but his party began to splinter with the rise of the Opposition Whigs. The Whig leaders also
became narrower and arguably corrupt under Walpole, giving rise to the moniker the ‘Whig
Oligarchs.’ The constituencies where the Whigs were strong changed somewhat from the Rage
of Party to the Age of Walpole, but many patterns were similar in both periods.
The Rage of Party is defined to be all parliaments from 1690 up to and including 1715. The
Walpole Era is defined by all parliaments from 1722 up to and including the 1734 parliament.
Table 8 reports the means of MAJORITY STRENGTH WHIG by borough and county averaged
across all parliaments in the two time periods. Tories were never in the majority after 1713 so it
is not meaningful to compare MAJORITY STRENGTH TORY before and after 1715. Some of
the patterns reported above held in both periods. For example, MAJORITY STRENGTH WHIG
is significantly larger in boroughs than counties during the Rage of Party and the Walpole Era.
The magnitude of the difference increased however. During Walpole Era the Whigs were even
stronger in boroughs and even weaker in the counties. The Walpole Whigs were also especially
strong in boroughs with small electorates. It would appear that the Whigs became much stronger
in these smaller cities or towns under Walpole. During the Rage of Party there was no statistical
difference in MAJORITY STRENGTH WHIG between boroughs with small, medium, or large
electorates.

48
One might presume that under Walpole the Whigs did better in less democratic boroughs, but
the results on franchise provide weak support. Under Walpole, MAJORITY STRENGTH WHIG
is largest in boroughs where the franchise is held by corporation members. However,
Householder boroughs, where the franchise was largest, seem to have shifted to the Whigs under
Walpole. Also MAJORITY STRENGTH WHIG in Burgage boroughs, which were less
democratic, was not much larger than freeman or free holder boroughs in the Walpole Era. The t-
tests at the bottom of table 8 suggest that I cannot reject the hypothesis that the Whigs were just
as strong in less democratic boroughs in the Walpole Era.
Table 8: Majority Strength Whig in the Rage of Party and Walpole Era
Rage of Party Walpole Era
Mean St. Dev. # obs Mean St. Dev. # obs
County 0.374 0.253 52 0.269 0.317 52
Municipal Boroughs 0.471 0.252 217 0.552 0.297 217
t-stat for diff. in mean 2.468 t-stat for diff. in mean 6.063
P-value
0.014 P-value
0
Mean St. Dev. # obs Mean St. Dev. # obs
Boroughs, Small Electorate 0.484 0.247 153 0.59 0.294 153
Boroughs, Medium or Large
Electorate 0.45 0.26 64 0.467 0.286 64
t-stat for diff. in mean -0.889 t-stat for diff. in mean -2.79
P-value
0.374 P-value
0.006
Mean St. Dev. # obs Mean St. Dev. # obs
Boroughs, Franchise in 0.362 0.226 12 0.612 0.194 12
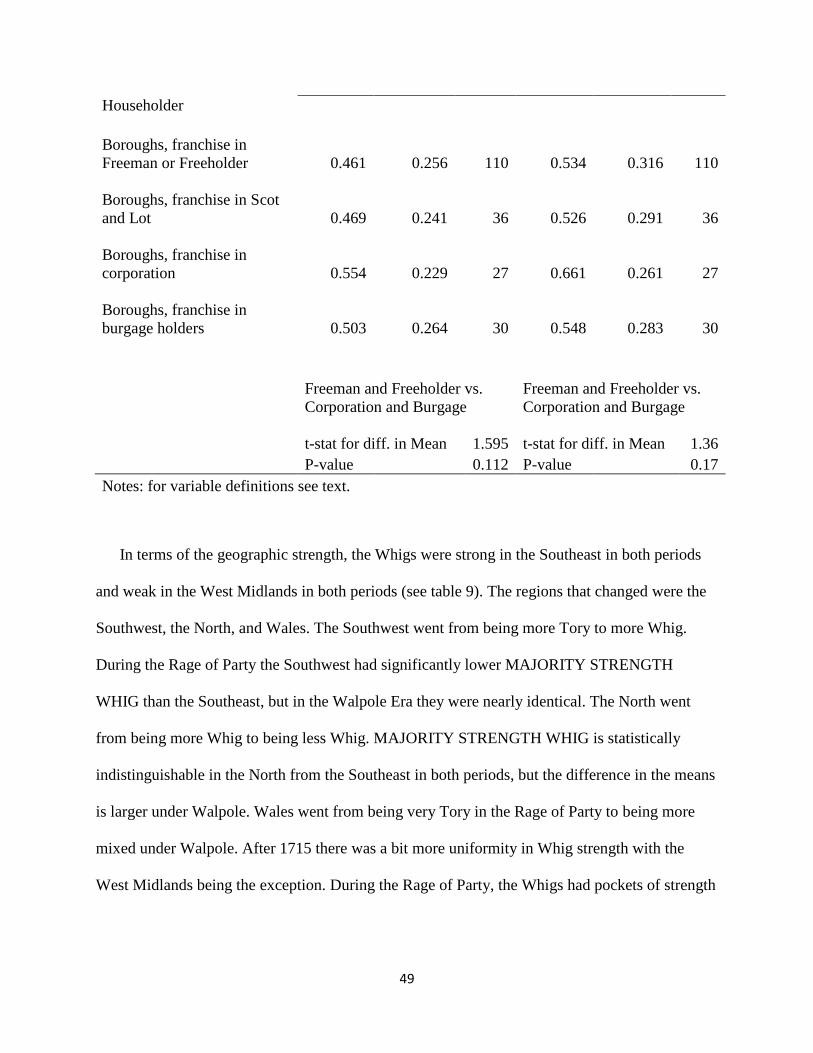
49
Householder
Boroughs, franchise in
Freeman or Freeholder 0.461 0.256 110 0.534 0.316 110
Boroughs, franchise in Scot
and Lot 0.469 0.241 36 0.526 0.291 36
Boroughs, franchise in
corporation 0.554 0.229 27 0.661 0.261 27
Boroughs, franchise in
burgage holders 0.503 0.264 30 0.548 0.283 30
Freeman and Freeholder vs.
Corporation and Burgage
Freeman and Freeholder vs.
Corporation and Burgage
t-stat for diff. in Mean 1.595 t-stat for diff. in Mean 1.36
P-value 0.112 P-value 0.17
Notes: for variable definitions see text.
In terms of the geographic strength, the Whigs were strong in the Southeast in both periods
and weak in the West Midlands in both periods (see table 9). The regions that changed were the
Southwest, the North, and Wales. The Southwest went from being more Tory to more Whig.
During the Rage of Party the Southwest had significantly lower MAJORITY STRENGTH
WHIG than the Southeast, but in the Walpole Era they were nearly identical. The North went
from being more Whig to being less Whig. MAJORITY STRENGTH WHIG is statistically
indistinguishable in the North from the Southeast in both periods, but the difference in the means
is larger under Walpole. Wales went from being very Tory in the Rage of Party to being more
mixed under Walpole. After 1715 there was a bit more uniformity in Whig strength with the
West Midlands being the exception. During the Rage of Party, the Whigs had pockets of strength

50
and weakness with two dividing lines. The Whigs were strongest in the Southeast and North, and
weakest in the Southwest, the Midlands, and Wales.
Table 9: Majority Strength Whig by Region
Rage of Party Walpole Era
Mean St. Dev. # obs Mean St. Dev. # obs
Southeast 0.555 0.238 72 0.558 0.315 72
Southwest 0.431 0.26 74 0.552 0.302 74
East Midlands 0.444 0.239 37 0.468 0.317 37
West Midlands 0.374 0.222 29 0.325 0.278 29
Wales 0.185 0.158 24 0.439 0.427 24
North
0.547
0.215
33
0.47
0.274
33
Southeast vs. Southwest Southeast vs. Southwest
t-stat for diff. in mean -2.99 t-stat for diff. in mean -0.114
P-value
0.03 P-value
0.9
Southeast vs. East Midlands Southeast vs. East Midlands
t-stat for diff. in mean -2.30 t-stat for diff. in mean -1.406
P-value
0.022 P-value
0.164
Southeast vs. West Midlands Southeast vs. West Midlands
t-stat for diff. in mean -3.52 t-stat for diff. in mean -3.461
P-value
0 P-value
0
Southeast vs. Wales
Southeast vs. Wales
t-stat for diff. in mean -7.10 t-stat for diff. in mean -1.456
P-value
0 P-value
0.148
Southeast vs. North
Southeast vs. North

51
t-stat for diff. in mean -0.17 t-stat for diff. in mean -1.383
P-value 0.86 P-value 0.169
Notes: for variable definitions see text.
Above it was noted that there is mixed evidence for a strong connection between Whig
strength and the dissenting population by county in the parliaments between 1690 and 1740.
However, the connection was much stronger during the Rage of Party. In table 10, columns 1
and 2 show that Whig strength is positively and significantly related to the percent of the
dissenting population for parliaments between 1690 and 1720. The relationship is far weaker
after 1720 as shown in columns 3 and 4. The pattern makes sense as religious differences are
often thought to be more important during the Rage of Party.
Table 10: The Connection between Dissenters and Majority Strength
Whig Strength, Rage of Party Whig Strength, Walpole Era
(1) Coefficient
(2) Coefficient
(3) Coefficient
(4)
Coefficient
Variable Stand. Err. Stand. Err. Stand. Err. Stand. Err.
Dissenter population in
County 0.013 0.012 0.0029 0.0002
0.005** 0.004** 0.006 0.007
Dummy variables for
Constituency Type No Yes No Yes
Dummy variables for
Region No Yes No Yes
N 269 269 269 269
R-Square 0.09 0.23 0.16 0.18
Notes: Robust Standard errors are reported. ** and *** indicate statistical significance at the 5
and 1 percent confidence level respectfully.
Sources: For percent of dissenter population see Watts (1978, pp. 509-510.)

52
IV.
This paper builds on the The History of Parliament and presents new data on the party
affiliation of every MP in England and Wales in all parliaments from 1690 to 1740. As noted
there are several challenges in assigning MPs to parties. Perhaps the most difficult problem is
that MPs might be ascribed to a party, but in reality they were largely independent. The
methodology here draws on multiple division lists and sources in each parliament and aims to
provide a conservative classification of party affiliation. By outlining the methods I encourage
other scholars to refine or improve upon the approach used here.
There are many applications of the party data. Here they are used to establish the relative
strength of the Whigs and Tories across different types of constituencies and over time. I find
that the Whigs were more strongly represented in municipal boroughs rather than counties. The
Whigs were more strongly represented in small and oligarchical boroughs compared to large and
more democratic boroughs. The Whigs were stronger in the Southeast compared to the Midlands,
Wales, and the Southwest. The North goes from being more Whig during the Rate of Party to
less Whig during the era of Walpole. The data provide a quantitative foundation for several
generalizations in the literature regarding the electoral support of the two parties. In future
research the data can illuminate other issues in British economic, social, and political history.

53
References
Chandler, R. The History and Proceedings of the House of Commons. Printed for Richard Chandler,
1741-1744.
Cobbet, W. Parliamentary History. Oxford, 1811.
Cox, Gary. “War, Moral Hazard and Ministerial Responsibility: England after the Glorious Revolution.”
Journal of Economic History 71 (2011): pp. 133-161.
Cruickshanks, Eveline, Stuart Handley, and D.W. Hayton. eds. The House of Commons 1690-1715.
Cambridge, 2002.
Burton, I.F., P.W.J. Riley, and E. Rowlands, “Political Parties in the Reigns of William III and
Anne: The Evidence of Division Lists,” Bulletin of the Institute of Historical Research,
special supplement, vol. 7 (1968)
Britain, Great. A True List of All Such Gentlemen of the House of Commons: As Voted for and
Against the Question for Granting the Sum of 241,259 l. 1s. 3d. for Defraying the
Expence of Twelve Thousand Hessian Troops, in the Pay of Great Britain for the Year
MDCCXXX. R. Whirlpool, 1730.
Hayton, D. ‘Introductory Survey and Appendices,’ in Cruickshanks, Eveline, Stuart Handley, and D.W.
Hayton, eds. The House of Commons 1690-1715. Cambridge, 2002.
Holmes, G., The Making of a Great Power: Late Stuart and Early Georgian Britain. 1660-1722. London,
1993.
Holmes, G. and D. Szechi, The Age of Oligarchy: Pre-Industrial Britain, 1722-1783. London, 1993.
Holmes, G. British Politics in the Age of Anne, London: St. Martin’s, 1967.
Horwitz, Henry, “Parties, Connections and Parliamentary Politics, 1689-1714: Review and
Revision,” Journal of British Studies, vol. 6, no. 1 (Nov. 1966), pp. 45-69.
Horowitz, Henry. Parliament, Policy, and Politics in the Reign of William III. Manchester, 1977.
Namier, Lewis Bernstein. The Structure of Politics at the Accession of George III. London, 1961.
Newman, A.N.,“Political Parties in the Reigns of William III and Anne: The Evidence of
Division Lists: A Supplementary Note,” Bulletin of the Institute of Historical Research,
vol. 43, no. 108 (Nov. 1970), pp. 231-233.
Pincus, Steven. 1688: The First Modern Revolution. Yale 2009.
Sedgwick R., ed. The House of Commons 1715-1754. Oxford, 1970.
Snyder, Henry L. ‘Party Configurations in the Early-Eighteenth-century House of Commons.’ Historical
Research. 45 Issue 111, (1972): pp. 35-72.

54
Speck, W. A. ‘The Choice of Speaker 1705.’ Historical Research. 37 (1964): pp. 20-46.
Speck, W. A. Tory and Whig: The Struggle in the Constituencies, 1701-1715. London, 1970.
Stasavage, D., Public Debt and the Birth of the Democratic State: France and Great Britain, 1688-1789
Cambridge, 2003.
Walcott, Robert. English Politics in the Early Eighteenth Century. Oxford, 1956.
Watts, M. R. The Dissenters. Oxford, 1978.