white dwarf stars a thesis submitted for the degree … · white dwarf stars a thesis submitted for...
TRANSCRIPT

WHITE DWARF STARS
A THESIS SUBMITTED FOR THE DEGREE OF DOCTOR OF PHILOSOPHY IN THE
AUSTRALIAN NATIONAL UNIVERSITY
R.A. BELL
JULY 1961
P re fa to ry Note
&/
The work r e p o r te d in t h i s t h e s i s was c a r r i e d o u t d u rin g
th e te n u re o f a R esearch S c h o la rsh ip in th e D epartm ent o f Astronomy
in th e R esearch School o f P h y s ic a l S c ien ces o f th e A u s t r a l ia n
N a tio n a l U n iv e r s i ty . P a r t o f th e work was c a r r i e d o u t a t K ing ’s
C o lleg e , London, P r in c e to n U n iv e r s i ty and th e C a l i f o r n ia I n s t i t u t e
o f Technology w ith th e a id o f g r a n ts from th e U n ited S ta te s A ir
Force and P r in c e to n U n iv e rs i ty . The work re p o r te d h e re in was
perform ed w ho lly hy th e c a n d id a te .«
R.A. B e l l .

TABLE OF CONTENTS
Chapter 1. Introduction p. 1
Chapter 2. Observations of Southern White Dwarfs p. 10
Chapter 3» Model Atmospheres for White Dwarfs p. 16
Chapter 4. The A^-670 Stars p. 26
Chapter 5* Degenerate Stellar Configurations p. 4l

Acknowledgement s
I am much indebted to all members of Mt. Stromlo
Observatory who have helped me in this study. Professor B.J.
Bok has been a constant source of encouragement and, as well as
acting as one of my supervisors, kindly arranged my visit to
London with Professor H. Bondi. Dr. T. Dunham also acted as one
of my supervisors at Mt. Stromlo whilst Dr. F.A.E. Pirani acted
as my supervisor in London. I should also like to thank
Professors L. Spitzer and M. Schwarzschild for enabling me to
visit Princeton University Observatory and Professor J.L. Greenstein
for arranging my visit to the California Institute of Technology.

1
CHAPTER 1
White dwarf stars were first discovered only fifty years ago,
when the science of astrophysics was in its infancy. The original
discovery appears to have been made by Russell (l). He had just found
from his work on trigonometrical parallaxes that all intrinsically faint
stars were of spectral type M and then learnt that 40 Eri B was both
intrinsically faint and hot. Slightly, later Adams (2) gave the spectrum
of Sirius B as A or early F and van Maanen (3) described the spectrum, of
van Maanen 2. These three stars were soon realised to be the prototype
members of a class of stars of very small radius and high temperature
which consequently became known as the white dwarfs. The small radius
and high temperature of these stars implied a high density. The mass
of Sirius B was known from its double star orbit with Sirius A and its
parallax and apparent magnitude were also known. Adams’ spectra implied
a temperature of 10,000°K. This temperature and the absolute magnitude
implied a radius of about 1 9 ,0 0 0 km and this, combined with the mass of
between 0 .7 5 and 0 .9 5 solar masses, gives a mean density of about
6 0 ,000 gm/cm1 2 3.
(1) Russell, H.N. Remark at Symposium on Novae and White Dwarfs, Paris,
1959* Quoted by E. Schatzman, "White Dwarfs", North Holland, 1958, P* 1»
(2 ) Adams, W.S., P.A.S.P., 27, 236, 1915-
(3) van Maanen, A., P.A.S.P. 29, 258, 1 9 1 7.
2
Eddington (4) seems to have teen the first to argue that, whilst this density was far greater than that found in other stars or on the earth, the figures should he taken seriously. The work of Fermi and Dirac on quantum statistics was still in the future and so Eddington could
not give the physical basis for the existence of these high densities.From his knowledge of the general theory of relativity he could, however, point out that the huge density of Sirius B should produce a measurable
gravitational red shift of the absorption lines in its spectrum owing to the higher gravitational potential at the surface of the star than at the surface of the earth. This gravitational red shift would be the residual
shift of the spectral lines remaining after allowing for the motion of
the :star along the line of sight. It would amount to + 20 km/sec, expressed in velocity units. A velocity of this order was found by
Adams. However the observations are very difficult ones to make because of the close proximity of Sirius A and B. Fortunately, when Adams made his observations the stars were nearly at maximum separation but scattered light from Sirius A still appeared on his spectra of Sirius B. Whilst the observations of Sirius B will undoubtedly be performed again in the near future, the work of Eddington and Adams persuaded
astronomers that stars with a mean density of 60,000 gm/cm3 existed in the Universe and also gave to physicists a demonstration of the correctness
of Einstein’s General Theory of Relativity.
(4) Eddington, A.S., "Internal Constitution of the Stars", Cambridge
University Press, 1926, p. 170.

3
After this early and important work progress was fairly slow on the observational side but rapid on the theoretical one. Kuiper (5)
gave the spectra of 38 stars in 1941. The major theoretical advance was made by Chandrasekhar, following the suggestion of Fowler that the pressure in white dwarf interiors was supplied by a degenerate electron
gas. Chandrasekhar derived a one-parameter series of white dwarf models for any given composition. The masses and radii of these models were of the right order of magnitude. He found that as the central density of
the models increased their masses also increased but their radii decreased. As the central density tended to infinity the radius tended to zero whilst
the mass tended to 1.44 solar masses, this latter being calculated on the assumption that hydrogen is absent in the degenerate region of the star. This upper limit on the mass of a white dwarf has been much used in discussions of the latter stages of stellar evolution and of the enrichment of interstellar matter by material which has been "processed" in the interiors of stars. The work of Chandrasekhar on white dwarf interiors and the existence of even denser stars, the neutron stars, will be discussed in a later chapter.
More recent observational material on the spectra of white dwarfs has been obtained by Luyten (6), Lynds (7) and Greenstein (8)
(5) Kuiper, G.P., P.A.S.P. 53, 248, 1941.
(6) Luyten, W.J., Ap. J. 116, 283, 1952.
(7) lynds, B.T., Ap. J. 125, 719, 1957.(8) Greenstein, J.L., Handbuch der Physik Vol L, Springer, 1958, p. l6l.
Hereafter referred to as Greenstein (1958).
4
whilst Harris (9) has published. U, B, V colours and magnitudes for some
stars. Luyten observed 44 stars with either the 82" or 100" telescopes
at dispersions ranging between I65 and 340 A/mm and classified his spectra into a number of groups. The handicaps which he faced in this project,
which he himself pointed out, were that he had to use four different
spectrographs, all of low dispersion, and that the faintness of the stars
resulted in many spectra being underexposed. Luyten introduced the
notation of DA for stars shewing mainly hydrogen lines, DB for those with
only helium lines, DC for a continuous spectrum and DF for the star van
Maanen 2. He also subdivided the DA stars into subclasses 0 - 7* the
lower numbers indicating broad and shallow lines and an intensity maximum
in the violet, higher numbers sharper lines and an intensity maximum
shifted towards the red. Luyten pointed out that stars that he classified
as DC were distributed over quite a large temperature range. From his
magnitudes and intrinsic colours, together with trigonometric parallaxes
and spectroscopic parallaxes of red dwarf companions of white dwarfs,
Luyten was able to draw a plot of absolute magnitude versus colour index
for about forty white dwarfs. A rough conversion of his colour indices
into a temperature scale gave the radii of these stars. He found that
these radii lay mainly between those of the earth and Uranus.
Mrs. Iynds observed twenty-three white dwarfs with the nebular
spectrograph on the Crossley reflector of the Lick Observatory. The
(9) Harris, D.L., Ap. J. 124, 665, 1956.

5
dispersion of this instrument is V^O A/mm at H7. Seventeen of her
stars were of the DA type. Photoelectric colours on the U, B, V system
were available for nineteen stars. Her data suggested a rough
correlation between the equivalent width of H7 and B-V colour. Her
main interest, however, lay in comparing her observed line profiles with
those calculated by Verweij. To do this she estimated the effective
temperatures of the white dwarfs from their U, B, V colours and compared
the half-widths of H7 and H6 as computed by Verweij for various values of
log g and various effective temperatures with her observed values. Her
results for H7 shewed that log g had an average value of about 7*0.
Those for HÖ seemed to be better fitted by a lower value of log g and
she pointed out that this was probably caused by the wings of H5 and H7
overlapping and thereby giving a false continuum. Verweij’s calculations
of line profiles were based on the Holtsmark theory of line broadening.
How Mrs. lynds' mean value of log g would alter if improved theories of
Stark broadening were used to compute the line profiles is unknown.
Harris observed U, B, V colours for l8 white dwarfs of known
trigonometric parallax and for six white dwarfs in the Hyades. From
these data he could derive a more accurate colour-magnitude diagram than
that of Luyten. His work and that of Johnson and Morgan shewed that
white dwarfs had an ultraviolet excess. This, however, had been fore
shadowed by Kuiper whose slitless spectra of white dwarfs and normal
stars shewed that the ultraviolet radiation from a white dwarf was much
6
stronger than that from a normal star of the same temperature.
The most extensive data on the spectra of white dwarfs are
those of Greenstein (1958) and (lO) obtained using the 200-inch telescope.
Table 1 of his article in the Handbuch der Physik gives data on 8l stars, some of which are taken from the papers of Luyten, Lynds and Kuiper.
However about half the stars have been observed by Greenstein, using
dispersions of up to l8 A/mm. U, B, V magnitudes are available for many
of these stars. Greenstein has extended the earlier classification
scheme of Luyten and as his material is more extensive and of higher
quality we shall describe it in some detail.
The stars which shew only helium lines in their spectra, the
DB stars, are amongst the bluer and hotter objects. However some stars
which shew only hydrogen lines are nearly as blue and therefore nearly
as hot as the DB stars, which consequently must be abnormally rich in
helium.
The majority of white dwarfs are those with only hydrogen lines
in their spectra and are classified as DA. The equivalent width of Hy
can reach almost 40 A and the continuum is badly affected below H&.
Neither helium lines in the hotter stars nor metal lines in the cooler
ones can be seen. A few DA stars have weak and shallow lines and are
amongst the hotter members of the class whilst a few with weak and sharp
lines are cooler members. A plot of W(Hy) versus U-V colour shews a
(10) Greenstein, J.L., Stellar Atmospheres, Vol 6 of Stars and StellarSystems, i960, p. 676.

7
maximum of about 4o A at U-V = -.45, decreasing rapidly to about 5 A at
U-V = -.20 and decreasing more slowly with decreasing U-V to about 10 A at
U-V = -1 .30. A given colour does not correspond to a unique W(H7). This
may be caused either by abundance differences or different surface
gravities. Two objects shew hydrogen lines in emission. One of these
is a recurrent nova, WZ Sge, in which the emission lines are superposed
on the broad absorption lines of a white dwarf.
The cooler DA stars blend into the DF class. The hotter DF
stars have sharp hydrogen lines and a K line of varying strength. Later
members do not shew hydrogen lines. Ross 640 has only the H and K lines
and a blend due to Mg I in its spectrum and L745-46A has only H and K.
The DF stars are intrinsically fainter than the DA ones. Even later
type white dwarfs are hard to discover and to observe. Greenstein
classifies van Maanen 2 as DG and w489 as DK.
Some white dwarfs, over a wide range of temperature and
luminosity, shew no lines or bands in their spectra and are classified
as DC. The use of spectrophotometric techniques, however, has enabled
Greenstein to observe spectral features in stars classified DC by earlier
observers. Intensity tracings of some of these stars have been
published (ll). The star Grw +70°8247 shews an asymmetric feature
centred at 4135A and weaker features at 365OA and 4475A. The atmospheric
composition required to produce this spectrum is not known at the present
(ll) Greenstein, J.L.,and M.S. Matthews, Ap. J. 126, l4, 1957*

8
time. It may be remarked that this star is a fairly hot one, Greenstein
giving an effective temperature of 11,500°K. Three other stars, W219, LÖ79-14 and IlA5-l4l, two of which have been observed by Greenstein and one by the author at Mt. Stromlo, shew a broad shallow feature centred at
4670A. More recent observations by Greenstein at Palomar shew another broad feature centred at about 5100A. In a later chapter it will be
shewn that these features are caused by molecular carbon.The problem of the energy sources of white dwarfs was solved
by Mestel(l2)These stars cannot produce energy by gravitational contraction as their radius is uniquely fixed by their mass and chemical composition. Nuclear reactions also seem to be an unlikely energy source as the pressure
inside the star is virtually independent of the temperature and there is
danger of nuclear processes, with their high temperature sensitivity, running out of control and producing more energy than the star can radiate. Mestel shewed that the kinetic energy of the non-degenerate nuclei in the electron degenerate region of the star could supply a white dwarf with energy to radiate for 109 years or longer. The kinetic energy of each nucleus is proportional to the temperature and the total kinetic energy of all the nuclei is thus proportional to the mass of the star and the temperature. The majority of the mass of the star is contained in the core, the region where the electrons are degenerate, and the derivation of the temperature of this nearly isothermal region
(12) Mestel, L., M.N. 112, 583, 1952.
9
is of extreme importance. Mestel derives this temperature by assuming
that the envelope of the star is in radiative equilibrium. This method
gives ages which are of the right order of magnitude. However it seems
that convection occurs fairly near to the surface even in white dwarfs
with effective temperatures of 12,500° or more. How this fact will
affect the current estimates of the internal temperatures of white
dwarfs is at present unknown as the models have not been carried through
to the region where the temperature becomes approximately equal, to that
in the core.
The aims of the present work are fourfold. In the next
chapter of this thesis some observations of the spectra and colours of
southern white dwarfs are given. The third chapter gives a series of
model atmospheres for DA white dwarfs. The main object of this chapter
is to find the values of Tg and g which best agree with a scan of ^0
Eridani B obtained by Oke. The fourth chapter shews that the A ^670
feature present in three white dwarf spectra is caused by molecular
carbon. The proper motions of these three stars indicate that they
may be dynamically related and this fact is also discussed. The final
chapter discusses even denser stars than the white dwarfs, the neutron
stars.

10
CHAPTER 2
Observations of Southern White Dwarfs
Whilst many northern white dwarfs have been observed spectro*-
scopically on several occasions, no such body of data exists for the
southern stars. Luyten and Smith (l) have published a large list of
photographic colours and magnitudes of suspected southern white dwarfs
and Luyten (2) has published finding charts for some of these stars.
The author decided to observe the brighter of these stars spectro
scopically.
The spectrographic equipment available was the Zeiss
spectrograph mounted at the Newtonian focus of the Mt. Stromlo 7^-
inch reflector. This spectrograph is equipped with two sets of
prisms, of UBK 7 and F 2 glass, and with f/2.5 and f/l.5 camera lenses. The dispersions available range from 90 A/mm at H7, using the F2 prisms and f/2.5 lens, down to 290 A/mm at H7 using the UBK7 prisms and f/l.5 lens. The dispersion mainly employed by the author
was 150 A/mm at H7, using the F2 prisms and f/l.5 lens. This is
termed NB. 150 A/mm enabled the profiles of the hydrogen lines to
be measured with some accuracy and yet still enabled a reasonable
number of spectra to be obtained with the spectrograph, which is
(l) Luyten, W.J., and J.A. Smith, "Magnitudes and Colours for Southern
White Dwarfs", The Observatory, University of Minnesota, 195Ö.
(2) Luyten, W.J., Ap. J. 109, 528, I9I+9.
11
r a th e r slow . The p l a t e s u sed were baked I I a - 0 and th e se were
developed u s in g e i t h e r D-19 o r Kodak T ro p ic a l D eveloper in s t a i n l e s s
s t e e l ta n k s w ith in t e r m i t t e n t a g i t a t i o n . The c a l ib r a t i o n p la te s
u sed were exposed in a tu b e s e n s ito m e te r , th e exposure tim es b e in g
w ith in a f a c t o r two o f th e s t e l l a r exposure tim e s . These p la te s
were ta k e n from th e same box o f baked p la te s as th o s e u sed f o r th e
s t a r s . The s p e c tr a and c a l i b r a t i o n sp o ts were t r a c e d u s in g a
H ilg e r m icropho tom eter and th e t r a c in g s o f th e s p e c tr a were c o n v e rted
in to i n t e n s i t i e s u s in g th e c a l i b r a t i o n cu rv es d e r iv e d from th e
c a l i b r a t i o n p l a t e s .
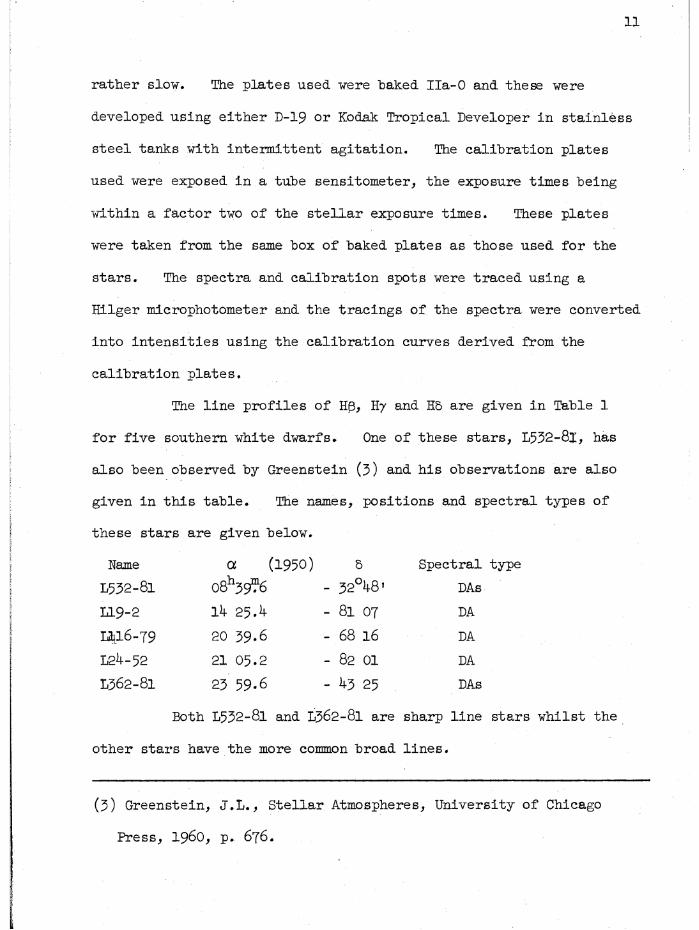
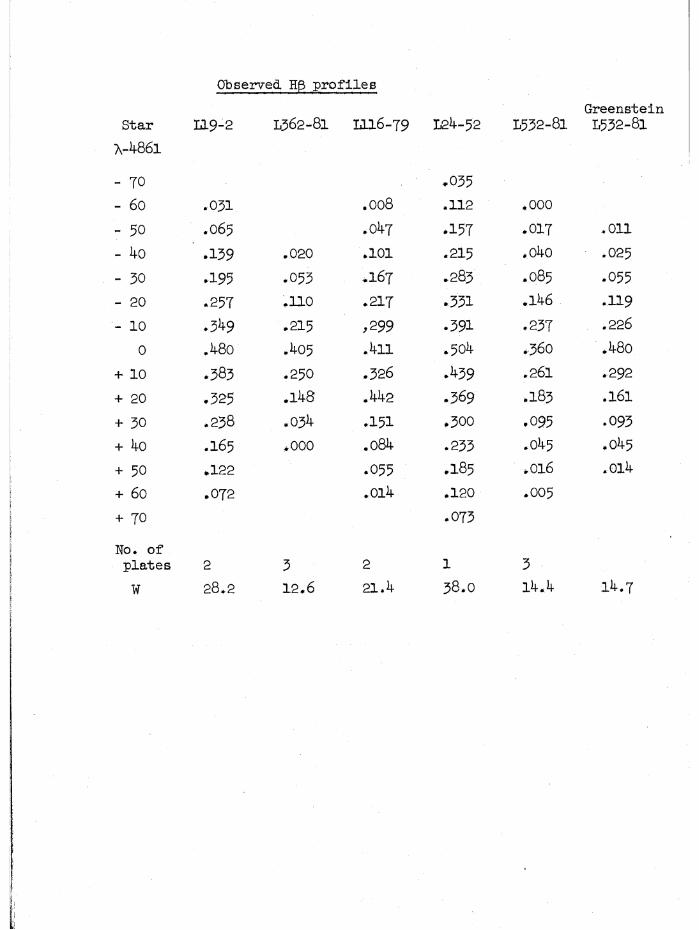
The l i n e p r o f i l e s o f Hß, H/ and H5 a re g iv en in Table 1
f o r f iv e so u th e rn w h ite d w arfs . One o f th e se s t a r s , L532-81, has
a ls o been o b serv ed by G re e n s te in (3) and h is o b s e rv a tio n s a re a ls o
g iv en in t h i s t a b l e . The names, p o s i t io n s and s p e c t r a l ty p e s o f
th e s e s t a r s a re g iv en below .
Name a (1950) & S p e c tra l ty p e
L532-81 o8h39% - 32°48 ' DAs
L19-2 I k 25 .4 - 81 07 DA
KL16-79 20 39 .6 - 68 16 DA
L24-52 21 05.2 - 82 01 DA
L362-81 23 59.6 - ^3 23 DAs
Both L532-81 and L362-81 a re sh arp l i n e s t a r s w h i ls t th e
o th e r s t a r s have th e more common b ro ad l i n e s .
(3 ) G re e n s te in , J . L . , S t e l l a r A tm ospheres, U n iv e rs i ty o f Chicago
P re s s , 1980, p . 676.
O bserved Hß p r o f i l e s
G re e n s te inL532-81S ta r II9 -2 L362-81 1116-79 L24-52 L532-81
A-4861
- TO .035- 60 .031 .008 .112 .000
- 50 .065 .047 .157 .017 .011
- 4o .139 .020 .101 .215 ,o4o .025
- 30 .195 .053 .167 .283 .085 .055- 20 .257 .110 .217 .331 .146 .119- 10 .3^9 .213 ,299 .391 .237 .226
0 .480 .405 ,4 l l .504 .360 .48o
+ 10 .383 .250 .326 .439 .261 .292
+ 20 .325 .148 .442 .369 .183 .161
+ 30 .238 .034 .151 .300 .095 .093+ 4o .165 .000 .084 .233 .045 .045
+ 50 .122 .055 .185 .016 .014
+ 60 .072 .014 .120 .005+ 70 .073
No. o f p la t e s 2 3 2 1 3
W 28.2 12.6 21.4 38.0 14.4 14.7

O bserved Hy
S ta r
A-4340L19-2 L362-T
- 90 .01T- 80 .043- TO .084- 60 .112- 50 .1T9- 4o .244 .032- 30 .315 .0 t4
- 20 .388 .135- 10 .496 • 2T9
0 • 6l4 .515+ 10 • 439 .216+ 20 • 34t .100+ 30 • 2T9 .039+ 40 .231 .013+ 50 .192+ 60 .142+ TO .126+ 80 .068+ 90 .043
N 2 3W 40.0 13.8
P r o f i l e s
I116-T9 L24-52 L532-*
.015 .045
.023 .100
.040 .133
.0T2 .1T4 .010
.101 .244 .033
.148 .305 • 05T
.201 • 3TT .109
.2T8 .431 .192
.3T6 .512 .245
.548 . 566 .501• 433 .444 .224.249 • 3T2 .136.185 .292 .082.150 .250 .056.111 •1T9 .031.082 .108 .006
• 05T .096.031 .056.026 .010
2 1 330.0 47.0 16.4
G re e n s te inL532-81
.010
.025
.048
.082
.135
.236
.551
.258
.139
.089
.055
.028
.011
15.T
Observed H6 P ro file s
S tar 119-2 L362-81 1116-79 L532-81G reensteinL532-81
A -4101
- 60 .006 .066
- 50 .046 .070 .000 .015- 4o .092 .000 .111 .018 .032
- 30 .162 .022 .087 .052 .059- 20 .227 .115 .276 .119 .112
- 10 .331 .245 .412 .2 k r; .2250 .446 .623 .544 .501 .527
+ 10 .33b .192 .351 .241 .235+ 20 .247 .128 .249 .125 .128
+ 30 .166 .032 .170 .072 .077+ 4o .103 .025 .121 .027 .044
+ 50 .024 .076 .004 .018
+ 6o .018 .055
N 2 2 2 3w 27.9 13.8 26.8 12.0 13.7
12
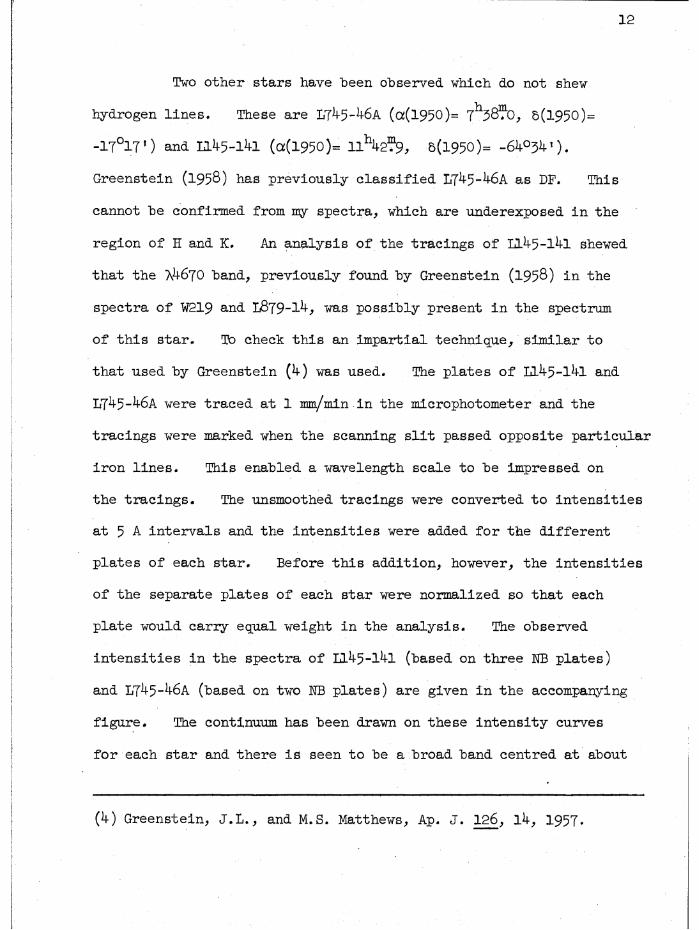
Two other stars have been observed which do not shew
hydrogen lines. These are L7^5-^6a (cü(1950)= 7^38?0, 6(1950)=
-l?0!?’) and Ll45-l^l («(1 9 5 0)= llhk2^9, 6(l9 5 0)= -6k°3k').
Greenstein (1 9 5 8) has previously classified L7 -5- -6a as DF. This
cannot be confirmed from my spectra, which are underexposed in the
region of H and K. An analysis of the tracings of L1^5-l4l shewed
that the 7^670 band, previously found by Greenstein (1 9 5 8) in the
spectra of W219 and L879-lA> was possibly present in the spectrum
of this star. To check this an impartial technique, similar to
that used by Greenstein (4) was used. The plates of Ll45-l4l and
L7^+5-^6a were traced at 1 mm/min in the microphotometer and the
tracings were marked when the scanning slit passed opposite particular
iron lines. This enabled a wavelength scale to be impressed on
the tracings. The unsmoothed tracings were converted to intensities
at 5 A intervals and the intensities were added for the different
plates of each star. Before this addition, however, the intensities
of the separate plates of each star were normalized so that each
plate would carry equal weight in the analysis. The observed
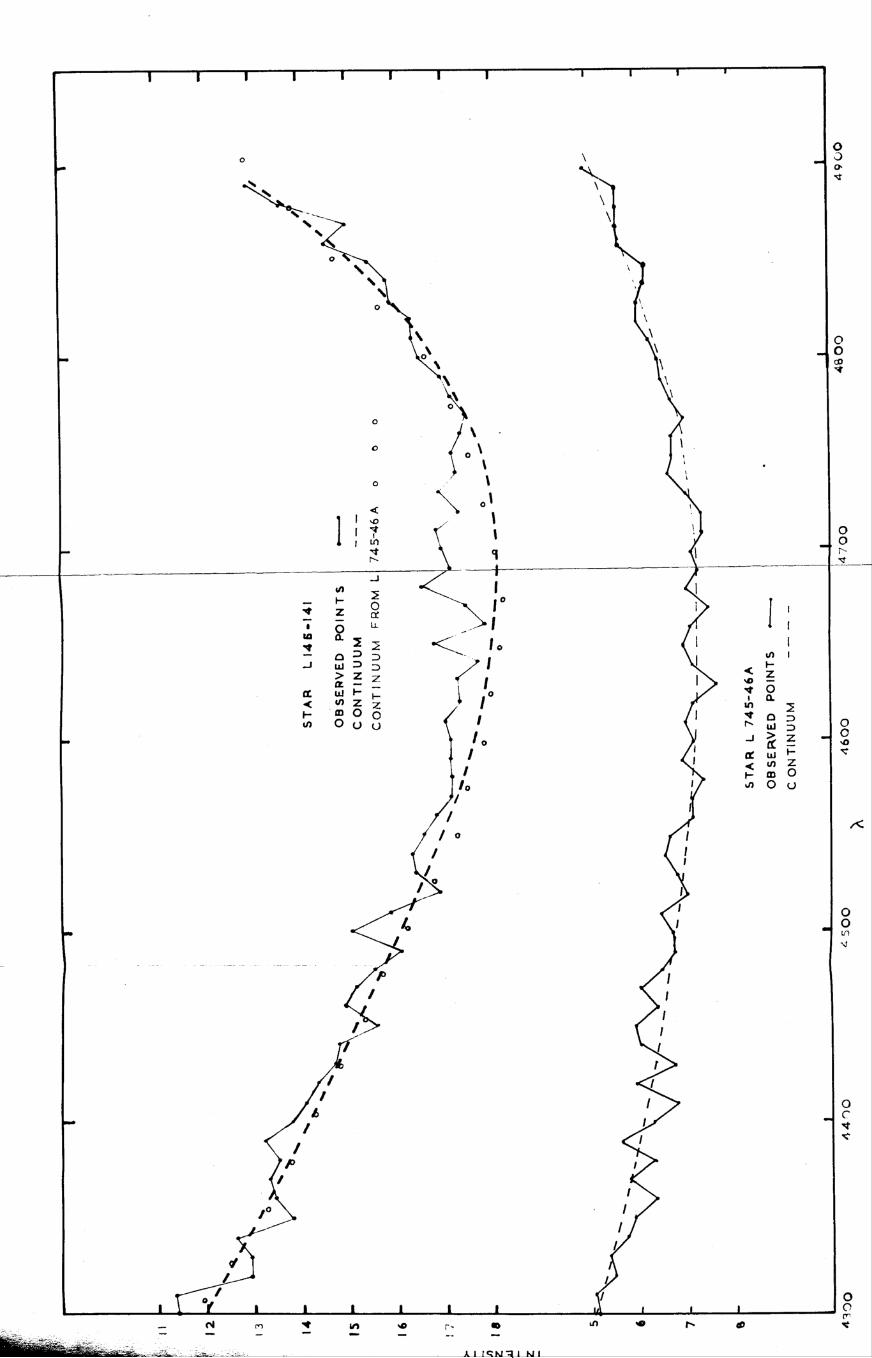
intensities in the spectra of 11^5-1^1 (based on three NB plates)
and L7^5-^-6A (based on two NB plates) are given in the accompanying
figure. The continuum has been drawn on these intensity curves
for each star and there is seen to be a broad band centred at about
(4) Greenstein, J.L., and M.S. Matthews, Ap. J. 126, l4, 1957*

13
4670A in the spectrum of 1245-l4l. In order to check that the
continuum of Ll45-l4l has been drawn correctly, we have taken the continuum of L745-46A and after multiplying by the appropriate
factor to agree with the continuum of Il45-l4l at 4680A and
rotating it, to correct for different stellar temperatures and extinctions, we have plotted it on that of Ll45-l4l. The agreement
between the two continua is seen to be good and the feature
definitely appears to be present.
Spectra of some other stars have shewn that they are not white dwarfs. U 6O-IO8 (a(l950)= 19h44%, 5(1950)= -63°07’) shews a strong K line and many sharp hydrogen lines, without the wings visible of L532-81 and would seem to be a dwarf or subdwarf F star, the proper motion of 0"44 and m.pV of 10.27 making the latter more probable. Similarly both L247-17 (a(l950)= 10ho A , b(l950) =-50°55t) and Bruce Proper Motion star No. 9896 (cü(1950)=5(1950)= -71°051) also seem to be F type subdwarfs.
Photoelectric photometry of some southern white dwarfs was carried out using the 30-inch telescope of Mt. Stromlo Observatory. The photometric equipment of this telescope has been described by Gascoigne (5). The photometer, a Lick Observatory, 1952, f/l8 type with a 1P21 photomultiplier, refrigerated with dry ice, is
mounted at the Cassegrain focus of the telescope. The associated
(5) Gascoigne, S.C.B., and E.J. Burr, M.N. 116, 570, 1958.
AI I KI -q I Ki I
OB
SE
RV
ED
PO
INT
S

S ta r V B-V U-B
H 4 5 -l4 l 11.44 + .18 -.64L327-186 13.77 +. 06 -.661111-44 12.06 + .34 -.14
L342-53 13.37 + .63 -.29
1116-79 13.25 - .06 -.81L24-52 13.50 + .27 -.5 9L362-81 13.05 + .07 00 —3
L879-14 14.13 +.13 -.67

amplifier has coarse and fine sensitivity ranges, the attenuation
steps being 2.5 and 0.5 magnitudes, respectively. The amplifier
output is fed to a Brown recorder. To give greater accuracy for
observations of the fainter stars the zero of the Brown recorder
was run off scale and the amplifier sensitivity adjusted until both
the sky and star plus sky were on scale, the difference between
them being as large as possible. A measurement of star plus sky
in one colour was followed by a measurement of sky alone in the
same colour, each observation taking about two minutes. The
extinction was measured each night by observing a red and a blue
star over a range of zenith distances. The deflections on the
tracings were converted into magnitudes and corrected for extinction,
using the observations of the extinction stars and a nomogram giving
sec z as a function of declination and hour angle at Mt. Stromlo.
This gave magnitudes on the instrumental system which were converted
to the U, B, V system by observations of Johnson-Morgan standard
stars (6) and IC4665 (I)» The filters employed in the 30-inch
photometer are the Schott ones recommended by Johnson (8) but the
transformation equations used were derived mainly for main sequence
stars and may possibly not be applicable for white dwarfs. U, B, V
colours for the stars observed are given in the table opposite.
(6) Johnson, H.L., and W.W. Morgan, Ap. J. 117> 313? 1953*
(7) Johnson, H.L., Ap. J. 119, l8l, 195^ •
(8) Johnson, H.L., Ann. d ’Ap. l8, 292, 1955*
15
Deeming’s Observations of Ll45-l4l give V = 11.47,
B-V = +0.21, U-B = -.58 so the agreement is good. His spectra of
this star also do not exclude the presence of weak features less
than 10$ deep. We have found the maximum depth of the >4670 hand
to be about 8$. The temperatures of Ll45-l4l and l879-14, derived
from the U, B, V colours of these stars, and using the work of
Bonsack et al. (lO), are 9200°K and 9700°K. However in Chapter 4
we have assumed LÖ79-14 to have a temperature of 7500°K as our U,
B, V colours were obtained on only a single night of poor quality.
Greenstein (ll) moreover, has described the star as yellowish.
All three >4670 white dwarfs lie above the black body curve of
Bonsack et al. whereas the DA stars cluster on or below this line.
(9) Deeming, T.J., The Observatory 80, 224, i960.(10) Bonsack, W.K., J.L. Greenstein, J.S. Mathis, W. G. Melbourne,
G. Neugebauer, R.L. Newburn, K.H. Olsen, W.G. Tifft, H.D.
Wahlquist and G. Wallerstein, Ap. J. 125, 139* 1957*
(11) Greenstein, J.L., Ap. J. 126, l4, 1957*
16
CHAPTER 3Model Atmospheres for White Dwarfs
In his work on white dwarfs Greenstein (1958) derived rough values of the effective temperatures of white dwarfs from their photoelectric colours and from the depths of the hydrogen lines. The method used to derive temperatures from the colours followed that of
Bonsack et al. (l). This method characterizes a stellar model by T^ and P^ (effective temperature and effective mean electron pressure) and
assumes that k- /k, the ratio of the opacity at a particular wavelength
to the Rosseland mean opacity, is independent of optical depth. The ratio of the emergent flux to the Planck function at a particular wave
length can then be obtained from the tables of Burkhardt (2) and Chandrasekhar (3). The U-B and B-V colour indices of a star are expressed in terms of the fluxes at appropriate wavelengths. Greenstein,
using this technique, corrects the observed U-B and B-V of DA white dwarfs for the effect of the hydrogen lines. He assumes that atomic hydrogen alone gives rise to the opacity and further assumes that
(1) Bonsack, W.K., J.L. Greenstein, J.S. Mathis, W.G. Melbourne, G. Neugebauer, R.L. Newburn, K.H. Olsen, W.G. Tifft, H.D. Wahlquist
and G. Wallerstein, Ap. J. 123, 139> 1957*(2) Burkhardt, G., Zs. f. Ap. 13, 56, 1936.(3) Chandrasekhar, S., Radiative Transfer (Clarendon Press) p. 307*
IT
computations of U. The temperatures so derived, combined with an approximation for the depths of the lines, gave line profiles whose central depths were shallower than the observed values.
The white dwarf 40 Eri B provides a good check on estimatesof white dwarf temperatures. The observed value of the Einstein redshift is 21 ± 4 km/sec (4) and, using the mass radius relation and the expression for the Einstein red shift (Greenstein 195Ö) > this corresponds
to a value of log r/p of - I.85 ± .03. The dynamical value of themass (5) is 0.43 ± . 04 M which, from the mass radius relation, leads
to a radius given by log R/Rq = - I.83 ± .02. Thus we may take log r/r to lie between the limits
The parallax of 40 Eri B is 0"200 ±.004 (6) and V = 9*50 (7) whence
We find that 10,500°< Tg < 11,700°K
and 7*69 < log g < 7.83.
(4) Popper, D.M., Ap. J. 120, 316, 1954.(5) Artukhina, N.M., Astronom. J. U.S.S.R., 25, l80, 1948.(6) Schlesinger, F., and L.F. Jenkins, Yale Catalogue of Stellar
Parallaxe s, 1952.(7) Harris, D.L., Ap. J. 124, 665, 1956.
- 1.8l > log r/rq > - 1.88.
Mv = 11.01 ±.05. Then we can derive the effective temperature from
l8
The derived temperatures give a bolometric correction of only a few
hundredths of a magnitude which we neglect.
The temperature limits given above are lower than those derived
by Greenstein, who obtained 15^T50°K on the assumption that the Balmer
discontinuity was that obtained from atomic hydrogen as the opacity
source and 13,250°K on the assumption that the Balmer discontinuity was
reduced by half by the action of some opacity source other than atomic
hydrogen.
During the author’s visit to the California Institute of
Technology a spectral scan of kO Eri B was made available to him by Dr.
J.B. Oke. This star has also been observed spectroscopically by
Greenstein at a dispersion of l8 A/mm. The existence of this high
quality observational material made it worthwhile to carry out an analysis
of both the continuous and line spectra based on a series of model
atmospheres. An earlier analysis of the continuous spectrum of ko Eri B
by Schatzman (8), based on observations of Chalonge et al. (9 ), gave an
effective temperature ofl3^250°K or more. The author therefore decided
to construct 6 model atmospheres for 40 Eri B with effective temperatures
of 12,000°K, 13>250°K and 15_,000°K and surface gravities of 107 and 10s.
(8) Schatzman, E., "White Dwarfs", North Holland, 1958, pp. 31-35»(9) Berger, J., D. Chalonge, L. Divan, A.M. Fringant, Contributions de
1'Institut d'Astrophysique de Paris. Seri A, No. 128.

19
The opacity tables used, to construct these models were those of Ueno (lO)
and Ueno, Saito and Jugaku (ll). These are based on a H/He ratio of
8^:15 hy number with a hydrogen to metals ratio of 104 by number. As the
abundance ratios of H, He and metals are unknown for 40 Eri B Ueno's
abundances, which are based on Unsold's (12) analysis of t Scorpii, will
serve as a first approximation. The models were constructed using an IBM
650 and a programme written by the author with the help of Mr. J. Grenot.
The temperature T at an optical depth t was assumed to be given by
T4 = To4( 1 + § t ) ................................ (1)where T , the boundary temperature, is related to the effective
temperature T^ by
2 T 4 = T 4o eThe variation of the gas pressure with optical depth is computed from
d Pg = g dT K (2)
Ueno's table of log k is given as a table of log Pp versus 6. For
convenience this was changed, using the table of log in terms of log P
and 0, into a table of log ~k in terms of log P and 0. This opacitygtable was fed into the 650. The machine was supplied with the
appropriate values of 0 and log g and starting values of log P and d Po g g
(10) Ueno, S., Contrib. of the Inst, of Astrophysics, Univ. of Kyoto,
No. 42, 1954.
(11) Ueno, S., S. Saito and J. Jugaku, Contrib. of the Inst, of Astrophysics,
Univ. of Kyoto, No. 43, 1954.
(l2) Unsold, A., Zs. f, Ap. 21, 22, 1941.

20
and an estimate of the first values of dr. It looked up the appropriate
values of log ~k and integrated eqn* (2) by Simpson’s rule. This gave
another value of It . This process continued until two values of dr
agreed to within a certain accuracy. This accuracy was programmed to he
a function of t. When the required agreement in dj had teen obtained the
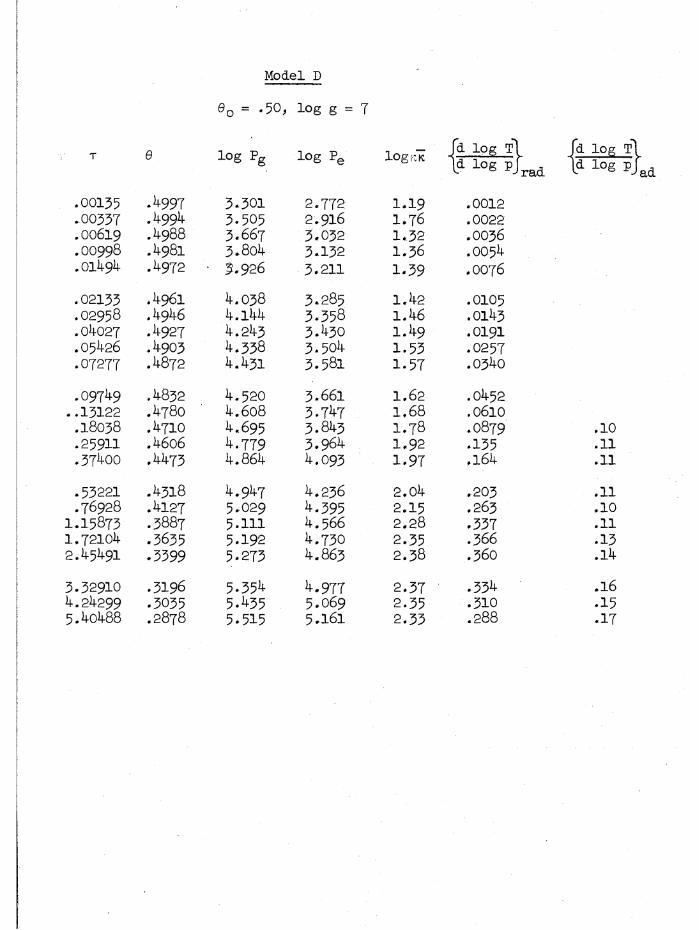
machine printed out r, log P , log ~k, Q and the radiative temperaturef d log T "1gradient " l og P Jred* va-*-ues obtained- are given in the
accompanying tables. The adiabatic temperature gradient
is also given in the tables. This gradient was obtained from Unsold’s
graph (13). It will be seen that ^ iog""p J"ad sma --'-er than f d log T 11 d i o g p (rad ^or moc e -*-s at quite small optical depths. Miss Hack (l4) computed the emergent fluxes from model atmospheres in which
the transfer of heat in the convective zones was either purely by
radiation or purely by convection. Comparing her results with the
observational data of Barbier, Chalonge and Divan (15, 16), she concluded
that only for supergiants are the effects of convection non-negligible.
We have consequently taken our models to be in radiative equilibrium
throughout. The computation of the continuous spectra and line profiles
(l3) Unsold, A., "Physik der SternatmoSphären", 2 Aufl. Springer 1955 P* 231.
(1*0 Hack, M., B.A.N. XIII, 1, 1956.(15) Barbier, D., and D. Chalonge, Ann. d ’Ap. 4, 30, 19^1.
(16) Chalonge, D., and L. Divan, Ann. d ’Ap. 15, 201, 1952.

21
of these model atmospheres was carried out using the IBM 610 Computer at
Mt. Stromlo. The ratio of the continuous absorption coefficient to the
Rosseland mean, was evaluated at wavelengths of 3272, 3535* -000,
^3^0 and 5250 A. The optical depths in the continuum, It , was
evaluated from
d-r.. = dTA K
The emergent flux of radiation, F(a ), at wavelength A is given byp 00
F(A) ■ % SA b A) e 2 (ta) .................. (3)
where S (t>) is the source function and E9(t.) is the second exponential A A ^ Aintegral. In all the models considered here the scattering coefficient,
a, is much smaller than k and so we may replace the source function byAthe Planck function B.(t, )• Eqn (3) then becomesA A
p OO
F(A) - 2J 0 BA(ta ) E2 (xA) ......................... (4)
This integral was evaluated using the Reiz two term formula (17).The results obtained for the 6 models are given in Table 3*1*
This table shews that the slope of the continuum to the redward side of
the Balmer limit depends only very slightly on 6Q and g whereas the Bal-
mer discontinuity depends critically on 0n and is almost independent of
g. The model which gives the best agreement with the observed spectral
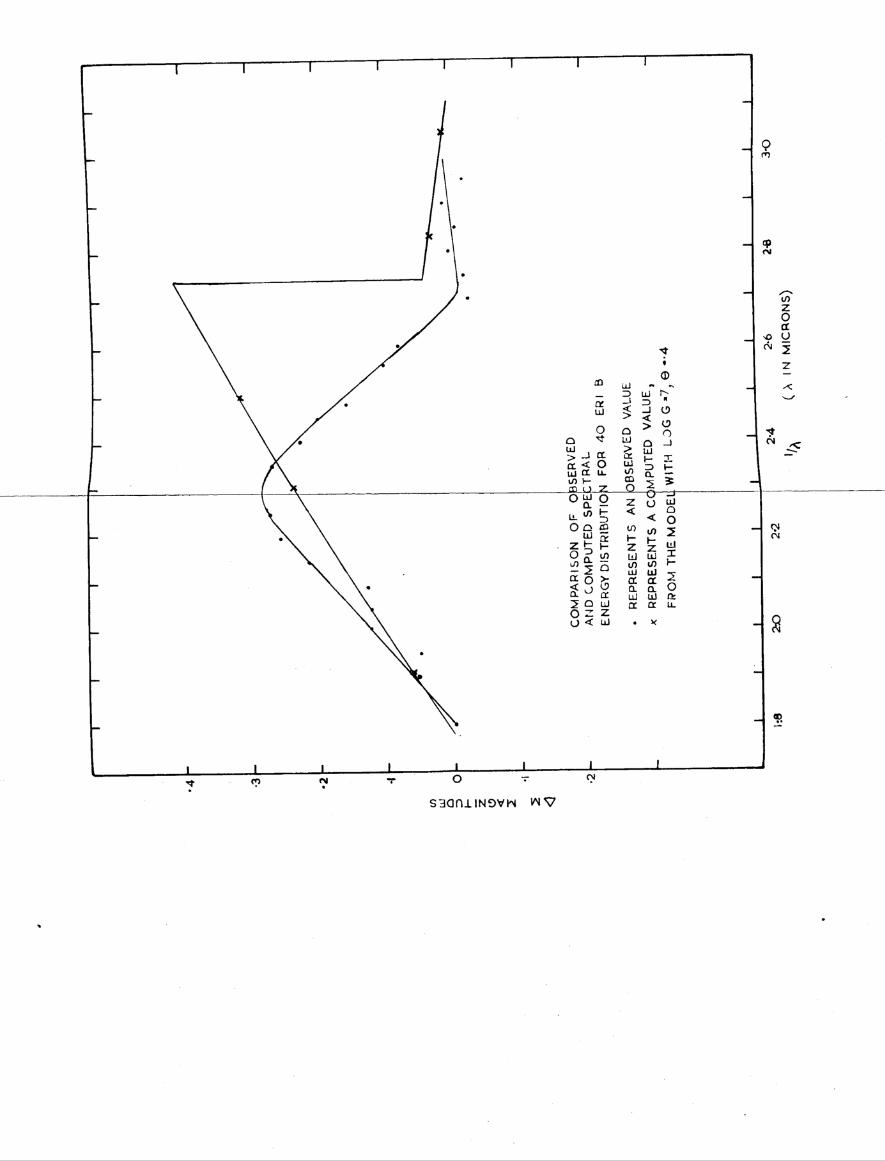
energy distribution of 40 Eri B is model B. The computed energy
distribution is compared with the observed one in the accompanying graph.
(17) Reiz, A., Lund Meddelanden Ser. 1, No. 171, 1950.

22
This model gives fairly good agreement with the observed Balmer
discontinuity but the slope of the continuum between 525OA and bjkOA seems to be too small. This could be remedied by saying that the
star is hotter than any of our models but this would ruin the good
agreement between the observed and computed Balmer discontinuities.
It would also disagree with the estimates of the temperature of the
star made from the mass and radial velocity data, which suggest that
model B itself may be too hot.
Liller (l8) has suggested that 40 Eri B may have a high
helium content and Liller and Tull (19) have constructed a series of
as yet unpublished model atmospheres for this star with Tq = 11,000,
15,000, 20,000, 25,000, 30,000 and 35,000°K, H/He abundance ratios of
0, 0.10, 0.25 and 0.40 and log g = 8. Whilst it will be of great
interest to see the continuous spectra computed from the models with
T = 11,000 °K, the absence of He I lines in the bluer DA stars would
seem, in general, to argue against a high helium abundance. Another
possibility is that the H/metals ratio may be much smaller than that
assumed in the construction of our models. The desired effect is an
increase in the electron pressure relative to the gas pressure. This
will increase the opacity of H relative to that of atomic hydrogen and
(18) Private communication.
(19) Report of the Observatories of the University of Michigan, A.J.65, 539, I960.
23
thus will reduce the Balmer discontinuity of a star with given
temperature. Some other evidence of the existence of a higher
electron pressure than that given by our models may be gleaned from
the line profiles.
The profile of Hy has been computed for the six models we
have calculated. Hy was chosen because the observational data for it
are probably better than for any other line as, unlike Hß, it lies in a
region where the sensitivity of 103a-0 and IIa-0 plates is not rapidly
changing and its redward wing is unlikely to overlap with the blueward
wing of Hß.
The line absorption coefficient for a Stark-broahened
hydrogen line may be written as (20)
a(AA) = { 1 + § (AA, Ne, T) }O''— & is the ratio of the electronic to the ionic contribution towardsonthe broadening of the line. It may be written as
(AA, Ne, T) = R (Ne, T) (AA)1/2
where R has been evaluated for Lyman-a, Lyman-ß, Ha, Hß, Hy and H5 by
Griem, Kolb and Shen (21). Ng is the electron density, AA the distance
from the line centre, Fq is the "normal field strength" and is given by
F = 2.61 e N2/3 , and C is a constant for each line. The coefficient o e 7
(20) Aller, L.H. and J. Jugaku, Ap. J. 130, 469, 1959*
(2l) Griem, H., A.C. Kolb and K.Y. Shen, Phys. Rev. Il6, 4, 1959*

24
of line absorption, k , is given by
k = N Cc(a A) ( 1 - e"hv/kT )V O j 2where N is the number of hydrogen atoms in the second level per gram
°> 2of stellar material and the factor (l - e -v/kT allows for the induced
emission. We compute the optical depth in the line from the relation
drv = kVi +_K
and in the continuum fromdT
dr = jo. dT K
The residual intensity in the line, r.., is given byA
AJo Bv(tv) E2(tv) drv
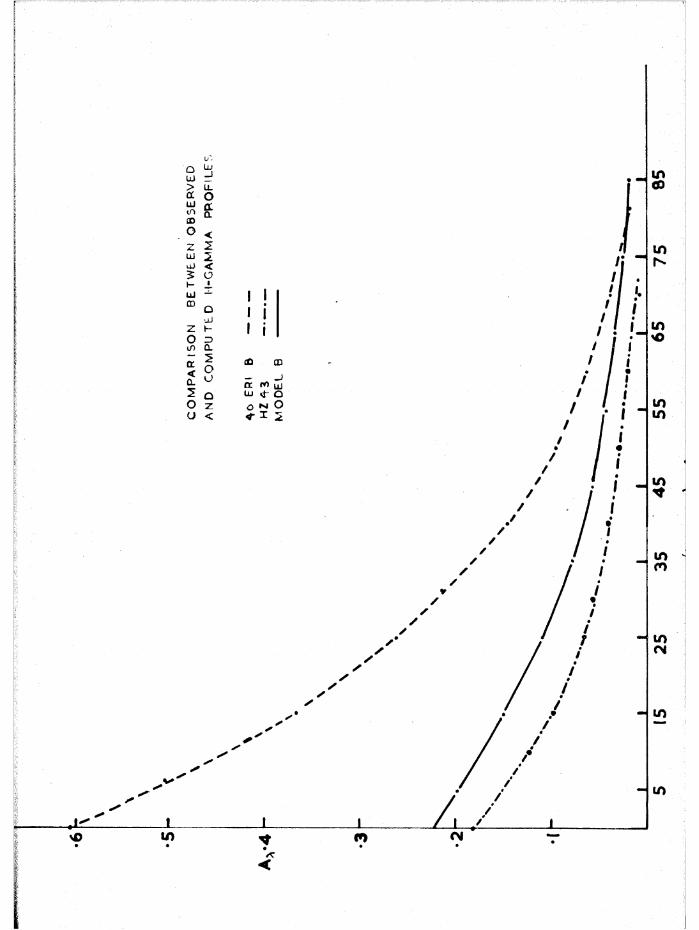
r ba(ta} e2(ta) dTxwhere, as before, we have replaced the source function by the Planckfunction. The line profiles obtained for the various models are givenin the accompanying graph, where A = 1 - r . A comparison of theseA Aline profiles with that observed for ko Eri B shews that the lines are too shallow in the core and too deep in the wings. The agreement between the observed profile for HZ 43 and the computed profile for model B is much better. The fact that the calculated depth of the wings is greater than the observed value could be explained by the
assumption that the continuum has been wrongly placed when reducing the observational material. This does not explain the poor agreement
in the line centre of 40 Eri B, however. The profile of the line depends to some extent on the values of at various wavelengths as
25
i s v i r t u a l l y c o n s ta n t a c ro s s a l i n e . The r a t i o o f k a t 4 A from th ev
l i n e c e n t r e to t h a t a t 25 A i s
k„(M = 2 5 (1 + 2R)Kv (25) ij.5/2 (-]_ +
R d e c re a se s m o n o to n ica lly w ith in c re a s in g N a t c o n s ta n t te m p e ra tu re .e
A d e c re a se in R w i l l in c re a s e k ( 4 ) / k (25) . This w i l l cause av vr e l a t i v e in c re a s e in th e d ep th o f th e l i n e a t 4A from th e l i n e c e n tre
a s com pared to t h a t a t 25A.
C le a r ly i t would he o f g r e a t i n t e r e s t to c a lc u la te th e
c o n tin u o u s s p e c tr a and l i n e p r o f i l e s f o r a s e r i e s o f w h ite dw arf models
in w hich th e r e i s a much h ig h e r p ro p o r tio n o f m e ta ls th a n we have u sed .
As, d u rin g i t s e v o lu tio n , a s t a r i s c o n t in u a l ly c o n s tru c t in g m e ta ls ou t
o f hydrogen and he lium th e chances t h a t i t c o n ta in s a h ig h e r m e ta ls /
hydrogen r a t i o th a n norm al i s q u i te good. Ueno u sed a hyd rogen /m eta l s
r a t i o o f 1 0 4 by number. The io n i s a t io n o f th e m e ta ls was n o t c a lc u la te d
f o r each m e ta l in d iv id u a l ly b u t by c o n s id e r in g a "mean" m e ta l o f
i o n i s a t io n p o te n t i a l 7*72 ev. Under th e s e c o n d it io n s th e m e ta ls
c o n t r ib u te s u b s t a n t i a l l y to th e e le c t r o n p re s s u re on ly when hydrogen
and he liu m a re la r g e ly u n io n is e d , p a r t i c u l a r l y as on ly s in g le io n iz a t io n
i s c o n s id e re d . More d e t a i l e d c a l c u la t io n s o f th e c o n t r ib u t io n o f m e ta ls
to th e e l e c t r o n p r e s s u re , w ith a hydrogen /m eta l s r a t i o o f 1 0 2 o r so ,
would be o f g re a t v a lu e f o r th e s tu d y o f 40 E r i B.
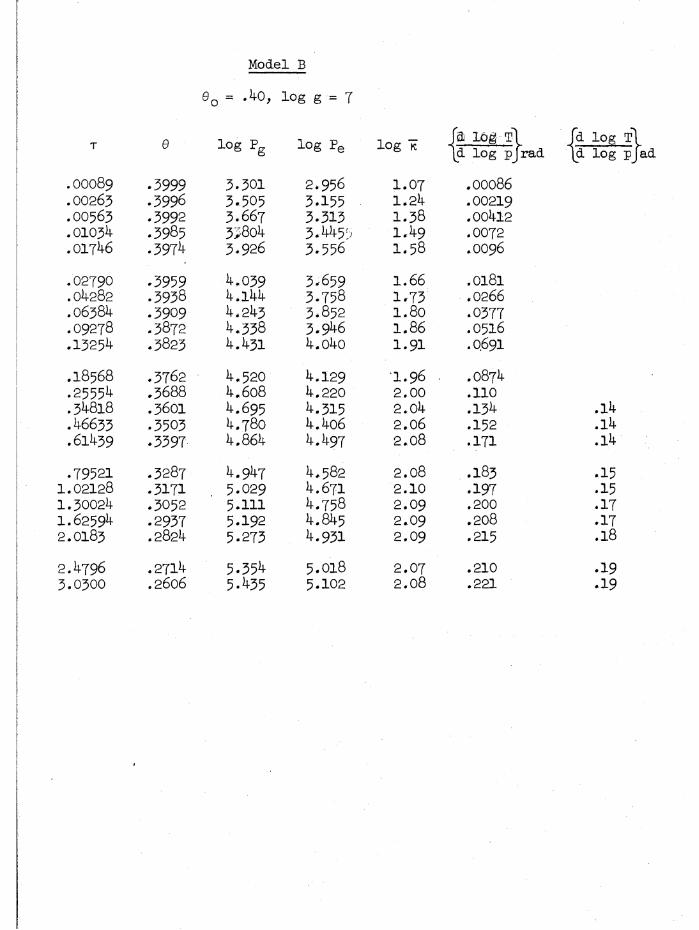
M odel B
.00089
.00263
.00563
.01034
.01746
.02790
. 04282
. 06384
. 09278
.13254
.18568
.25554
.34818
.46633
.61439
•795211.021281 .3 0 0 2 41.625942.0183
2.47963 .0 3 0 0
0 O = .4 0 , lo g g = 7
0 lo g Pg lo g Pe lOg K jd lo g T ||d lo g p j r a d
Jd lo g t \|d lo g p ja d
•3999 3.301 2.956 1.07 .00086.3996 3.505 3.155 1.24 .00219.3992 3.667 3.313 1.38 .00412.3985 3 .8o4 3.445 1.49 .0072.3974 3.926 3.556 1.58 .0096
.3959 4.039 3.659 1.66 .0181
.5938 4.144 3.758 1.73 .0266
.3909 4.243 3.852 I.80 .0377
.3872 4.338 3.946 1.86 .0516
.3823 4.431 4.040 1.91 .0691
.3762 4.520 4.129 1.96 .0874
.3688 4.608 4.220 2.00 .110
.3601 4.695 4.315 2.04 .134 .14
.3503 4.780 4.4o6 2.06 .152 .14
.3397 4.864 4.497 2.08 .171 .14
.3287 4.947 4.582 2.08 .183 .15
.3171 5.029 4.671 2.10 .197 .15
.3052 5.111 4.758 2.09 .200 .17
.2937 5.192 4.845 2.09 .208 .17
.2824 5.273 4.931 2.09 .215 .18
.2714 5.354 5.018 2.07 .210 .19
.2606 5.435 5.102 2.08 .221 .19
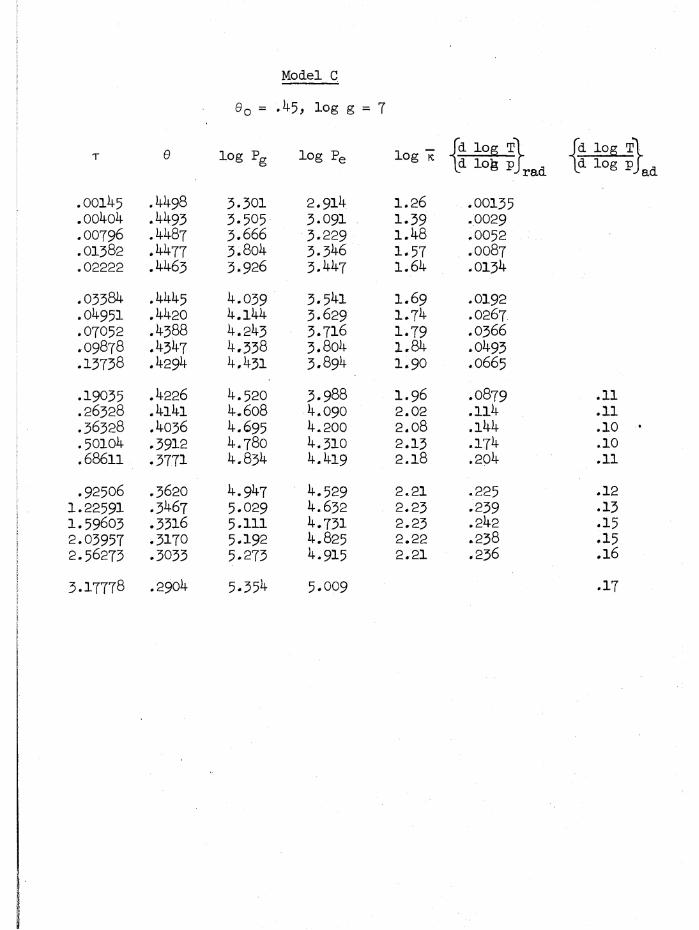
Model C
0n = .4 5 , lo g g = 7
T 0 lo g Pg
.00145 .4498 3.301
.004o4 .4493 3.505
.00796 .4487 3.666
.01382 .4477 3 .8 o4
.02222 .4463 3.926
.03384 .4445 4 .039
.04951 .4420 4 .144
.07052 .4388 4.243
.09878 .4347 4 .338
.13738 .4294 4.431
.19035 .4226 4 .520
.26328 .4 l 4 l 4 .608
.36328 .4036 4.695
.50104 .3912 4 .780
.68611 .3771 4 .834
.92506 .3620 4 .9471.22591 .3467 5.0291.59603 .3316 5.1112.03957 .3170 5.1922.56273 .3033 5.273
3.17778 .2904 5.354
lo g Pe lOg K fd lo g T| \ d lofe P jz
2 .914 1 .2 6 .001353.091 1 .3 9 .00293 .229 1 .4 8 .00523.346 1 .5 7 .OO873 .447 1 .6 4 .0134
3 .541 1 .6 9 .01923 .629 1 .7 4 .02673.716 1 .7 9 .03663 .8 o4 1 .8 4 .04933.894 I .9 0 .0665
3 .988 1 .9 6 .08794 .090 2 .0 2 .1144 .200 2 .0 8 .1444 .310 2 .1 3 .1744 .419 2 .1 8 .204
4 .529 2 .21 .2254.632 2 .2 3 .2394.731 2 .2 3 .2424.825 2 .2 2 .2384.915 2 .2 1 .236
5.009
fd lo g T~))d lo g p | ad
.11
.11
.10 •
.10
.11
.12
.13
.15
.15
.16
.17
.00135
.00337
.00619
.00998
.01494
.02133
.02958
. 04027
.05426
.07277
.09749 ..1 3 1 2 2
.18038
.25911
.37400
.53221
.76928 1 .15873 1 .721042.45491
3.32910 4 .24299 5. 4o488
Model D
0 o = .5 0 , lo g g = 7
9 lo g Pg lo g Pe lOg K fd lo g T|
ld l0 g PJ ra d
fd lo g t \
ld lo g PJad
.4997 3.301 2.772 1 .1 9 .0012
.4994 3.505 2.916 1 .7 6 .0022
.4988 3 .667 3 .032 1 .3 2 .0036
.4981 3 .8 o4 3 .132 1 .3 6 .0054
.4972 3 .926 3 .211 1 .3 9 .0076
.4961 4 .0 3 8 3.285 1 .4 2 .0105
.4946 4 .144 3 .358 1 .4 6 .0143
.4927 4 .243 3 .430 1 .4 9 .0191
.4903 4 .338 3 .504 1 .5 3 .0257
.4872 4.431 3.581 1 .5 7 .0340
.4832 4 .520 3.661 1 .6 2 .0452
. 4780 4 .6 0 8 3 .747 1 .6 8 .0610
.4710 4.695 3 .843 1 .7 8 .0879 .10
.4606 4 .7 7 9 3 .964 1 .9 2 .135 .11
.41+ 73 4 .864 4.093 1 .9 7 .164 .11
.4318 4 .947 4 .236 2 .0 4 .203 .11
.4127 5.029 4 .395 2 .15 .263 .10
.3887 5.111 4 .566 2 .2 8 .337 .11
.3635 5.192 4 .7 3 0 2 .35 . 366 .13
.3399 5.273 4 .863 2 .3 8 .360 .14
.3196 5.354 4 .977 2 .3 7 .334 .16
.3035 5.435 5.069 2 .3 5 .310 .15
.2878 5.515 5.161 2 .33 .288 .17
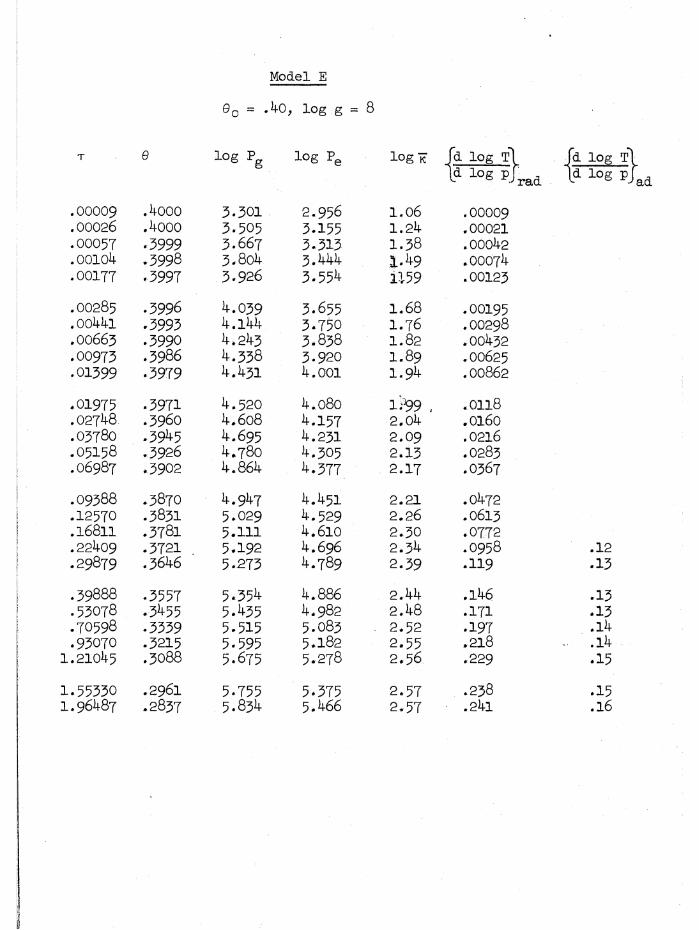
M odel E
0 O = -hO, lo g g =
T 0 lQg Pg log Pe
.00009 . 4ooo 3.301 2 .956
.00026 , 4ooo 3.505 5.155
.00057 .3999 3.667 5.315
. o o io 4 .3998 3 . 8o4 3 .444
.00177 .3997 3.926 3 .554
.00285 .3996 4.039 3.655
. oo44i .3993 4.144 3 .750
.00663 .3990 4.243 3 .838
.00973 .3986 4.338 3.920
.01399 .3979 4.431 4.001
.01975 .3971 4.520 4.080
.02748 .3960 4 .6 0 8 4.157
.03780 .3945 4.695 4.231
.05158 .3926 4 .7 8 0 4.305
.06987 .3902 4.864 4.377
.09388 .3870 4 .947 4.451
.12570 .3831 5.029 4.529
.16811 .3781 5.111 4.610
.22409 .3721 5.192 4 .696
.29879 . 3646 5.273 4 .789
.39888 • 3557 5.354 4.886
. 53078 .3455 5.435 4 .982
.70598 • 3339 5.515 5.083
.93070 .3215 5.595 5.1821.21045 .3088 5.675 5.278
1.55330 .2961 5.755 5.3751.96487 .2837 5.834 5.466
lOg K fd log t | fd log t )ld log PJrad ld log pJad
l . o 6 .000091.24 .000211 .3 8 .000421.19 .000741159 .00123
1 .6 8 .001951 .7 6 .002981 .8 2 .004321 .8 9 .006251.94 .00862
I .9 9 .01182.04 .01602 .0 9 .02162.13 .02832 .1 7 .0567
2 .21 .04722 .2 6 .06132 .3 0 .07722.34 .0958 .122.39 .119 .13
2.44 .146 .132.48 .171 .132.52 .197 .142.55 .218 .142 .5 6 .229 .15
2.57 .238 .152.57 .241 .16

M odel F
d o = l o § g = 8
T e lo g Pg lo g Pe lOg Kjd lo g T*\l d lo g p j r a d
fd lo g \ d lo g
.00015 .45 3.301 2.913 1 .2 6 . o o o i4
. ooo4o .4499 3.505 3.090 1 .39 .00029
.00079 .4499 3.667 3.225 1148 .00052
.00138 .4498 3 . 8o4 3.339 1.57 .00088
.00220 .4496 3.926 3.434 1 .6 3 .00135
.00333 .4494 4.039 3.520 1 .6 8 .00196
.00485 .4492 4.144 3 .598 1.72 .00272
.00684 .4489 4.243 3.671 1.77 .00382
.00947 .4484 4.338 3 .743 I .8 0 .00510
.01291 .4478 4.431 3.811 1.84 .00686
.01735 .4471 4.520 3.873 1 .8 7 .00897
.02307 .4462 4 .608 3.935 1.90 .0117
. 03o4o .4450 4.695 3.999 1.93 .0151
.03979 4.780 4.065 1 .9 6 .0194
.05180 .4417 4.864 4.128 1 .9 8 .0243
.06708 .4595 4.947 4.192 2 .0 1 .0308
.08676 .^365 5.029 4 .259 2.04 .0390
.11217 .4328 5.111 4.330 2.07 .0488
.14563 .4283 5.192 4.406 2 .1 2 .0631
.19108 .42251 5.273 4.492 2 .1 8 .0826
.25436 .4151 5.354 4.590 2.24 .107 .11
.34308 .4056 5.435 4 .698 2.31 .137 .11
.46962 .3938 5.515 4.820 2.39 .177 .11•65557 .3792 5-595 4 .960 2.48 .225 .12.92890 .3618 5.675 5.103 2.57 .275 .13
1.32184 .3424 5.755 5.245 2.64 .312 .131.86053 .3225 5.834 5.378 2 .7 0 .338 .142.55769 • 3039 5.914 5.496 2 .7 0 .321 .153.35404 .2871 5.993 5.606 2 .7 1 .314 .16
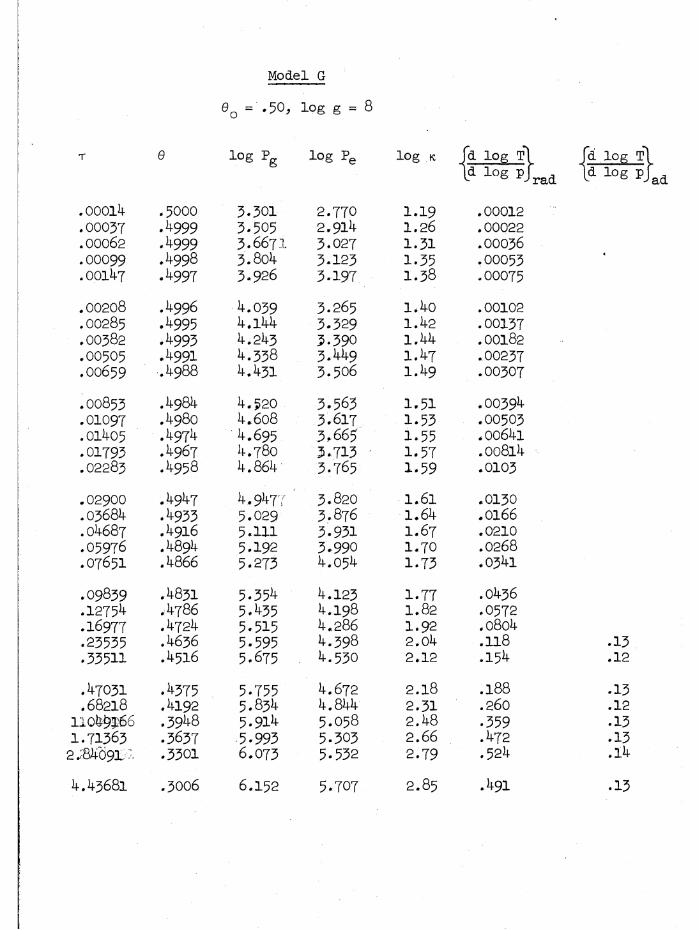
M odel G
0 Q = . 5 0 , lo g g = 8
T el o g p g log Pe lOg K ja. lo g t ]
lo g P jradfd log t ]| d log PJad
. 00014 .5000 3.301 2.770 1.19 .00012
.00037 .4999 3.505 2.914 1 .2 6 .00022
.00062 , k 999 3 .6 6 7 3.027 1.31 .00036
.00099 .4998 3 .8 o4 3.123 1.35 .00053
. 0 0 1 4 7 A997 3 .9 2 6 3.197 1.38 .00075
.00 2 0 8 .4996 4.039 3 .2 6 5 l . 4 o .00102
.00285 .**995 4.144 3.329 1.42 .00137
.00382 .1*993 4.243 3.390 1.44 .00182
.00505 .1*991 4.338 3.449 1.47 .00237
.00659 .4988 4.431 3 .5 0 6 1.49 .00307
.00853 .4984 4.520 3 .5 6 3 1.51 .00394
.01097 .4980 4.608 3 .6 1 7 1.53 .00503
.01405 .4974 4 .6 9 5 3.665 1.55 . 0064l
.01793 .1*967 4 .7 8 0 3.713 1.57 . 0 0 8 l4
.02283 .4958 4.864 3 .7 6 5 1.59 .0103
.02900 .4947 4 .9 4 7 3 .8 2 0 1 .6 l .0130
.03684 .1*933 5.029 3 .8 7 6 1.64 .0166
.04687 .4916 5.111 3.931 1 .6 7 .0210
. 0 5 9 7 6 .4894 5.192 3.990 1.70 .0268
. 0 7 6 5 1 . 4866 5.273 4.054 1.73 .0341
.09839 .4831 5 . 3 5 1 * 4.123 1.77 .0436
.12754 .4786 5.1*35 4.198 1 .8 2 .0572
. 1 6 9 7 7 .4724 5.515 4.286 1.92 .o 8 o4
.23535 .4636 5-595 4.398 2.04 .1 1 8 .13
.33511 .4516 5 . 6 7 5 4.530 2.12 .154 .12
.47031 .**375 5.755 4.672 2 .1 8 .188 .13
.68218 .4192 5 . 8 3 1 * 4.844 2.31 .260 .121 . 0 4 9 1 6 . .3948 5 . 9 1 1 * 5 .0 5 8 2.48 • 359 .131 . 7 1 3 6 3 . 3 6 3 7 5.993 5.303 2.66 .472 .13
2.84091 .3301 6 . 0 7 3 5.532 2.79 .524 .14
4 .4 3 6 8 1 .3006 6 .1 5 2 5.707 2 .8 5 .491 .13
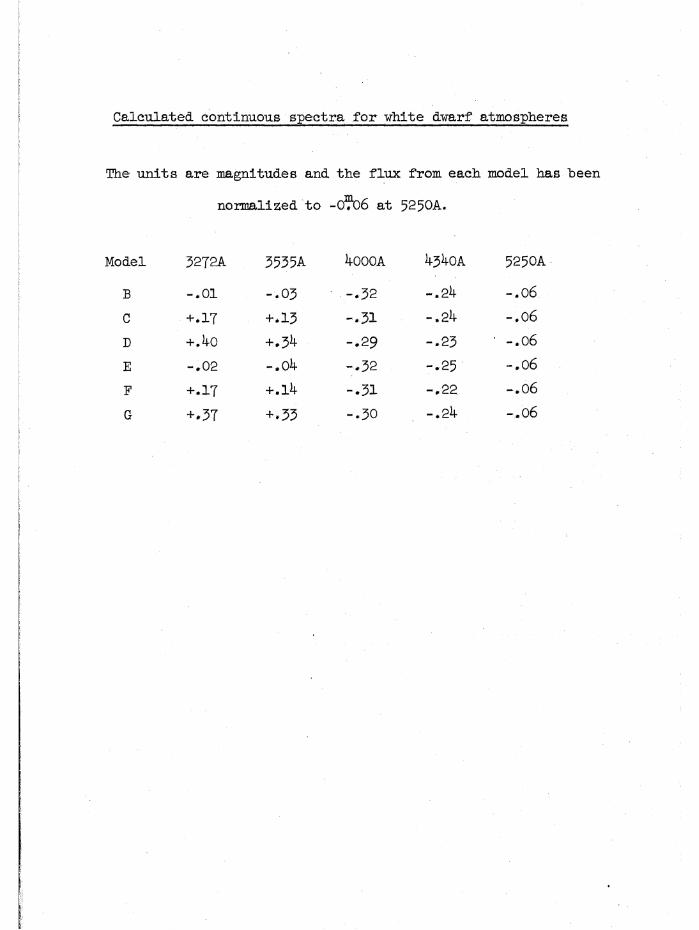
Calculated continuous spectra for white dwarf atmospheres
The units are magnitudes and the flux from each model has been normalized to -O^OÖ at 5 2 5 0A.
Model 3272A
B - . 0 1
C + .17D +.4oE - . 0 2
F +.17G +.37
3535A 4oooa
-.03 -.32+ .13 -.31+.3^ -.29-.04 -.32+.14 -.31+.33 -.30
4340A 5250A-.24 - . 0 6
-.24 - . 0 6
-.23 - . 0 6
-.25 - . 0 6
- . 2 2 - . 0 6
-.24 - . 0 6

u. Q ü j ( j ld
<
y Ipver - <]
inCD
mr^
in>o
inin
m*
inm
inCN
m
in
«0D aJ ««
3 UJCL —1 3 NUJ $ -J
<o
O Q > oo
a UJ o 3UJ > UJ> -J CL a K- xCL < o UJ 3UJ a Li. iS) CLvnCL
\ -(3 z
CDO
*
o £ oLL UJO Qlli
3ca nc. t- lO
'H 5 Q5 °< oQ.2 o O z o <
z<inI-zLÜinlUaaLÜa
UJQ0 5 u1 H2 O ctU.
<9rg
vO
■<*CM
CM
1■»t
S B d rU IN O V N W V
( x
I N
MIC
RO
NS
)
26
CHAPTER 4
The A -670 Stars
Greenstein (l, 2) has discussed the stars W219 and
LÖ79-14 as -well as some other white dwarfs. My own observations
(Chapter 2) have shewn that the star Ll45-l4l is similar to W219
and L879-l - in that the only feature visible in the blue region of the spectrum is a broad, shallow band centred at ?\4670.
Greenstein suggests that this may be a molecular feature, in
particular C2 "with structure blurred, altered and shifted by
high pressure.", the temperature being too low to permit its
identification with Hell 4686, blended with CIII, CIV and NIII
at 4630-4650A. In this chapter it is shewn that the feature is
caused by molecular carbon, the calculations being performed
without including pressure effects. The assumption is made that
the band is formed in a layer whose temperature is approximately
equal to the effective temperature of the star. The effective
temperature of W219 is 7500°K (Greenstein, (l)). That of L879-14
would seem to be about the same whereas Ll45-l4l seems rather
hotter. The calculations have been carried out for temperatures
of 7500° and 10000°K. The method used to carry out the calcul
ations is given in some detail below.
(l) Greenstein, J.L., Ap. J. 126, l4, 1957*
(2) Greenstein, J.L., Ap. J. 126, 19, 1957*

27
The spectrum o f a m o lecu le i s co m p le te ly d i f f e r e n t to
t h a t o f an atom. A m o lecu le , such as th e c a r to n m o lecu le , p o sse sse s
an e l e c t r o n system and th e d isp la c e m e n t o f an e le c t r o n from one
o r b i t to a n o th e r w i l l r e s u l t in th e em issio n o r a b s o rp tio n o f
r a d ia t io n . T his i s ana logous to th e case o f an atom; how ever,
u n l ik e an atom, a m olecu le a ls o p o s se s se s v ib r a t i o n a l en erg y , E^, and
r o t a t i o n a l en e rg y , E . D enoting th e change in e l e c t r o n ic energy
f o r a p a r t i c u l a r e l e c t r o n i c t r a n s i t i o n by AE , we have th e change in
t o t a l energ y g iv e n by
AE = AE + AE + AE e v r
a s a t r a n s i t i o n may r e s u l t in changes o f e l e c t r o n i c , v ib r a t io n a l
and r o t a t i o n a l en e rg y . W ritin g AE = hv we have
v = v + v + v e v r
where v » v » v e v r
The freq u en cy i s known as th e freq u en cy o f th e band
system and i s a p p ro x im a te ly e q u a l to th e freq u en cy o f th e 0 -0 band,
w hich i s th e band f o r w hich no v ib r a t i o n a l changes ta k e p la c e . Let
u s suppose from now on t h a t we a re d e a l in g w ith th e case o f a b s o rp tio n ,
in w hich th e m olecu le goes from aa s t a t e o f low er e l e c t r o n ic e x c i t a t
io n to one o f h ig h e r e l e c t r o n i c e x c i t a t io n . I f th e v ib r a t i o n a l
en erg y o f th e low er e l e c t r o n i c l e v e l i s l e s s th a n th e v ib r a t io n a l
en erg y o f th e u p p er e l e c t r o n i c l e v e l th e n th e ab so rb ed quantum must
be o f h ig h e r energ y and th e r e f o r e h ig h e r freq u en cy th a n when no
v ib r a t i o n a l energ y change ta k e s p la c e . S im i la r ly i f th e v ib r a t i o n a l

28
energy decreases in the transition then the absorbed quantum needs
less energy than when no vibrational energy charge occurs. As the
vibrational quantum number can change by more than unity, a whole
series of bands can be caused by a single electronic transition.
In cases where more than one electronic transition is possible the
spectrum can become very complicated, as in the case of the hydrogen
molecule, but the whole series of Swan bands can be assigned to a
single electronic transition. Each band is then described by two
quantum numbers, v' for the upper electronic state and v" for the
lower, and the band is known as the (vT,v") band.
According to the above description, a band would be
represented by a single line. 'A: photograph of the Swan bands
shews that this is not the case and a band consists of a series of
lines. These are caused by changes in the rotational energy of
the molecule. Such changes are more restricted than are the
vibrational ones; the rotational quantum number can only change
by ±1 or 0. The latter still causes a series of lines instead of
a single strong line because the transition causes a change in the
moment of inertia of the molecule and consequently a change in the
rotational energy.
When a spectrum such as that of C2 is analysed, ignoring
for the moment changes in the rotational energy, it is found that
the wave numbers of the band origins can be represented by a formula
of the kind
29
v = v0 + G0(v') - G0 (v") ..................... (1)
where GQ(v)hc is the energy of a vibration state with quantum number
v. By the band origin we mean the line which would result from
the rotational transition J = 0 to J =0. Generally Go(v)hc can be
represented by a formula of the kind
GQ(v)hc = wv - wxv2
but, to obtain greater accuracy for the higher vibrational bands,
higher powers of v must be included.
It has been stated above that the rotational quantum number
J can only change by ±1 or 0. Each of these cases gives rise to a
different set of lines, known as branches. The change J + 1 to J
gives the R branch, J to J the Q branch and J to J + 1 the P branch.
The wave numbers of the branches are given in Hersberg (3)* They
are
v = v + 2B , + (3B B „)J + (B B ,,)J2 r v v ' v v vv = V + (B B „)(J + J2) q ' v ' v v '
v = v - (B ,+ B ,,)J + (B B ,,)J2 p v v v v v
where v varies for the different vibrational bands and is given by
equation (l) above. In these formulae B t and B „ are functions
of v T and v" respectively. For the 1-0 band of C2, where v' = 1
and v" = 0, we have B^ = 1.7247 and B^ = 1.6239 whence B^-B^ =
As this latter quantity is positive and will increase
))) • • (2)
(3) Herzberg, G., The . Spectra of Diatomic Molecules, Van Nostrand,
p. 111.

30
immediately with increasing J whilst will eventually do so.Thus the 1-0 hand of C2 will he sharp on the red side and will
degrade towards the violet. As will he seen from Table 1, thisis a property of all the C2 hands discussed here. Corresponding
values of B B „ for the 0-0 and 0-1 hands are .1215 and .1386respectively. Thus the rotational lines in all three branches
of the 1-0 hand will be closer together than those of the 0-0 hand,which in turn will have closer rotational lines than the 0-1 hand.As the value of B .+ B „is much greater than B B v will v 1 v v v palways decrease at first with the separation between the lines
decreasing until it reaches some minimum value. It will then start to increase with the separation increasing. The rotational lines will he crowded closely together near the minimum value of v .
One of the factors which affects the intensity of a spectral feature is the number of atoms which are capable of absorbing the radiation. The ratios of the number of atoms in the various vibrational levels is proportional to their respective Boltzmann factors. Thus the ratio of the number of molecules in vibrational state v to that in the vibrational state 0 will be
exp(-GQ(v)hc/kT), GQ(v)hc being the energy of the vibrational state v above the ground level. G (v) has teen tabulated by Phillips (k) and his values for the ground electronic state are also given in Table 1. Similarly the number of molecules in a given vibrational
(k) Phillips, J.G., Ap. J. 108, kjk, 1948.
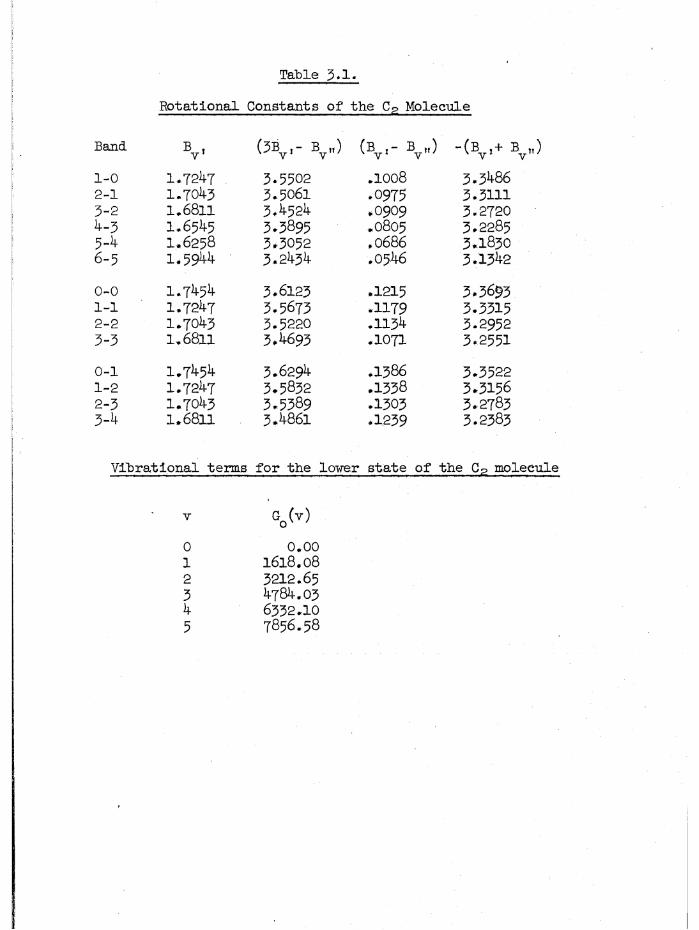
Table 3>1.
Rotational Constants of the CP Molecule
Band. B ,V (3B ,- B „) (B ,- B „) V v -(b ,+ :
1-0 1.7247 3.5502 .1008 3.34862-1 1.7043 3.5O6I .0975 3 . 3 m3-2 1.6811 3.4524 .0909 3.27204-3 1.6545 3.3895 .0805 3.22855-4 1.6258 3.3052 .0686 3.18306-5 1.5944 3.2434 .0546 3.1342
0-0 1.7454 3.6123 .1215 3.36931-1 1.7247 3.5673 .1179 3.33152-2 1.7043 3.5220 .1134 3.29523-3 I.6811 3.4693 .1071 3.25510-1 1.7454 3.6294 .1386 3.35221-2 1.7247 3.5832 .1338 3.31562-3 1.7043 3.5389 .1303 3.27833-4 1.6811 3.4861 .1239 3.2383
Vibrational terms for the lover state of the CP molecule
Y G (v) ov '
0 0.001 1618.082 3212.653 4784.034 6332.105 7856.58

Table 3» 2
R e la t iv e t r a n s i t i o n p r o b a b i l i t i e s o f Swan bands
v T T
v ’ 0 1 2 3 4 5 6 7
0 .731 .211 .042 .007 .001 .000 .000 .0001 .237 .363 .280 .088 .020 .005 .0002 .024 .356 .162 .280 .124 .0303 .001 .060 .405 .057 .2634 .000 .003 .097 .4275 .000 .000 .006
COt-
6 .000 .000 .3687 .000
Table 3 . 3 »
This t a b l e g iv e s G ( v ' , v M, T ) p ( v t , v ' t)exp(-G ( v ,f)hc/kT ) as a f u n c t io no f v ’ , v M and T
T = 7500°K
v * v" G V* v" G V» v" G
1 0 .237 0 0 .731 0 1 .1542 1 .261 1 1 .266 1 2 .1513 2 .2 1 8 2 2 .0 8 7 2 3 .1114 3 .171 3 3 .022 3 4 .0785 4 .1 1 26 5 ,0 8 l
T = 10000°K
v ' v" G v * v" G v 1 v" G
1 0 .237 0 0 .731 0 1 .1672 1 .282 1 1 .2 8 8 1 2 .1763 2 .255 2 2 .1 0 2 2 3 . l 4o4 3 .214 3 3 .0 2 9 3 4 .1065 4 .1526 5 .1 1 8

31
level with J=J relative to the number with J = 0 is (2J + l)
exp (. -B3yj(j + l)hc/kT), the factor (2J + l) arising because of
the splitting of each rotational state into (2J + l) sub-states
in the presence of a magnetic field. Thus the number of molecules
with v=v*and J=J relative to the number with v = 0 and J = 0 will
be given by
(2J + l) exp(-Bv ,j(j + l)hc/kT) exp(-Go(v')hc/kT) . . . (3)
As well as the number of molecules capable of absorbing
the radiation, the intensity of a spectral line depends upon the
transition probability. Phillips .\ 5, 6), discussing band
profiles for TiO and C2, has used the Minnaert equation for the
relationship between the depth at each point in a spectral line
AA
and the optical thickness xA1\
1 1A + x c XA
A^ being the limiting value of the line depth for infinitely large
optical depth. x is the product of the line absorption coefficient Aper molecule, QL , and the number of molecules producing a particular
spectral line, with initial rotational quantum number J anddwith X denoting the particular branch involved (X = P, Q or R).
(5) Phillips, J.G., Ap. J. 113, 183, 1952.
(6) Phillips, J.G., Ap. J. 123, 163, 1957.

32
Phillips includes the effects of loth Doppler motion and damping when where
QL a= a H(a.v) A o v '.. *V2e2X
meAmkT
Nj = C Sj exp I + 1) || \ ................ (k)
f is the oscillator strength for the particular electronic transition involved and thus is the same for sill the hand sequences of C2.
Phillips assumes a Boltzmann distribution of the molecules
whenC being constant for a given band. He can then write the Minnaert
equation in the form
1 1 1 Aa Ac KZSJ H(a,v) exp(iB-;;j(j + 1) hc/kT)
K being constant for a given band and the summation extending over
all lines making a contribution to the absorption at a given wavelength.
The technique which we propose to employ is similar to that of Phillips. In his work individual rotational lines could be resolved whereas in ours, because the spectra available are of lower dispersion, the rotational lines are blended together. The resolution of our spectra is about 5A and so we divide each wave
length interval to be considered into 5A sub-intervals.Rotational lines arising from several vibrational levels
will be found in most of the 5A intervals. Thus, instead of the
expression (4) used by Phillips we must use our expression (3) foritthe ratio of the number of molecules with v = v and J = J to that

33
with Y = 0 and J = 0. As the various vibrational levels have
different relative transition probabilities, when discussing the
influence of the various vibrational levels we must multiply the
number of atoms in each vibrational level by its respective
relative transition probability.
The Einstein transition probability of absorption, is given
B ii jv v8rr33h^c V v " I
In the case where the lower state is degenerate this becomes
B tI ,V V 18tf3 1 Ry» v » \2 3h^c dv"
dv" being the number of sub-states whence dv" = 2J + 1
The classical approximation for | is
lRv'v"l K ”K < dTlI e I I - ■ V ■ v
= |Rj2 p (v ‘,v ")Thus the number of molecules in the vibrational level v"and
rotational level J multiplied by the relative vibrational transition
probability will be proportional to
p(v',v") exp -Gq (v ‘) || j- exp -Bjfj(j + l) ~
Then, instead of using, as Phillips did,
we use
x. = A
3\
K Z Sj H(a,v) exp | - B;j(j + 1) || j
K Z Sj p(v',v") ex; + 1) £§}
where, since our material is of lower dispersion, we have neglected

3b
Doppler broadening and damping. We regard each rotational line asbeing formed at the wave-length derived from (2) and when computingthe band profile add up the intensities of all the rotational linesgiven in each 5 A interval. We must remember however that K is
proportional to otQ which in its turn is proportional to A but is
otherwise constant for the different bands. Thus we can rewrite
Minnaert1s equation as1 = 1 , 1A A KA Z p(v',v") exp (-G (v^hc/kT) exp J+l)hc/kT)
XThe intensity factors S can be evaluated from the Houl-J
Loudon formulae given in Herzberg (Ref. 3, p.208). The Swan bands
arise from the transition X 3TT A 3TI whence A = 1 and AA = 0.u gThe intensity factors then are
R _ (J + 1)(J - 1)SJ ~ JqQ - 2J + 1 J j(j + l)qP _ J(J + 2)bJ J + l
Tables of transition probabilities i.e. |ft ut ,dT|2 for molecular carbon have been calculated by many authors. In the present work those given by Frazer, Jarmain and Nicholls (7) will be used.These are given in Table 2 of this chapter. These transition probabilities have been calculated only up to v ’+v" = 7 but, with the aid of a calculating machine which can hold a large number of digits,
(7) Frazer, P.A., W.R. Jarmain and R.W. Nicholls, Ap. J. 119j 2Ö6, 195^*

35
they can be extended to higher values. The need for more transition
probabilities than are actually published can be seen by study of
Table 3 which gives the number of molecules in the various vibrational
levels multiplied by the respective transition probabilities. The
numbers for the 1-0 sequence are decreasing but that for the 4-3 band
is still quite large and we should like to have the results for the
5-4 and 6-5 bands. The technique for calculating these is given in
Jarmain and Frazer (8), and involves the addition and subtraction of
numbers which are very nearly the same in size. Above v ’+v" = 7 the
numbers are very hard to calculate on Marchant or Monroe machines.
Fortunately, however, Mt. Stromlo Observatory is equipped with an
IBM 610 calculator which, whilst very slow by the normal standards
of electronic computers, can handle numbers of up to 31 decimal digits.
The computations involved are not excessively long and so the slow
speed of the machine is no disadvantage. To improve the accuracy of
the results the "r^" shift (Frazer and Jarmain, (9)) was used.
The remainder of the calculations is quite simple. We■y
evaluate the function p(v',vM)S exp(-G (v")hc/kT)exp(-B ,,j(j+l )hc/kT)
for the values of v* and v" in which we are interested and for J
ranging from 0 to, say, 150. The calculations have been carried
out on the IBM 6l0. We sum the values of F(v,,v,,,j) which lie in
(8) Jarmain, W.R. and P.A. Frazer, Proc. Phys. Soc. A. 66, 1145, 1953»
(9) Frazer, P.A. and W.R. Jarmain, Proc. Phys. Soc. A. 66, 1153* 1953.

36
each 5A w aveleng th range and m u l t ip ly by A. We have two d isp o sa b le
c o n s ta n ts , A a n d K, w hich we u se to g e t th e b e s t f i t w ith th e
o b s e rv a t io n s . I t tu r n s o u t t h a t we can a l t e r th e s e q u i te c o n s id e ra b ly
and s t i l l g e t a good f i t , p ro b ab ly because th e o b s e rv a t io n a l d a ta
a re d e r iv e d from low d is p e r s io n m a te r ia l . The g raphs a re drawn
u s in g K = 3 .33x10” 7 a t 7500°K and 2 .5 x 1 0 "7 a t 10000°K and A = 1 .
The n ex t q u e s tio n i s w hether m o le c u la r carbon i s l i k e l y to
be p re s e n t in th e a tm ospheres o f th e A -670 w h ite d w arfs . M o lecu la r
carb o n i s known to be p re s e n t in th e atm ospheres o f many s t a r s ,
in c lu d in g th e sun , and S e a r le (lO ) has d e r iv e d a carbon to hydrogen
r a t i o o f 10 in th e s u p e rg ia n t v a r ia b le R Corona B o re a l is . I t i s
i n t e r e s t i n g to n o te t h a t t h i s s t a r i s an i r r e g u l a r v a r ia b le and i s
a p p a re n tly in a l a t e s ta g e o f s t e l l a r e v o lu tio n . When atom ic carbon
i s p re s e n t in th e atm osphere o f a s t a r , m o le c u la r carbon w i l l a ls o
be p r e s e n t , th e r e l a t i v e am ounts b e in g g iv en by th e e q u a tio n
In t h i s e q u a tio n pr i s th e p a r t i a l p re s s u re o f atom ic ca rb o n , pc 2
th e p a r t i a l p re s s u re o f m o le c u la r carbon and Kcc depends on th e
te m p e ra tu re and d i s s o c ia t io n p o t e n t i a l . T his l a t t e r q u a n t i ty i s)
n o t w e ll known f o r m o le c u la r carb o n b u t , u s in g th e v a lu e o f 6.7 e .v .
g iv e n by de J a g e r and Neven ( l l ) and th e t a b l e s o f P ecker and
(10) S e a r le , L . , Ap. J . 133> 531> 1961.
(11) de J a g e r , C., and L. Neven, Mem. Soc. R. S e i. L iege l8 , 357, 1957.
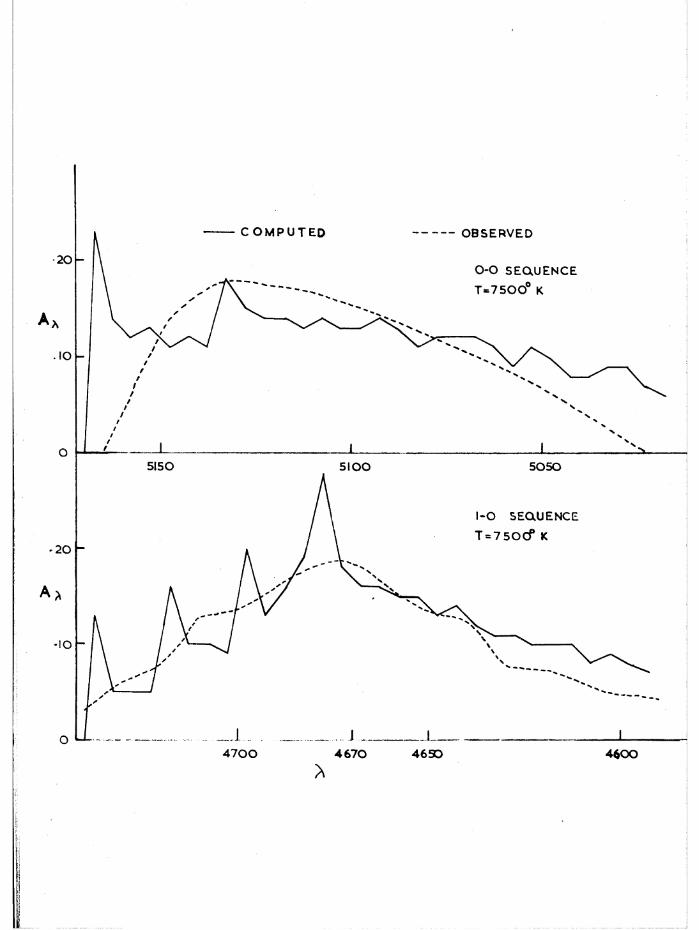
C O M P U T E O OBSERVED
0 - 0 SEO UENCE
5150 5 1 0 0 5 0 5 0
1-0 SEQUENCE
4 7 0 0 4670 4 6 5 0 4600
*

COMPUTED --OBSERVED
0 -0 SEQUENCE
T» lOOOCf K
51005150 5 0 5 0
-O SEQUENCE
46704 7 0 0 4650 4 6 0 0
56
00
5
55
0
55
00
37
Peuchot (1 2 ) , we find , t h a t Kcc = 107* 605 a t a te m p e ra tu re o f
7500°. Thus i f th e p a r t i a l p re s s u re o f a tom ic ca rb o n i s 104dynes/cm 2
t h a t o f m o le c u la r carbon w i l l be 10*395dynes/cm 2 . Then th e r a t i o o f
ca rb o n m o lecu le s to carbon atoms w i l l be i o - 3 *605 : 1 o r .00025 : 1 .
A h ig h e r p a r t i a l p re s s u re o f a tom ic carbon w i l l in c re a s e th e r a t i o o f
m o le c u la r to a tom ic carbon .
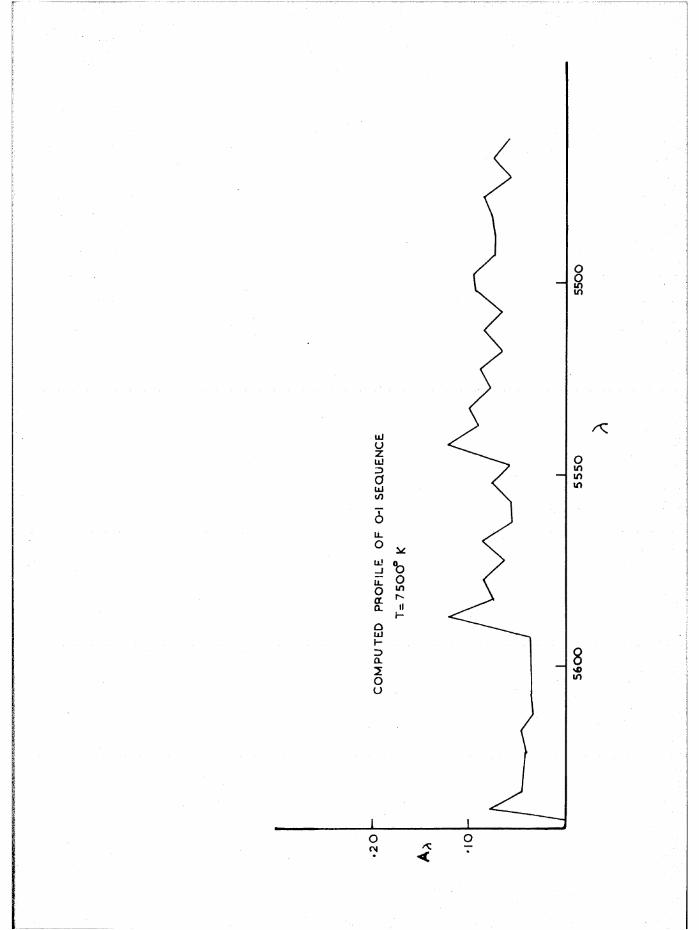
S e a r le (10) found in h i s a n a ly s is o f R Cor Bor t h a t th e
e q u iv a le n t w id th o f th e 1 -0 Swan sequence was 300mA. He a ls o found
t h a t pc = 10 and th a t th e abundance o f carbon in th e atm osphere was
ab o u t 71°. His v a lu e o f p g iv e s p = p e r 5' 605 o r a m o le c u la rC C 2
ca rb o n abundance o f abou t l 8 x l 0 -6 $> in th e atm osphere o f R Cor Bor.
T his abundance i s so low t h a t , w h i ls t th e e q u iv a le n t w id th o f th e
Swan 1 -0 sequence i s about 60 tim e s g r e a te r in L879~1^ th a n in R Cor
Bor, i t ap p e a rs t h a t i t i s q u i te p o s s ib le to have enough m o lecu la r
ca rb o n in th e w h ite dw arf a tm osphere to p roduce th e band , e s p e c i a l l y
a s th e p resum ab ly h ig h e r p re s s u re in th e w h ite dw arf as compared w ith
th e s u p e rg ia n t atm osphere w i l l p roduce more m o le c u la r carbon f o r a
g iv e n p e rc e n ta g e abundance o f ca rb o n . S e a r l e 1s c o n je c tu re t h a t th e
o p a c i ty in R Cor Bor i s p ro v id e d by th e p h o to io n iz a t io n o f n e u t r a l
carb o n may a l s o h o ld t r u e f o r th e A -670 w h ite d w arfs . C may a ls o
be im p o rta n t ( l3 )« I t i s hoped to check t h i s a t a l a t e r d a te by
o b ta in in g s p e c t r a l scans o f I lA 5 - l^ l .
(12) Pecker,, J .C . and M. P eucho t, Mem. Soc. R .S e i. L iege l 8 , 357> 1957*
(13) Branscomb, L.M ., and B .E .J . P a g e l, M.N. I l 8 , 258, 1958.
The helium , neon and oxygen abundances in th e A4670
w h ite dw arfs a re unknown. Oxygen w i l l be p re s e n t in b o th th e
atom ic form and a ls o as CO b u t th e l a t t e r m o lecu le i s s p e c tro -
38
s c o p ic a l ly u n o b se rv ab le . The same i s n o t t r u e o f n i t ro g e n ,
how ever, w hich would combine w ith ca rb o n to g iv e CN ban d s. These
a re n o t o b served and as K i s o f th e same o rd e r as Knn a t 7500°KL/IN CC^
i t seems t h a t th e n it ro g e n abundance m ust be low .
One c u rio u s f e a tu r e abou t th e A4670 w h ite dw arfs i s t h a t
t h e i r p ro p e r m otions and p a r a l la x e s may in d i c a te some form o f
common o r ig in . The p o s i t io n s and p ro p e r m otions o f th e s e s t a r s
a re g iv en below .
S ta r a (1950) & 0 TC
W219 03h]+l ?6 + l8 ° l8 ' I .25 155°-162° .068 ± 11L879-14 o4 35 .4 -08 53 1 .4 9 171° -
L97-12 07 52.8 -67 38 2.05 135° .170 ± 30L l4 5 - l4 l 11 4 2 .9 -64 34 2 .6 8 97° .203 ± 8
We have in c lu d e d L97-12 in t h i s t a b le f o r re a so n s t h a t
w i l l be a p p a re n t l a t e r . The p ro p e r m otion p o s i t io n an g le o f 155°
f o r W219 was d e r iv e d by Wolf ( l4 ) w hereas 162° was d e r iv e d by
G ic las (15 )*
The convergen t p o in t o f a moving group o f s t a r s i s
d e r iv e d from
c o t 0^ = cos S^tan D cosec (A - a ) - s in co t(A - Q^)
(14) W olf, M., V ero ff d e r S te rn w a rte zu H e id e lb e rg Band 7> No. 7> 1916.
(15) G ic la s , H .L ., Lowell Obs. B u l l e t i n 89 .
39
0^ i s th e computed, p ro p er m otion an g le f o r a s t a r w ith c o o rd in a te s
(a , 6^) which i s p a r t o f a moving group w ith co n v erg en t p o in t
(A, D). A l e a s t sq u a res p ro ced u re i s u s u a l ly a p p l ie d to 0 - 0
to f in d th e " t e s t conv erg en t" p o in t o f th e g roup . For th e A4670
w h ite dw arfs th e convergen t p o in t A = l4 h44m, D = - 59° ( t h i s i s
th e convergen t p o in t which th e w h ite dw arfs a re moving to w ard s)
g iv e s th e fo llo w in g v a lu e s o f 0^
S ta r 0.1
0 , obs 0i " 0obsjt sin A
d
W219 169° 155°-l62° l4°-7° .0364 ±.0061LÖ79-14 165° 171° - 6°hl45-i 4i 96° 97° - 1° .0278 ±.0011
I f th e s t a r s a re moving on p a r a l l e l p a th s o r have p a sse d
th ro u g h a common p o in t a t th e same tim e th e n i t i s ea sy to show t h a t
7T--~ " — should he c o n s ta n t . A i s th e an g le betw een (a , 6) and
(A ,D ). The above ta b le g iv e s th e com puted v a lu e s o f t h i s q u a n t i ty ,
w ith i t s p ro b ab le e r r o r , computed from th e p ro b a b le e r r o r o f th e
p a r a l l a x .
The agreem ent in ^ — and th e sm a ll v a lu e s o f 0 ^ - 0 ^ ^
su g g es t t h a t th e th r e e s t a r s may be d y n am ica lly r e l a t e d . The
absence o f r a d i a l v e lo c i ty d a ta , how ever, makes t h i s o n ly a s u g g e s tio n .
The s t a r L97-12 has 0 . - 0 , = - 4° and -TT~-S~ - = .0545^ 1 1 obs p
±.0096. I t i s th e on ly w h ite dw arf w ith p ro p e r m otion ex ceed in g
l " 2 5 /a which may be a s s o c ia te d w ith th e o th e r th r e e s t a r s . D esp ite
e f f o r t s a t Mt. S trom lo, th e spectrum o f t h i s s t a r has n o t been
observ ed .
4o
If the A4670 white dwarfs are moving on parallel paths
then their space motion, derived from a mean value of 0.0291 for —— — - , has the high value of 163 km/sec. Their U, V, W
rvelocities would be U = -II9 km/sec, V = -111km/sec and W = 0.Using the notation of Woolley and Eggen (l6) this gives v = 242 km/sec
and the stars will he in class E+ and their pericentre will be close
to the galactic centre. Only one star in Miss Homan’s (17) catalogue
of high velocity stars, HD 84937; an F2 suhdwarf, appears to have U, V, W velocities in good agreement with the white dwarf ones.
(16) Woolley, R.v.d.R., and O.J. Eggen, M.N. 118, 57; 1958.
(17) Roman, N.G., Ap. J. Suppl. No. l8, 1955*

hi
CHAPTER 5
Degenerate Stellar Configurations
In 1926 Fowler (l) pointed out that the use of Fermi-Dirac
statistics enabled the derivation of the formula p = K p5/3 for the1
pressure p exerted by the electrons of a degenerate electron gas, the
mass density being p gm/cm3. This work was followed up by Chandrasekhar
who, in: a series of papers, (2, 3, 4, 5), derived the well known mass-
radius relation for white dwarfs. In the first of these papers
Chandrasekhar shewed that whilst at low densities i.e. 2 < log p < 6,
the formula p = K 1p ' is correct, at higher densities when the
velocity of the electrons is an appreciable fraction of that of light
the formula for the pressure becomes p = K2p4/3. The actual exact
relation between the pressure and density of a degenerate electron
gas is a complicated one, being expressed parametrically by the equations
p = - -3- \ x (2xc> - 3) ( x2 + l)1/2 4- 3 sinh 1x "j-
p = 8 7t m3c3 [x H x3 3~h^
where m = electron mass, c = velocity of light, h = Planck's constant,
H = mass of the proton and pe is the mean molecular weight per electron.
(1) Fowler, R.H., M.N. 87, 114, 1926.(2, 3, h, 5) Chandrasekhar, S., M.N. 91, h^6, 1931; M.N. 95j 207, 1935;
M.N. 95p 226, 1935; Ap. J. 87, 623, 1937- Summarized in "An
Introduction to Stellar Structure", Univ. of Chicago Press, 1939?
Ch. XI.
x is given by
f For x ->0, p = Kip5/3 and X —> oo P = K2p4/3. Chandrasekhar
used the parametric expression for p in terms of p, together with
the Newtonian equations:
to obtain a series of white dwarf models. He assumed a certain
central density and integrated outwards through the star until the
pressure became equal to zero. Repeating this for different values
of the central density gave him his series of models. The masses
and radii of these models depend on the quantity pg , the mean
molecular weight per electron, which is equal to unity when the
nuclei in the degenerate region are protons and is approximately
equal to two for all other nuclei. Hydrogen in amounts greater
than about 51° can be excluded from the degenerate region of a white
dwarf (6) otherwise the energy generated by the p-p chain would
exceed that being radiated by the star. Thus we can certainly take
p.e to lie between 2.00 (He core) and 2.15 (Fe core). Chandrasekhar
found that as the central density in the series of model stars
increased the radius of the corresponding star decreased whilst the
mass increased. Extrapolating this result to an infinite central
(6) c.f. Schwarzschild, M., "Structure and Evolution of the Stars",
dPdr
GM(r)p
Princeton University Press, 195$; PP- 239-243.

masses. Stromgren (7) shewed that the non-degenerate regions surrounding the degenerate core of the star were small in comparison
with the radius of the core and contained only a negligible fraction
of the mass of the star. This work has been of great value in enabling
estimates to be made of the masses of white dwarfs for which absolute
magnitudes and temperatures are available. The formula L = 4 n R2 T^
can be used to give R and the mass radius relation gives the corresponding
mass. The principal objection which may be made to Chandrasekhar's
theory is that apart from supplying a certain amount of mass per
electron the nuclei are not considered. However, when the density
becomes sufficiently high the electrons will begin to interact with
the nuclei. At a density of 107 8gm/cm3 (8) electrons will start to be
absorbed by the nuclei. This will reduce the number of electrons and
will make the nuclei neutron rich. As the density is increased still
further more and more electrons will be absorbed until the number of
neutrons in the nuclei becomes so large that instability results and
neutrons are ejected from the nuclei. This process can be imagined
to continue with increasing density until the original nuclear
structure is dissolved away and we have mainly an assembly of neutrons
(7) Stromgren, B., Handbuch der Astrophysik VII, pp. 159-16Q.
(8) Adams, J.B., B.K. Harrison, L.T. Klauder, R. Mjolsness, M. Wakano,
J.A. Wheeler and R. Willey, La Structure et 1'Evolution de l'Univers.
Institut International de Physique Solvay, Brussels, 1958* P* 97*

with an admixture of other particles. We require some electrons to he
present, the number of electrons being such that the difference in energy
between the Fermi seas of the neutrons and electrons is equal to the
decay energy of the neutron. This is necessary to prevent decay of
the neutrons according to the equation
n -> p + e + v
with a half life of about 12 minutes. As well as the electrons and
neutrons there will also be protons present and, at sufficiently high
densities, hyperons (9)* The presence of hyperons reduces the number
of neutrons present as hyperons are formed by reactions such as:
n -> p + \± + v
n + n->n + n + 2jt° -> A° + A° - 2(177) Mev
supplying mesons and hyperons.
The problem of constructing model stars in which the pressure
is supplied by a degenerate neutron gas was considered by Landau (10).
He concluded that a cold neutron gas could not form a stable star with
a mass of more than six solar masses. An objection which may be
raised to this result is that Landau used Newtonian gravitational
theory whereas at the high densities of neutron stars the relevant
equations must be derived from the General Theory of Relativity.
Another objection which can be raised is that Landau considered the
(9) Cameron, A.G.W., Ap. J. 1^0, 884, 1959«
(lO) Landau, L.D., Phys. Zeit. Sowjetunion 1, 285, 1932.

5
neutron gas to "be relativistically degenerate whereas the non-
relativistic equation would seem to be more appropriate. Before we
go on to discuss later work on neutron stars we will shew that
General Relativity gives an upper limit to the mass of a sphere of
incompressible fluid. Such a fluid is incompatible even with Special
Relativity as it would transmit signals faster than light. This work
was first carried out by K. Schwarzschild (ll).
We take, as our sphere is static and spherically symmetric,
our line element to be the most general static and spherically symmetric
one, which is
ds2 = -e\r2 - r2d02 - r2sin20 dcp2 + evdt2
A = A(r) , v = v(r)
Einstein's field equation; is ~12- 8 * TV Rv - | R g vq 2 q
taking the cosmological constant equal to zero. Outside the sphere
of matter all components of the energy momentum tensor are equal to
zero. The field equations then reduce to
- e
- e
, { k +r + “ 2 :
' Nr v"L 2 A* v'
~ T ~
rvl r } +
: 0
v' - A' 2r
(ll) Schwarzschild, K., S.B. preuss. Akad. Wiss., 1916, 189.

46
th e dash d en o tin g d i f f e r e n t i a t i o n w ith r e s p e c t to r . These
e q u a tio n s a re s a t i s f i e d by
A 1 and 1 2m r1 - 2m/r
2m b e in g a c o n s ta n t o f in t e g r a t i o n .
The l i n e elem ent o u ts id e th e sph ere th e n i s
d s2 = - ^ 2^1 r " r2(^ 2 " r 2s i n 20 dcp + -j 1 - d t ;
In s id e th e sphere th e f i e l d e q u a tio n s become
8 n p
8 jt p
dpd r
= e -A v' 1r r 2
1
-A A’
( P + P ) v * 2
p b e in g c o n s ta n t . I n te g r a t in g th e second o f th e s e e q u a tio n s g iv e s u s
-A 1 - 8^pr; + £r
Taking C = 0 to avo id s i n g u l a r i t i e s a t th e o r ig in we may pu t
- A 1 - where 3
I n te g r a t in g th e t h i r d e q u a tio n g iv e s us
( p + p J = co n s t e 2
U sing th e f i r s t and second e q u a tio n s to e l im in a te p and p we have
e| v e -A j V + v.
and when s u b s t i tu t in g f o r e
i v £ , v]R2 + 7
-A
ry 1w ~
= c o n s t
we have
= co n s t

4t
w hich h as th e s o lu tio n
l>2 A - \ l 1 - F
A and B "being c o n s ta n ts o f in t e g r a t i o n ,
he w r i t t e n in th e form
The l i n e e lem ent can th e n
d rcg-7p2 - r 2d02 - r 2s in 20 dcp + -\A - B l l^ ~ 1 - r 7 R ‘
The e x p re s s io n f o r th e p re s su re th e n Becomes
8jrp
\— n 2 ■ r 2 r
1 J 3B s fl - r^ /R 2 - A
A - B \ / l - r 2/R 2
We can th e n make th e p re s su re e q u a l to zero a t some v a lu e o f r (= r Q ,
say ) and make th e i n t e r i o r and e x t e r io r s o lu t io n s ag re e a t t h i s p o in t
hy p u t t in g
A = I J " 1 “ 0 9 B = § and m = y r | p
For th e sd l u t i o n to be r e a l we r e q u ir e t h a t■z
r 2 < R2 i . e . re < o r m < 2 r e
w hich g iv e s u s an u pper l im i t to th e ra d iu s o f a sp h ere o f g iven
d e n s i ty and to th e mass o f a sph ere o f g iven r a d iu s .
In o rd e r to s im p lify th e e q u a tio n s g iv e n above we have tak en
o u r u n i t s to be such th a t b o th th e v e lo c i ty o f l i g h t and th e g r a v i t a t
io n a l c o n s ta n t a re eq u a l to u n i ty . Under th e s e c o n d i t io n s we s t i l l
r e t a i n th e c e n tim e tre as ou r u n i t o f le n g th b u t th e mass M in grams
and i t s v a lu e m u s in g c = G = 1 a re r e l a t e d by
48
M - 1 .349 x 1Ö28 m gms
Normal n u c le a r d e n s i ty i s abou t 3 x 1 0 14 gm/cm3. I f we
ta k e t h i s as th e d e n s ity o f o u r sp h ere th e n
2 . 3 x 1 .349 x 1028e 8 k x 3 x 1 0 14
whence r e < 2 .4 x 1 0 6 cm
o r m < 2 .4 x 1 0 s x 2 x 1 .3 4 9 x 1028 = 6.5 x 1 0 34gm o r 33 ©
D ecreasing th e d e n s i ty to 3 gm/cm3 w i l l in c re a s e th e u pper
l i m i t o f th e mass by a f a c to r o f 10 7 and so w i l l n o t le a d to c o n f l i c t
w ith a s tro n o m ic a l d a ta on th e m asses o f s t a r s .
The th e o ry o f n e u tro n s t a r s was g r e a t ly im proved by th e work
o f Oppenheimer and V olkoff (1 2 ) . They were i n t e r e s t e d in th e
c o n s tru c t io n o f s t a t i c m odels o f th e s e s t a r s . They assumed t h a t
t h e i r n e u tro n gas would be a p e r f e c t f l u i d in th e r e l a t i v i s t i c sense
i . e . i t cou ld not support t r a n s v e r s e s t r e s s e s and had no mass m otion .
The energy momentum te n s o r th e n i s
T1 = T2 = T3 = - p and T4 = p1 2 3 4
The f i e l d e q u a tio n s f o r th e i n t e r i o r o f th e s t a r a re th o se
quo ted f o r th e i n t e r i o r o f th e sph ere o f in c o m p re s s ib le f l u i d i . e .
<*P = (P + p) v 'd r 2
(12) Oppenheimer,, J . R . , and G. V o lk o ff, Phys. Rev. 35; 374, 1939*

1+9
which to g e th e r w ith th e e q u a tio n o f s t a t e , p = p ( p ) , a re
s u f f i c i e n t to d e term ine ou r s t e l l a r m odels. We suppose as b e fo re
th a t p > 0 f o r r < r e and p = 0 f o r r ^ r g . I n te g r a t in g (3 ) we
2dpP + p(p)
o r e v ( r ) = e v ( r e ) e x p ( . | P( 5 j
The e x t e r io r s o lu t io n f o r a n e u tro n s t a r w i l l be th e same
a s t h a t f o r a sp h ere o f in c o m p re ss ib le f l u i d . e v i s co n tin u o u s
a c ro s s th e boundary whence
ev(r ,) = (1 . §£ )r ,
In e q u a tio n (2) we pu t
u ( r ) = — r ( l - e ) o r e = 1 - —
when (2) becomes
= ^ * p ( p ) r 2 ...........................................................................................M
whence, s u b s t i tu t in g fo r e ^ and v ' i n (3) we have
dp (p + p ( p ) ) (^Ttpr2 + u ) ..........................................(5 )d r ~ r ( r - 2u)
e ^ i s a lso co n tin u o u s a c ro s s th e boundaiy whence
- A ( r t ) = 2 2u' = n _ 2mr t * r f
o r u , = m, i . e . u , i s th e mass w hich would be o b se rv ed by an
e x te r n a l o b se rv e r . R ew riting (4 ) and ( 5 ) in c . g . s . u n i t s we have
dM(r) d r
' ( r ) = v ( r e ) . r
l+7tp(P)r2 ( 6 )
(p(P) + c 2P) G (M(r) + 4jrc~2pr3) r(r - 2c"^CM(r))
50
cLP(r)dr . . . . (7)
Oppenheimer and Volkoff integrated these two equations for various
values of the central density. They used the accurate parametric
representation of the equation of state for Fermi particles, in
their case neutrons, and neglected effects of nuclear forces and
thermal contributions. The maximum value of the mass which they
obtained was 0.7 solar masses, about half that obtained by Chandra
sekhar. This result meant that it was only possible for a neutron
star to be formed in an event like a supernova explosion. The
idea of a non-rotating star more massive than Chandrasekhar’s limit
becoming a neutron star clearly could not be valid.
Wheeler and his associates (7) considered a gas which is
at zero temperature and is always catalysed to its state of minimum
energy. This gas is composed of Fe56 at normal white dwarf
densities and at higher densities it changes to a neutron rich
composition e.g. Y 1 '2. At higher densities it is composed mainly
of neutrons. Nuclear forces were neglected even at the highest
densities, in the calculation of the p - p relation of the gas.
Stellar models were calculated for this gas over a wide range of
stellar densities using eqns. (6) and (7) above. Figure 5*1 gives
a comparison between the work of Wheeler et al., Oppenheimer and
Volkoff and Chandrasekhar. The effect of Chandrasekhar's neglect
of relativistic corrections to his equation of hydrostatic equilibrium
is clearly seen at a density of 108gm/cm3. The need for this

w h e e l e rO P PENH EIM ER4 VO' KOEF
Cl IANDRASE KHAR
SOLAR MASSES
F I Cr. <9.1.
51
correction had been pointed out earlier by Kaplan and Klimishin.
The work of Wheeler et al. shewed that the density region between
101<D and 1013 gm/cm3, where nuclear forces are unimportant, did
not give a mass greater than Chandrasekhar's limit. At nuclear
densities Wheeler's work is virtually identical to that of Oppen
heimer and Volkoff.
The next major step forward was made by Cameron (9).This improvement was based on the work of Skyrme (13), "who developed
a simple three-body effective nuclear potential which represents
quite well many features of more complicated approaches. Cameron
writes Skyrme's relation for the energy per cm3, e, of a neutron
gas of density p gm/cm3 ase = T.98 x 109p5/3 + 9.79 x 10"6p8/3 - 1.381 x 10 5p2
The internal energy of a system of N neutrons in a volume
v/6.025xl023p ise N
U " 6.025x10²³p
The pressure of the system can be written as
whence
p = 5.32 x io9P5/3 + 1.632 x io-5p8/3 - 1.381 x 10⁵p2 . . (8)In the above equation the neutrons are assumed to be non-
relativistic. It is strictly valid only at normal nuclear density
(13) Skyrme, T.H.R., Nuclear Fhys. 9j> 615, 1959«

52
of 2.9xl014gm/cm3. However, Cameron argues that it can be used
at higher densities with a certain amount of validity as deviations
from it are acting in opposite directions. At a density of 1015
gm/ cm3 we have
n -> p + p + v
and at higher densities still we shall have further reactions
such as
n + n-> n + n + 2x° -» A° + A° - 2(l77)Mev
These reactions cause the loss of neutrons and consequently
p is reduced whence p is reduced. However at densities higher
than normal nuclear density we would also expect four-body and
higher order terms to make a contribution to the equation of state.
Moreover it seems probable that nuclear forces possess hard cores
at some density. These effects will make the pressure increase
more rapidly with density than equation (8) would indicate.
We may associate two masses with a neutron star. One,
which we call the observational mass, is the mass which we would
use if computing the gravitational effect the star would have on
a distant particle. The other mass, the proper mass, is the
total mass that all the particles comprising the star would have
if dispersed to infinity. We take this to be the total number
of neutrons in the star multiplied by the mass of a neutron,
ignoring the other particles present in the star. As we shall
see later uncertainties in the equation of state will exceed

53
errors caused, by neglecting particles other than neutrons.
The volume of the star is given by
iA(r dö)(r si.n0 dcp)(eiA dr)
1 - 2GM(r)
The proper mass, as defined above, is given by
dMp = pdV
dMpdr 4otr2p r - 2c~^CM(r) (9)
The gravitational binding energy is the difference
between the proper and observable masses and is given by
dr r - 2c“^GM(r) - 1 (10)
Cameron has calculated the radii and proper, observable
and gravitational binding masses for a series of twenty neutron
star models. The central density varies between 1013 and 1019
gm/cm3 in nineteen of these models whilst in the twentieth model
the central pressure was assumed to be that given by equation (8)
at p = 1019gm/cm3 and the neutron gas was assumed to become
incompressible at 3.7xl019gm/cm3. Cameron's results are given in
figure 5.2.
A disappointing feature about Cameron's results is that
the masses obtained at a density of twice nuclear density or less
are less than 0.25 solar masses. The p - p relation given
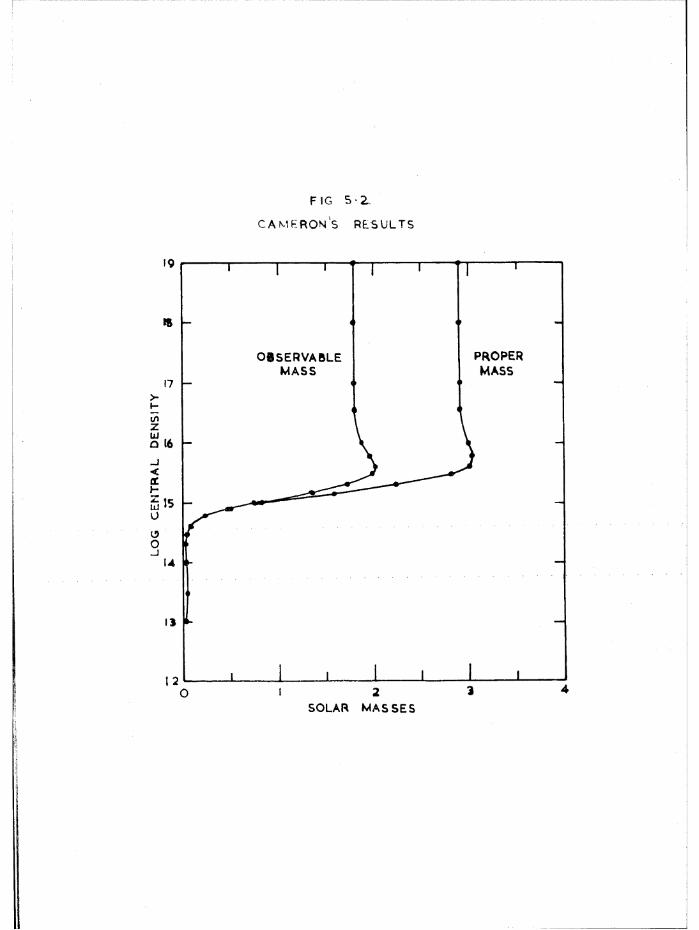
LOG
C
EN
TRA
L D
EN
SIT
Y
FI G 5 - 2
C A M E R O N S RES UL TS
PROPERMASS
OBSERVABLEMASS
SOLAR MASSES
54
above -will have much more validity in the region of normal nuclear
density than it has elsewhere. A further point about Cameron’s
work is that no allowance is made for errors in the coefficients of
p in the p - p relation.
According to Skyrme (private communication) at normal
nuclear density the coefficient of p8/3 in equation (8) is uncertain
by a factor of three either way i.e. it may vary between 4.896x10“5
and 0.544x10“5 and the coefficient of p2 is uncertain by ±15 *
Moreover, also according to Skyrme, the coefficient of p2 used by
Cameron is incorrect, the correct value being -1.53xl05. The
uncertainties in these coefficients means that the pressure at a
given density is only known to lie within quite wide limits e.g.
the pressure at p = 1015gm/cm3 lies somewhere between 4.1xl035
dynes/cm3 and zero. This should outweigh the influences of
particles other than neutrons. These huge variations evidently
make the computation of more models desirable, particularly as
Salpeter (private communication, to be published) has concluded
that equation (8) cannot be materially improved at the present time.
Accordingly the author integrated the differential equations
(7), (9) and (lO) for a series of central densities and a series of
equations of state. The constants used in the equations of state
are given in Table 5«1* The integrations were carried out on the
Ferranti Mercury computer of the University of London, the programme
being written in Autocode. The equations involve constants of very
55
orders of magnitude so that, instead of working in c.g.s. units,
densities were expressed in units of 1015gm/cm3, masses in units
of solar masses and radii in units of 10 km. This reduced the
number of arithmetic operations in the programme and was also more
suited to the particular integration technique used. Instead of
using the differential equation (7) the corresponding expression
dq = dP 1 _ dP . 1 ______dr dr* dP/dp dr 5/3 ap2/^ + 8/3 bpb/3 + 2cp
was used. This enabled the differential equations to be rapidly-
integrated using the INTSTEP procedure of Mercury Autocode.
(iNTSTEP uses the Runge-Kutta-Gill method of integrating simultaneous
differential equations.) The appropriate value of the step lengthdPto use was found by trial and error. The expression for — involves
r2 in the denominator and consequently, to avoid the singularity
at the origin, the integrations were started not at the centre of
the star but at a distance equal to the step length away from it.
The effect of this approximation on the final results is negligible.
The integrations were restricted to the central density range of
from 1013 to 1017 gm/cm3 where the equation of state is most
reliable. However the results should be treated with some reserve
above 1015 gm/cm3. At a density of 1012 gm/cm3 or less (Salpeter,
unpublished) the pressure due to the electrons will begin to
dominate that of the neutrons. The neutron star models computed
here should thus be enclosed in an inner envelope of non-degenerate
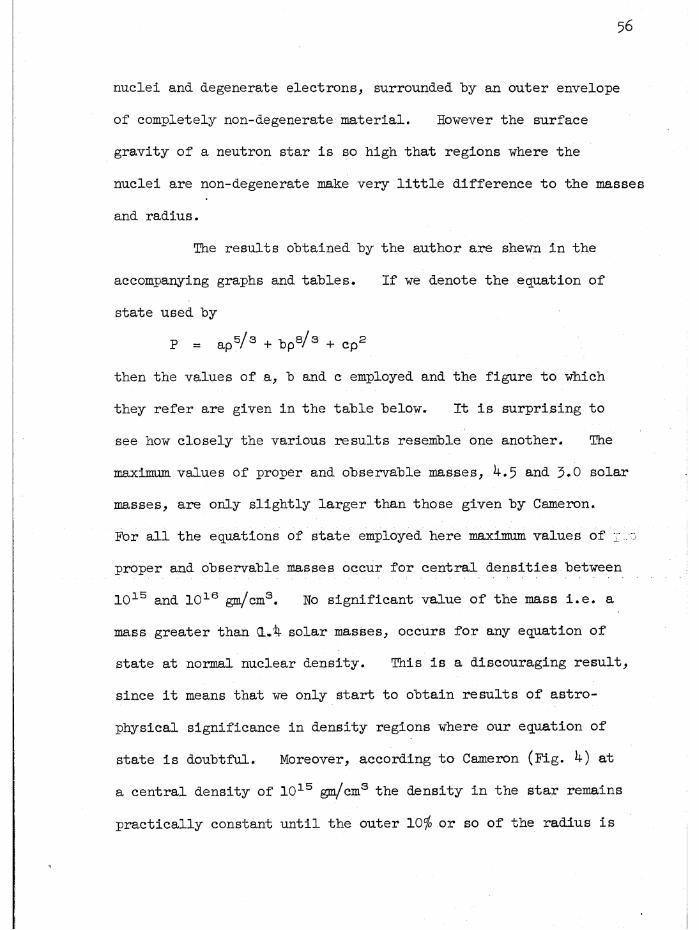
56
nuclei and degenerate electrons, surrounded by an outer envelope
of completely non-degenerate material. However the surface
gravity of a neutron star is so high that regions where the
nuclei are non-degenerate make very little difference to the masses
and radius.
The results obtained by the author are shewn in the
accompanying graphs and tables. If we denote the equation of
state used by
p = ap5/3 + bp8/3 + cp2
then the values of a, b and c employed and the figure to which
they refer are given in the table below. It is surprising to
see how closely the various results resemble one another. The
maximum values of proper and observable masses, 4.5 and 3*0 solar
masses, are only slightly larger than those given by Cameron.
For all the equations of state employed here maximum values of
proper and observable masses occur for central densities between
1015 and 1016 gm/cm3. No significant value of the mass i.e. a
mass greater than CU4 solar masses, occurs for any equation of
state at normal nuclear density. This is a discouraging result,
since it means that we only start to obtain results of astro-
physical significance in density regions where our equation of
state is doubtful. Moreover, according to Cameron (Fig. 4) at a central density of 1015 gm/cm3 the density in the star remains
practically constant until the outer 10$> or so of the radius is

57
reached. Thus errors in the p - p relation are effective over
a large pari: of the star. However, -the maximum value of even the
observable mass is always greater than Chandrasekhar's limit which
ever equation of state we use.
It thus appears possible for us to give at least a tentative
answer to the question of the fate of a non-rotating star of mass
greater than Chandrasekhar's limit. When such a star has finished
consuming its thermonuclear fuels it will start to contract, and,
being unable to stop in the normal white dwarf region, it will condense
into a neutron star, if its mass at the start of the contraction was
less than 4.5 solar masses, assuming the most favourable equation of
state. If its mass is greater than 4.5 solar masses then present
day nuclear physics does not permit us to say whether it will reach
equilibrium or not.
Another way in which neutron stars, or at least neutron
cores, may be formed is in supernova explosions. Some authors (9*
14) consider that it is the gravitational collapse of the interior
of the star which triggers off the explosion. If the temperature
remains fairly low e.g. less than about 1 0 during the implosion
(l5) the resulting stellar core is likely to be formed almost
exclusively of neutrons.
(14) Burbidge, E.M., G.R. Burbidge, W.A. Fowler and F. Hoyle, Rev.
Mod. Fhys. 29* 547* 1957*
(15) Salpeter, E.E., to be published.

N eutron S ta r Models
W ritin g th e e q u a tio n o f s t a t e as
p = a p 5/ 3 + t p 8/ 3 + cp 2
we have computed m odels f o r th e fo llo w in g v a lu e s o f
Model Set
A
B
C
D
E
F
G
H
I
J
K
a x 1 0 "9
5.395.39 5-39 5-395.395.395.395.395.395.395.39
h x 10+5
4.8961.6323.264
4.8963.264
.544
.544
1.088
.5441.0881.088
: x 1 0 " 5
1 .301
1.5311.301
1.761
1.761
1.5311.761
1.3011.3011.761
1.531

NEUTRON STAR MODELS
I n t h e f o l l o w in g s e t s o f m o d e ls I s t h e c e n t r a l d e n s i t y i n u n i t s
o f 1 0 +15gm/cm3 , m a sse s a r e i n s o l a r m a s s e s a n d R i s i n km.
M odel S e t A
p x lO “ 15 Hc Mmb
R
.0 1 .0 5 3 6 5 .0 5 3 5 1 .0 0 0 1 4 0 2 7 .8 5 8
.0 3 .0 7 5 7 4 .0 7 5 3 7 .0 0 0 3 6 4 2 1 .6 3 7
.1 .1 8 3 6 6 .1 8 1 0 2 .0 0 2 6 4 3 1 5 .7 9 5
.2 .5 0 5 0 9 .4 8 6 3 3 .0 1 8 7 5 8 1 ^ .9 5 9
.3 .9 7 3 6 7 .9 0 8 7 7 .0 6 4 9 0 1 1 5 .2 3 7I .5 0 6 1 1 .3 5 7 5 .1 4 8 6 2 1 5 .4 3 9
.6 2 .5 1 ^ 0 2 .1 1 2 6 .4 0 1 4 4 1 5 .3 5 5
1 .5 4 .3 6 6 8 3 .0 3 1 8 1 .3 3 5 0 1 3 .1 3 62 4 .5 1 9 4 3 .0 0 6 0 1 .5 1 3 4 1 2 .3 3 83 4 .5 1 7 8 2 .8 9 1 5 1 .6 2 6 3 H . 5 1 36 4 .3 8 2 8 2 .7 3 5 3 1 .6 4 7 5 1 0 .8 5 4
10 4 .3 2 8 7 2 .6 8 9 7 1 /6 3 9 0 1 0 .7 4 44o 4 .2 9 9 9 2 .6 6 8 1 1 .6 3 1 8 1 0 .6 8 8
100 4 .2 9 9 0 2 .6 6 7 5 1 .6 3 1 5 1 0 .6 8 8
M odel S e t B
P M,P
M mbR
.0 1 . o4 o43 .0 4 0 3 5 .0 0 0 0 8 2 8 .0 3 4
. 0 3 .0 4 0 7 8 . o4o68 .0 0 0 1 0 2 4 .3 1 61 .6 2 5 7 3 .5 7 7 3 2 . o 4 8 4 i 7 .4 6 01 .5 1 .4 2 2 0 1 .2 0 5 4 .2 1 6 5 7 8 .5 4 02 2 .0 5 0 8 1 . 6 l 4 l .4 3 6 6 7 8 .7 0 4
3 2 .6 9 8 4 1 /9 2 2 0 .7 7 6 3 6 8 .3 4 04 2 .9 1 5 1 1 .9 6 7 0 .9 4 8 1 3 7 .9 2 06 2 .9 8 6 8 1 .9 2 0 9 1 .0 6 5 9 7 .4 0 0
10 2 .9 3 9 4 1 .8 4 1 2 1 .0 9 8 2 7 .0 2 04o 2 .8 6 7 3 1 .7 7 6 9 1 .0 9 0 4 6 .8 1 6
100 2 .8 6 3 5 1 .7 7 4 2 1 .0 8 9 3 6 .8 1 0

Model Set F
p x 10“ 5 c MP M mb R
.27993 .25878 .02115 3.2606 1.1479 .89882 .24903 4.5688 1.5713 1.1181 .45318 4.645
10 1.7380 1.1743 .56366 4.54430 1.8224 1.1331 .68930 4.121
100 1.7997 1.1135 .68622 4 .06 l
Model Set G
pc MP M mb R
4 0 0 0 ,06 .70226 .59024 .11202 3.80878 1.31227 .96921 .34306 4.264
10 1.5730 1.0842 .48881 4.26330 1 . 7 3 4 5 1.0795 .65498 3.881
100 1.7145 I.O607 .65385 3.821
Model Set H
p x 1 0 -15 MP M M B R
1 .25659 .24559 .0110 5.2602 1.2939 I.0902 .2037 7.5153 2.0419 1.5474 J+945 7.5724 2.3955 1.6956 .6999 7.28o6 2.6050 I.7205 .8845 6.769
10 2.6092 I.6502 .9590 6.29530 2.5297 1.5691 .9606 5.998
100 2.5178 1.5601 .9577 5.977

Model S e t C
p xlO- 15 Kc MP M mb R
.1 .10292 .10197 .00095 15.374
.3 .4691 .4500 .01912 12.6371 2.6718 2.1431 .5287 12.8601 .5 3.4726 2.5442 .9284 12.0352 3.7986 2.6317 1.1669 II .3 2 9
4 3.9328 2.5129 1.4199 9-9356 3.8633 2.4239 1.4394 9.565
4o 3.7525 2.3279 1.4246 9.266100 3.7509 2.3268 1.4241 9.266
Model S e t D
p x 10-15 c MP M mb R
.01 .03608 .03601 .000068 27.515
.03 .03754 .03744 .000099 22.176
.1 .06382 .06336 .000455 12.696
.3 .61692 .58608 .03084 12.6001 3.4582 2.6440 .81424 13.557
1 .5 4.1558 2.9134 1.2424 12.6272 4.3624 2.9186 1.4438 11.9044 4.3086 2.7443 1.6043 10.7106 4.2789 2.6713 1.6076 10.444
10 4.2219 2.6223 1.5996 10.30130 4.1938 2.6010 1.5928 10.250
Model S e t E
p xlO-15 MP M mb R
.01 .03440 .03434 .00006 27.896
.03 .03335 .03328 .00007 24.616
.1 .02681 .02676 .00006 23.577
.3 .17107 .16737 .00370 18.5151 2.1984 1.8113 .3871 n .5 4 7
2 3.5627 2.4983 1.0644 10.7104 3.7983 2.4333 1.3650 9.4626 3.7412 2.3485 1.3927 9.070
10 3.6754 2.2859 1.3895 8.85030 3.6346 2.2534 1.3812 8.770
100 3.6308 2.2508 1/3800 8.760

Model S et I
p x 10“ 15 M M M R
4 .7897 .6735 .1162 4.7376 1.4975 l . l l 8 0 .3795 5.130
10 1.9015 1.2635 .6380 4.86330 1.9078 I .I8 6 9 .7209 4.384
100 1.8834 1.1669 .7165 4.324
Model S et J
p x 1 0 "15 M M M R
2 .5078 .4634 .0444 5.1594 1.9754 1.4492 .5206 6.4746 2.3538 1.5811 .7727 6.169
10 2.4310 1.5445 .8865 5.74830 2.3674 1.4681 .8993 5.448
100 2.3567 1.4594 .8973 5.427
Model Set K
p x 10 "15 c M M M R
1 .03782 .03735 .00047 26.9962 .9072 .7926 .1147 6.4494 2.1954 1.5810 .6144 6.8746 2.4760 1.6490 .8270 6.440
10 2.5158 1.5950 .9208 5.99630 2.4484 1.5182 .9302 5.709
100 2.4368 1.5092 .9276 5.688
PROPERMASS
OBSERVABLEMASS
S O LA R MASSES