white-etching matter in bearing steel part 2 ... · white-etching matter in bearing steel part 2:...
TRANSCRIPT
White-etching matter in bearing steelPart 2: Distinguishing cause and e↵ect in bearing steel
failure
W. Solano-Alvareza, H. K. D. H. Bhadeshiaa
aMaterials Science and Metallurgy, University of Cambridge, U.K
Abstract
The premature failure of large bearings of the type used in wind turbines,possibly through a mechanism called “white-structure flaking”, has triggeredmany studies of microstructural damage associated with “white-etching ar-eas” created during rolling contact fatigue, although whether they are symp-toms or causes of failure is less clear. Therefore, some special experimentshave been conducted to prove that white-etching areas are the consequence,and not the cause, of damage. By artificially introducing a fine dispersionof microcracks in the steel through heat treatment and then subjecting thesample to rolling contact fatigue, manifestations of hard white-etching mat-ter have been created to a much greater extent than samples similarly testedwithout initial cracks. A wide variety of characterisation tools has been usedto corroborate that the white areas thus created have the same properties asreported observations on real bearings. Evidence suggests that the formationmechanism of the white-etching regions involves the rubbing and beating ofthe free surfaces of cracks, debonded inclusions, and voids under repeatedrolling contact. It follows that the focus in avoiding early failure should bein enhancing the toughness of the bearing steel in order to avoid the initialmicroscopic feature event.
Keywords: bearing steel, white-etching areas, cracked martensite, rollingcontact fatigue, butterflies
Preprint submitted to Elsevier June 5, 2014
1. Introduction
White structure flaking is a bearing failure mechanism associated with mi-crostructural damage known commonly as “white-etching matter” (WEM),that leads eventually to flakes of material detaching from the raceway sur-face. Such damage has been identified as one of the possible causes of thepremature failure of large bearings, such as those in wind-turbine gearboxes[1]. White-etching matter is a generic term describing microstructural dam-age that exhibits lighter contrast relative to the surrounding material, whenan etched sample is observed using optical microscopy. This diminished con-trast arises because the wavelength of light (390-770 nm) is large comparedwith the size of crystallites in the a↵ected regions (5-500 nm) [2]. White-etching regions include the so-called butterfly wings, some cracks, white-etching spheres, bands, all caused by rolling contact fatigue (RCF) in thesubsurface of bearing raceways or white-etching layers caused again by rollingcontact fatigue of railway tracks or by hard turning, as reviewed in [3]. Inthe case of bearings, rolling contact fatigue refers to the cyclic loading of theraceways by the repeated passage of rolling elements, that induce Hertziancontact stresses responsible for phenomena such as the decomposition of re-tained austenite, smoothing of surfaces, steady-state plastic strain, texturedevelopment, residual stress development, work hardening, and surface orsubsurface crack initiation and propagation.
WEM can be classified into two categories, hard and soft [3]. Soft white-etching matter such as that associated with bands, is depleted in carbon[4], can be transgranular [5], and is composed of fine, equiaxed grains thathave recrystallised [6]. Such regions can also contain amorphous patches andmicrovoids, whilst the material adjacent to the band has a high dislocationdensity [7]. It is emphasised that these soft white-etching bands are notassociated with cracks or surface discontinuities, unlike the harder versions.The latter occur as butterflies, cracks, or spheres, and are some 30-50%harder than the una↵ected matrix [8, 9]. They are generally supersaturatedin carbon as a result of carbide dissolution [10], have a structure of equiaxedbut very fine grains [7, 11, 12], and are free of large carbides [11, 12]. In thecase of butterflies, the hard white-etching matter wings originate at voids,non-metallic inclusions, carbides, or microcracks already at 5-10% of the L10
life, which represents the number of loading cycles when 10% of the bearingsin a population fail before their estimated life time[1, 13].
2
Several mechanisms have been proposed to explain the formation of WEM.The hard layers are associated with severe, localised plastic deformation withthe possibility of some dynamic recovery [14–16]. The white-etching layerson railway tracks where rolling contact and sliding dominate the damage pro-cess, some authors consider carbide dissolution under the influence of defor-mation to be the primary mechanism [17] whereas others conclude that thestructural change is due to rapid reaustenitisation followed by martensitictransformation [18]. An alternative interpretation relies on the formationof adiabatic shear leading to localised severe plasticity [19], although thereare di�culties in reconciling the onset of adiabatic shear with the observedband dimensions and necessary strain rates [3]. There have also been reportsthat the process of WEM formation involves a combination of corrosion fa-tigue, hydrogen ingress and the tribochemical dissolution of inclusions [20].The fundamental question that needs to be addressed is whether the white-etching regions are a cause or symptom of the onset of damage; this is theissue addressed in the present work.
2. Experimental Methods
2.1. Material
The material used for this study is an Ovako hot-rolled and spheroidised52100 steel rod with the composition described in Table 1.
Table 1: Chemical composition, wt%, of the 52100 steel used.
C Cr Mn Mo Si Ni Al P S Cu Co Ca Ti
0.98 1.38 0.28 0.06 0.28 0.18 0.04 0.010 0.017 0.21 0.015 0.001 <0.001
2.2. Microscopic cracking
Long cylindrical samples 10mm in diameter and 120mm long were man-ufactured from the sample material using a spark erosion machine and alathe, followed by heat-treatment in a standard Carbolite RWF1200 box fur-nace. Three di↵erent heat treatments were applied to obtain the standardand two di↵erent cracked microstructures. The crack-free control sample
3
was austenitised at 1113K (840 �C) for 10min, quenched in GP460 oil atroom temperature, and tempered at 433K (160 �C) for 2 h, representing thestandard heat treatment for 52100 steel. The sample containing crackedmartensite-plates (MPC) was austenitised at 1313K (1040 �C) for 90min,cooled in air for 50 s, quenched in GP460 oil at room temperature, and fi-nally tempered at 433K (160 �C) for 2 h. After the heat treatment, these twosamples were cylindrically ground to the final diameter of 9.53mm to get ridof any decarburised layer and to achieve a reasonable surface roughness forrolling-contact fatigue testing.
The surface cracked sample (SC) was asutenitised at 1313K (1040 �C) for30min, cooled in air for 50 s, followed by quenching in GP460 oil at roomtemperature. This was then indented twelve times along its circumferenceusing a Vickers indenter and a 130 kg load to induce indentation cracks be-fore cylindrically grinding to the final diameter of 9.53mm. The grindingeliminated the upheavals caused by indentation but not the surface-breakingindent cracks; after grinding, it was finally tempered at 433K (160 �C) for 2 h.Temperatures were monitored throughout the heat treatment of all samplesby spot welding K-type thermocouples to the samples. The specific detailsof the crack-inducing heat-treatments are described in more detail in [21].
2.3. Rolling contact fatigue
Testing was carried out on a Delta Research Corporation BR-4 Ball-Rod Rolling Contact Fatigue machine [22]. The load is applied by three12.7mm in diameter balls, placed inside a bronze retainer, so that the ballspush against the rotating test specimen of 9.53mm in diameter through twotapered bearing cups held at a certain distance of each other by adjustingthe length of three springs, as seen on Fig. 1. Testing was performed atroom temperature without transient conditions or hydrogen charging of thespecimens that would accelerate, but might also alter the microstructuraldegradation process.
Before every test, three new 52100 balls with a surface roughness of0.013µm, the bronze retainer, and the rod specimen were ultrasonicallycleaned for 5min first in a mixture of 50% isopropanol-50% water, then inacetone, and finally in isopropanol. The tapered loading cups were changedevery four tests and turbine oil BP2380 was used as a lubricant at room
4
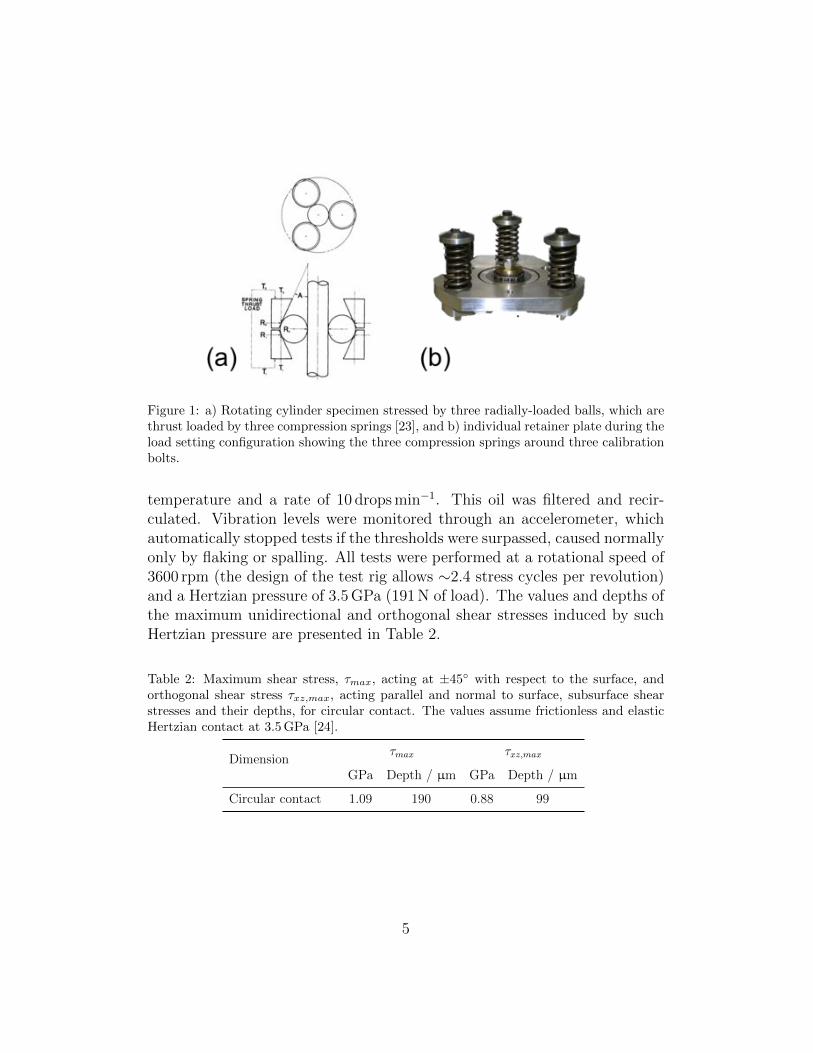
Figure 1: a) Rotating cylinder specimen stressed by three radially-loaded balls, which arethrust loaded by three compression springs [23], and b) individual retainer plate during theload setting configuration showing the three compression springs around three calibrationbolts.
temperature and a rate of 10 dropsmin�1. This oil was filtered and recir-culated. Vibration levels were monitored through an accelerometer, whichautomatically stopped tests if the thresholds were surpassed, caused normallyonly by flaking or spalling. All tests were performed at a rotational speed of3600 rpm (the design of the test rig allows ⇠2.4 stress cycles per revolution)and a Hertzian pressure of 3.5GPa (191N of load). The values and depths ofthe maximum unidirectional and orthogonal shear stresses induced by suchHertzian pressure are presented in Table 2.
Table 2: Maximum shear stress, ⌧max
, acting at ±45� with respect to the surface, andorthogonal shear stress ⌧
xz,max
, acting parallel and normal to surface, subsurface shearstresses and their depths, for circular contact. The values assume frictionless and elasticHertzian contact at 3.5GPa [24].
Dimension⌧max
⌧xz,max
GPa Depth / µm GPa Depth / µm
Circular contact 1.09 190 0.88 99
5
2.4. Characterisation
Before RCF testing, the average surface roughness, Ra
, of the cylindricallyground specimens was measured using a Veeco Dektak 6M Stylus Profiler,which has a tip radius of 12.5µm. Given the shape of the specimens, theroughness was measured along the length; the surface over which the ballsrotate is likely to be significantly smoother given the nature of the finalgrinding process.
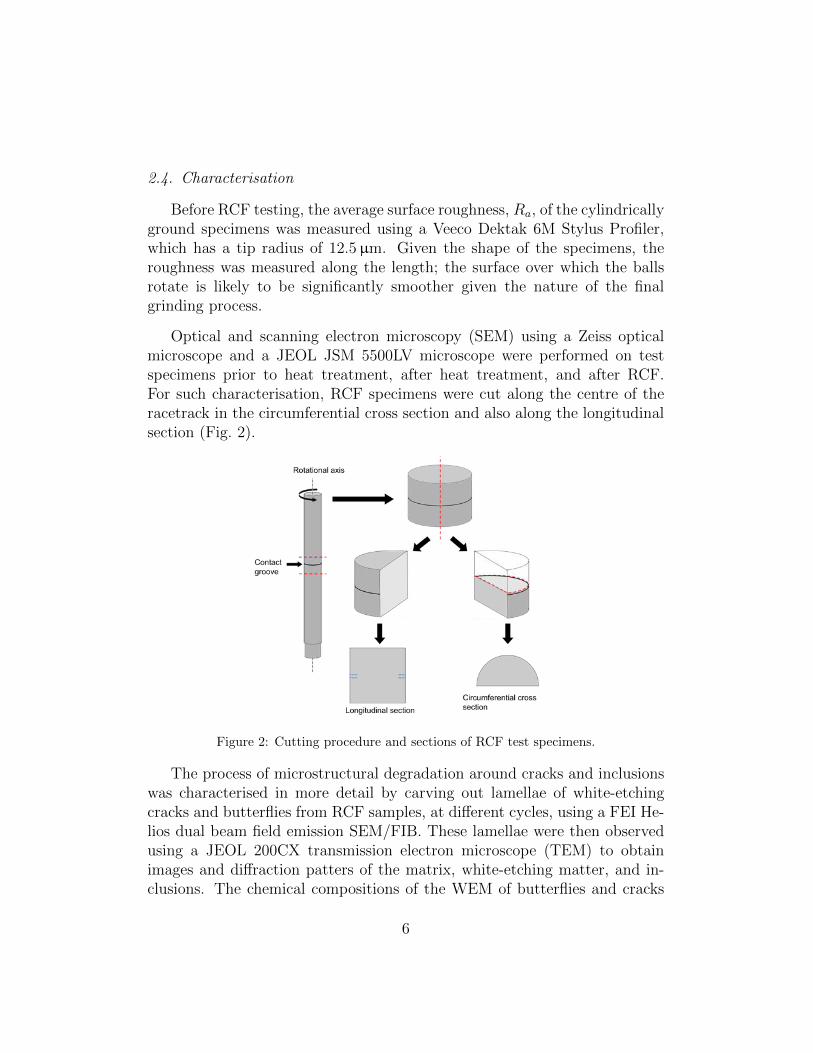
Optical and scanning electron microscopy (SEM) using a Zeiss opticalmicroscope and a JEOL JSM 5500LV microscope were performed on testspecimens prior to heat treatment, after heat treatment, and after RCF.For such characterisation, RCF specimens were cut along the centre of theracetrack in the circumferential cross section and also along the longitudinalsection (Fig. 2).
Figure 2: Cutting procedure and sections of RCF test specimens.
The process of microstructural degradation around cracks and inclusionswas characterised in more detail by carving out lamellae of white-etchingcracks and butterflies from RCF samples, at di↵erent cycles, using a FEI He-lios dual beam field emission SEM/FIB. These lamellae were then observedusing a JEOL 200CX transmission electron microscope (TEM) to obtainimages and di↵raction patters of the matrix, white-etching matter, and in-clusions. The chemical compositions of the WEM of butterflies and cracks
6
(WECs), butterfly inclusions, and fatigue crack initiating inclusions werestudied using EDS with an Oxford Instruments detector in the JEOL JSM5500LV SEM and a EDAX r-TEM ultra-thin window (UTW) X-ray detectorin the FEI Tecnai F20-G2 FEG-STEM in case of the FIB lamellae.
Although the main objective of this work was to establish whether WEMresults from the collision of crack faces during RCF, butterflies were alsostudied as their WEM wings have been well characterised and would providea bridge between the WEM created in this study and observations in thepublished literature.
2.4.1. Macro- and Nano-hardness
Since the crack-free (standard heat treatment) and pre-cracked sampleswere austenitised at di↵erent temperatures and times, their RCF responseswere compared by taking into account di↵erences in macrohardness and re-tained austenite. Macrohardness of the three di↵erently heat-treated sam-ples was evaluated using a Vickers indenter and a 30 kg load. Instead, anMTS Nanoindenter XP with a pyramidal Berkovich tip was used to performnanoindentations on the white-etching matter around cracks and inclusionsformed after RCF in order to determine its hardness compared with the ma-trix. Such measurements were performed at a constant depth of 1µm. Ineach case, the mean and standard error reported correspond to ten indenta-tions.
2.4.2. X-Ray Di↵raction
The retained austenite content was determined using a Philips PW1830vertical di↵ractometer with a CuK
↵
radiation. Scans were performed from30 to 125 �, with a step size of 0.05 � and a dwell time of 26 s. A divergenceslit of 0.5 �, an anti-scatter slit of 0.5 �, and a receiving slit of 0.2mm wereused to restrict the beam size and the counts obtained. A rotating stagewas necessary for sample MPC in order to obtain su�cient counts due thelarger size of its grains. Once the patterns were obtained, High Score plusand the Rietveld refinement method were used to fit body-centred tetragonalmartensite to two isolated martensite peaks (020 and 121) for each spectrum.This pair of values of tetragonality were then used as minimum and maximumlimits in the fitting of lattice parameters for martensite using either the whole
7
spectrum or a cropped version, which eliminated martensite and austeniteoverlapping peaks (e.g. 110
↵
0 and 111�
). Finally, the three control samplespectra were analysed accounting for cementite, using the whole spectra andthe respective martensite tetragonality values.
2.4.3. Electron Backscattered Di↵raction
EBSD was performed on colloidal silica polished samples using a CamscanMX2600 FEG-SEM in order to study the propensity of cracks nucleated atinclusions during RCF to propagate along prior austenite grain boundaries inorder to evidence the lack of toughness of 52100 steel that is the alleged causeof WEM (through the processes of crack formation and rubbing). Toughnessis here used to indicate the ability of the alloy to resist crack formation atimpurities or defects during cyclic deformation, leading to propagation alongprior austenite grain boundaries and ultimately, macroscopic failure.
It is important to note that the cracks studied through EBSD were al-most certainly not caused by the cracking heat treatments, but by RCF aswill be explained later. Post-acquisition analysis of the patterns includedremoval of wrongly indexed points (wild spikes) and extrapolation of solu-tion to non-indexed points first using non-iterative eight neighbouring points,then iterations with seven, and finally six neighbouring points.
3. Results
The as-received microstructure of the steel, consisting of ferrite and spher-oidised cementite particles, is illustrated in Fig. 3. Once machined, the cylin-drical test specimens were heat treated according to the standard, surfacecrack, and martensite plate crack procedures, resulting in the microstruc-tures illustrated in Fig. 4. The Vickers hardness values of all these samplesare presented in Table 3.
X-ray di↵raction (XRD) measurements of the three di↵erent heat treat-ments applied were performed to take into account the di↵erence of retainedaustenite volumes when analysing the WEM generated during RCF. The vol-ume fractions of retained austenite were obtained via Rietveld refinement onsamples quenched (Q) from the three di↵erent austenitisation temperatures
8
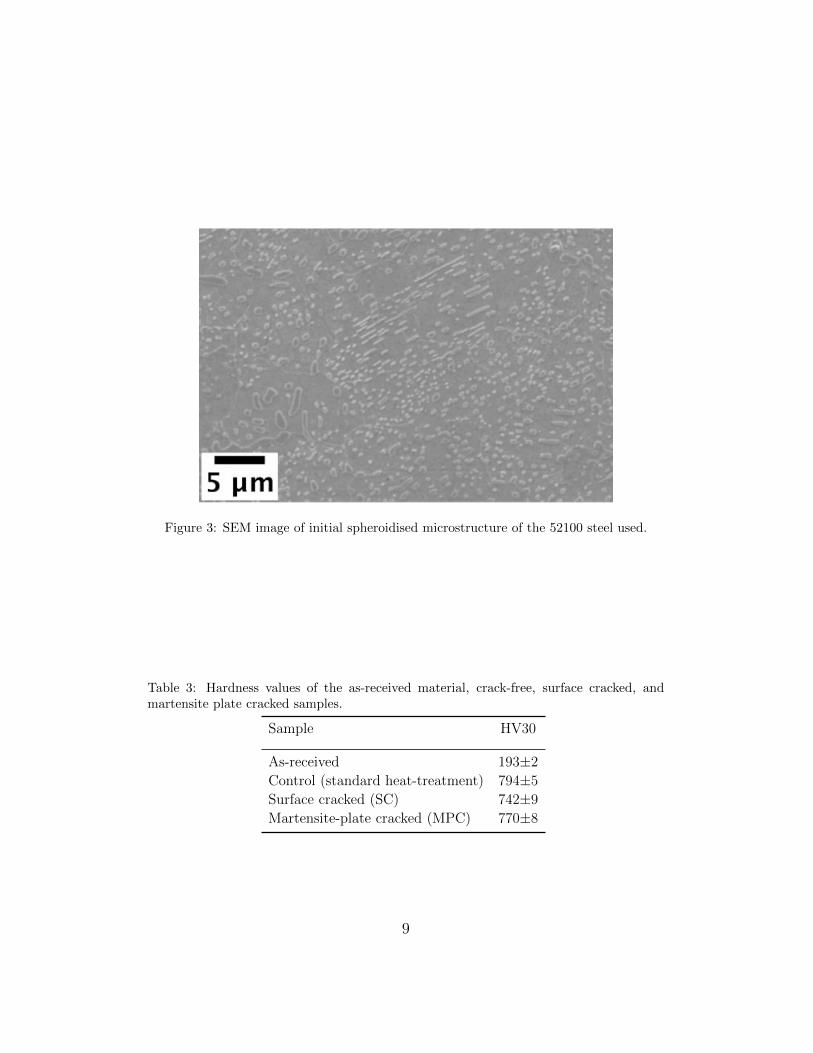
Figure 3: SEM image of initial spheroidised microstructure of the 52100 steel used.
Table 3: Hardness values of the as-received material, crack-free, surface cracked, andmartensite plate cracked samples.
Sample HV30
As-received 193±2Control (standard heat-treatment) 794±5Surface cracked (SC) 742±9Martensite-plate cracked (MPC) 770±8
9
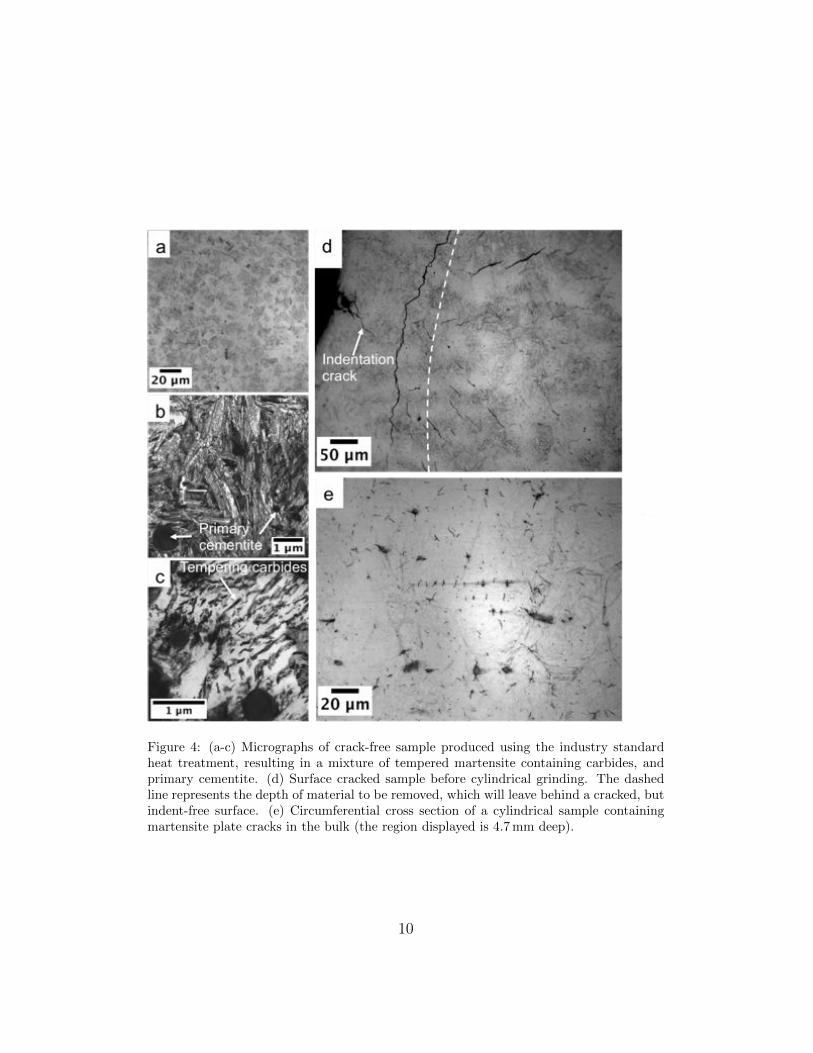
Figure 4: (a-c) Micrographs of crack-free sample produced using the industry standardheat treatment, resulting in a mixture of tempered martensite containing carbides, andprimary cementite. (d) Surface cracked sample before cylindrical grinding. The dashedline represents the depth of material to be removed, which will leave behind a cracked, butindent-free surface. (e) Circumferential cross section of a cylindrical sample containingmartensite plate cracks in the bulk (the region displayed is 4.7mm deep).
10
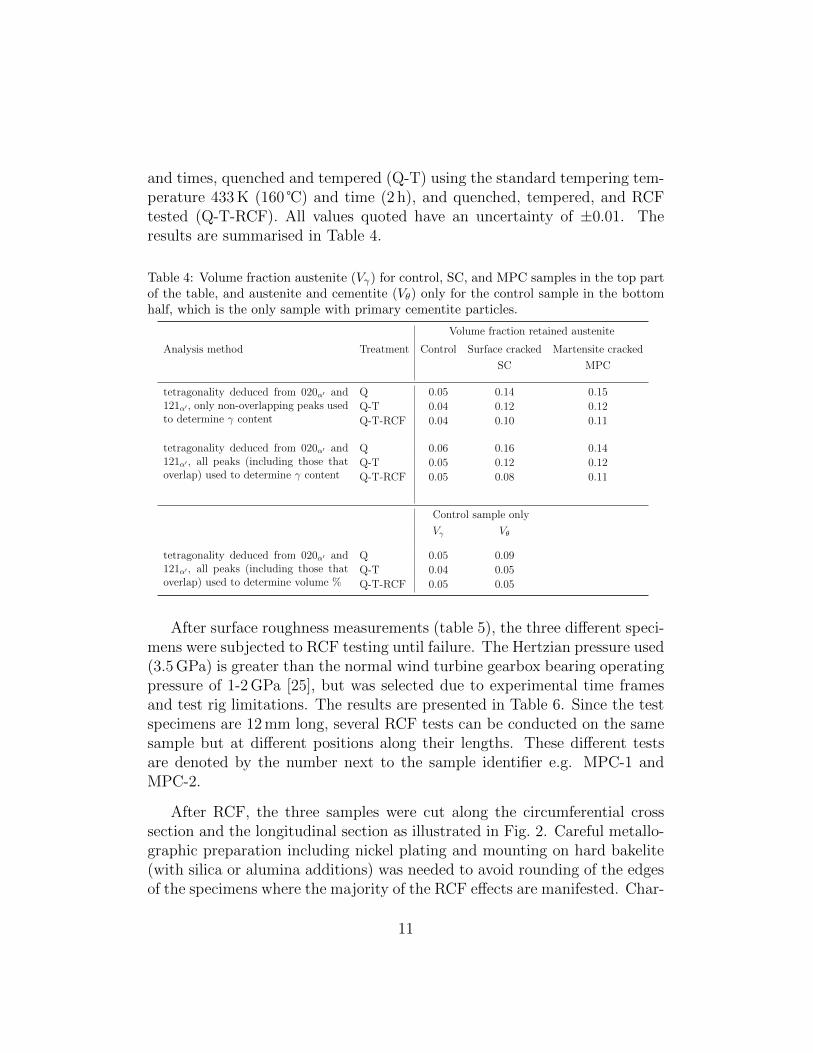
and times, quenched and tempered (Q-T) using the standard tempering tem-perature 433K (160�) and time (2 h), and quenched, tempered, and RCFtested (Q-T-RCF). All values quoted have an uncertainty of ±0.01. Theresults are summarised in Table 4.
Table 4: Volume fraction austenite (V�
) for control, SC, and MPC samples in the top partof the table, and austenite and cementite (V
✓
) only for the control sample in the bottomhalf, which is the only sample with primary cementite particles.
Volume fraction retained austenite
Analysis method Treatment Control Surface cracked Martensite cracked
SC MPC
tetragonality deduced from 020↵
0 and121
↵
0 , only non-overlapping peaks usedto determine � content
Q 0.05 0.14 0.15Q-T 0.04 0.12 0.12Q-T-RCF 0.04 0.10 0.11
tetragonality deduced from 020↵
0 and121
↵
0 , all peaks (including those thatoverlap) used to determine � content
Q 0.06 0.16 0.14Q-T 0.05 0.12 0.12Q-T-RCF 0.05 0.08 0.11
Control sample only
V�
V✓
tetragonality deduced from 020↵
0 and121
↵
0 , all peaks (including those thatoverlap) used to determine volume %
Q 0.05 0.09Q-T 0.04 0.05Q-T-RCF 0.05 0.05
After surface roughness measurements (table 5), the three di↵erent speci-mens were subjected to RCF testing until failure. The Hertzian pressure used(3.5GPa) is greater than the normal wind turbine gearbox bearing operatingpressure of 1-2GPa [25], but was selected due to experimental time framesand test rig limitations. The results are presented in Table 6. Since the testspecimens are 12mm long, several RCF tests can be conducted on the samesample but at di↵erent positions along their lengths. These di↵erent testsare denoted by the number next to the sample identifier e.g. MPC-1 andMPC-2.
After RCF, the three samples were cut along the circumferential crosssection and the longitudinal section as illustrated in Fig. 2. Careful metallo-graphic preparation including nickel plating and mounting on hard bakelite(with silica or alumina additions) was needed to avoid rounding of the edgesof the specimens where the majority of the RCF e↵ects are manifested. Char-
11

Table 5: Average (Ra
) and root mean squared (Rq
) surface roughness values for each RCFspecimen.
Sample Ra
/ µm Rq
/ µm
Control 0.08±0.02 0.13±0.04SC 0.06±0.01 0.08±0.01MPC 0.06±0.01 0.08±0.01
Table 6: RCF cycles for the crack-free (control) and pre-cracked samples (SC and MPC)all running at room temperature, 3600 rpm, and 3.5GPa of Hertzian pressure.
Test Cycles Time / h Reason of stoppage
Control-1 2.9⇥ 108 558.1 Excessive vibrationMPC-1 8.6⇥ 106 16.8 Lubrication system failureMPC-2 2.8⇥ 108 551.2 Load bolt and spring got looseSC-1 8.6⇥ 108 1672.5 Excessive vibration
acterisation of these regions was performed mainly using optical microscopysince white-etching matter is defined as such due to its relative colour whenetched in nital. Under SEM, WEM does not necessarily appear brighter thanthe matrix, but can be di↵erentiated due to topographical contrast. Fig. 5shows an ensemble of optical and SEM micrographs of the most notoriousWEM manifestations around cracks, although butterflies are also included,in each of the three samples tested under RCF.
The WEM generated around microcracks and inclusions during RCF wasthen characterised mechanically, optically, chemically, and crystallographi-cally using nanoindentation, FIB/TEM, EDS, and EBSD in order to identifythe type of WEM generated (hard or soft) and provide insights on its forma-tion mechanisms. In the case of nanoindentation, only the sample containingmartensite-plate cracks was analysed given the larger size of WEMs presentthat allowed indents to be fully contained in the WEM regions of either but-terflies or cracks. These results are presented in Table 7. An image of someof the indented regions are shown in Fig. 6.
Following nanoindentation, WEM around cracks and inclusions was ex-tracted from the bulk using focused ion beam machining according to the
12
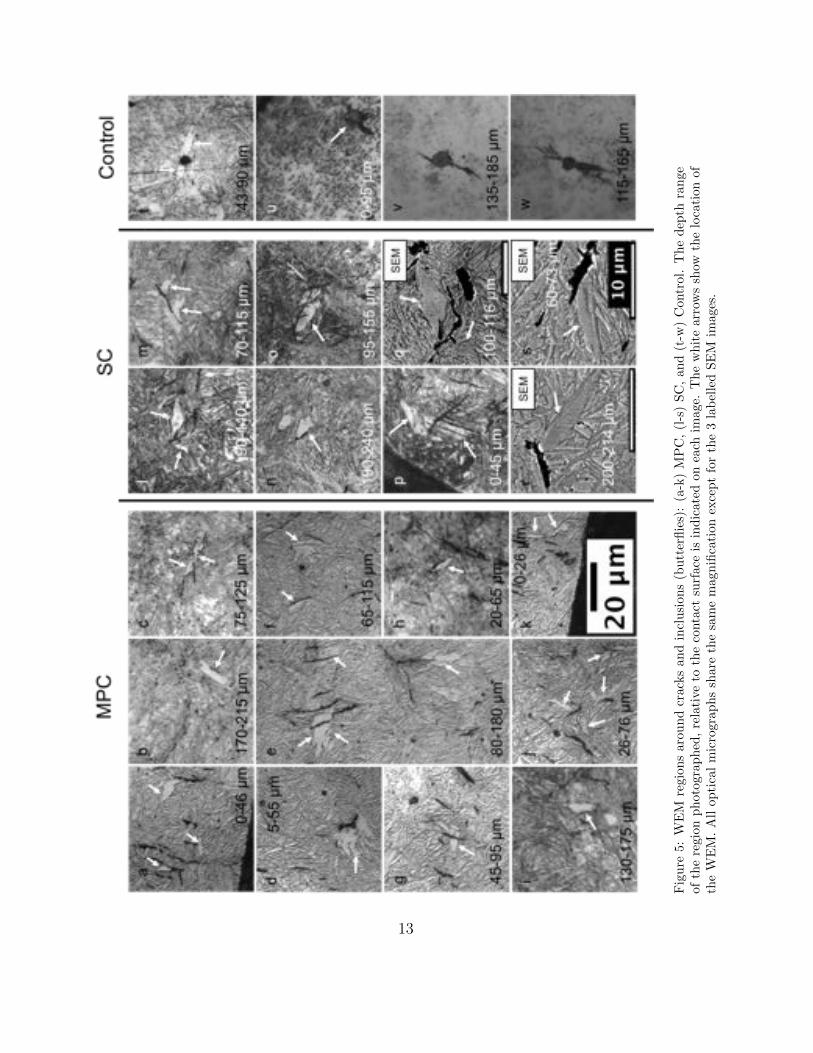
Figure
5:W
EM
region
sarou
ndcracksan
dinclusions(butterflies):(a-k)MPC,(l-s)SC,and(t-w
)Control.
Thedepth
range
oftheregion
photographed,relative
tothecontact
surface
isindicatedoneach
image.
Thewhitearrow
sshow
thelocationof
theW
EM.Allop
ticalmicrograp
hssharethesamemagnificationexceptforthe3labelledSEM
images.
13
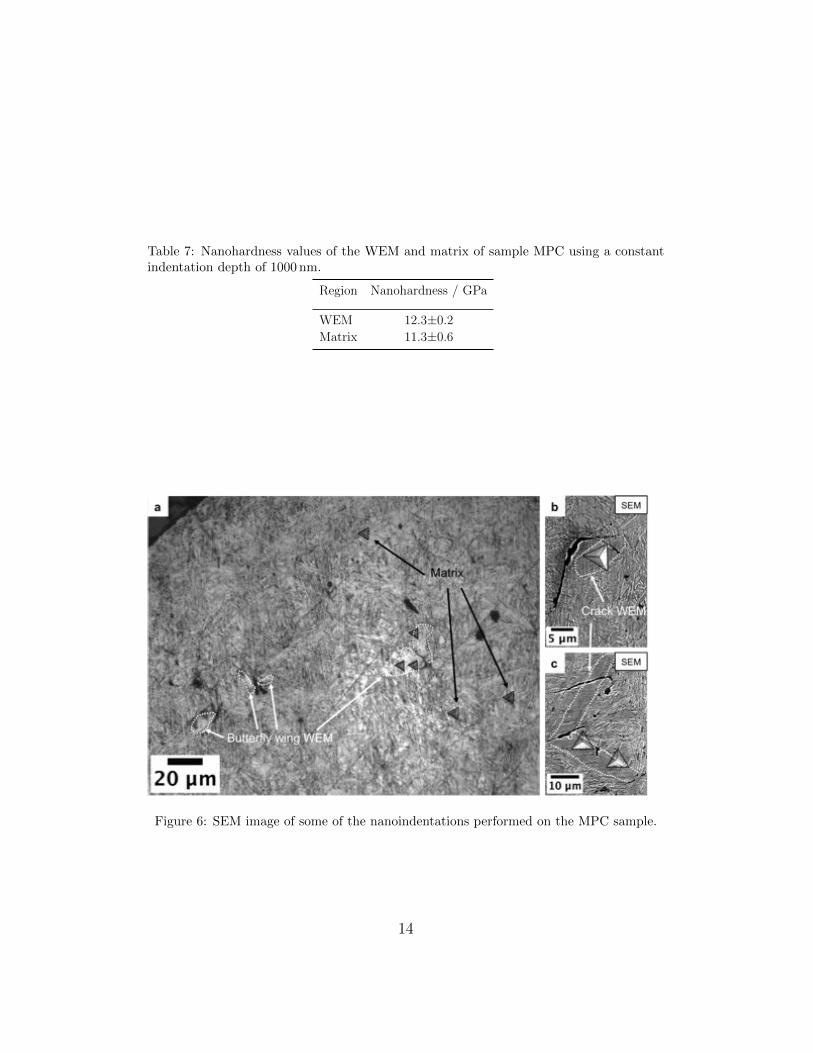
Table 7: Nanohardness values of the WEM and matrix of sample MPC using a constantindentation depth of 1000 nm.
Region Nanohardness / GPa
WEM 12.3±0.2Matrix 11.3±0.6
Figure 6: SEM image of some of the nanoindentations performed on the MPC sample.
14
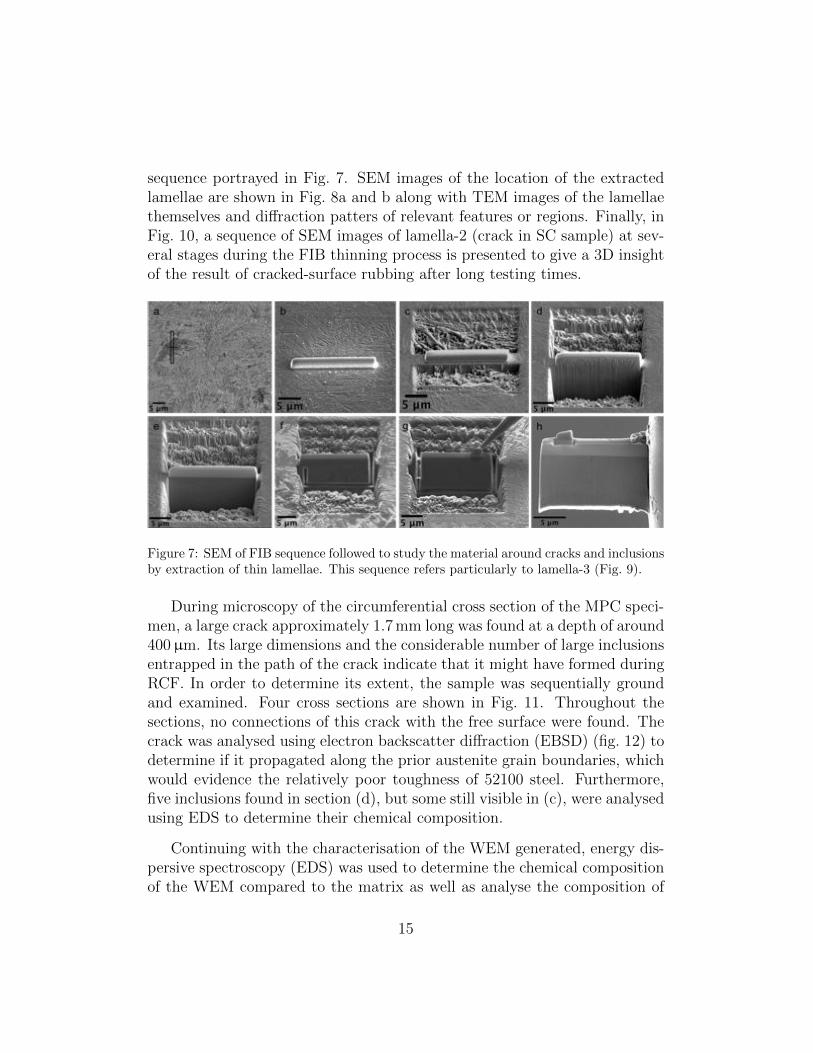
sequence portrayed in Fig. 7. SEM images of the location of the extractedlamellae are shown in Fig. 8a and b along with TEM images of the lamellaethemselves and di↵raction patters of relevant features or regions. Finally, inFig. 10, a sequence of SEM images of lamella-2 (crack in SC sample) at sev-eral stages during the FIB thinning process is presented to give a 3D insightof the result of cracked-surface rubbing after long testing times.
Figure 7: SEM of FIB sequence followed to study the material around cracks and inclusionsby extraction of thin lamellae. This sequence refers particularly to lamella-3 (Fig. 9).
During microscopy of the circumferential cross section of the MPC speci-men, a large crack approximately 1.7mm long was found at a depth of around400µm. Its large dimensions and the considerable number of large inclusionsentrapped in the path of the crack indicate that it might have formed duringRCF. In order to determine its extent, the sample was sequentially groundand examined. Four cross sections are shown in Fig. 11. Throughout thesections, no connections of this crack with the free surface were found. Thecrack was analysed using electron backscatter di↵raction (EBSD) (fig. 12) todetermine if it propagated along the prior austenite grain boundaries, whichwould evidence the relatively poor toughness of 52100 steel. Furthermore,five inclusions found in section (d), but some still visible in (c), were analysedusing EDS to determine their chemical composition.
Continuing with the characterisation of the WEM generated, energy dis-persive spectroscopy (EDS) was used to determine the chemical compositionof the WEM compared to the matrix as well as analyse the composition of
15
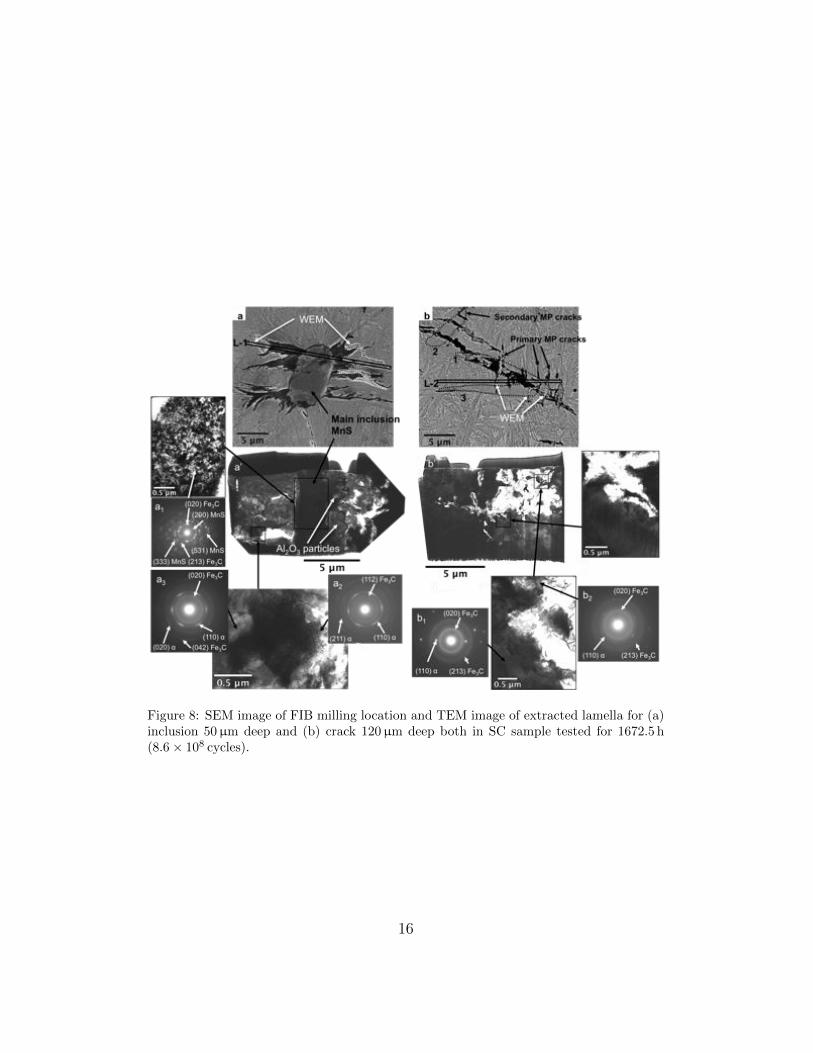
Figure 8: SEM image of FIB milling location and TEM image of extracted lamella for (a)inclusion 50µm deep and (b) crack 120µm deep both in SC sample tested for 1672.5 h(8.6⇥ 108 cycles).
16
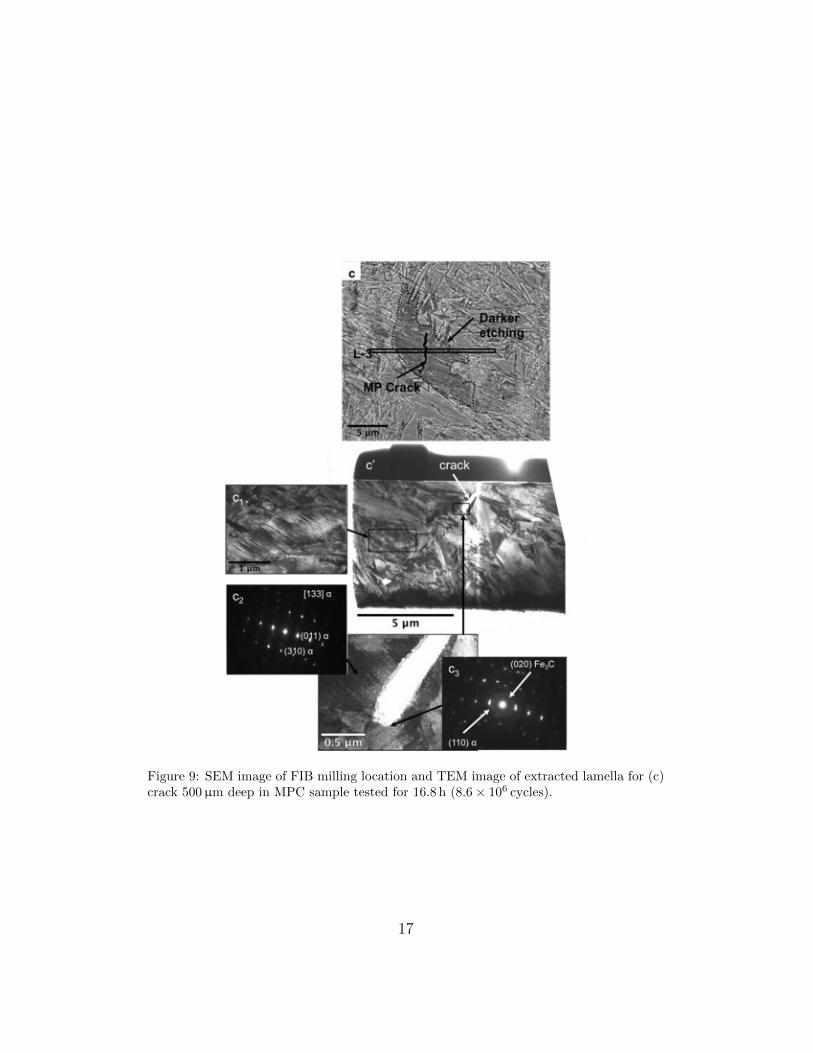
Figure 9: SEM image of FIB milling location and TEM image of extracted lamella for (c)crack 500µm deep in MPC sample tested for 16.8 h (8.6⇥ 106 cycles).
17
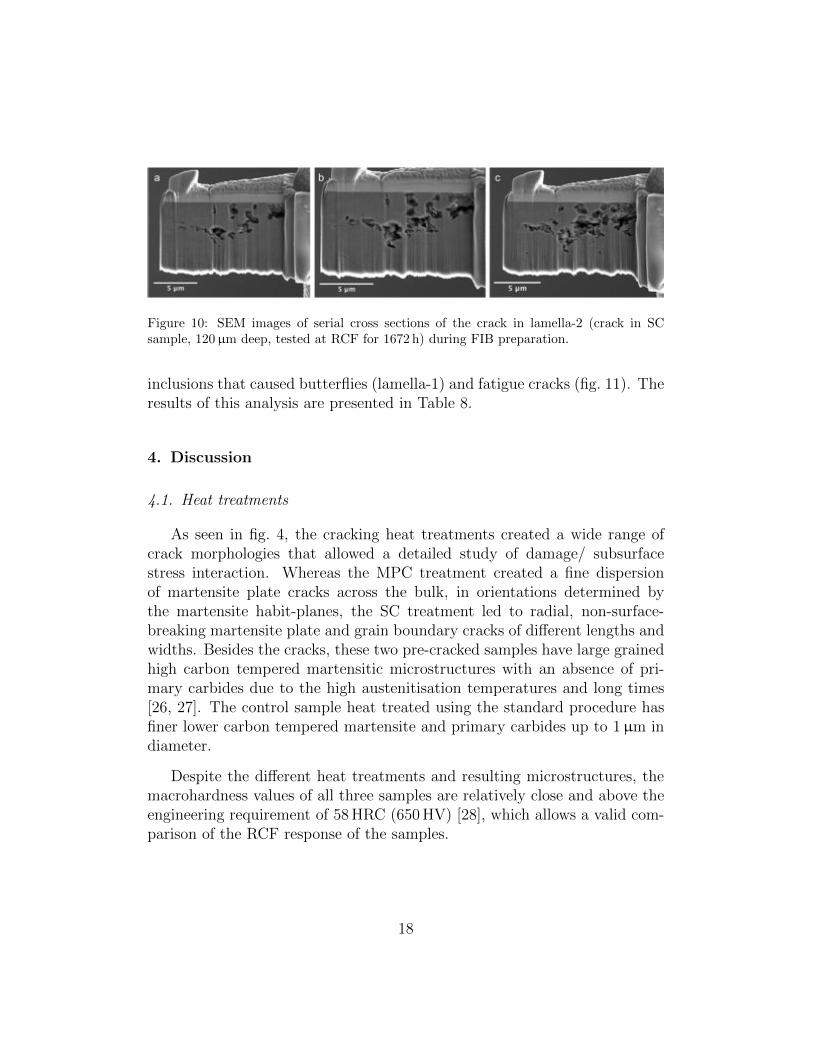
Figure 10: SEM images of serial cross sections of the crack in lamella-2 (crack in SCsample, 120µm deep, tested at RCF for 1672 h) during FIB preparation.
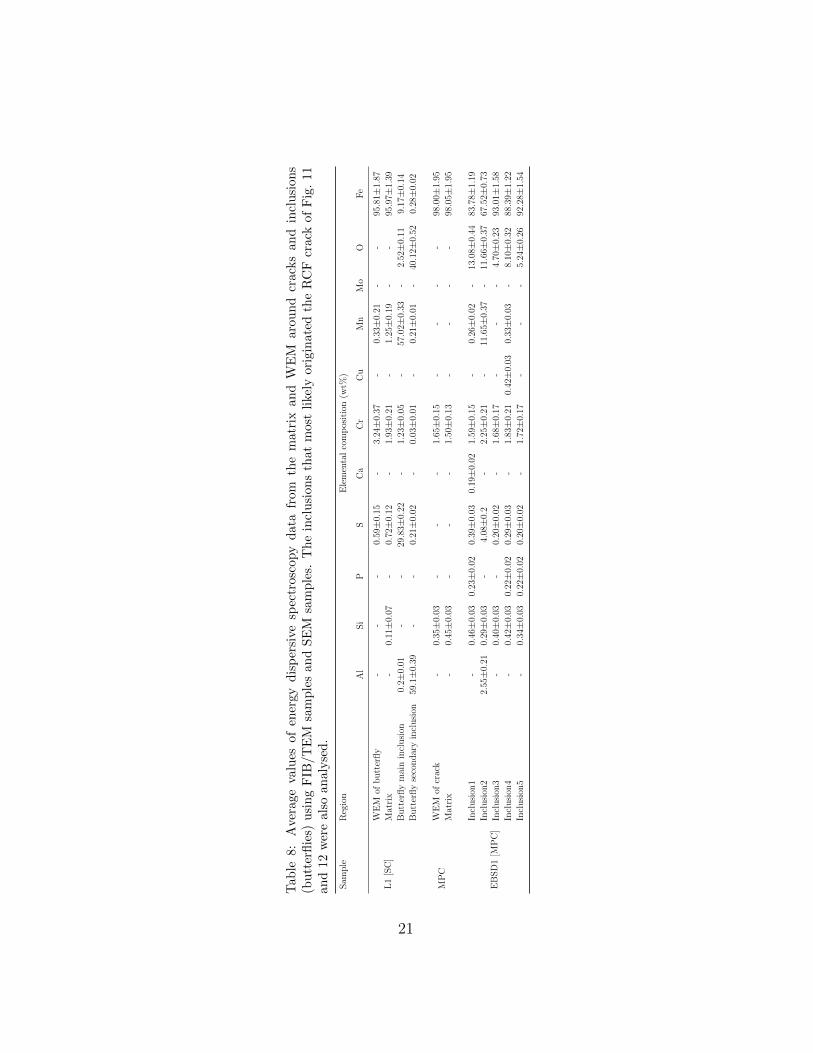
inclusions that caused butterflies (lamella-1) and fatigue cracks (fig. 11). Theresults of this analysis are presented in Table 8.
4. Discussion
4.1. Heat treatments
As seen in fig. 4, the cracking heat treatments created a wide range ofcrack morphologies that allowed a detailed study of damage/ subsurfacestress interaction. Whereas the MPC treatment created a fine dispersionof martensite plate cracks across the bulk, in orientations determined bythe martensite habit-planes, the SC treatment led to radial, non-surface-breaking martensite plate and grain boundary cracks of di↵erent lengths andwidths. Besides the cracks, these two pre-cracked samples have large grainedhigh carbon tempered martensitic microstructures with an absence of pri-mary carbides due to the high austenitisation temperatures and long times[26, 27]. The control sample heat treated using the standard procedure hasfiner lower carbon tempered martensite and primary carbides up to 1µm indiameter.
Despite the di↵erent heat treatments and resulting microstructures, themacrohardness values of all three samples are relatively close and above theengineering requirement of 58HRC (650HV) [28], which allows a valid com-parison of the RCF response of the samples.
18
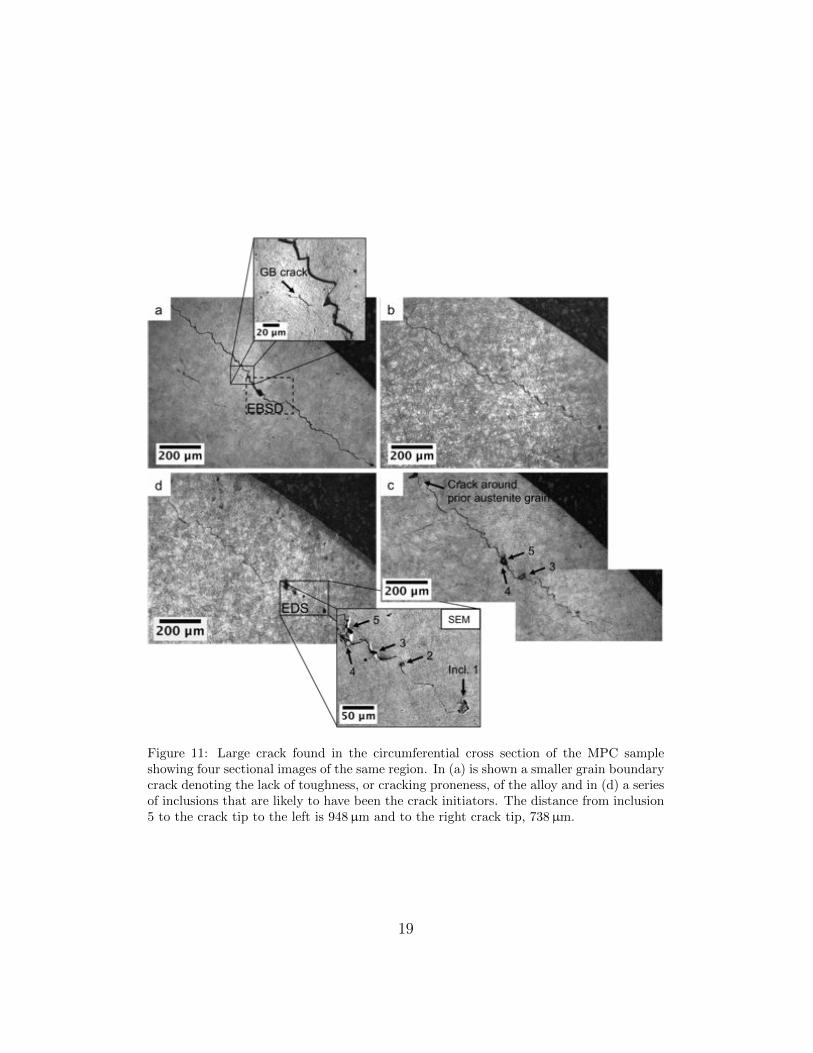
Figure 11: Large crack found in the circumferential cross section of the MPC sampleshowing four sectional images of the same region. In (a) is shown a smaller grain boundarycrack denoting the lack of toughness, or cracking proneness, of the alloy and in (d) a seriesof inclusions that are likely to have been the crack initiators. The distance from inclusion5 to the crack tip to the left is 948µm and to the right crack tip, 738µm.
19
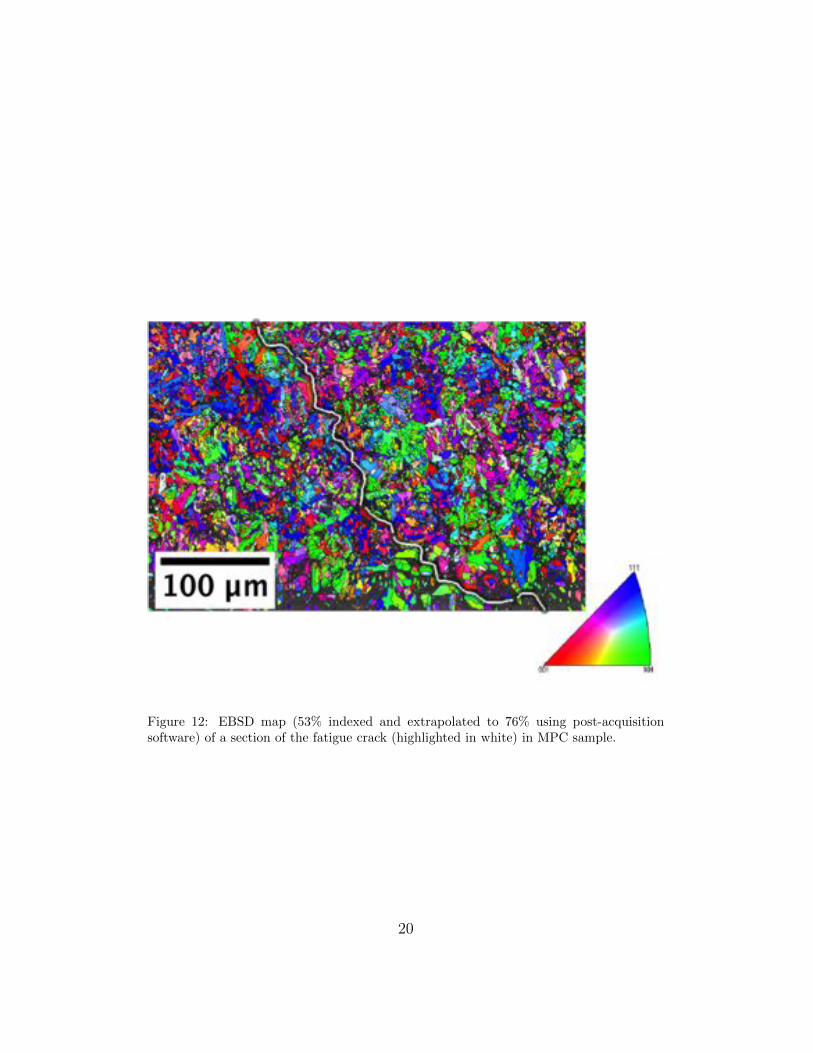
Figure 12: EBSD map (53% indexed and extrapolated to 76% using post-acquisitionsoftware) of a section of the fatigue crack (highlighted in white) in MPC sample.
20
Tab
le8:
Average
values
ofenergy
dispersive
spectroscopydata
from
thematrix
and
WEM
around
cracksand
inclusions
(butterflies)
usingFIB
/TEM
samplesan
dSEM
samples.
Theinclusionsthatmost
likely
originatedtheRCFcrack
ofFig.11
and12
werealso
analysed.
Sam
ple
Region
Elementalcomposition(w
t%)
Al
Si
PS
Ca
Cr
Cu
Mn
Mo
OFe
L1[SC]
WEM
ofbutterfly
--
-0.59±0.15
-3.24±0.37
-0.33±0.21
--
95.81±
1.87
Matrix
-0.11±0.07
-0.72±0.12
-1.93±0.21
-1.25±0.19
--
95.97±
1.39
Butterflymaininclusion
0.2±
0.01
--
29.83±
0.22
-1.23±0.05
-57.02±
0.33
-2.52±0.11
9.17±0.14
Butterflysecondaryinclusion
59.1±0.39
--
0.21±0.02
-0.03±0.01
-0.21±0.01
-40.12±
0.52
0.28±0.02
MPC
WEM
ofcrack
-0.35±0.03
--
-1.65±0.15
--
--
98.00±
1.95
Matrix
-0.45±0.03
--
-1.50±0.13
--
--
98.05±
1.95
EBSD1[M
PC]
Inclusion
1-
0.46±0.03
0.23±0.02
0.39±0.03
0.19±0.02
1.59±0.15
-0.26±0.02
-13.08±
0.44
83.78±
1.19
Inclusion
22.55±0.21
0.29±0.03
-4.08±0.2
-2.25±0.21
-11.65±
0.37
-11.66±
0.37
67.52±
0.73
Inclusion
3-
0.40±0.03
-0.20±0.02
-1.68±0.17
--
-4.70±0.23
93.01±
1.58
Inclusion
4-
0.42±0.03
0.22±0.02
0.29±0.03
-1.83±0.21
0.42±0.03
0.33±0.03
-8.10±0.32
88.39±
1.22
Inclusion
5-
0.34±0.03
0.22±0.02
0.20±0.02
-1.72±0.17
--
-5.24±0.26
92.28±
1.54
21
4.2. Retained austenite
The retained austenite data presented in Table 4 show a consistent trend,that V
�
increases with austenitisation temperature and time, with a tendencyfor decrease upon tempering and rolling contact fatigue testing.
According to Voskamp, the values of retained austenite during RCF de-crease depending on the number of cycles and Hertzian pressure applied [5].For example, for 3.5GPa it should be 0.03 after 2.8⇥108 cycles and virtuallyno retained austenite after 8.6⇥108 cycles. Due to experimental limitations,the present study did not allow precise measurement of the quantity of re-tained austenite after RCF in the small subsurface volume that experiencesthe largest shear stresses, the results reflecting an averaged determinationfrom regions subjected to di↵erent levels of stress, which explains why thesevalues are larger than reported ones and very similar to that of the Q-T sam-ples. To avoid this averaging, Voskamp performed repeated XRD measure-ments using Mo K
↵
radiation and a spot size of only 1mm2 on continuouslyrotating inner bearing rings with one measurement per depth level after layerremoval through electropolishing of the whole ring, but such technique wasnot accessible in this study [5].
The larger retained austenite contents of samples SC and MPC will beshown in subsequent discussion to play an important role in the generationof WEM.
4.3. Surface roughness and RCF testing
Before analysing the RCF response of each sample in terms of WEMgeneration it is important to note the relationship between the cycles thateach sample ran for and parameters that can lead to failure attributableto surface roughness or the consequences of retained austenite. As seen inTable 5, the surface roughness of the pre-cracked samples was lower than thecrack-free one, however both control and MPC specimens ran for almost thesame amount of time (⇠550 h). Instead, despite MPC and SC having almostidentical surface roughness values and retained austenite contents, SC ranfor over three times longer than MPC, indicating counterintuitively, that thesubsurface case of cracks created by indenting played a key role in enhancingRCF life.
22

Microscopy demonstrated that the initial radial microscopic and grainboundary cracks in sample SC had propagated and branched, thus toughen-ing the steel in a manner similar to the behaviour of other brittle materials[29, 30]. The indentation cracks introduced prior to RCF testing, and anycracks in martensite plates, serve to deflect the contact-stress induced frac-tures. The initial microscopic cracks in martensite plates are themselvesrandomly oriented on a macroscopic scale and hence serve the same purpose;this is evident in Fig. 8b where two roughly normal families of martensiteplates, 2 and 3, had their cracks propagated and intersected in 1 causingdeflection of at least five crack paths (three vertical and two roughly hori-zontal).
Many voids and cavities where discovered when a TEM lamella (L-2) wascarved out of region 1 where the cracks intersect (Figs 10 and 8b). Evans ob-served similar voids in the non-WEM side and at the tips of butterfly cracks,which led him to conclude that these coalesce to form butterfly cracks atdefects, and that the formation of WEM is cooperative with the propagationof such crack [31]. In the SC sample, microcracks were already present be-fore RCF and the di↵raction patters of fig. 8b reveal in b1 (away from crackedge) an amorphous-type structure of carbides in a BCC ferritic matrix andin b2 (closer to crack edge) the same carbide structure and a faint presenceof small ferrite crystallites, i.e. WEM in its very early stages. This evidencesuggests that voids do get generated during RCF but only propagate pre-existing cracks rather than creating them and that WEM generation is notcooperative [31] or simultaneous [12], but posterior to damage.
When examining the amount of WEM generated in the three samplestested, it was seen that most WEM in the MPC sample (551.2 h) occurredat depths consistent with the ⌧
xz,max
(99µm), whereas for the SC sample(1672.5 h) more counts were found in the depth of the ⌧
max
(190µm). Notethat in the SC sample, the maximum depth at which cracks remain aftergrinding and before testing is ⇠ 300µm. In the case of the control sample(558.1 h), all WEM counts were related to butterfly wings and found between10 and 100µm deep. This is because the SC and MPC samples contain pre-existing cracks, some of which are appropriately located to begin the processthat leads to WEM formation, whereas an initiation stage is necessary in thecase of the control sample, and this initiation must occur in the most highlystressed region. Although it is clear from the images of fig. 5 that more WEM
23
regions were found in the pre-cracked samples, all three samples had similaramounts of butterfly wing WEM since all were manufactured with the samematerial and roughly contain the same amount of inclusions. It is also worthclarifying that the butterfly cracks of the inclusions in the control sampleshown in fig. 5 are oriented either parallel or up to 45 � to the rolling surfaceand that not all (fig. 5u, v, and w) exhibit WEM as butterfly cracking atinclusions occurs at di↵erent times of the RCF life, mainly depending on theinclusion depth, size, and interface with the matrix [32].
4.4. WEM characterisation
When analysing the WEM formed in RCF tested samples, it was clearthat the morphology of the cracks along with the presence of primary or sec-ondary carbides around cracks plays an important role in WEM generation.
Although no direct relationship was found between the orientation orlength of cracks and WEM, crack orientation is a parameter that must in-teract with the subsurface shear stresses and the rolling direction. In otherwords, the contact-induced stresses will promote closing of certain regions ofa crack or the separation of crack faces depending on the crack-orientation.In general, the narrower regions of the crack develop more WEM due tomore intense rubbing of their surfaces. It is clear how the narrower cracksin the MPC sample developed more WEM than the wider ones in the SCsample, despite the fact that the latter sample survived almost three timeslonger (fig. 5). Nevertheless, some surface-cracks, such as those observed infig. 5r, q, and s, appear relatively wide, possibly due to an etching e↵ect sincethese cracks are in fact surrounded by WEM and do not show evidence ofbranching.
The location of cracks with respect to certain microstructural features alsoinfluenced WEM generation/absence and two cases were identified: 1) crackssurrounded by the tempered martensitic matrix, and 2) cracks in contactwith retained austenite. It is important to bear in mind that there were noprimary carbides in samples SC and MPC because of the high austenitisingtemperatures used, so that the wavy lines found in white-etching areas ofbutterfly wings for example (see inside dotted white line of fig. 8a), are notdue to be elongated carbides as is sometimes claimed [31].
In the first case, fine carbides resulting from the tempering of martensite
24
dissolve upon crack rubbing, allowing WEM formation. As Loy and McCal-lum established, WEM is carbon supersaturated nanosized ferrite [10]. Dueto a high austenitisation temperature and long time, all the cementite in MPCand SC samples was fully dissolved so the only dissolvable carbides to su-persaturate the ferrite upon crack rubbing are tempering carbides. This wascorroborated through TEM fig. 8a and b where no crystalline tempering car-bides were seen near cracks, only amorphous rings likely corresponding to ex-tremely fine carbides in the process of dissolution. In the second case, cracksunder RCF acting as stress concentrators cause the stress-induced transfor-mation of the neighbouring retained austenite into untempered martensite,which then is free from primary and secondary carbides to be dissolved intosolution and form hard white-etching matter, i.e. carbon supersaturatednanosized ferrite [10, 12]. The stress-induced martensite shows dark contrast(in SEM) in the vicinity of the cracks (see fig. 9c), which should not be con-fused with the dark-etching regions thought to be an over-tempering of themicrostructure [33, 34]. In this second case, observations tend to suggestthat either very little or no WEM at all is formed for the amount of cyclestested since carbon would have to be made available through autotemperingor short-circuiting via dislocation clouds, for example. Since the pre-crackedsamples had more retained austenite, the cracks that after RCF were notsurrounded by WEM are likely to be either formed at late stages of theRCF process, neighbouring retained austenite regions, not in the regions ofmaximum subsurface shear stress, or sliced in a plane in which WEM is notvisible.
4.5. Nanohardness
It is well-known that nanohardness values reported in GPa di↵er consid-erably from the macrohardness HV30 values because of the small volume ofmaterial involved in the former case [35, 36]. However, the relevant fact isthat the WEM is approximately 9% harder than the matrix although theindents are just a few micrometres away from the cracks (Table 7, Fig. 6).It is possible that this represents an underestimate because of the realtivelysmall size of the WEM regions and the necessarily close proximity of WEM tothe cracks. When larger regions of WEM have been studied, most reportedvalues are found to be 30-50% harder than the surrounding matrix [9, 12]although Navas et al. reported a hardness only 5% higher than the matrixfor WEM layers formed in hard-turned AISI O1 steel [37].
25
4.6. FIB/TEM
By analysing the images and di↵raction patterns of one inclusion and acrack in the SC sample and one crack of the MPC sample, it was possible toobtain a wide spectrum of detail on the deformation mechanisms that takeplace during RCF and lead to the formation of WEM. The cross section of abutterfly 50µm deep (fig. 8a) reveals three interesting features: (i) the maininclusion, later confirmed to be MnS through EDS, has a very fine grainedstructure as seen in the micrograph and through its ring-like di↵raction pat-tern indexed as MnS and M3C carbide (a1). This structure is surprisinglysimilar to that of WEM (nanosized crystallites), possibly because the at-tached hard Al2O3 particles focus the strain on the soft MnS in a similarfashion as hard inclusions beat on the softer ferrite around them during RCFpromoting carbide dissolution and recrystallisation that give rise to the car-bon supersaturated nanosized ferrite known as WEM. (ii) At the tip of one ofthe butterfly cracks, a region of very small grains (a2) was found, which wasindexed as nanosized ferrite with a faint halo of amorphous-like carbide. (iii)Regions further away from the butterfly crack where no small grains werepresent were indexed as a single but heavily deformed ferrite crystal with aheavy presence of amorphous-like carbide.
When comparing these observations with a deflected crack, in the samesample, and 120µm deep (fig. 8b), the cross section revealed a crack withfaces widely separated, possibly propagated through the presence of voids,that had: (i) twinned regions very close to crack surfaces, possibly stress-induced mechanical twins (fig. 8b’), (ii) regions further away from cracks (b1)that were indexed as undeformed ferrite crystals with a strong dispersion ofamorphous-like carbide, and (iii) regions very close to the crack surfaces (b2)that had a lighter amorphous-like carbide response and a weak peak of smallferritic crystallites. In conclusion, wherever there is a presence of nanosizedferrite, the amount of amorphous-like carbide seems to diminish comparedto regions where ferrite is coarser and simply deformed (further away fromcracks).
The inclusion and crack analysed in the SC sample had been subjected toa larger number of RCF cycles than the crack of the MPC sample (fig. 9c).However, the MPC sample shows already after 16.8 h of RCF a more denselytwinned region in the vicinity of the crack (c2) when compared with normalregions of twinned martensite away from it (c1). There also is amorphous-like
26
carbide in the ferritic matrix near the crack tip. These observations seemto suggest that after the stress induced transformation of retained austeniteneighbouring the crack to untempered martensite, the process of ferrite de-formation through rubbing and eventual recrystallization (nanoferrite) is pro-gressive but for the short running time of lamella 3, only the stress-inducedtransformation/deformation twinning took place.
4.7. EBSD
The large crack found in a cross sectional cut of the MPC sample exactlybelow the centre of contact (see fig. 11) was analysed through serial section-ing and EBSD which revealed at least twelve inclusions in the crack path,five of which were analysed using EDS. No WEM was observed around thecrack, there were no connections with the free surface, and the crack showedwider and narrower crack sections depending on orientation relative to therolling surface. Sections of the crack sometimes followed prior austenite grainboundaries (fig. 11c), with adjacent nascent cracks at austenite grain junc-tions (fig. 11a). These observations suggest this is a subsurface fatigue crackinitiated at inclusions, propagated through brittle grain boundaries and ar-rested near the free surface due to the compressive stresses developed duringRCF. The EBSD map showed that the regions to the left and right of thecrack path have di↵erent orientations confirming that the crack propagatesalong grain boundaries. None of the inclusions entrapped in the crack pathdisplayed signs of WEM butterfly wings despite the fact that butterflies havebeen shown to form after 105 cycles (⇠11min for the testing conditions usedin this study) meaning that the lack of WEM around the inclusions and fa-tigue crack is likely to be because they are located over 200µm away fromthe regions of maximum subsurface shear stresses [38, 39].
4.8. EDS
Measurements of the chemical composition of the WEM relative to thematrix were performed in two di↵erent scenarios (Table 8). The WEMformed around an inclusion in the SC TEM sample using an EDS-STEMdetector and secondly, WEM formed around a crack in the MPC SEM sam-ple using an EDS-SEM detector. In both cases the results agree that theWEM has a higher chromium concentration than the matrix, which matches
27
previous EDS analyses of white-etching areas [31]. The observation cannotbe attributed to, for example, the deformation-induced dissolution of Cr-richprimary carbides that are not present in the SC and MPC samples.
EDS was also used to analyse the composition of butterfly and fatigue-crack causing inclusions. The results in Table 8 confirm that the main but-terfly inclusion of fig. 8a’ (L-1) is manganese sulphide and the secondaryinclusions are alumina. In the case of the inclusions of fig. 11, only inclusion2 was clearly identified as a manganese sulphide with alumina encapsulation.Inclusions 1, 3, 4, and 5 appear to have fallen during preparation, but therelatively high oxygen content picked up suggest they were a family of glob-ular oxides, which are the second most common inclusion after sulphides in100Cr6 steel [40].
5. Conclusions
Critical experiments using a wide range of mechanical tests and charac-terisation tools have permitted the following conclusions regarding the white-etching matter formation in bearings:
• Evidence has been provided to show that the presence of microscopiccracks in samples prior to RCF testing leads to the formation of hardwhite-etching matter in their close proximity, akin to the butterflywings in conventional bearing tests. Therefore, hard white-etching mat-ter is likely to be a symptom of microscopic fracture rather than thecause. During rolling contact fatigue, the crack faces rub and beatagainst each other, creating minute grains as a result of recovery andrecrystallisation, with the possibility of the mechanical solution of finecementite playing a role. Coarse primary cementite was absent in two ofthe samples studied and hence its presence is not a critical requirementfor WEM formation.
The corollary of this conclusion is that WEM can in principle be miti-gated by increasing the toughness of the bearing steel, or in other words,increasing the energy required for cracks to form and propagate.
• Consistent with previous work, the WEM formed around inclusions(butterflies) and cracks is essentially nano-sized ferrite with a very fine
28
distribution of carbide particles that is at an advanced stage of subdi-vision, so much so that these particles display an amorphous-like ring-di↵raction pattern. This WEM was also found to be approximately 9%harder than the tempered martensitic matrix.
• In order to form WEM around cracks through the rubbing of surfacestwo parameters are highly important: the width of the crack and theamount of carbides in the matrix around the crack. On the one hand,the orientation of the crack with respect to the rolling direction andthe depth of subsurface shear stress will determine which part of thecrack widens under the applied pressure and which contract, rub, andgenerate WEM. On the other hand, if austenitised in the � phase field,cracks neighbouring retained austenite regions that strain transform tountempered martensite under RCF seem to generate less WEM due tothe lack of carbides compared to cracks found in tempered martensite.Since inclusions are better stress concentrators than cracks, no retainedaustenite is found around them but only tempered martensite, hencewhy they proved to be more e↵ective WEM generators than cracks.Carbides act as a source of carbon to be dissolved through cyclic stressand supersaturate the nanostructured ferrite crystallites, which is whathard WEM is. Without carbides in the proximity, ferrite deforms intonanosized crystallites, but does not get enriched by carbon so no hardWEM or very little is formed.
• Since the pre-cracked samples used in this work were austenitised inthe � phase field where all spheroidised carbides were dissolved, thewavy contours found in the WEM wings of butterflies are more likelyto be flow marks rather than elongated carbides as previously believed.
• Just like hard inclusions under RCF are able to deform the softer steelaround them by creating nano-sized ferrite with a distribution of veryfine carbides, a hard oxide like alumina encapsulating a softer inclusionlike manganese sulphide (duplicate inclusions) can create a nano-sizedmanganese sulphide structure with a very fine carbide distribution dueto the beating action of the hard alumina particle.
• FIB-TEM characterisation of RCF samples confirmed the formation ofvoids and cavities around cracks and butterflies, which seem to widen
29
and lengthen the existing cracks, but no evidence was found of thosevoids coalescing into newly formed cracks.
• EBSD showed that fatigue cracks propagate along the prior austenitegrain boundaries confirming the lack of toughness of 52100 steel despitethe standard tempering treatment and the considerable amount of re-tained austenite found in that specific sample that would normally stiflecrack growth. This subsurface crack propagated along many inclusions,which may have been its initiators.
• Despite being counterintuitive, the surface cracked sample displayedthe longest RCF life of all samples (more than three times longer)although it virtually had the same surface roughness and was testedunder the same conditions. Micrographs show how these subsurface mi-crocracks toughen the steel by deflecting damage through crack branch-ing.
6. Acknowledgements
The authors are thankful to SKF for allowing usage of the RCF rig andhelping with sample preparation. Gratitude is also expressed to other mem-bers of the Phase Transformations and Complex Properties Group, especiallyEd Pickering, Dr. Steve Ooi, Dr. Yan Pei, Dr. JeeHyun Kang, James Ny-gaard, Chris Hulme-Smith, and Catriona Yeoh for their help with experi-mental techniques and interesting discussions. Funding by CONACyT, theCambridge Overseas Trust, and the Roberto Rocca Education Programmeis highly appreciated and acknowledged.
[1] M.-H. Evans: Materials Science and Technology 2012, vol. 28, pp. 3–22.
[2] S. B. Hosseini: Characterization of white layers induced by hard turningof AISI 52100 steel. residual stresses, retained austenite, and tempera-tures: Ph.D. thesis: Chalmers University of Technology: Gothenburg,Sweden 2013,.
[3] H. K. D. H. Bhadeshia: Progress in Materials Science 2012, vol. 57, pp.268–435.
30
[4] J. M. Beswick: Practical Metallography 1975, vol. 12, pp. 200–206.
[5] A. P. Voskamp: Microstructural changes during rolling contact fatigue:Ph.D. thesis: Technical University of Delft 1996,.
[6] N. Mitamura, H. Hidaka, S. Takaki: Materials Science Forum 2007, vol.539–543, pp. 4255–4260.
[7] H. Harada, T. Mikami, M. Shibata, D. Sokai, A. Yamamoto, H. Tsub-akino: ISIJ International 2005, vol. 45, pp. 1897–1902.
[8] J. Takahashi, K. Kawakami, M. Ueda: Acta Materialia 2010, vol. 58,pp. 3602–3612.
[9] R. Osterlund, O. Vingsbo, L. Vincent, P. Guiraldenq: ScandinavianJournal of Metallurgy 1982, vol. 11, pp. 23–32.
[10] B. Loy, R. McCallum: Wear 1973, vol. 24, pp. 219–228.
[11] H. Swahn, P. C. Becker, O. Vingsbo: Metallurgical & Materials Trans-actions A 1976, vol. 7, pp. 35–39.
[12] A. Grabulov, R. Petrov, H. W. Zandbergen: International Journal ofFatigue 2010, vol. 32, pp. 576–583.
[13] K. Hashimoto, K. Hiraoka, K. Kida, E. C. Santos: Materials Scienceand Technology 2012, vol. 28, pp. 39–43.
[14] B. Zhang, W. Shen, Y. Liu, X. Tang, Y. Wang: Wear1997 211, (164–168).
[15] D. M. Turley: Materials Science and Engineering 1975, vol. 19, pp. 79–86.
[16] K. Ryttberg, M. K. Wedel, P. Dahlman, L. Nyborg: Journal de PhysiqueIV (Proceedings) 2006, vol. 134, pp. 1313–1318.
[17] S. B. Newcomb, W. M. Stobbs: Materials Science & Engineering A 1984,vol. 66, pp. 195–204.
[18] W. Lojkowski, M. Djahanbakhsh, G. Burkle, S. Gierlotka, W. Zielinski,H. J. Fecht: Materials Science & Engineering A 2001, vol. 303, pp. 197–208.
31
[19] H. Schlicht: Materialwissenschaft und Werksto↵technik 2008, vol. 39,pp. 217–226.
[20] G. J: Tribological aspects of rolling bearing failures in tribology- lubri-cants and lubrication: Chapter 2: SKF GmbH, Department of MaterialPhysics/ Institute of Materials Science, University of Siegen, Germany.2011,.
[21] W. Solano-Alvarez, H. K. D. H. Bhadeshia: Submitted to Metallurgicaland Materials Transactions A 2013, .
[22] Delta Research Corp.: Livonia, Michigan, USA: Ball/Rod RCF TesterModel BR-4 Users Manual 2010,.
[23] D. Glover: A ball–rod rolling contact fatigue tester: in: J. J. C. Hoo(Ed.), Rolling Contact Fatigue Testing of Bearing Steels ASTM STP771: ASTM International, Philadelphia, USA, 1982: pp. 107–124.
[24] K. L. Johnson: Contact Mechanics: Cambridge University Press, Cam-bridge, U. K., 1985.
[25] M.-H. Evans, A. D. Richardson, I. Wang, R. J. K. Wood: Wear 2013,vol. 302, pp. 1573–1582.
[26] J. M. Beswick: Metallurgical & Materials Transactions A 1984, vol. 15,pp. 299–306.
[27] C. A. Stickels: Metallurgical Transactions 1974, vol. 5, pp. 865–874.
[28] E. V. Zaretsky: Materials Science and Technology 2011, vol. 28, pp.58–69.
[29] J. Cook, J. E. Gordon, C. C. Evans, D. M. Marsh: Proceedings of theRoyal Society of London A 1964, vol. 282, pp. 508–520.
[30] W. Clegg, K. Kendall, N. Alford, J. Birchall, T. Button: Nature 1990,vol. 347, pp. 455–457.
[31] M.-H. Evans, J. C. Walker, C. Ma, L. Wang, R. J. K. Wood: MaterialsScience and Engineering: A 2013, vol. 570, pp. 127–134.
32
[32] A. Marze, L. Vincent, B. Coquillet, J. Munier, P. Guiraldenq: MemoiresEtudes Scientifiques Rev. Metallurg. 1979, vol. 76, pp. 165–173.
[33] K. Sugino, K. Miyamoto, M. Nagumo, K. Aoki: Trans. Iron Steel Insti-tute of Japan 1970, vol. 10, pp. 98–111.
[34] R. O. Ritchie: Metal Science 1977, vol. 11, pp. 368–381.
[35] N. K. Mukhopadhyay, P. Paufler: International materials reviews 2006,vol. 51 (4), pp. 209–245.
[36] M. T. Oyen, R. F. Cook: Journal of the Mechanical Behavior of Biomed-ical Materials 2009, vol. 2 (4), pp. 396–407.
[37] V. G. Navas, I. Ferreres, J. A. Maranon, C. Garcia-Rosales, J. G. Sevil-lano: Journal of Materials Processing Technology 2008, vol. 195, pp.186–194.
[38] G. B. Johnston, T. Andersson, E. V. Amerongen, A. Voskamp: Experi-ence of element and full–bearing testing of materials over several years:in: J. J. C. Hoo (Ed.), Rolling Contact Fatigue Testing of Bearing Steels:ASTM, Philadelphia, USA, 1982: pp. 190–205.
[39] K. Furumura, Y. Murakami, T. Abe: Motion and Control 1996, vol. 1,pp. 30–36.
[40] M.-H. Evans, L. Wang, H. Jones, R. J. K. Wood: Tribology International2013, vol. 65, pp. 146–160.
33