white paper 6th csr online awards - gruppo hera · lundquist. 6th csr online awards beyond...
TRANSCRIPT

lundquist.
6th CSR ONLINE AWARDSBeyond reporting to create distinctiveness in CSR communications
White Paper
May 2014
European and Italian editions

2CSR ONLINE AWARDS 2014 ·
REPORTING IS NOT ENOUGH: THE NEED TO CREATE DISTINCTIVENESSThe field of corporate social responsibility (CSR) and sustainability is undergoing a profound shift that is re-shaping the company-sta-keholder relationship. The penetration of digital into daily, working routines has reached a tipping point in terms of how people access corporate information and engage over environmental, social and governance (ESG) issues.
The most notable result of this shift is a collapse in traditional barriers between “report”, “communications” and “engagement”. The CSR Online Awards, in its 6th edition, has evolved to reflect this new reality and has been reorganised around 7 pillars, each with an appropriate methodology and set of evaluation criteria mixing quantitative and qualitative elements.
KEY FINDINGS FROM OUR RESEARCH INTO USER TRENDS:
• Acceleration of uptake of social and digital technologies compared with previous editions of the research
• Virtually all sustainability professionals (94%) are on social me-dia with three quarters of these doing so in relation to CSR and sustainability amid a blurring of the distinction between the personal and professional realm
• Numbers of people who look to a report or other printed document as a source of non-financial corporate information has crumbled (about a third list it as a priority) as time-pres-sed professionals expect to find what they are looking for directly online
• The report is not enough: users examine a full range of digital content – from text to infographics to video – from a variety of mobile and desktop devices not just to find information but also to assess a company’s strategy, evaluate success in meeting social and environmental challenges and to stay con-nected with like-minded people
KEY FINDINGS FROM OUR ANALYSIS OF EUROPE’S TOP 100 COMPANIES:
• Companies split into three groups: 1. Those not reporting on non-financial topics; 2. Those failing to provide sufficient disclosure on their websites; 3. The remaining “finalists”
• A quarter of companies excluded from a full assessment be-cause they fail to offer a minimum set of information online or don’t report on sustainability
• For the remaining companies, the average score slumped to 43.5 out of 100 from 49.8 in 2012
• Strongest areas for companies are – by far – providing a core set of concrete information (average score 70%) in a user friendly framework (average score 47%)
• Major weakness is not so much social media but “distinctive-ness” – the use of text, image and video to tell the story, and the stories, of a company’s CSR commitment and its context
EVALUATION MODEL BASED ON OUR USER SURVEY
• 350 responses from CSR professionals and stakeholders
• 1,600 responses since the research was launched in 2007
• Answers from 44 countries with most co-ming from continental Europe, UK and US
“The best performers in the CSR Online Awards are companies that appear to have understood these seismic shifts and are looking for innovative ways to respond.”
“With sustainability reporting now mainstream for large companies and the European Union’s recent directive in non-financial transparency due to make it a reality for thousands more, it has become essential to approach digital with a savvy mix of disclosure and engagement that marks out each company’s unique context and response.”
James Osborne, head of CSR at Lundquist.
6TH CSR ONLINE AWARDS
• Europe’s first study of online CSR communi-cations, 6th edition
• Completely new assessment methodology based on 7 pillars, with more focus on distin-ctiveness and integration
• Considered the 100 largest listed companies in Europe
• 23 companies excluded for not disclosing basic information
• 43.5 average score out of 100• Deutsche Post DHL, Nestlé and Unilver
emerged as best companies in the study
FORTHCOMINGEDITIONS
• GERMANY• NORDIC REGION• SWITZERLAND

3CSR ONLINE AWARDS 2014 ·
CHANGING ASSESSMENT METHODOLOGY AROUND 7 PILLARSIn order to have a more flexible evaluation and give greater importance to areas such as engaging content and social media, the assessment was organised around the seven “pillars” of online CR communications developed over the past few years. Find out more about “CHANGING ASSESSMENT METHODOLOGY” on page 4, the description of the “7 PILLARS OF CSR ONLINE AWARDS” on page 5 and about the complete “APPROACH & METHODOLOGY” on page 22.
23 COMPANIES EXCLUDED FOR NOT DISCLOSING BASIC INFORMATIONStarting with the components of the FTSE Eurotop 100 Index, the research progressively excluded companies that failed to meet users’ basic needs for information: firstly those that were not reporting and then those reporting but failing to provide key information on their company website. Find out more in “QUALIFYING FOR INCLUSION: SCREENING BASED ON DISCLOSURE CRITERIA” on page 6.
THE NEW COMMUNICATION CHALLENGE: STAND OUT FROM THE CROWDSome companies are striving for excellence and, through our research, we’ve come across dozens of interesting examples of innovation, best practice and experimentation. Here is a small selection of what caught our eye from Unilever, Nestlé, Deutsche Post DHL, British American Tobacco, Ericsson, Volvo and Allianz. “WHAT CAUGHT OUR EYE” on page 7.
CHANGING ROLE AND NEW FORMATS TOWARDS FRAGMENTED REPORTINGNow that non-financial reporting is virtually standard for the largest companies, it is ceasing to be presented as a unitary body of infor-mation. An increasing number of companies are not publishing a stand-alone document but integrate non-financial information into the annual report. See “FOCUS ON REPORTING” on page 16.
TOP PERFORMERS IN EUROPEDeutsche Post DHL took the honours with 73 points and was also the best improver. Nestlé (67.75) climbed into the 2nd position, from 6th in 2012 and Unilever (66.25) retained its 3rd position. Go the “WINNERS CSR ONLINE AWARDS EUROPE 100” on page 18, the “TOP PERFORMERS IN ONLINE CSR COMMUNICATIONS: EUROPE 100” on page 19 and the “COMPLETE RANKING EUROPE 100” on page 24.
COUNTRY FOCUS: 2 OUT OF 3 ITALIAN COMPANIES DO NOT OFFER THE BASIC SUSTAINABILITY INFORMATION ONLINEOnly 35 out of 97 largest listed and non-listed companies in Italy made it to the final step, (76 at the European level). It’s disappointing to find 30 companies failing to report on non-financial aspects, including some of the largest listed companies. Go the the “COUNTRY FOCUS: ITALY” on page 20, the “WINNERS CSR ONLINE AWARDS ITALY 100” on page 21 and the “COMPLETE RANKING ITALY 100” on page 26.
WHAT YOU CAN FIND IN THIS WHITE PAPER
WHO WE AREFind out more about our research programmes and how we can help to develop successful sustainability communications that respond to the most demanding corporate audiences on page 28
EXHAUSTIVE55% fail to explain how they identify sustainability priorities (materiality)Find out more on page 10
CONCRETE80% provide quantitative environmental performance data. this is the highest-scoring section out of the seven pillars. Find out more on page 9
ONGOING66% of companies provide contact information responded to a test email inquiry within two weeksFind out more on page 12
DISTINCTIVE26.5% use videos to communicate strategy, environmental or social case studies.Find out more on page 15
USER FRIENDLY13% of website are in responsive design (adapting content automatically to different screen sizes)Find out more on page 11
SOCIAL16% of companies apparently use no social media channel to regularly address CSR and sustainability issuesFind out more on page 13
INTEGRATED89% of companies partially integrateCSR content in the “About Us” sectionFind out more on page 14

4CSR ONLINE AWARDS 2014 ·
0
20
40
60
80
100
Ongoing engagement
User experience
Content
2012*
51%
20.5%
26.5%
0
20
40
60
80
100DistinctiveIntegratedOngoing
Social
User friendly
Exhaustive
Concrete
2014
Two extra points were assigned for commendable feature outside the three main areas
18%
18%
20.5%
12%11%8%
12.5%
How the evaluation pr�ocol evolved
* Two extra points were assigned for commendable features outside the three main areas.
Changes in the approach were driven by user trends, mo-nitored in a survey of 350 CSR professionals, sustainability experts and other stakeholders (over 1,600 opinions have been collected over the years). Their input and our ongoing tracking of digital trends led us to renew the structure of the evaluation and expand it to cover more social media channels and the wider corporate website too.
Furthermore, we analysed more closely the varying nature of non-financial reporting, increasingly spread across different documents and formats.
Due to these changes in methodology and approach, final sco-res are not entirely comparable with previous years.
MAIN CHANGES TO OUR APPROACH
• More qualitative evaluation built around 7 pillars
• Looking beyond the CSR section to entire website and social media
• Companies selected through a double cut-off
• Revision of evaluation criteria
• Wider look at reporting formats
CHANGING ASSESSMENT METHODOLOGY AROUND 7 PILLARSAfter evolving gradually over the previous five editions, the evaluation approach was substantially revamped from its previous organisation around 3 macro-areas (Content, User experience and Ongoing engagement).
In order to have a more flexible evaluation and give greater importance to areas such as engaging content and social media, the assessment was organised around the seven “pillars” of online CR communications developed over the past few years.
In the previous edition, for example, content found in the main CSR section of each website made up about half of the total score, now down to 36%. Yet direct comparisons are difficult. We looked more closely not only at what was communicated in terms of content (Concrete, Exhaustive) but also at how it was communicated (Distinctive) and where it was positioned (Integrated).
“Our goal for the research is to look at companies’ online presence through the eyes of the users this information is primarily aimed at.”
“From our research, we know they are highly critical, social and mobile and immediately suspicious of superficial, unsubstantiated communications. This has pushed us to re-think our evaluation approach and subject companies to the same kind of intense examination they get from their stakeholders.”
Céline Steer, CSR consultant at Lundquist.

5CSR ONLINE AWARDS 2014 ·
7 PILLARS OF CSR ONLINE AWARDS
Distinctive: using digital to tell an engaging, unique story that focuses on the most important issues and shows what strategy means in day-to-day, concrete contexts through storytelling, video and visual communication
18
1120.5
12
8
12.5 18
Concrete: providing a core set of environmental, social and governance information, from policies and guidelines to data and objectives
Exhaustive: allowing users to see “under
the bonnet” with more detailed disclosure
(for example on stakeholder
engagement and target achievement)
Ongoing: keeping stakeholders updated on a regular basis (through news, blogs, etc.) and remaining open to feedback and comment
User friendly: speedy, intuitive navigation, reporting formats, search functionality as well as the user experience more generally
Social: leveraging social media to listen, inform and engage both in generic corporate accounts and in accounts specifically geared to audiences interested in CR or sustainability
Integrated: taking the CR message to stakeholders across the corporate website as part of the presentation of the company and information aimed at investors, journalists and jobseekers
Maximum score by pillar

6CSR ONLINE AWARDS 2014 ·
As emerged from our survey, professional users are most frustrated when they find company websites that contain only brief, superficial information about their environmental, social and governance performance, presented in a flattering, self-referential way.
For this reason, the research progressively excluded companies that failed to meet users’ basic needs for information starting with the components of the FTSE Eurotop 100 Index*:
1. Not reporting: companies that do not offer comprehensive reporting on non-financial topics (whether in a standalone CSR or sustainability report or integrated into the annual report) were excluded from the entire ranking process. Two French luxury companies, Hermès and Dior, were not assessed for this reason.
2. Below the basics: all reporting companies were subject to an initial evaluation, for the most part corresponding to the “Concrete” pillar, to check that they provide adequate information such as performance data, targets, code of ethics and policies on human resources, supply chain and human rights, climate change strategy plus guidelines and frameworks followed, news and contact information. The 21 companies that received a score of less than 40% of the maximum for this screening were also excluded from a full evaluation.
This approach allowed more time of the research to be dedicated to those companies that actually have information to communicate and to focus more on emerging trends.
It’s worth noticing that most of the excluded companies (8 out of 21) come from the consumer goods and services sectors, which tend to not exploit online channels to differentiate themselves in terms of sustainability. Moreover, a large number of companies represent high-impact industries such as mining and basic resources (8 companies), which seen to focus most of their efforts on documents and reports only.
QUALIFYING FOR INCLUSION: SCREENING BASED ON DISCLOSURE CRITERIA
23 COMPANIES EXCLUDED FOR NOT DISCLOSING BASIC INFORMATION
• 2 companies, both in the luxury sector, are not reporting on non-financial issues
• 21 companies do report but do not provide key information on their company website
• In the past edition of the research these companies tended to score around 30 points or less, well below the average of 47.8
• See the full list of excluded companies at the end of this white paper
Fully evaluated
Insufficient information on website
Not presenting a CR report
21%
77%
2%
Breakdown of European companies by cut-off points
*(Unilever is considered as one company in our research whereas in the index it is counted twice due to its dual structure, hence our research covered 99 companies)
Source: CSR Online Awards 2014.

7CSR ONLINE AWARDS 2014 ·
WHAT CAUGHT OUR EYEA quick look at the breakdown of average scores by pillar shows how online CSR communications is skewed by a disclosure-driven approach with websites packed with ever-greater amounts of corporate information.
The high point of performance, by a long way, was in the Concrete pillar (on average 69.5% of the maximum score) with encouraging levels of transparency on issues like climate change and environmental data, human rights and supply-chain standards. Most of the other areas of the research saw a mixed performance with average scores ranging from 39.6% for use of social media to 46.7% for user friendliness.
Where most companies are falling down, however, is on integration (33.6%) and distinctiveness (22.7%) – areas where smart use of digital is essential to engage stakeholders and reach out to audiences across the main corporate properties. From our point of view, it’s not enough for companies to develop fancy “stories” or videos for the stake of it but to do so to explain the company’s sustainability strategy and the link with thecore business, show how it tackles social and environmental impacts and to place its efforts into a broader context.
But beyond the picture captured by average scores, some companies are striving for excellence in all these different areas. Through our research, we’ve come across dozens of interesting examples of innovation, best practice and experimentation. Here is a small selection of what caught our eye.
20
30
40
50
60
70
80
90
100
Distinctiveness
Integration
Social User friendly
Ongoing
Exhaustive
Concrete
How companies performed by pillar
10
69.5%
40.8%
34.9%
46.7%39.6%
33.6%
22.7%
CONCRETE
Unilever’s much talked about Sustainable Living Plan includes a raft of targets for 2020. The Anglo-Dutch company is keeping people updated on how it is making progress towards those goals with detailed and open descriptions of its performance. In Unilever’s latest update, for example, it emerged that the company is struggling to get its customers to reduce emissions generated by their use of products such as soaps and shampoo.
EXHAUSTIVE
One perennial weak point for companies is sharing the input they get from stakeholders and issues under discussion. Nestlé holds an annual CSV Global Forum at which experts discuss topics that are critical for the Swiss company. The event is broadcast online and live tweeted for anyone following in real time. For the rest, summary videos (going back to 2009) are available on YouTube.
Source: CSR Online Awards 2014.

8CSR ONLINE AWARDS 2014 ·
ONGOING
Deutsche Post DHL does a lot of work to keep stakeholders engaged and updated. This includes what’s going on in its industry, not just within its own walls. The German company curates a “newsroom” that aggregates news from a variety of sources (including its own content). Among the categories covered are green logistics and supply chain management.
USER FRIENDLY
The presentation of reporting is a fundamental part of helping readers orient themselves in the flood of corporate information. British American Tobacco has optimised its reporting for on-screen reading and balances a range of documents and formats including its annual report (online and PDF) and sustainability section. It has reporting apps and an online data centre and produces focus reports on specific topics as well as a 20-page annual summary, all as user friendly “interactive PDFs”.
SOCIAL
We looked at more than 500 social media accounts, for the most part “generic” corporate accounts, to see if and how sustainability topics were broached. Ericsson uses its Facebook page, with 65,000 likes, not to talk just about itself but what technology can do to improve our lives, drive innovation and empower people. Engagement and response levels on the page are also good.
INTEGRATED
Despite regular claims that sustainability is “embedded” into everyday business, few companies raise it in relationship with innovation. Volvo’s R&D pages talk systematically about how it is working on sustainability mobility, energy efficiency and sustainable production. External links connect with a range of interactive websites on these topics.
DISTINCTIVE
Allianz faces a particular communications challenge in the grey, faceless world of insurance. Yet the German company abounds with images, videos, articles, interviews, case studies and infographics, both to bring its own commitment to life and to tackle relevant, broader issues such as access to finance and demographic change.
9CSR ONLINE AWARDS 2014 ·
PILLAR 1- CONCRETE
WHAT DO USERS WANT?
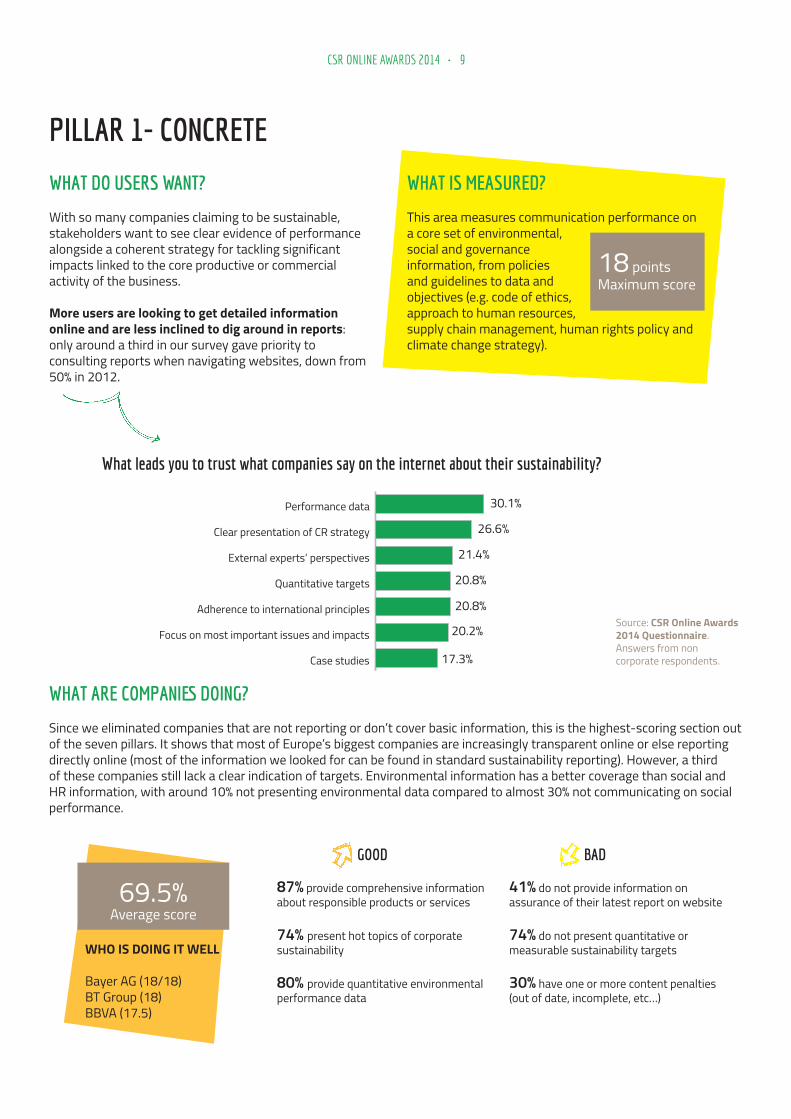
With so many companies claiming to be sustainable, stakeholders want to see clear evidence of performance alongside a coherent strategy for tackling significant impacts linked to the core productive or commercial activity of the business.
More users are looking to get detailed information online and are less inclined to dig around in reports: only around a third in our survey gave priority to consulting reports when navigating websites, down from 50% in 2012.
0 10 20 30 40 50 60 70 80 90 100
Case studies
Focus on most important issues and impacts
Adherence to international principles
Quantitative targets
External experts’ perspectives
Clear presentation of CR strategy
Performance data
What leads you to trust what companies say on the internet about their sustainability?
17.3%
20.2%
20.8%
20.8%
21.4%
26.6%
30.1%
WHAT IS MEASURED?
This area measures communication performance on a core set of environmental, social and governance information, from policies and guidelines to data and objectives (e.g. code of ethics, approach to human resources, supply chain management, human rights policy and climate change strategy).
WHAT ARE COMPANIES DOING?
Since we eliminated companies that are not reporting or don’t cover basic information, this is the highest-scoring section out of the seven pillars. It shows that most of Europe’s biggest companies are increasingly transparent online or else reporting directly online (most of the information we looked for can be found in standard sustainability reporting). However, a third of these companies still lack a clear indication of targets. Environmental information has a better coverage than social and HR information, with around 10% not presenting environmental data compared to almost 30% not communicating on social performance.
18 pointsMaximum score
69.5%Average score
WHO IS DOING IT WELL
Bayer AG (18/18)BT Group (18)BBVA (17.5)
87% provide comprehensive information about responsible products or services
74% present hot topics of corporate sustainability
80% provide quantitative environmental performance data
41% do not provide information on assurance of their latest report on website
74% do not present quantitative or measurable sustainability targets
30% have one or more content penalties (out of date, incomplete, etc…)
GOOD BAD
Source: CSR Online Awards 2014 Questionnaire. Answers from non corporate respondents.

10CSR ONLINE AWARDS 2014 ·
PILLAR 2 - EXHAUSTIVE
WHAT DO USERS WANT?
An increasing proportion of CSR professionals are going online to drill down for detailed information, not to just get the broad outline. For example, they’re keen to hear what feedback a company is getting from stakeholders, how this feeds into the decision-making process and how materiality of key issues is determined.
It’s telling that users say they are most frustrated by a promotional, one-sided account of performance as well as superficiality and brevity. Rather, they value transparency and accountability.
0 1
2 3 4 5
No possibility to download data in Excel
Too many formats and channels (annual report, CR report, online, etc.)
GRI table with no “clickable” links to information
Superficiality or brevity of information online compared with reports
Difficulty in finding performance data (KPIs)
Company presents itself only in self-promotional way
3.04
3.22
3.43
3.47
3.84
4.03
What frustrates you most when consulting CSR information online
WHAT IS MEASURED?
This section of the research aims to measure the extent of disclosure, beyond the basic information (for example on stakeholder engagement and past target achievement).
It also considers the provision of details on sustainability governance and the implementation of the code of ethics.
WHAT ARE COMPANIES DOING?
Although companies are now better at covering basic information, many are guilty of stopping short when it comes to being truly transparent. The misguided, condescending idea that websites are primarily aimed at non-expert audiences often leads to brevity or superficiality. More than half of the companies we examined do not explain how sustainability priorities are defined (e.g. materiality process) and 59% do not present feedback received from stakeholders.
Few companies are accountable on how successful they have been in reaching past targets: only 30% make the effort to give a status on their progress. Less than half, moreover, offer any indication about the connection between their sustainability and corporate governance.
18 pointsMaximum score
40.8%Average score
WHO IS DOING IT WELL
Credit Suisse (14.5/18)Unilever (13.5)Nestlé (13)
62% provide information on suppliers’ compliance with social and environmental standards
80% state that they report greenhouse gases emissions according to the Carbon Disclosure Project (CDP)
68% provide information on their environmental certificates
55% do not explain how key topics are defined (materiality)
30% state their progress in reaching previous targets
59% neither publish nor describe feedback from stakeholders
GOOD BAD
Average score (1= least frustrating, 5= most frustrating)
Source: CSR Online Awards 2014 Questionnaire. Answers from non corporate respondents.

11CSR ONLINE AWARDS 2014 ·
PILLAR 3 - ONGOING
WHAT DO USERS WANT?
Users expect companies to keep them informed about significant ESG developments and make their voice heard on relevant topics. Waiting for the next report cycle makes information less relevant. Our survey respondents said they want companies to publish case studies, respond promptly to issues in the media or public debate, provide report updates and be active in social media.
When asked how they would like to receive updates, 45% answered they would appreciate news on corporate websites and almost 20% on a blog.
0 10 20 30 40 50 60 70 80 90 100
Online services (Corporate Register, 3BL Media, CSRWire, etc.)
Post on company blog
News on corporate website
By email
16.9%
18%
21.3%
23%
44.9%
45.5%
46.6%
How would you like to receive updates from companies?
WHAT IS MEASURED?
This section assesses the presence of tools and elements that keep stakeholders updated on a regular basis and allow them to comment and get feedback (for example news, blogs, email alert registration, etc.).
Contacts provided on the website for the CR team, both generic and personal were also taken into account and tested. The email test consists on sending a simple email with a question to listed contacts in order to see the response rate and the effectiveness of this channel for stakeholder engagement.
WHAT ARE COMPANIES DOING?
An encouraging number of companies post CSR news online but blogs are few and far between (only 13% of companies assessed). CSR teams also still seem reluctant to make themselves available for direct feedback and questions: 20% of the sample do not publish any CSR contact information and, of those that do, two thirds did not answer a basic email enquiry.In order to understand what’s going on, our test email asked for information about how incoming messages, requests and complaints were managed. The answers allowed us to provide a picture of some of the techniques adopted by the most effective companies manage stakeholder email (read more on www.lundquist.it/blog).
11 pointsMaximum score
34.9%Average score
WHO IS DOING IT WELL
Deutsche Post DHL (8.5/11)Eni (7.5)SABMiller (7)
64% have relevant CSR news
80% provide contacts in the CSR section
66% did not reply to an email test (or replied after two weeks)
29% offer the possibility to sign up for email alerts
13% have a blog or chat on sustainability
GOOD BAD
Source: CSR Online Awards 2014 Questionnaire. Answers from non corporate respondents.

12CSR ONLINE AWARDS 2014 ·
PILLAR 4 - USER FRIENDLY
WHAT DO USERS WANT?
Difficulty in finding what you need is cited as a major source of frustration. Faced with a multiplicity of approaches, formats and channels, users expect to find information quickly and orient themselves in the reporting system. Even professionals are interested in seeing infographics, charts and using interactive tools. In a field where communication is often muddied by marketing and encumbered by statistics, experts appreciate clarity in words, figures and images.
Our survey also showed a marked increase in the use of mobile devices when looking for sustainability information since 2012: 43% say they use such a tablet and 51% a smartphone at least weekly for sustainability information.
0
10 20 30 40 50 60 70 80 90 100
Once or twice a month
Every day or week
Use interactive data tools
Use an app
Watch video
Consult infographics
Use diagrams and charts
How o�en do you use the following for CR or sustainability issues?
43% 31%
35%39%
36%
32%
31%
31%
11%
34%
WHAT IS MEASURED?
Trust and reputation are at stake if essential information is hard to find, as this gives the impression of companies “hiding” critical information and lacking transparency.
The pillar assesses navigation and the legibility of thepages, search functionality and the use of charts anddiagrams. It also encompasses reporting formats.The system of penalties based on usability, alreadyintroduced in the last edition, takes away points forcompanies that present hard to find or hard to readinformation.
WHAT ARE COMPANIES DOING?
In many cases, the sheer volume of content on websites tends to compromise navigability. Companies are also slow to keep up with rapid developments in visual communications and mobile penetration and usually serve users poorly in terms of search functionality. To see how companies are reporting on sustainability, see our dedicated chapter.
20.5 pointsMaximum score
46.7%Average score
WHO IS DOING IT WELL
Eni (16/20.5)Deutsche Bank (14)BP (13.5)
93% provide useful results for CR-related terms in the internal search engine
64% make use of charts and diagrams in the CR section
86% of companies do not have interactive data
83% of companies had one or more user friendly-related penalty (i.e hard to find information, low quality graphs)
13% of website are in responsive design (adapting content automatically to different screen sizes)
GOOD BAD
Source: CSR Online Awards 2014 Questionnaire. Answers from non corporate respondents.

13CSR ONLINE AWARDS 2014 ·
PILLAR 5 - SOCIAL
WHAT DO USERS WANT?
The proportion of survey respondents using social media is over 94% and, of these, three out of four say their use of social media is in some way connected to work. LinkedIn and Facebook are the most used channels in relation to CSR topics, followed by Twitter and YouTube. More than one third use LinkedIn to be in contact with companies on social or environmental issues (1 in 5 for Twitter or Facebook).
Over half of social media users say they are likely or very likely to follow or connect with companies or their sustainability managers, highlighting the desire to engage on a personal level. This is in line with NGOs and surpasses the likelihood of engaging with government bodies or international organisations.
Social media are a way to stay in contact with people that share similar interests or to follow thought leaders and keep up on trends.
0
10 20 30 40 50 60 70 80 90 100
Government body / agency
International inst. (e.g. U.N. body)
Sustainability manager
Media outlet covering CSR
Company
NGO
Experts in CR / sustainability 77%
60%
60%
57%
56%
54%
45%
How likely are you to follow or engage with the following actors on social media?
WHAT IS MEASURED?
How are social media used to listen, inform and engage on CSR issues? We checked all accounts listed on each corporate website - both generic corporate accounts as well as those explicitly dedicated to CSR.
Several criteria were considered: frequency of posts, use of different types of content (video, pictures), number of followers/likes/subscribers, engagement levels (i.e. responding to comments). Penalties were incurred, for example, for non-English language content, private videos on YouTube, disabled comments and insufficient or out-of-date information.
WHAT ARE COMPANIES DOING?
The research evaluated 380 social media accounts, including* Facebook, Twitter, YouTube and LinkedIn, but also minor chan-nels such as Google+, Pinterest, Flickr. The most promoted channel on websites was Twitter with 87% of companies linking to an account. Conversely 43% of companies do not promote their LinkedIn account. YouTube was the channel with the most effective CSR communication, with 80% of accounts covering CSR topics to some degree, closely followed by Facebook (79%).*According to the information on the corporate website
12 pointsMaximum score
39.6%Average score
WHO IS DOING IT WELL
Deutsche Post DHL (12/12)BASF (12)Ericsson (12)Nestlé (12)Novo-Nordisk (12)
84% of companies use social media to address CSR issues
75% listed a YouTube account on their corporate website
32% of YouTube accounts incurred penalty points (private videos, disabled comments)
33% of LinkedIn accounts didn’t obtain any score at all
GOOD BAD
Source: CSR Online Awards 2014 Survey (% of non-corporate respondents saying “likely“ or “very likely“)

14CSR ONLINE AWARDS 2014 ·
PILLAR 6 - INTEGRATION
WHAT DO USERS WANT?
The sustainability area of a website usually gets little traffic compared with sections devoted to careers, investor relations or the company presentation. It’s therefore critical to take the sustainability message to where stakeholders already are.
This has the advantage of showing them how sustainability is integrated into the business and the impact it has on different stakeholders. Respondents in our 2012 survey identified consumers, investors and employees as key drivers of the sustainability agenda.
The Lundquist Employer Branding Online Awards also found jobseekers keenly interested in understanding a prospective employer’s environmental and social commitment.
0
10 20 30 40 50 60 70 80 90 100
Governments
Employees
Regulation
Investors
Public concerns over environmental issues
Business considerations (e.g. cost cuttings, competitiveness)
Consumers 47%
38%
31%
26%
24%
14%
14%
What are the most important factors driving companies to focus on sustainability?
WHAT IS MEASURED?
This pillar evaluates whether CSR messages are effectively embedded across the corporate website, with a close eye on use of non-textual content. In addition to the homepage, the main sections assessed were those dedicated to the company presentation, investors, media, jobseekers, and product/innovation. Where other sections were present (e.g. suppliers), they were also taken into account and evaluated.
We looked for any relevant CSR elements to be presented such as code of conduct, business strategy, diversity and human resources management, sustainability information for investors and presentation of sustainability report.
WHAT ARE COMPANIES DOING?
Integration is relatively weak: only 14% of companies reached over half of the possible score. While this reflects the general lack of presence of CSR messages within the corporate website and the prevalence of communication in silos, some sections address CSR issues more than others. The “About us” section tends to be best while the least integrated area is the one dedicated to product/innovation.
8 pointsMaximum score
33.6%Average score
WHO IS DOING IT WELL
Unilever (7.25/8)Volvo (7)BASF (6.75)
89% of companies partially integrateCSR content in the “About Us” section
9% of companies systematically integrate CSR content in the career sections
8% of companies systematically integrate CSR content in the investors sections
4% of companies systematically integrate CSR content in the media/press sections
GOOD BAD
Source: CSR Online Awards 2014 Questionnaire. Answers from non corporate respondents.
15CSR ONLINE AWARDS 2014 ·
PILLAR 7 - DISTINCTIVENESS
WHAT DO USERS WANT?
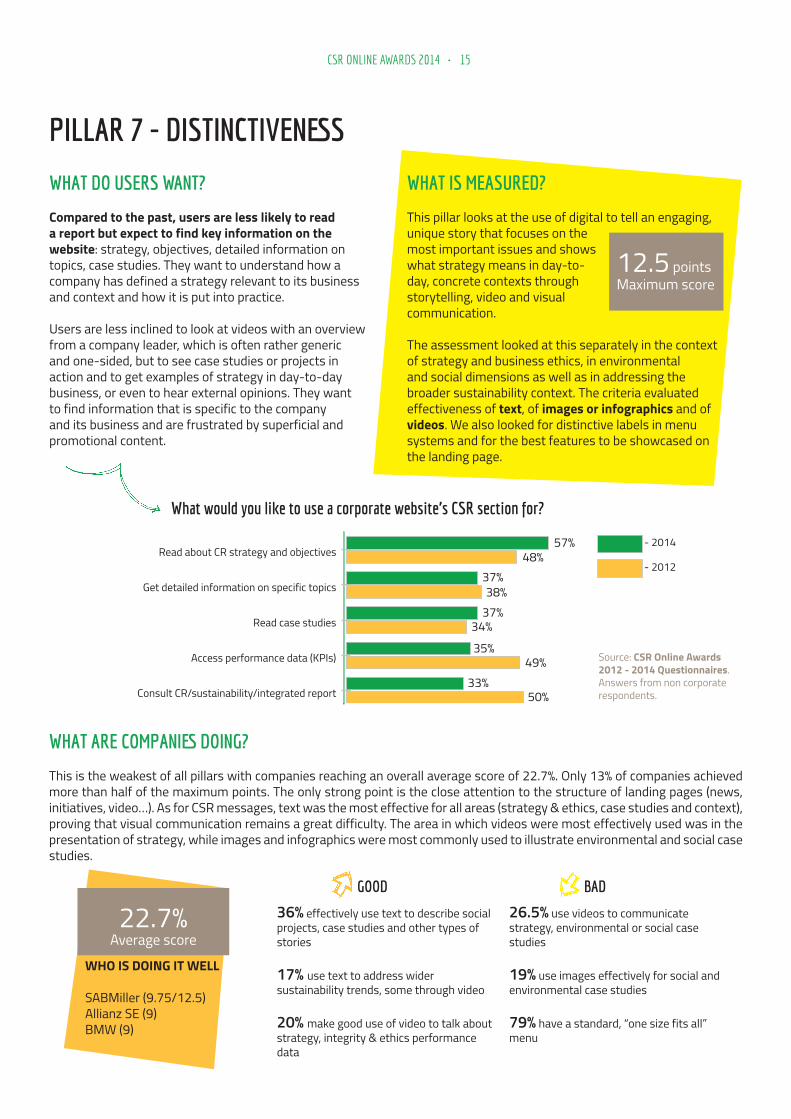
Compared to the past, users are less likely to read a report but expect to find key information on the website: strategy, objectives, detailed information on topics, case studies. They want to understand how a company has defined a strategy relevant to its business and context and how it is put into practice.
Users are less inclined to look at videos with an overview from a company leader, which is often rather generic and one-sided, but to see case studies or projects in action and to get examples of strategy in day-to-day business, or even to hear external opinions. They want to find information that is specific to the company and its business and are frustrated by superficial and promotional content.
0
10 20 30 40 50 60 70 80 90 100
- 2012
- 2014
Consult CR/sustainability/integrated report
Access performance data (KPIs)
Read case studies
Get detailed information on specific topics
Read about CR strategy and objectives
What would you like to use a corporate website’s CSR section for?
50%33%
49%35%
34%37%38%
37%48%
57%
WHAT IS MEASURED?
This pillar looks at the use of digital to tell an engaging, unique story that focuses on the most important issues and shows what strategy means in day-to-day, concrete contexts through storytelling, video and visual communication.
The assessment looked at this separately in the context of strategy and business ethics, in environmental and social dimensions as well as in addressing the broader sustainability context. The criteria evaluated effectiveness of text, of images or infographics and of videos. We also looked for distinctive labels in menu systems and for the best features to be showcased on the landing page.
WHAT ARE COMPANIES DOING?
This is the weakest of all pillars with companies reaching an overall average score of 22.7%. Only 13% of companies achieved more than half of the maximum points. The only strong point is the close attention to the structure of landing pages (news, initiatives, video…). As for CSR messages, text was the most effective for all areas (strategy & ethics, case studies and context), proving that visual communication remains a great difficulty. The area in which videos were most effectively used was in the presentation of strategy, while images and infographics were most commonly used to illustrate environmental and social case studies.
12.5 pointsMaximum score
22.7%Average score
WHO IS DOING IT WELL
SABMiller (9.75/12.5)Allianz SE (9)BMW (9)
36% effectively use text to describe social projects, case studies and other types of stories
17% use text to address wider sustainability trends, some through video
20% make good use of video to talk about strategy, integrity & ethics performance data
26.5% use videos to communicate strategy, environmental or social case studies
19% use images effectively for social and environmental case studies
79% have a standard, “one size fits all” menu
GOOD BAD
Source: CSR Online Awards 2012 - 2014 Questionnaires. Answers from non corporate respondents.

16CSR ONLINE AWARDS 2014 ·
FOCUS ON REPORTING: CHANGING ROLE AND NEW FORMATS
TOWARDS FRAGMENTED REPORTING
Now that non-financial reporting is virtually standard for the largest companies, it is ceasing to be a presented as a unitary body of information. Fewer of Europe’s top companies find it sufficient to package environmental, social and governance information into a once-a-year, book-like report to be printed or presented online as a plain PDF.
An increasing number of companies (23% of the 76 companies analysed) are not publishing a stand-alone document as their main sustainability reporting channel but integrate non-financial information into the annual report. But this also makes it harder to draw a neat line between financial and non-financial disclosure as it spills between annual report, supplementary documents and online disclosure. In fact, half of the companies with an integrated report complement it with some kind of additional sustainability-focused reporting. Many use the website to present detailed information, a practice known as web-based reporting.
“In some cases, it’s hard to tell what the main point of reference should be for people wanting to get a clear overview of a company’s sustainability efforts. This means report readers risk getting only part of the picture or out-dated information.
The best companies offer a clear explanation of their reporting approach and guide users to detailed information by theme.”
Marcella Semenza, CSR Consultant, Lundquist
THE EMERGENCE OF HYBRID REPORTING
The number of companies reporting online in a standalone document is dropping: while about a fifth continue with web-based reporting, fewer invest in an online mini-site of the sustainability report. This is in part due to the fragmentation and shift to integrated reporting noted above. But it is also because online reports are separate, off-shoots of the corporate website; after a peak of traffic at publication, readers have little reason to come back for the updates, news and engagement they want.
In this context, it is worth noticing the emergence of hybrid reports, which do not simply replicate the entire content of a report in HTML but add a communication level online for corporate stories that normally do not have a natural place in reports. In hybrid reports, the PDF covers performance and technical details and is addressed to experts, while stories about the company are presented through interactive features, images and videos. Although this practice is more common for annual reporting, there were interesting examples for Deutsche Bank (CSR hybrid) and Astra Zeneca (hybrid integrated report).
Reporting formats
0
20
40
60
80
100
Only PDF
Online report
Hybrid report
Web-basedStandalone report
Integrated report 23% 77%
40%
33%
3%
24%Source: CSR Online Awards 2014

17CSR ONLINE AWARDS 2014 ·
THE CHANGING ROLE OF THE CR SECTION: STAKEHOLDERS ARE NO LONGER LOOKING FOR THE REPORT
Results of the CSR Online Awards 2014 Survey indicate that the importance of finding the latest CSR report has consistently declined over the years to give rise to new requirements.
The chart comparing answers from stakeholders (non-corporate) and people working inside companies (corporate), highlights that corporate people tend to overestimate the importance of the report. Users want to be updated more than once a year, and they are going online to find updated and more engaging content.
This shift towards a combination of PDF and online formats is confirmed by the responses to our questionnaire. Compared to 2012, the number of users satisfied with the PDF has decreased significantly (down from 34.5% to 20%), whereas the number of users preferring a combination of both formats has increased (up from 31% to 43%). These results also confirm the increasingly important role of the CSR section of the website.
0 20 4060 80 100
Non corporate
Corporate
2014 -
2012 -
2011 -
2010 -
2009 - 93%84%
72%61%
60%49%51%
50%44%
33%
Proportion stating that consulting a report is among their top priorities when visiting a company website’s CSR section
Both PDF and online
Printed copy
No particular preference
Whichever is more complete
Interactive version
43%
14.5%
20.9%
7%9.9%
4.7%
In which format do you prefer reading the CSR report?
Source: CSR Online Awards 2014 Questionnaire.
Source: CSR Online Awards Questionnaires 2009 - 2014

18CSR ONLINE AWARDS 2014 ·
WINNERS 6th CSR ONLINE AWARDS EUROPE 100
After taking 2nd place back in 2011, Deutsche Post took the honours with 73 points and was also the best improver (+15.25 points).
Not only does the German company present policies, data and objectives in detail, it also broaches CR topics in a wide range of social media channels and maintains a steady flow of news, blog posts and updates from the logistics sector. Another winning feature was the presence of numerous videos effectively showcasing its CR activities.
Nestlé climbed into the 2nd position, with 67.75 points, from 6th in 2012. The company successfully engages stakeholders about its Creating Shared Value programme through different social media channels.
The group’s Facebook page, followed by over 6 million users, offers frequent posts on topics such as nutrition and provides tabs with best practices, integrated access to other social media and a discussion board.
Unilever retained its 3rd position in the ranking with 66.25 points. The Sustainable Living section offers a high-quality user experience presenting interactive data, detailed targets and feedback from internal and external stakeholders.
Unilever also effectively integrates sustainability topics across its corporate website, featuring news on the company’s social activities right from the homepage.
DEUTSCHE POST DHL
NESTLÉ
UNILEVER

19CSR ONLINE AWARDS 2014 ·
TOP PERFORMERS IN ONLINE CSR COMMUNICATIONS: EUROPE 100
BAYER AND BT GROUP (JOINT)Both with a full score, Germany’s Bayer and BT Group of the UK are the joint top in the Concrete pillar as they both thoroughly present core sustainability information. By fully integrating the sustainability report into its Better Future section, BT presents a wealth of details; Bayer has a concise but fact-focused overview of its strategy, policies, performance and targets.
Concrete
CREDIT SUISSECredit Suisse leads the ranking of the Exhaustive pillar with its extensive disclosure beyond basic information. The Swiss bank details its progress against previous targets, explains its policy for diversity and inclusion and provides ample perspectives from internal and external stakeholders.
Exhaustive
DEUTSCHE POST DHLDeutsche Post DHL comes top of the Ongoing pillar by engaging stakeholders on a regular basis and showing a responsiveness to user feedback and comment. The Delivering Tomorrow blog is one of the tools used to trigger discussion on topics such as economy, technology and the environment.
Ongoing
ENIEni offers an intuitive and immediate user experience with a classical navigational system, making it the top performer for the User friendly pillar. Its sustainability reporting system blends a range of documents, formats as well as interactive data while the user is aided by good search functionality.
User friendly
DEUTSCHE POST DHLDeutsche Post DHL, top in the Social pillar, has multiple accounts in most platforms. It uses a variety of formats to present information and ensures that its initiatives are well integrated with one another as well as into its website. The company has dedicated CR initiatives such as its Living Responsibility page on Facebook but also covers CR topics in its generic accounts too.
Social
UNILEVERUnilever raises the bar for the Integrated pillar by consistently presenting sustainability-related information throughout the corporate website. Relevant topics are included when talking about careers or innovation and sustainability underpins much of the “About us” section covering, for example, responsible business, working with integrity, nutrition and social initiatives.
Integrated
SABMILLERSABMiller ranks highest in the Distinctive pillar as it succeeds in guiding the user along an engaging journey through its ten sustainability priorities. For each one, SABMiller has a complete approach presenting background details, the company’s response, performance, stakeholder views. The circle is closed with case studies, videos and photos.
Distinctive
20CSR ONLINE AWARDS 2014 ·
COUNTRY FOCUS: ITALY
0102030405060708090
100
Finalists
Below the basics
Not reporting
EuropeItaly
35
32
30
76
212
Breakdown by cut-off points
0102030405060708090
100
Italian average
European average
TotalDistinctiveness
IntegrationSocial
User friendly Ongoing
ExhaustiveConcrete
70%63%
41%40%
35%40%
44%
15%21%
14%
37%40%34%
23%
44%47%
Performance by pillar Europe vs. Italy
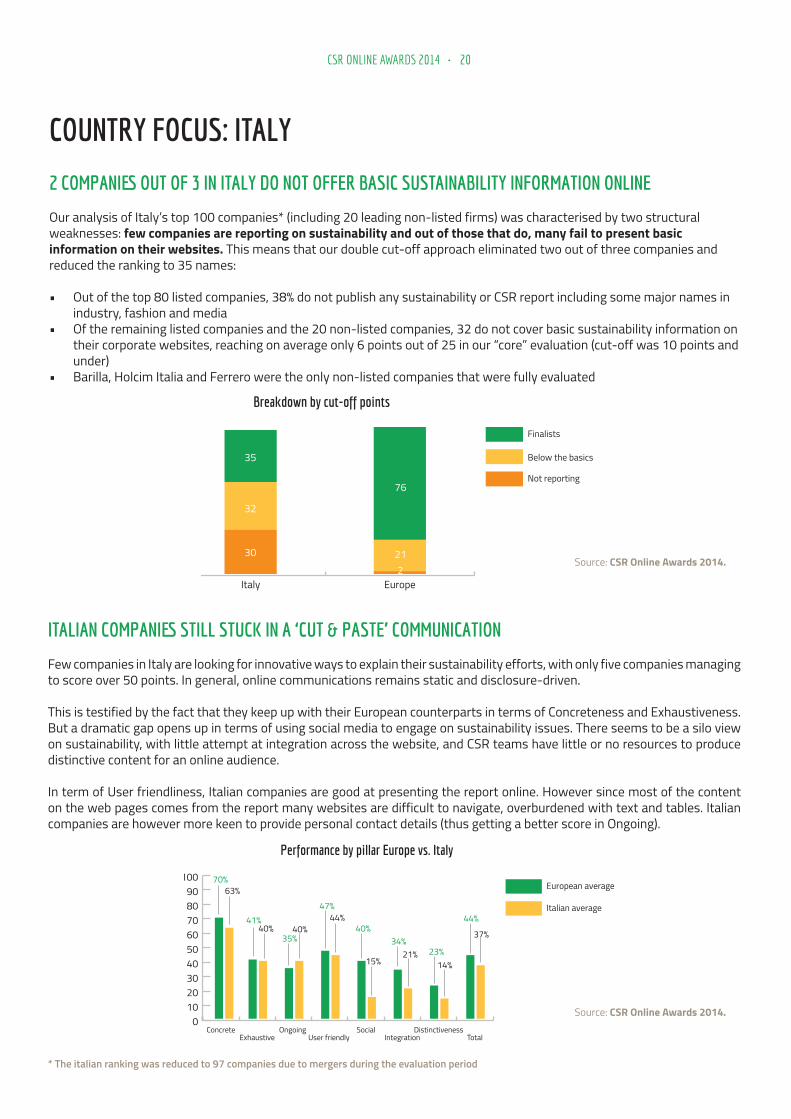
2 COMPANIES OUT OF 3 IN ITALY DO NOT OFFER BASIC SUSTAINABILITY INFORMATION ONLINE
Our analysis of Italy’s top 100 companies* (including 20 leading non-listed firms) was characterised by two structural weaknesses: few companies are reporting on sustainability and out of those that do, many fail to present basic information on their websites. This means that our double cut-off approach eliminated two out of three companies and reduced the ranking to 35 names:
• Out of the top 80 listed companies, 38% do not publish any sustainability or CSR report including some major names in industry, fashion and media
• Of the remaining listed companies and the 20 non-listed companies, 32 do not cover basic sustainability information on their corporate websites, reaching on average only 6 points out of 25 in our “core” evaluation (cut-off was 10 points and under)
• Barilla, Holcim Italia and Ferrero were the only non-listed companies that were fully evaluated
ITALIAN COMPANIES STILL STUCK IN A ‘CUT & PASTE’ COMMUNICATION
Few companies in Italy are looking for innovative ways to explain their sustainability efforts, with only five companies managing to score over 50 points. In general, online communications remains static and disclosure-driven.
This is testified by the fact that they keep up with their European counterparts in terms of Concreteness and Exhaustiveness. But a dramatic gap opens up in terms of using social media to engage on sustainability issues. There seems to be a silo view on sustainability, with little attempt at integration across the website, and CSR teams have little or no resources to produce distinctive content for an online audience.
In term of User friendliness, Italian companies are good at presenting the report online. However since most of the content on the web pages comes from the report many websites are difficult to navigate, overburdened with text and tables. Italian companies are however more keen to provide personal contact details (thus getting a better score in Ongoing).
* The italian ranking was reduced to 97 companies due to mergers during the evaluation period
Source: CSR Online Awards 2014.
Source: CSR Online Awards 2014.

21CSR ONLINE AWARDS 2014 ·
WINNERS 6th CSR ONLINE AWARDS ITALY 100
TELECOM ITALIA
HERA GROUP
SNAM
AUTOSTRADE PER L’ITALIA BEST IMPROVER
Telecom Italia came top of the Italian ranking with 65.5 points, returning to the top after slipping into second in 2012. The Italian phone company performs high in terms of detailed disclosure and, similarly to last year, it proves its strength in engaging stakeholders through social media, games, the avoicomunicare blog and Respect, a new app that promotes environmentally sustainable consumer behaviour.
Hera slips into 2nd position but remains on the Italian podium with 62.75 points. Hera’s newly released website is loaded with relevant, detailed content, which is supported by a number of user-friendly tools such as the VedoHera newsletter providing updated information on CSR activities. Sustainability is also well integrated in the overall corporate website, especially in the Services section.
Autostrade per l’Italia gained 22 positions compared to the 2012 ranking 20th with 30.5 points. The motorway operator has made a concerted effort to provide exhaustive details about its sustainability including environmental impact and risks, supply-chain standards, governance, certifications and whistle-blowing procedures.
Snam jumps up from 6th to take third place with 61 points. The gas company offers a high-quality and user-friendly navigation that supports the stakeholder in exploring the exhaustive information provided key sustainability topics. Particularly successful is the presentation of Stories from the Regions showcasing environmental and social projects with the support of illustrative photos and videos.

22CSR ONLINE AWARDS 2014 ·
APPROACH & METHODOLOGYThe CSR Online Awards research seeks to evaluate how companies use their corporate website and related digital properties to communicate corporate responsibility and sustainability information and to engage with stakeholders. Each company was evaluated based on a series of parameters giving a maximum score of 100. The evaluations were carried out by a group of Lundquist analysts between December 2013 and March 2014 with different specialists assessing different aspects (content, reporting, social media, user experience, etc.).
As in each edition of the study, the evaluation model was based on a user survey distributed to CR experts, sustainability professionals and stakeholders as well as to CR/sustainability managers of the evaluated companies. The survey, released in October 2013, was distributed both directly to targeted individuals and through social media channels. It received 350 responses, taking the total number to over 1,600 since the research was launched in 2007. This input was used to reformulate our approach in three ways.
1. NEW EVALUATION PROTOCOL ORGANISED AROUND SEVEN PILLARS Breaking with the previous structure of the protocol (divided into three areas: content, user experience and ongoing engagement), the assessment was organised around the seven “pillars”: Concrete, Exhaustive, User friendly, Ongoing, Social, Integrated and Distinctive. This was done in order to have a more flexible evaluation and give greater importance to areas such as user experience, engaging content and social media.
2. REVISION OF EVALUATION CRITERIA Many of the 68 criteria from the 2012 edition of the research were retained but reorganised based on the seven pillars approach. The review of the criteria focused on enhancing selected areas of digital communications and to keep pace with latest trends. Furthermore the system of “penalty” points, introduced in 2012, was retained and applied in five pillars. Three of the seven pillars, however, represent new methodology with a greater flexibility given to consider different company approaches rather than having a prescriptive, criteria-based approach:• The evaluation of social media accounts was totally renewed to
look at both CSR-focused accounts and general, corporate accounts, evaluating how effectively CSR or sustainability topics were communicated through all accounts presented on the company website (even considering multiple accounts on each social network)
• Integration of CSR/sustainability themes into the broader corporate communications by looking at content in the rest of the website and not just how sustainability information is linked to other topics
• Storytelling through digital channels – much of the “distinctiveness” pillar was developed from scratch to evaluate how companies use text, image, infographics and video to “bring to life” their sustainability strategy, sustainability context, environmental performance and social commitment, going beyond static report content.
350 answers from CR professionals
Definition of a more qualitative e v a l u a t i o n protocol based on 7 pillars
Selection of 100largest European c o m p a n i e s ; excluding the 2not reporting on CR
Exclusion of 21c o m p a n i e s not presenting “core” contents online
Evaluation of 76c o m p a n i e s based on 7 pillars
Analysis of the data and p r e s e n t a t i o n of results in an European event
CSR ONLINE AWARDS
QUESTIONNAIRE
DEFINITIONOF
PROTOCOL
SELECTION OF
COMPANIES
“CORE”EVALUATION
“FULL”EVALUATION
RESULTS PRESENTATION

23CSR ONLINE AWARDS 2014 ·
The evaluation of reporting formats was also revised as some companies no longer report non-financial performance in a stand-alone document but in a variety of places and formats (integrated into the annual report, full or summary stand-alone report, online disclosure, etc.). Two different scoring systems were established based on whether companies reported on a “standalone” report basis or an “integrated” basis within the annual report.
3. COMPANY SELECTION THROUGH A DOUBLE CUT-OFF
The research initially focused on the top 100 listed companies in Europe (components of the FTSE Eurotop 100 Index) and the top 100 companies in Italy (the largest 80 listed companies by market value plus 20 leading non-listed companies that report on CR/sustainability). Forthcoming are rankings for Switzerland, Germany and the Nordic Region.Some companies were excluded from the full evaluation through two cut-off points:
• Companies that did not report in a structured way on environmental and social impacts (whether in a standalone CSR or sustainability report or integrated into the annual report) were excluded from the entire ranking process
• Companies failing to publish a minimum amount of information online were subsequently excluded: an initial “core” evaluation was conducted for all companies that included mostly criteria from the “Concrete” pillar to make sure they answer stakeholders’ basic needs for information about strategy, policies, performance and targets plus some news and contact information. The cut-off point was set at 40% of the maximum score for this “core” assessment (10 points out of a maximum of 25).
This double selection process allowed the research to focus on assessing companies that had content to communicate and to examine how they use digital channels to do so.
Assessments
The corporate website was the main focus of the research unless the CSR/sustainability section was explicitly indicated and linked as an external site. Within the website, the sustainability section (or sub-section) was the focus of the assessment. External websites were explicitly taken into account for the “Integration” pillar. Within other pillars, external sections or pages from the main sustainability section (external websites, online reports, etc.) were only assessed if there was a direct link to the information sought. Social media channels assessed were only those that were indicated on the corporate website.
A system of “penalty” points, introduced in 2012, was retained and applied in five pillars. Rather than simply counting all the “positive” aspects of a company’s online communications, score was taken away for negative elements (-0.5 for each penalty). These could be incurred for a variety of reasons:
• Problems of information architecture and menu structure that made information hard to find or located in an illogical or inappropriate place
• Out-dated or obsolete information• Problems of usability in consulting the website content or its functions, including legibility of images, charts and
diagrams, broken links, etc.• “Etiquette” errors in social media accounts (for example disabled comments, private videos, no company information,
non-English content).
23 COMPANIES EXCLUDED FOR NOT DISCLOSING BASIC INFORMATION
• We considered the provision of “core” information online such as performance data, targets, code of ethics and policies on human resources, supply chain and human rights, climate change strategy plus guidelines and frameworks followed, news and contact information.
• The average score of the excluded companies was 7.4 points out of 25, whereas 10 was the minimum score for having a full evaluation.

24CSR ONLINE AWARDS 2014 ·
POSITION 2014 POSITION 2012 DELTA COMPANY NAME COUNTRY SCORE (max 100)1 n.a. n.a. Deutsche Post DHL DE 732 6= Nestlé CH 67.753 3 Unilever GB/NL 66.254 10 Credit Suisse CH 625 n.a. n.a. BT Group GB 61.56 17= BASF DE 617 8 BBVA ES 608 4 Eni IT 59.59 5 SABMiller GB 59.2510 9 Allianz DE 58.2511 16 Bayer DE 56.2512 24 Siemens DE 5413 32 BP GB 53.514 1 Centrica GB 5215= 43 BG Group GB 51.2515= 15 Royal Dutch Shell GB/NL 51.2517= 53= British American Tobacco GB 50.2517= 20 Deutsche Bank DE 50.2517= 11 Enel IT 50.2520= 39 Anglo American GB 49.7520= 17= UBS CH 49.7522 25= Roche CH 49.523= 23 Imperial Tobacco Group GB 4923= 45= Tesco GB 4925 37= Novartis CH 48.526 21= Ericsson SE 4827 17= Royal Bank of Scotland GB 47.7528 55 BMW DE 47.529 13 Intesa Sanpaolo IT 47.2530 35 Novo-Nordisk DK 46.531= 12 E.ON DE 45.7531= 25= Telefonica ES 45.7533= 13 Henkel DE 4533= 29= Munich Re DE 4535 73 Vivendi FR 43.2536= 60= Philips NL 4336= 6= UniCredit IT 4338 13= Assicurazioni Generali IT 42.7539= 75 GDF SUEZ FR 4239= 42 Iberdrola ES 4239= 33= National Grid GB 4242 48 Total FR 40.543 78 Reckitt Benckiser GB 4044 36 Atlas Copco SE 39.7545 85 Orange** FR 39.25
6th CSR Online Awards: Europe 100

25CSR ONLINE AWARDS 2014 ·
POSITION 2014 POSITION 2012 DELTA COMPANY NAME COUNTRY SCORE (max 100)46= 66 L'Oréal FR 3946= 14 Repsol ES 3948= 82= GlaxoSmithKline GB 38.548= 49 Telenor NO 38.550= 40= Société Générale FR 3850= 59 Syngenta CH 3852 81 Heineken NL 37.7553 45= Hennes & Mauritz SE 37.554 62 AXA FR 36.7555 44 AstraZeneca GB 36.556 63= ING Group NL 36.2557 70 Linde DE 3658 57= Barclays GB 35.7559 47 Volvo SE 35.560 68= Sanofi FR 33.7561 67 ABB CH 33.562= n.a. n.a. ASML Holding NL 3362= 53= Standard Chartered GB 3364= 76 Nordea Bank SE 32.7564= 51 Richemont CH 32.7566 n.a. n.a. Rolls-Royce GB 32.2567= 71= Deutsche Telekom DE 31.7567= 71= Statoil NO 31.7569 60= TeliaSonera SE 30.7570 74 Electricité de France FR 30.2571 68= BNP Paribas FR 3072 77 Banco Santander ES 29.573 94 Zurich Insurance Group CH 2874= 40 Daimler DE 25.574= 89= Diageo GB 25.576 87 Vinci FR 22.75
BELOW THE BASICSCOMPANIES FAILING TO PASS BEYOND “CORE” EVALUATION (MIN. 10 POINTS REQUIRED)
COMPANY NAME COUNTRY CORE SCORE (max 25)
Rio Tinto GB 9.5Air Liquide FR 9.5Schneider Electric FR 9Inditex ES 9A P Moller-Maersk DK 9Volkswagen DE 8.5Pernod Ricard FR 8Swiss Re CH 8HSBC GB 8SAP DE 8Prudential GB 7
COMPANY NAME COUNTRY CORE SCORE (max 25)
Tenaris IT 7Airbus FR 7Vodafone Group GB 6.5Lloyds Banking Group GB 6.5Danone FR 6.5Anheuser-Busch InBev BE 6.5LVMH FR 6Glencore Xstrata GB 5.5BHP Billiton GB 3Swatch Group CH 2.5
Companies not reporting on CSR/sustainability and excluded from the “core” evaluation: Christian Dior, Hermes International.
** 2012 position for Orange refers to France Telecom

26CSR ONLINE AWARDS 2014 ·
POSITION 2014 POSITION 2012 DELTA COMPANY NAME SCORE (max 100)1 2 Telecom Italia 65.52 1 Gruppo Hera 62.753 6 Snam 614 3 Eni* 59.55 9 Enel* 50.256 4 Fiat 48.57= 7= CNH Industrial 487= 10 Edison 489 11 Intesa Sanpaolo* 47.2510 7= Terna 46.511= 12 Pirelli 4311= 5 UniCredit* 4313 13= Assicurazioni Generali* 42.7514 15 ERG 40.515 17 Mondadori 4016 13= Banca MPS 37.517 16 UBI Banca 3618 18 Autogrill 35.7519 21= Barilla 34.520 42 Autostrade per l’Italia 30.521 n.a. n.a. SEA 30.2522 28 STMicroelectronics 29.7523= 23 Ansaldo STS 28.7523= 26= Iren 28.7525 21= Piaggio 2826= 24 A2A 27.526= n.a. n.a. Holcim Italia 27.528 25 Finmeccanica 27.2529 20 Saipem 2730 28 Acea 22.7531 33 Indesit 22.532 34 Banca Popolare di Milano 2233 26= Ferrero 20.2534 45= Buzzi Unicem 18.2535 n.a. n.a. Banca Pop. dell’Emilia 17.5
6th CSR Online Awards: Italy 100
*Companies also included in the Europe 100 ranking

27CSR ONLINE AWARDS 2014 ·
COMPANY NAME CORESCORE (max 25)Credito Valtellinese 9.5Italcementi 9.5Ferrovie dello Stato 9Birra Peroni 9Vodafone Italia 8.5Gestore Servizi Energetici 8Sofidel 8Prysmian 7.5Sorgenia 7.5Wind Telecomunicazioni 7.5Tenaris 7Nestlé Italia 7Industria Macchine Automatiche 6.5Saras 6.5BNL 6.5Poste Italiane 6.5
COMPANY NAME CORE SCORE (max 25)UnipolSai 6Ikea Italia 6Reale Mutua 6Enel Green Power 5.5Gtech 5.5Mediolanum 5Salini-Impregilo 5Atlantia 4.5Cattolica Assicurazioni 4.5Poltrona Frau 4Banca Carige 3.5Safilo Group 3Illy Caffè 3Yoox 2.5Banca Generali 2Banco Popolare 2
COMPANY NAMEAmplifonAstaldiAstmAzimutBeni StabiliBanca Popolare di SondrioBremboBrunello CucinelliCredito EmilianoDanieli & C
COMPANY NAMEDavide Campari-MilanoDe'LonghiDiasorinEI TowersInterpumpLuxottica GroupMaire TecnimontMediasetMediobancaMoncler
COMPANY NAMEParmalatPradaRCS MediagroupRecordatiSalvatore FerragamoSaveSiasSorinTod'sWorld Duty Free
COMPANIES NOT REPORTING ON CSR/SUSTAINABILITY (AND EXCLUDED FROM THE “CORE” EVALUATION)
Full disclosureLundquist has provided CSR services or reports in the past two years to the following companies included in the research: Assicurazioni Generali, Banca Carige, Banca Generali, Credit Suisse, Deutsche Post DHL, Edison, Eni, ERG, Fiat, Gruppo Hera, Mondadori, Sorgenia, Snam, Telecom Italia, Terna, UniCredit.
BELOW THE BASICSCOMPANIES FAILING TO PASS BEYOND “CORE” EVALUATION (MIN. 10 POINTS REQUIRED)

28CSR ONLINE AWARDS 2014 ·
WHO WE ARE
Lundquist is a strategic consultancy specialised in online corporate communications. We combine expertise in effective online communications and social media with intimate knowledge of the corporate domain.
What makes us unique is the ability to exploit digital channels to tell a convincing corporate story to key stakeholders as well as the wider world, without forgetting the essential “disclosure” function of a corporate website.
OUR ROLE
Our task is to develop digital communications strategies and user experiences that allow companies to build lasting, productive relationships with their corporate audiences. Lundquist is an authoritative partner for planning and managing digital projects, from assessing the online properties and corporate ecosystem to defining strategies for best practice websites.
Our clients include more than 70 of the largest traded companies in Europe.
Visit our website to keep up with our research series, events and in-depth analysis on online corporate communications topics: www.lundquist.it
THOUGHT LEADERSHIP
Lundquist undertakes different research programmes dedicated to online corporate communications:
CSR Online Awards investigates how European companies use their websites to communicate sustainability and their CSR strategies.
Employer Branding Online Awards is the first European research assessing how companies communicate their identity and appeal to prospective and current employees.
Social Media Awards is a multi-platform research project tracking the evolution of corporate social media activity, including vertical analyses investigating specific social media channels.
We are partners of KWD Webranking for the Italian, Swiss and Austrian markets. KWD Webranking is Europe’s most influential study into online financial and institutional communication, which has tracked leading European companies (1,000+ a year) for over 15 years.
CSR ONLINE AWARDS ASSESSMENT
The CSR Online Awards Assessment analyses your performance in our 7 pillars of online CR communications measured against best practice. We judge effective communications based on quantitative criteria comparing it with top performers in the research and international best-in-class.
We will have a complete look at your CR “ecosystem” to evaluate its effectiveness: how does the information provided by your company – whether online or in your report – add up to a coherent whole from a user perspective?
The assessment is a starting point to discuss together next steps that we can present in a detailed action plan.
HOW WE CAN ENHANCE YOUR CSR COMMUNICATIONS
Lundquist’s approach to corporate responsibility has been developed through the CSR Online Awards and is aligned with our user-centred, digital-first vision of corporate communications. We support companies in improving the effectiveness of their online CSR communications and developing new strategies for online content, engagement and storytelling:
• CSR communications strategy and definition of key messages
• Analysis of trends in CSR communications and tailored benchmarking
• Discover how to break out of the “reporting” mentality and embrace the opportunities for communication and engagement offered by the web: how to balance repor-ting with online channels
• Understand how to create engagement with your sta-keholders, with a focus on social media
• Revise CSR reports from a communications perspective vs. a disclosure approach
• Development of textual, visual and video storytelling
To order your tailored assessment or to develop a comprehensive project to develop your online communications you can contact:
James OsborneHead of sustainability consultancy and Lundquist partner+39 02 36 75 [email protected]
Joakim LundquistCEO and founding [email protected]
lundquist.