white paper cmx analytics - blue karma security · white paper cmx analytics march 2015 this...
TRANSCRIPT

White Paper
CMX Analytics
MARCH 2015
This document discusses the architecture behind Cisco Meraki’s CMX technology. The Meraki Dashboard provides real-time information on WiFi clients and intuitive reports on presence that retail and enterprise customers can use to understand foot traffic behavior across their sites.

Copyright
© 2015 Cisco Systems, Inc. All rights reserved
Trademarks
Meraki® is a registered trademark of Cisco Systems, Inc.
Table of Contents 1 Introduction 3
2 Location Analytics 4
3 CMX API 10
4 Location and Privacy 15
5 Conclusion 17
Cisco Systems, Inc. | 500 Terry A Francois Blvd, San Francisco, CA 94158 | (415) 432-1000 | [email protected]

1 Introduction Introduction to CMX and Location Analytics
With an increasing number of intelligent analytics features now available in enterprise-grade WiFi networking equipment, organizations can leverage new and existing data to better understand foot traffic patterns and behavior. This location information can be used to engage users and optimize marketing strategies. For retail, this can help combat trends such as erosion of in-store sales due to online retailers, who for years have had access to similar data via the analytics produced by online tools (e.g., click-through conversion rates from online advertising).
Smartphones with WiFi can now be used as an indicator of customer presence thanks to a WiFi mechanism that is common across all such devices — probe requests. These 802.11 management frames are transmitted at regular intervals from WiFi devices. The frames contain information that can be used to identify presence, time spent, and repeat visits within range of a WiFi access point. These devices can be detected by WiFi access points irrespective of its WiFi association state — meaning that even if a user does not connect his or her device to the wireless network, the device’s presence can still be detected while the device is within range of the network and the device’s WiFi antenna is turned on1.
Since smartphones now have greater than 50% penetration across the general population2, probe requests can be used to build and detect a statistically significant data set regarding the presence of WiFi enabled devices within range of a given access point. Cisco Meraki wireless APs and cloud infrastructure gathers this data and presents it in aggregate on the Meraki Dashboard. This is done through intuitive and customizable graphs that can be used to understand trends such as capture rate (passersby vs. visitors), user engagement (total time spent), and visitor loyalty (new vs. repeat visits). Cisco Meraki is able to provide these analytics to all organizations by leveraging the industry-leading cloud architecture that is behind all Cisco Meraki products.
Additionally, Cisco Meraki’s CMX API exports raw data from the observed probe requests, which organizations can use to integrate directly with third-party data warehousing or analytics platforms. Not only can this facilitate a deeper integration with traditional customer relationship management (CRM) platforms, but, due to its real-time nature, it opens doors to next-generation customer engagement initiatives.
Viewed holistically, Cisco Meraki’s built-in location analytics views and real-time location API complement the existing traffic analytics functionality and complete a 360-degree understanding of devices on- and within range of a Cisco Meraki network. This whitepaper explores Cisco Meraki’s location functionality and offers insights into the technology behind these features and some of the use-cases that it can enable. These features are part of Cisco Meraki’s MR series wireless access points.
1 The collection and use of location information has raised privacy concerns that have been reported in the media. Meraki is sensitive to these issues and has designed location analytics with privacy in mind. Users concerned with having the presence of their device detected by these kinds of systems can avoid detection simply by turning off the WiFi antenna on the device.
2 http://www.comscore.com/Insights/Market-Rankings/comScore-Reports-June-2014-US-Smartphone-Subscriber-Market-Share
Cisco Systems, Inc. | 500 Terry A Francois Blvd, San Francisco, CA 94158 | (415) 432-1000 | [email protected]
2 Location AnalyticsCMX Data Collection
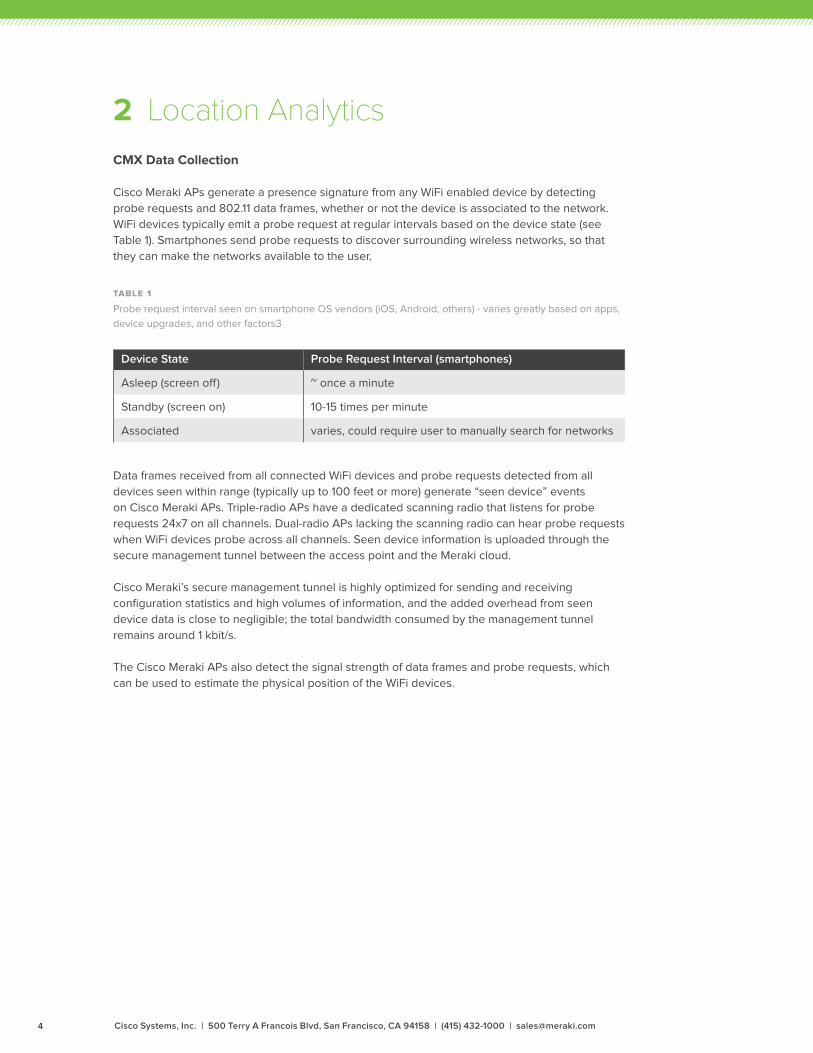
Cisco Meraki APs generate a presence signature from any WiFi enabled device by detecting probe requests and 802.11 data frames, whether or not the device is associated to the network. WiFi devices typically emit a probe request at regular intervals based on the device state (see Table 1). Smartphones send probe requests to discover surrounding wireless networks, so that they can make the networks available to the user.
Table 1
Probe request interval seen on smartphone OS vendors (iOS, Android, others) - varies greatly based on apps, device upgrades, and other factors3
Data frames received from all connected WiFi devices and probe requests detected from all devices seen within range (typically up to 100 feet or more) generate “seen device” events on Cisco Meraki APs. Triple-radio APs have a dedicated scanning radio that listens for probe requests 24x7 on all channels. Dual-radio APs lacking the scanning radio can hear probe requests when WiFi devices probe across all channels. Seen device information is uploaded through the secure management tunnel between the access point and the Meraki cloud.
Cisco Meraki’s secure management tunnel is highly optimized for sending and receiving configuration statistics and high volumes of information, and the added overhead from seen device data is close to negligible; the total bandwidth consumed by the management tunnel remains around 1 kbit/s.
The Cisco Meraki APs also detect the signal strength of data frames and probe requests, which can be used to estimate the physical position of the WiFi devices.
Device State Probe Request Interval (smartphones)
Asleep (screen off) ~ once a minute
Standby (screen on) 10-15 times per minute
Associated varies, could require user to manually search for networks
Cisco Systems, Inc. | 500 Terry A Francois Blvd, San Francisco, CA 94158 | (415) 432-1000 | [email protected]

iPhone – standby state, not associated to any wireless network
Figure 1
Typical probe request from an iOS device - 60 second packet capture taken from Meraki AP, opened using Wireshark.
3 Based on empirical evidence from Meraki’s own experiments and those of our analytics partners. This behavior tends to vary greatly based on the operating system and which apps are installed on the phone — for example, if a certain app is very active, it could cause a device that is asleep to probe several times a minute.
Prism capture header contains RSSI (signal strength) and channel information
802.11 packet type is Probe Request, source is device and destination is broadcast (ff:ff:ff:ff:ff:ff)
Probe Request packets
Management frame advertises device capabilities
Data Aggregation and Display
Once received by the Meraki cloud, presence signatures from all of the APs in a network are aggregated. After aggregation, data from each observed client device undergoes a series of computations to categorize it for later presentation. For example, retailers need to understand capture rate, which is the ratio of people passing by the store versus actually coming inside. To determine capture rate, the Meraki cloud analyzes the signal strength of each client device, along with the time spent within that location (a high signal strength on its own may not indicate a visitor if they are simply passing by the storefront quickly).
Probing and associated clients Meraki’s CMX Location Analytics
http://meraki.com
http://meraki.com Figure 2
End-to-end CMX
Analytics Architecture
Cisco Systems, Inc. | 500 Terry A Francois Blvd, San Francisco, CA 94158 | (415) 432-1000 | [email protected]
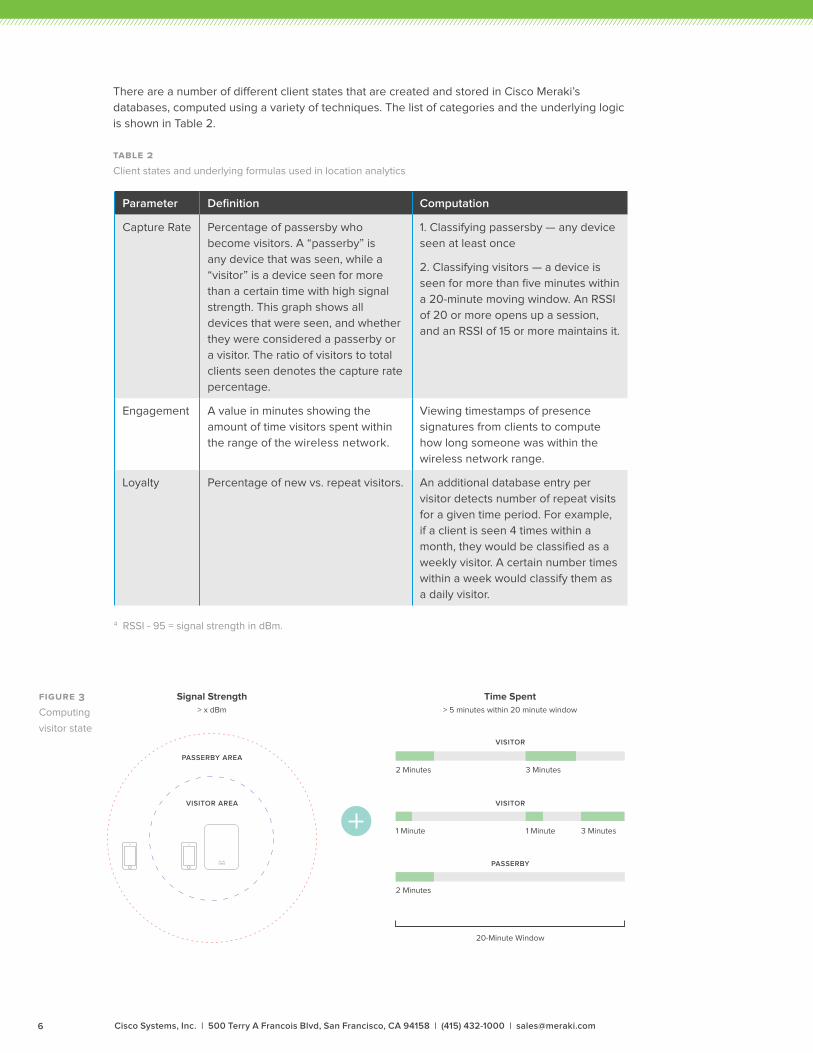
4 RSSI - 95 = signal strength in dBm.
There are a number of different client states that are created and stored in Cisco Meraki’s databases, computed using a variety of techniques. The list of categories and the underlying logic is shown in Table 2.
Table 2
Client states and underlying formulas used in location analytics
Parameter Definition Computation
Capture Rate Percentage of passersby who become visitors. A “passerby” is any device that was seen, while a “visitor” is a device seen for more than a certain time with high signal strength. This graph shows all devices that were seen, and whether they were considered a passerby or a visitor. The ratio of visitors to total clients seen denotes the capture rate percentage.
1. Classifying passersby — any device seen at least once
2. Classifying visitors — a device is seen for more than five minutes within a 20-minute moving window. An RSSI of 20 or more opens up a session, and an RSSI of 15 or more maintains it.
Engagement A value in minutes showing the amount of time visitors spent within the range of the wireless network.
Viewing timestamps of presence signatures from clients to compute how long someone was within the wireless network range.
Loyalty Percentage of new vs. repeat visitors. An additional database entry per visitor detects number of repeat visits for a given time period. For example, if a client is seen 4 times within a month, they would be classified as a weekly visitor. A certain number times within a week would classify them as a daily visitor.
Figure 3
Computing
visitor stateVISITOR
VISITOR
PASSERBY
2 Minutes
2 Minutes
20-Minute Window
1 Minute 1 Minute 3 Minutes
3 Minutes
Time Spent> 5 minutes within 20 minute window
Signal Strength> x dBm
VISITOR AREA
PASSERBY AREA
Cisco Systems, Inc. | 500 Terry A Francois Blvd, San Francisco, CA 94158 | (415) 432-1000 | [email protected]

Data Display and Comparative Analysis
While the Meraki cloud runs the above computations in real time to calculate the various client states, the Meraki Dashboard displays it via intuitive graphs that visualize capture rate, engagement, and loyalty. These graphs can be toggled between simple and complex views. A calendar function allows the user to zoom in or -out of a given time period to see views as granular as one day (which can show how foot traffic varies and peaks during a certain day) or as wide as several months (which can show seasonal fluctuations).
Cisco Meraki also has built a powerful comparative analysis tool that facilitates insights between networks within a given organization. By running a comparison, the Meraki Dashboard will overlay location data from the first data set on top of the second. Comparisons can be run to analyze different data sets, for example:
1. Single site comparison between two different time periods (e.g., this week vs. last week)
2. Multi-site comparisons between two different sites or sets of sites
• Between two different sites (site A vs. site B)
• Between one site and a batch of sites (site A vs. all sites, or site A vs. an average of sites A through D)
• Between two different batches of sites (all sites vs. average of sites A through D)
Comparing to batches of sites leverages Cisco Meraki’s network tagging functionality, which allows administrators to create hierarchical network structures by assigning one or more tags to different networks. In this fashion, a large number of comparisons can be run in a multi-site organization based on the reporting that is required, e.g., “Show me how this site compares to the nationwide average within my organization,” or “show me how the sites in the organization’s East region compare to the sites in its West region.”
Figure 4
Use of Network Tags
to Create Groups of
Networks
Parent Group
Tag D
Network Group A
Tag A
Wireless Network 1Wireless Network 2Wireless Network 3
Wireless Network 4Wireless Network 5Wireless Network 6
Wireless Network 7Wireless Network 8Wireless Network 9
Network Group B
Tag B
Network Group C
Tag C
AD
D
D
D
D
D
A
A
B
B
B
C
C
C
D
D
D
Cisco Systems, Inc. | 500 Terry A Francois Blvd, San Francisco, CA 94158 | (415) 432-1000 | [email protected]

The recommended methods for deploying Cisco Meraki wireless networks remain unchanged as a result of the new location analytics. There is no need to change AP placement, orientation, or add more APs. The heuristics described in the above sections automatically take data from existing deployments to analyze and provide data on foot traffic.
There are a number of general guidelines and factors to keep in mind when deploying a Cisco Meraki network optimized for location analytics, including:
• Deploy physical access points as you normally would to provide wireless network coverage
• In the Meraki Dashboard, structure your deployment in an Organization/Network topology with one network per location. Since the Location Analytics data is computed and displayed on a per-network basis, you probably want to create a network per location (as opposed to all locations within a single network). The Dashboard interface is designed to facilitate the management of hundreds of networks.
• Tag different batches of networks on the Organization > Overview page. This lets you group sets of sites into batches, and the analytics data can be run in comparisons against tags.
• If your networks are in different time-zones, ensure that each network has its time-zone configured correctly on the Configure > Network-wide settings page so that consistent comparisons can be run.
• Allow time (several days) for Cisco Meraki’s databases to populate with your network’s information.
Cisco Systems, Inc. | 500 Terry A Francois Blvd, San Francisco, CA 94158 | (415) 432-1000 | [email protected]

Value for Marketing and Business Intelligence Teams
The goal behind all of the data analytics and graphs presented is to provide a platform for both IT and non-IT departments to understand user presence. By understanding patterns such as foot traffic by time of day and how the capture rate varies across different sites, IT departments can gain a better understanding of network usage and trends, and non-IT departments, such as marketing and business intelligence teams, can gain insights and answer questions such as “is my new marketing campaign at site A working based on the foot traffic numbers?” or “do I need to staff more people at site B during peak hours?” Some of the different use-cases for which Location Analytics could be useful are highlighted in Table 3.
Use-Cases
• Detect total client visits
• Analyze and optimize window conversion
• Optimize staffing by time of day
• Analyze visitor dwell-time and repeat frequency
• Compare across sites or take averages for sets of sites to understand below or above-average store foot traffic, dwell-time and repeat frequency
• Optimize and run A/B tests to see if changes in one variable affect outcome of measurable parameters (e.g. capture rate)
• Analyze data and compare to external KPIs (e.g. average spend per site, average spend per user, average cost per store)
• Prepare network for weekly or seasonal fluctuations by optimizing policies
• Correlation of location analytics data with traffic analysis and device fingerprinting data for 360-degree view of user presence, devices and online behavior
Table 3
Use-cases where location analytics may be relevant
Cisco Systems, Inc. | 500 Terry A Francois Blvd, San Francisco, CA 94158 | (415) 432-1000 | [email protected]

API Architecture
Complementing Cisco Meraki’s built-in Location Analytics is an API that can be used by organizations to offer support for real-time engagement services. Cisco Meraki’s CMX API works on the same underlying architecture powering the Location Analytics platform — except that instead of storing client sessions and states within the Meraki cloud, the data is exported in real-time via an HTTP POST.
The location API delivers data in real-time from the Meraki cloud and can be used to detect WiFi devices (associated and non-associated) in real-time. The elements are exported via an HTTP POST of JSON data to a specified destination server. The raw data is aggregated from all access points within a network on the Meraki cloud, and sent directly from the cloud to an organization’s data warehouse or business intelligence center. The JSON posts occur frequently, typically batched every minute.
There are two data architecture versions available via the CMX API. The data architecture that is the best fit for you will be driven by the use case and the client device attributes of interest.
3 CMX Location API
Figure 7
Meraki location API architecture
Probing and associated clients Customer analytics back-end
- AP MAC- Client MAC- RSSI- Timestamp
JSON
Real-time HTTPS POST
Cisco Systems, Inc. | 500 Terry A Francois Blvd, San Francisco, CA 94158 | (415) 432-1000 | [email protected]

Version 1.0
The CMX API v1.0 data architecture provides raw presence data in its simplest form. As a client is detected by an access point, the API will report the MAC address of the detecting AP, the client device’s MAC address and signal strength, and a timestamp. The structure of these 4 main elements is outlined below.
Data Elements
Data Format
{
“ap_mac”:<string>,
“client_mac”:<string> <timestamp>,
“rssi”:<string>
}
Name Format Description
ap_mac <string> Access Point MAC
client_mac <string> <timestamp> Client MAC and Timestamp
Received Signal Strength Indicator (RSSI)
<interger> Received Signal Strength Indicator (RSSI) (subtract 95 to get units in dBm)
Cisco Systems, Inc. | 500 Terry A Francois Blvd, San Francisco, CA 94158 | (415) 432-1000 | [email protected]

Version 2.0
The CMX API v2.0 data architecture enhances the foundations of v1.0. In addition to the data provided by v1.0, the Meraki cloud controller provides additional device classification information and location estimation. Using the physical placement of the access points from the Map & Floorplan on the Dashboard, the cloud controller estimates the location of the client.
The X,Y location data accuracy can vary based on a number of factors and should be considered a best effort estimate. AP placement, environmental conditions, and client device orientation can influence X,Y estimation; experimentation can help improve the accuracy of results or determine a maximum acceptable uncertainty for data points.
Data Elements
Name Format Description
apMac string MAC address of the observing AP
apFloors [string] JSON array of all floorplan names on which this AP appears
clientMac string MAC address of the client device
ipv4 string Client IPv4 address; null if not available or device is unassociated to the reporting AP
ipv6 string Client IPv6 address; null if not available or device is unassociated to the reporting AP
seenTime ISO 8601 date string Observation time in UTC; example: “1970-01-01T00:00:00Z”
seenEpoch integer Observation time in seconds since the UNIX epoch
ssid string Network SSID name to which the client device is connected; null if the device is unassociated
rssi integer Device RSSI as measured by AP
manufacturer string Device manufacturer; null if manufacturer could not be determined
os string Device operating system; null if the OS could not be determined
location location Device geolocation based on the below elements; elements null if location could not be determined
lat decimal Device latitude in degrees N of the equator
lng decimal Device longitude in degrees E of the Prime Meridian
unc decimal Uncertainty in meters
x [decimal] JSON array of x offsets (in meters) from lower-left corner of each floorplan
y [decimal] JSON array of y offsets (in meters) from lower-left corner of each floorplan
Cisco Systems, Inc. | 500 Terry A Francois Blvd, San Francisco, CA 94158 | (415) 432-1000 | [email protected]
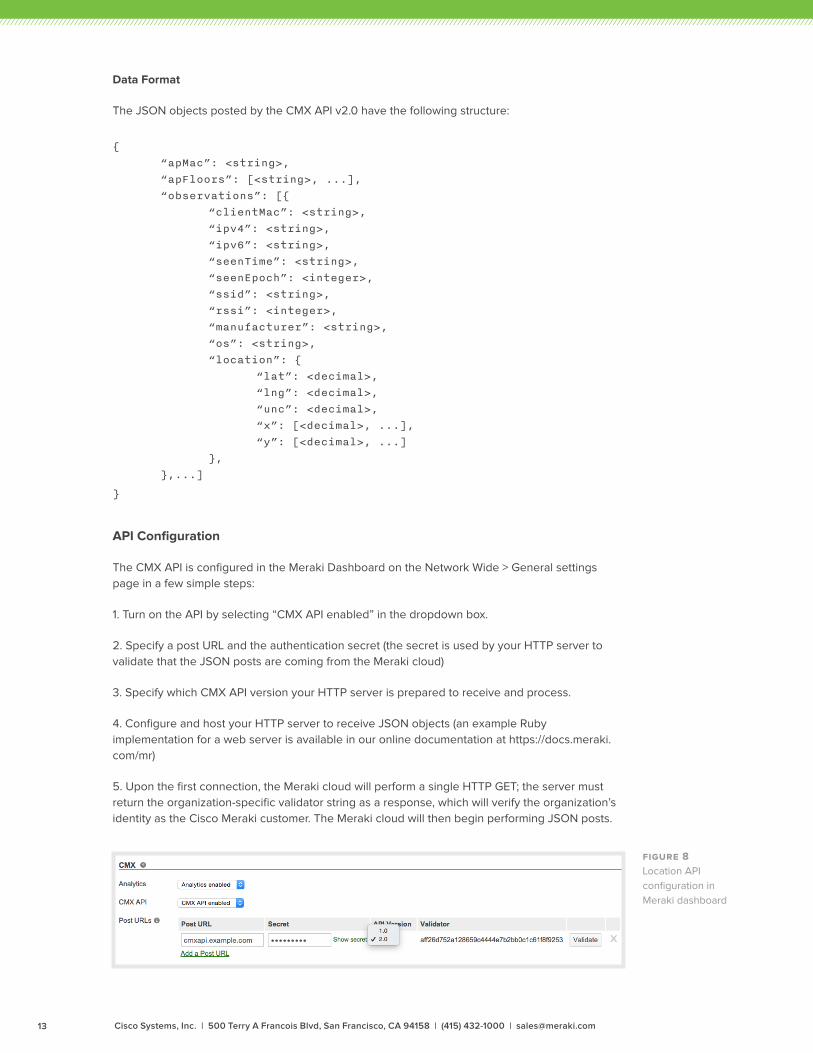
Data Format
The JSON objects posted by the CMX API v2.0 have the following structure:
{
“apMac”: <string>,
“apFloors”: [<string>, ...],
“observations”: [{
“clientMac”: <string>,
“ipv4”: <string>,
“ipv6”: <string>,
“seenTime”: <string>,
“seenEpoch”: <integer>,
“ssid”: <string>,
“rssi”: <integer>,
“manufacturer”: <string>,
“os”: <string>,
“location”: {
“lat”: <decimal>,
“lng”: <decimal>,
“unc”: <decimal>,
“x”: [<decimal>, ...],
“y”: [<decimal>, ...]
},
},...]
}
API Configuration
The CMX API is configured in the Meraki Dashboard on the Network Wide > General settings page in a few simple steps:
1. Turn on the API by selecting “CMX API enabled” in the dropdown box.
2. Specify a post URL and the authentication secret (the secret is used by your HTTP server to validate that the JSON posts are coming from the Meraki cloud)
3. Specify which CMX API version your HTTP server is prepared to receive and process.
4. Configure and host your HTTP server to receive JSON objects (an example Ruby implementation for a web server is available in our online documentation at https://docs.meraki.com/mr)
5. Upon the first connection, the Meraki cloud will perform a single HTTP GET; the server must return the organization-specific validator string as a response, which will verify the organization’s identity as the Cisco Meraki customer. The Meraki cloud will then begin performing JSON posts.
Figure 8 Location API configuration in Meraki dashboard
Cisco Systems, Inc. | 500 Terry A Francois Blvd, San Francisco, CA 94158 | (415) 432-1000 | [email protected]

Figure 9 Protocol flow between Meraki cloud and third-party server
Use cases for the CMX API In order to make use of the CMX API data, IT professionals or business intelligence teams need the data to be tied to other information about a specific user (e.g., email address, phone number, or customer-loyalty number). Collection of these other identifying data happens externally from the Cisco Meraki platform (e.g., by a third-party captive portal).
Once customers or partners have built their own platform to make use of the CMX API data, the use cases are endless. In the retail context, this information can be used to augment a retailer’s customer records and enhance real-time customer engagement. In the enterprise context, location data can be used to inform policy decisions about WiFi availability, physical security, and energy savings. The location API provides the raw data elements required to facilitate a flexible range of applications based on the customer’s requirements.
HTTP GET
Return of Validator Token
HTTP Post of JSON
HTTP Web ServerMeraki Cloud
HTTP Post of JSON
HTTP Post of JSON
Verification of posts using secret
Data Extraction + Storage
Cisco Systems, Inc. | 500 Terry A Francois Blvd, San Francisco, CA 94158 | (415) 432-1000 | [email protected]

Meraki understands that some end users may be concerned about the collection and use of location information. In an effort to address these concerns, Meraki developed location services with privacy in mind, including a number of security mechanisms to eliminate uniquely identifiable elements from the data that it collects. Meraki also recommends that its customers and partners implement a number of privacy-friendly features.
Privacy for CMX Location Analytics As outlined in Section 2, Meraki uses 802.11 probe requests and data frames to detect and store client states. Because the presence data contain raw MAC addresses, Meraki implemented a number of security mechanisms to anonymize the data in an irreversible fashion. Once uploaded, the Meraki cloud anonymizes or produces a “hash” of MAC addresses so that they are not identifiable. The Meraki cloud controller only stores the hashed version of the MAC address. The hash function is as follows:
hash(mac bytes, org secret) = SHA1(mac bytes ++ org secret).takeRight(4)
where:
“++” indicates concatenation; “takeRight(4)” returns the least significant 4 bytes of the SHA1; and “org secret” is a per-customer salt.
Example:
client MAC is “11:22:33:44:55:66” org secret is “t3lrdd”
least significant 4 bytes of SHA1(“112233445566t3Irdd”) = 0x0e456406
SHA1 is a widely known one-way cryptographic function. Using SHA1 hashes in this manner is the current industry standard. In order to provide an additional layer of security beyond SHA1 hashing, Meraki’s hash function truncates the hash to 4 bytes. This produces an “information theoretic loss,” as the domain of the function is larger than the range: a 6-byte MAC allows (2^48) possibilities whereas a 4-byte hash allows (2^32) possibilities. This results in 65,000 possible (org + MAC) combinations for each one 4-byte hashed MAC address. Therefore, given a truncated MAC that has been hashed with the unique Meraki algorithm, it would be mathematically impossible to know with a reasonable degree of certainty what the original client MAC address was.
4 Location and Privacy
Cisco Systems, Inc. | 500 Terry A Francois Blvd, San Francisco, CA 94158 | (415) 432-1000 | [email protected]

Cisco Meraki includes a customer-specific org-secret in the hash function. As a result, Cisco Meraki does not have any visibility into client behavior across our customers’ networks worldwide. And, of course, no Cisco Meraki customer can see the analytics of another customer’s organization or where foot traffic goes after leaving the presence of its own WiFi network.
Finally, Cisco Meraki’s website offers a global opt-out feature that allows users to submit the MAC addresses of their devices, after which the Meraki cloud will no longer detect their MAC addresses either for its built-in Location Analytics views or for real-time export via the CMX API. Cisco Meraki also recommends that retailers and others using CMX post notices on the availability of this global opt-out in prominent locations, preferably in the storefront or at building entrances where location detection is taking place.
Privacy for CMX APICisco Meraki’s CMX API, outlined in Section 3 above, exports raw MAC addresses to a specified third-party server. There are a number of privacy protection mechanisms that we have implemented, including:
No customer identity tie-in mechanisms Cisco Meraki does not directly provide any way of tying MAC addresses to customer identity. These systems must be separately built and hosted by a customer, partner or service provider.
No customer contact mechanisms Cisco Meraki does not provide any mechanism by which the location API data can be used to contact customers in any way. For real-time user engagement, Cisco Meraki customers must build and maintain their own platform for contacting customers.
Recommended best practices Cisco Meraki recommends a number of best practices for users of its API, including:
• Opt-in — Cisco Meraki customers should make it explicitly clear at the time of identity tie-in (e.g., via a splash page or through a mobile app) that user-provided information may be linked to a device’s MAC address for more extensive engagement.
• On-premise notification — As with the use of the built-in Location Analytics, notice should be prominently displayed in areas using of the CMX API data.
• Opt-out — In addition to providing an opt-in policy, Cisco Meraki customers should make their own customers aware of Cisco Meraki’s global opt-out policy (allowing an opt-out by MAC address) and provide an intuitive means of accessing Cisco Meraki’s opt-out page. Cisco Meraki’s global opt-out is available at https://account.meraki.com/optout.
Figure 10 Unique hash function leads to ‘information theoretic loss’ - original MAC address of client can never be recovered
1100101110111001111100111 1 0 1 1 1 1 11100001111101011
Original MAC (6 bytes)
Meraki Hash Function10010001101010011 1 1 1 1 0 1 11 1 0 1 0 1 1 1
Hashed MAC (4 bytes)
�
Cisco Systems, Inc. | 500 Terry A Francois Blvd, San Francisco, CA 94158 | (415) 432-1000 | [email protected]

5 Conclusion
Thanks to widely available “smart” devices equipped with WiFi, Cisco Meraki’s wireless access points can detect and provide location analytics to report on user foot traffic behavior. This can be especially useful in multi-site retail or enterprise deployments where admins or departments beyond IT wish to learn more about trends and user engagement. Coupled with traditional reporting from WiFi systems on users, devices, applications and websites, Cisco Meraki now provides a holistic 360-degree view of online and offline user traffic.
Leveraging our globally distributed datacenter architecture, Cisco Meraki has built an end-to-end system that can aggregate data from thousands of endpoints for effective collection, analysis, and presentation of this data on the Meraki Dashboard. Comparisons can be run between different sites and time periods, and Cisco Meraki’s network tagging functionality allows for an unlimited variation of comparisons by creating “batches” of networks that can be grouped together based on district, region, or any other preference. In addition to the built-in location analytics view, the CMX API enables Cisco Meraki customers to detect and aggregate real-time data for custom applications.
With these developments in the location arena comes a renewed emphasis on Cisco Meraki’s commitment to privacy. Security measures have been taken to help protect user privacy — for the built-in analytics view, all data is anonymized and modified to a degree where it is impossible to derive the original MAC address. The CMX API is optional, with a globally available opt-out mechanism on the Cisco Meraki website and recommended practices for our customers to provide an opt-in to end-users regarding location detection. By addressing privacy concerns and building a truly scalable location platform, Cisco Meraki can facilitate an effective rollout of tens of thousands of locations; enterprise customers can therefore look forward to a new era of leveraging their wireless networking rollouts to conduct more effective business by better understanding their end-users more effectively through location analytics.
Cisco Systems, Inc. | 500 Terry A Francois Blvd, San Francisco, CA 94158 | (415) 432-1000 | [email protected]