white paper elevate your benefit analytics
TRANSCRIPT

Elevate Your Benefit Analytics
WHITE PAPER
A U T H O R E D B Y :
Nicolai Adamsky, ASA, MAAAManaging Consultant at Brown & Brown
BROWN & BROWN | PAGE 2
Many organizations spend time and money on data analytics yet do not realize the value of their investment. We suggest a few key steps to help capitalize on your data warehouse and avoid common data strategy pitfalls to elevate the data analytics game at your organization.
Elevate Your Benefit Analytics
BROWN & BROWN | PAGE 3
Maximize the Value of Your Data Warehouse
The key to success with any tool is understanding not only how to use it, but where it provides the most value. A broom is great, but if you are using it to sweep carpet instead of hardwood floors, you may not be getting the best value or results. The true value of a data warehouse is in the way you use it.
Data IntegrationYour company invested in a data warehouse to take data from multiple sources and combine them to perform analysis based on the merged data rather than a single source. If you find yourself running most reports from a single data source, you are missing the true power of the warehouse. For example, instead of asking how much behavioral health is affecting medical claims cost, take a look at how it ties to your carved-out pharmacy and how it drives your life and disability claims as well.
Better AccessAs part of your benefits process, you may want to know more about your top cancer facilities as you think about a center of excellence strategy. You could ask your carrier to provide some information. They get back to you after a while, some of the data is confusing and you have additional follow-up questions. With your data warehouse, you can run your own reports to get data quickly and to your specification. You can do further drill downs without waiting for the carrier to send you updated reports. Once you complete all of the basic research, you can ask your carrier the questions that only they can answer and pull in the decision-makers.
Hypothesis Testing and Decision MakingBeing skeptical in the benefits world helps you to ask questions that can be answered by your analytics. For instance, “Are the solutions we have in place driving the results we are looking for?” This is where analytics can really make a difference. When you or your team have important questions, allow them to be your hypotheses. You can use your data warehouse to go through the scientific process and get the answers. Most important, now that you know whether your hypotheses were valid, what action are you going to take? For example: you implemented a new medical carrier because they have a strong discount advantage. Its aggregate reporting on discounts looks good compared to your prior carrier but you may be comparing apples to oranges. Solution? Prove the hypothesis by comparing the cost of a basket of high-volume procedures for your population (like maternity deliveries, ER visits and MSK procedures). You can pull the facility and physician charges between the two vendors, line them up and see how the two carriers really compare when looking at similar data sets.
Vendor GovernanceVendors may bring you a variety of management reports to help justify ROI, but it may be hard to know if you are truly comfortable with the underlying methodology and data. For instance, an enhanced or carved-out care management solution may sound beneficial and seem like it could offer cost savings, but what information is this based on? Use your data warehouse to dig deeper. What are the year-over-year results for members who are engaged in these programs versus those who are not? Maybe it is saving money, but what are the outcomes? Have there been fewer disability claims for engaged members versus prior years? Can you find hard savings to justify the vendor fees? Are there enough productivity savings or outcome improvements to make the case for the vendor based on value? Ask the tough questions and get the answers right from your data warehouse. Finally, always feel free to share your findings with your vendor partner so they can optimize the solution for your organization.

BROWN & BROWN | PAGE 4
Avoid the Pitfalls of Data StrategyAt the end of a data-heavy meeting, what is the response you receive if you ask, “what did we just accomplish here and how are we going to make decisions based on this information?” If you get blank stares when asking these questions, you may have run into some of the following issues.
Gathering Data for the Sake of DataWhen you ask for information, make sure it will add value. Imagine an annual meeting with your pharmacy benefit manager (PBM) for example. You notice the cost of cholesterol-lowering medications has increased dramatically. You might be wondering, “how much of that is the change in mix of drugs versus cost inflation or increased utilization?” The question is very insightful but adding commentary about why you are asking the question can help. You could follow up with, “if much
of the increase is associated with a higher cost drug mix, what opportunities do we have to ensure members are taking advantage of lower cost but effective alternatives?” This way, when you receive the additional data from the PBM, they will also be providing insight into potential solutions.
Excluding ComparatorsWhen you look at your data you may find that 10% of your employees are receiving treatment for diabetes. Based on this information you may think this is a lot and that you should identify a plan to lower these numbers. But how do you know it is a large number? How does it compare with other organizations? How does it compare year-over-year? Having the comparators will add essential perspective to the data and allow you to prioritize where you should focus your energy.
Case Study: Using Data to Assess a Wellness ProgramWellness programs often make an employer feel good and the employees typically love the incentives. However, do you know if they are changing outcomes? It is easy to use your data warehouse to show that wellness program participants cost less on average than non-participants ― but correlation may not imply causation. They cost less because those who are likely to participate in the program are also likely to be more health conscious.
One employer wanted to look beyond the obvious data. They knew there was intrinsic value in having a wellness program (ROI vs. VOI), but not whether the program was changing outcomes. Instead of participants versus non-participants, we reviewed year-over-year participant results.
As the data below demonstrates, participation in the program was not changing outcomes on the three important metrics we reviewed. We would expect participants to improve their numbers after participating for a few years. At the end of the day, the company knew changing its wellness program was going to be disruptive and it needed good data to support it. Employees were upset they were no longer getting $100 for getting their biometrics taken (without needing to take any action). This data provided the employer the information it needed to justify building a new program with senior leadership. Moving forward, we will also apply this same level of scrutiny to the new wellness program data to help ensure it is successful.
Location Participants (Multi-Year)
Average BMI
PMPM Medical/ Rx Claims
LDL Cholesterol
Year 1 2,148 25.5 $585 110
Year 2 1,969 25.7 $610 112
Year 3 1,841 25.6 $597 107

BROWN & BROWN | PAGE 5
Understanding Data SourcesData is powerful and can provide much needed insight. Unfortunately, data has a weakness, as simplifying everything down to numbers can remove a lot of context. Many of us have spent time reconciling why reports across the organization may show different results. Although time consuming, it is an important effort to make sure we are all on the same page. Having strong relationships with teams who understand
the data sources and can provide the right amount of context (ex: what is included and what is not, time period, incurred vs. paid, etc.) can help save you a lot of time and resources. The sooner all parties are comfortable with the data, the sooner we can use the data to address our real questions ― what is working and what is not and where there are opportunities to help improve the outcomes of your benefit plan.
Case Study: Implementing a Local Benefit StrategyAs the employer in this case study knows, being in a diverse industry with employees all over the U.S. makes for unique challenges (and solutions). This employer is trying to meet the needs of all its members ― from manufacturing sites in the Midwest, to research and development hubs on the West Coast. While a national benefit strategy is important, the company understood that having local strategies can at times be equally, if not more effective. Our team reviewed different metrics for each of their large regional “worksites” to better understand their differentiated and localized needs.
Location Subscribers Members Medical PMPM
MSK/ 1,000
ER/ 1,000
BH/ 1,000
Well Visits/ 1,000
Location 1 1,805 4,084 $278.52 242.7 121.4 150.7 361.3
Location 2 751 1,790 $465.82 263.8 102.6 186.5 418.3
Location 3 799 1,565 $460.59 253.2 165.4 181.7 234.4
Location 4 601 1,233 $562.96 245.5 136.6 124.3 307.2
Location 5 491 1,256 $505.32 242.2 71.2 154.7 443.7
Location 6 427 1,216 $339.91 295.5 82.1 206.4 452.6
All Locations 9,734 22,528 $380.78 259.1 106.6 157.8 355.0
This regional approach helped identify significant opportunities — including emergency room usage and behavioral health gaps.
In a few locations, emergency room visits were much higher than benchmark. We worked with the employer’s medical carrier to identify gaps in urgent care center availability, and supported the carrier with network recruitment. We also worked with the employer and their carrier to send educational materials to its employees — including posters and magnets to place in worksites promoting the closest urgent care center and highlighting the cost savings of urgent care visits over emergency rooms.
In other locations, we saw that behavioral health visits were very low. Our team worked with the carrier to address gaps in the network and also worked directly with the employer to address the national stigma of acknowledging emotional challenges. At select worksites, the employer incorporated the importance of behavioral health as part of regularly scheduled safety meetings. Materials were provided to employees about how to get connected to behavioral health resources like provider search tools, EAP programs (including additional onsite hours) and telehealth providers who offer counseling or psychiatry.
For both of these local strategies, local HR champions were critical for success in operationalizing the employer’s regional strategy.
BROWN & BROWN | PAGE 6
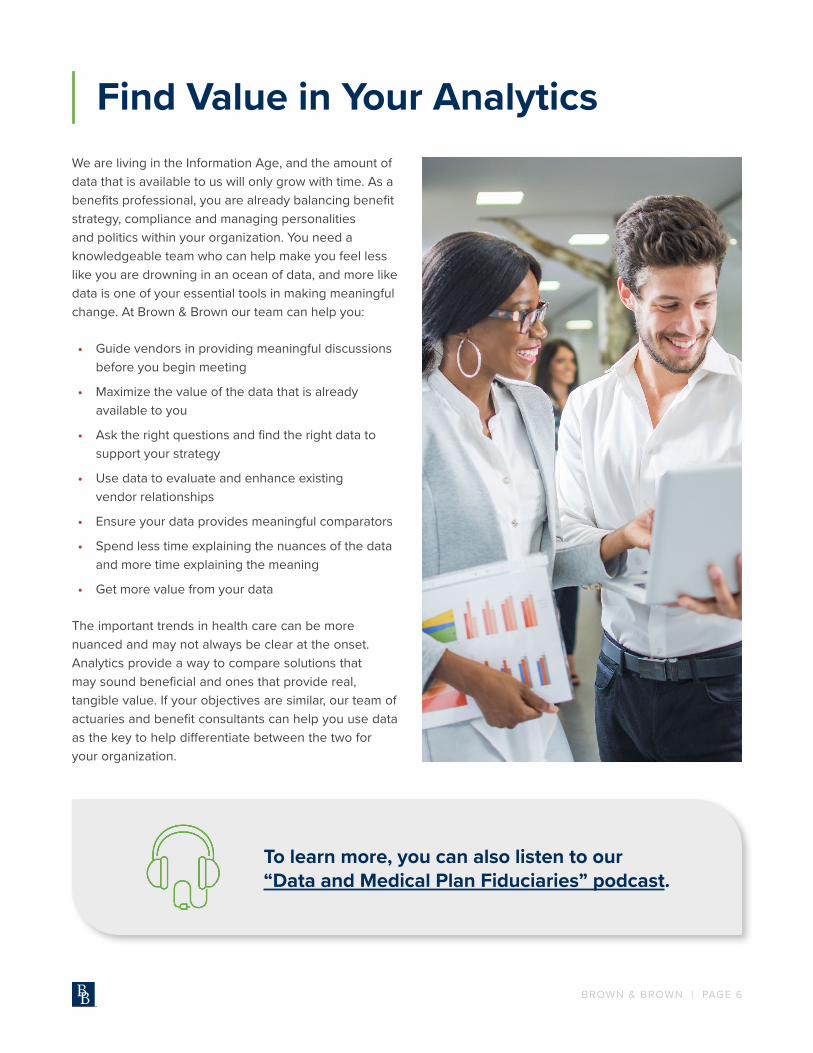
Find Value in Your AnalyticsWe are living in the Information Age, and the amount of data that is available to us will only grow with time. As a benefits professional, you are already balancing benefit strategy, compliance and managing personalities and politics within your organization. You need a knowledgeable team who can help make you feel less like you are drowning in an ocean of data, and more like data is one of your essential tools in making meaningful change. At Brown & Brown our team can help you:
• Guide vendors in providing meaningful discussions before you begin meeting
• Maximize the value of the data that is already available to you
• Ask the right questions and find the right data to support your strategy
• Use data to evaluate and enhance existing vendor relationships
• Ensure your data provides meaningful comparators
• Spend less time explaining the nuances of the data and more time explaining the meaning
• Get more value from your data
The important trends in health care can be more nuanced and may not always be clear at the onset. Analytics provide a way to compare solutions that may sound beneficial and ones that provide real, tangible value. If your objectives are similar, our team of actuaries and benefit consultants can help you use data as the key to help differentiate between the two for your organization.
To learn more, you can also listen to our “Data and Medical Plan Fiduciaries” podcast.
©2022 Brown & Brown. All rights reserved.
Find Your Solution at bbinsurance.com
Brown & Brown is focused on providing your employees with premium benefits, all while supporting your financial costs. Our teams provide a multi-faceted approach that
includes strategic plan design, holistic employee communication plans, innovation strategies, connecting you with knowledgeable teams in all areas of employee
benefits, deploying best practices by industry and providing deep data analytics.
How Brown & Brown Can Help
Brown & Brown, Inc. and all its affiliates, do not provide legal, regulatory or tax guidance, or advice. If legal advice counsel or representation is needed, the services of a legal professional should be sought. The information in this document is intended to provide a general overview of the services contained herein. Brown & Brown, Inc. and all its affiliates, make no representation or warranty as to the accuracy or completeness of the document and undertakes no obligation to update or revise the document based upon new information or future changes.