white paper - operating model to 2022 (v.8)1cdn.cmnhospitals.org/uswebsite/operatingmodel/white...
TRANSCRIPT

1
OPERATING MODEL White Paper as of August 26, 2013

2
Children's Miracle Network Hospitals
OPERATING MODEL
Table of Contents
Introduction………………………………………………….……………… 3 Current Situation Operating Model Subcommittee Peer Research Results……………………………………….……….…… 7 Aspirational Peers $500M - $1.5B
Current Peers $125M - $499M
Ten-Year Projections.…………………………………………..……….…. 9 Fundraising Projections Cost Projections What Levers Can We Pull To Fund National Expenses? ……………… 12 Percentage of Funds Raised Membership Fees / Chapter Affiliation Fees Corporate Underwriting / Sponsorships Retail Product Sales / Charity Shops Social Enterprise / Benefit Corporation Transformational Gifts Investments/Endowments Block or Direct Grants Enrollment Process…………………………………………….…………... 14 Stakeholder Conversations Online Survey Next Steps……………………………………………………………..…….. 15 Building A New Operating Model
Evaluating New Operating Models -Guiding Principles -Scorecard Implementation Conclusion…………………………………………….…………………….. 16
3
INTRODUCTION
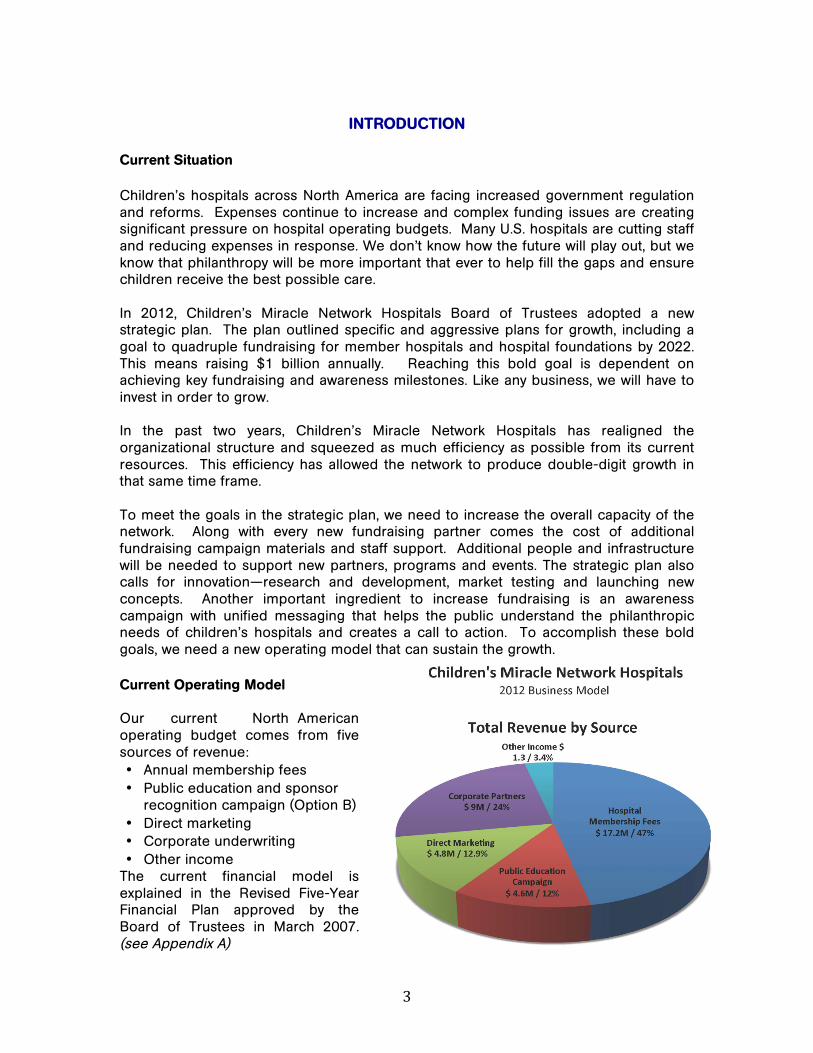
Current Situation Children’s hospitals across North America are facing increased government regulation and reforms. Expenses continue to increase and complex funding issues are creating significant pressure on hospital operating budgets. Many U.S. hospitals are cutting staff and reducing expenses in response. We don’t know how the future will play out, but we know that philanthropy will be more important that ever to help fill the gaps and ensure children receive the best possible care. In 2012, Children’s Miracle Network Hospitals Board of Trustees adopted a new strategic plan. The plan outlined specific and aggressive plans for growth, including a goal to quadruple fundraising for member hospitals and hospital foundations by 2022. This means raising $1 billion annually. Reaching this bold goal is dependent on achieving key fundraising and awareness milestones. Like any business, we will have to invest in order to grow. In the past two years, Children’s Miracle Network Hospitals has realigned the organizational structure and squeezed as much efficiency as possible from its current resources. This efficiency has allowed the network to produce double-digit growth in that same time frame. To meet the goals in the strategic plan, we need to increase the overall capacity of the network. Along with every new fundraising partner comes the cost of additional fundraising campaign materials and staff support. Additional people and infrastructure will be needed to support new partners, programs and events. The strategic plan also calls for innovation—research and development, market testing and launching new concepts. Another important ingredient to increase fundraising is an awareness campaign with unified messaging that helps the public understand the philanthropic needs of children’s hospitals and creates a call to action. To accomplish these bold goals, we need a new operating model that can sustain the growth. Current Operating Model Our current North American operating budget comes from five sources of revenue: • Annual membership fees • Public education and sponsor
recognition campaign (Option B) • Direct marketing • Corporate underwriting • Other income
The current financial model is explained in the Revised Five-Year Financial Plan approved by the Board of Trustees in March 2007. (see Appendix A)

4
Problems with the Current Operating Model in the United States • This model will not support quadrupling fundraising growth. Under the best
possible conditions and maximum increases every year it will provide only enough funding to raise about half of the goal or $500M. To quadruple fundraising, we will need to revise the current model to adequately invest in the people, technology, fundraising tools and materials needed to raise $1 billion annually for member hospitals and foundations.
• Under the current model, US membership fees are not tied to individual market performance. The fee is calculated based on overall network performance. If the network total increases, a hospital’s membership fee would increase. If a community experiences a catastrophic event, like the deadly tornados in Oklahoma in 2013, fundraising for the hospital may decline. Yet under the current model if overall network performance is up, the Oklahoma hospitals would receive a fee increase along with everyone else.
• The formula for determining U.S. annual fees is complex. It requires tracking the
base membership fee determination as of 2008 as well as each annual fee increase in order to determine the next year’s fee. While it is a difficult task for the national staff to track, budgeting for an annual fee increase at a local level is at best a shot in the dark. If it were based on predictable fundraising performance in one’s own market, it may make budgeting at the local level easier.
• When the fee is viewed as a percentage of performance, the base fee is
inconsistent. Some membership fees are equivalent to 3% of funds raised through CMN Hospitals in a market, while others can be as much as 30% of funds raised in the fee-setting year. The variance may be result of the base fee adjustments made in 2008, or may be a result of underperforming partners, programs or events.
• The current model essentially has a floor or minimum fee level that is based on the
national budget needs in 2008. There is also a ceiling amount that fees can increase which is the percentage increase in fundraising results averaged over the previous two years performance to set fees for the next fundraising year. Neither of these governors account for future budget needs to increase fundraising, only past performance.
5
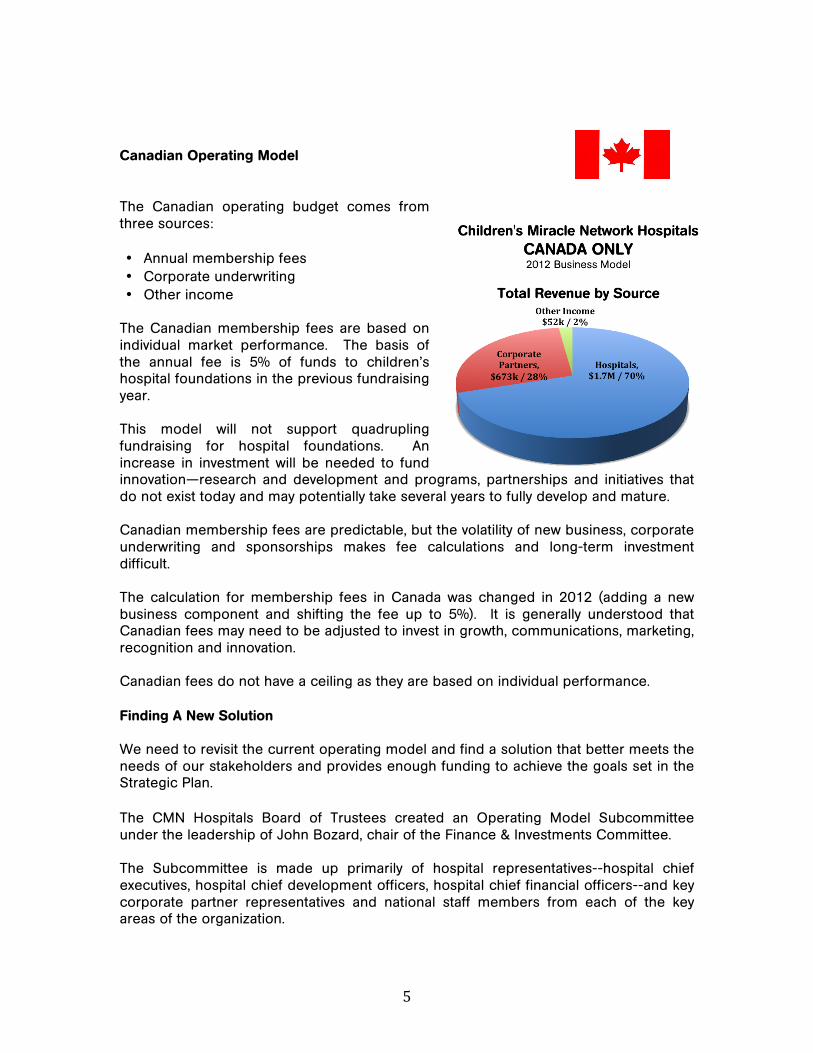
Canadian Operating Model The Canadian operating budget comes from three sources: • Annual membership fees • Corporate underwriting • Other income
The Canadian membership fees are based on individual market performance. The basis of the annual fee is 5% of funds to children’s hospital foundations in the previous fundraising year. This model will not support quadrupling fundraising for hospital foundations. An increase in investment will be needed to fund innovation—research and development and programs, partnerships and initiatives that do not exist today and may potentially take several years to fully develop and mature. Canadian membership fees are predictable, but the volatility of new business, corporate underwriting and sponsorships makes fee calculations and long-term investment difficult. The calculation for membership fees in Canada was changed in 2012 (adding a new business component and shifting the fee up to 5%). It is generally understood that Canadian fees may need to be adjusted to invest in growth, communications, marketing, recognition and innovation. Canadian fees do not have a ceiling as they are based on individual performance. Finding A New Solution We need to revisit the current operating model and find a solution that better meets the needs of our stakeholders and provides enough funding to achieve the goals set in the Strategic Plan. The CMN Hospitals Board of Trustees created an Operating Model Subcommittee under the leadership of John Bozard, chair of the Finance & Investments Committee. The Subcommittee is made up primarily of hospital representatives--hospital chief executives, hospital chief development officers, hospital chief financial officers--and key corporate partner representatives and national staff members from each of the key areas of the organization.

6
The Subcommittee’s charter is to review the current business model and bring forward a recommendation to the full board for a new model that will support and sustain fundraising to $1 billion annually for local hospitals. Operating Model Subcommittee Members John Bozard, President, Arnold Palmer Medical Center and Arnold Palmer Medical Center Foundation Orlando, Florida Rick Merrill, President & CEO Cook Children’s Health Care System Fort Worth, Texas Dr. Jeff Sperring, MD President & CEO Riley Hospital for Children at Indiana University Indianapolis, Indiana Dr. Jim Shmerling, DHA President & CEO Colorado Children’s Hospital Denver, Colorado Tom Sullivan, President Ann & Robert H. Lurie Children’s Hospital of Chicago Foundation Chicago, Illinois Ted Garrard, President & CEO SickKids Foundation Toronto, Ontario
Cary D’Ortona, Chief Financial Officer Arnold Palmer Medical Center Orlando, Florida Cora Case, Chief Financial Officer Renown Children’s Hospital Renown Health Reno, Nevada Steve Weisz, President & CEO Marriott Vacations Worldwide Corporation Orlando, Florida Andrea Thomas, SVP Sustainability Wal-Mart Stores, Inc. Bentonville, Arkansas Nana Mensah, Chairman & CEO ‘XPORTS, Inc. Nicholasville, KY 40356 Cathy Green Burns, Chair Children's Miracle Network Hospitals Board of Governors
Children’s Miracle Network Hospitals National Staff John Lauck, President & CEO Teri Nestel, Chief Administration Officer Stacy Weight, Finance & Accounting Bryce Barnett, Insights-Data Analysis Nick Ward, Information Technology Nate Graham, Hospital Relations
Sarah Waters, Corporate Partners Miranda Barnard, Communications Joe Trevino, Programs & Events April Poulsen, Cause Innovation Tony Rehmer, Cause Innovation Perry Esler & Alison Portt, Canada
The Subcommittee began the process of examining the operating model. We started with a few critical inquiries:
1. Which children’s charities are already raising a billion dollars? How are they funding national expenses? How much are they spending?
2. What will it cost our network to raise a billion dollars? 3. How can we approach this responsibly to ensure we operate efficiently without
losing sight of the impact we can make for children?
7
PEER RESEARCH RESULTS
To answer the questions above, we launched a research project to identify our aspirational group (future peers) and our current peer group. We also examined the financial plans and carefully reviewed the fundraising projections for the next ten years and how much it will cost to raise a billion dollars annually. From there, we developed the list of levers we can pull to generate the funding needed to quadruple fundraising. Below is a summary of the research.
Aspirational Group We researched children’s charities reporting total annual income in the range of $500 million to $1.5 billion. We reviewed revenue, expenses and net assets reported to the Internal Revenue Service on Form 990 – Exempt Organization Tax Return as well as the information reported to the Canada Revenue Agency. We also reviewed data reported by the Chronicle of Philanthropy’s Philanthropy 400 Survey, Charity Navigator, Guide Star, The Foundation Center, Better Business Bureau’s Wise Giving Alliance and Imagine Canada. We also reviewed the financial information found on the charities’ websites. We compiled the data based on the charities’ fundraising years ending in 2007 through 2011 and used five-year rolling averages for better comparisons. The following children’s charities were identified as our aspirational group: Boys & Girls Clubs of America ($1.4B), Easter Seals Society ($1.2B), ALSAC/St. Jude Children’s Research Hospital ($703M), Shriner’s Children’s Hospitals ($544M). We reviewed the income and expenses reported by our aspirational group, and found the national cost per dollar raised ranged from $0.11 - $0.26 and the combined national and local cost per dollar raised ranged from $0.34 to $0.49. Current Peers We also reviewed our current peers—half the size to double the size of Children’s Miracle Network Hospitals—or North American children’s charities with incomes in the $125 million to $500 million range. Again, we used five year rolling averages. The current peer group included: Make-A-Wish Foundation ($216M), March of Dimes Foundation ($222M) Juvenile Diabetes Research Foundation International ($198M), Muscular Dystrophy $157M; Cystic Fibrosis Foundation ($126M) Again, we reviewed the income and expenses reported by the national organizations and found the national cost per dollar raised in our current peer group ranged from $0.14 to $0.18 with a combined national and local cost per dollar raised in the range of $0.30 to $0.40. Peers’ Funding Methods As we looked at both our aspirational group and our current peers, we examined the ways these organizations fund their national expenses.
1) Using a percentage of the funds raised to pay for national operations is a common practice--March of Dimes, American Heart Association and others are
8
using this model. The available information suggests the percentage used for national operations is anywhere from 5 % to 30%.
2) Membership fees or chapter affiliation fees is another common practice. American Red Cross, United Way, American Cancer Society rely on a this method for a portion of their national operating budget.
3) Corporate Underwriting or Sponsorships is another way many of our peers fund
national operations. The funding provided by corporations is often attached to a specific initiative with benefits to the company.
4) Retail Product Sales / Charity Shops generate some of the funding for national
operations -- Goodwill has had the most success with this model--collecting donated goods and reselling them using a volunteer staff. Last year alone, Goodwill raised $40M through online auctions of donated goods at the website: www.shopgoodwill.com.
5) Social enterprise or a benefit corporation is a relatively new approach of
operating a business for the purpose of creating income for a charity. An example is Head Start in Salt Lake City, which operates a kitchen to provide nutritious meals to the children in the program. They are expanding their services to provide catering. In its third year, the kitchen is now making a profit that can help offset some of the charity operational expenses.
6) Transformational Gifts from Wealthy Individuals such those made in 2012 by
Warren Buffet ($3.9 billion), Mark Zuckerberg ($498.8 million) David Geffen ($100 million) who have the capability of making transformational gifts.
7) Investments – Endowments. Several of our peers have built significant
investments or endowments over the years. The idea is the donor makes a designated contribution and the money is then invested. The initial contribution is never spent, but the earnings from the investment either from growth, dividends or interest, can be used to fund the charity’s operational expenses. ALSAC/St. Jude reported approximately $2.45 billion in assets, and $67 million in investment income. Shriners reported $7 billion in assets, and $670 million in investment income.
Operating Responsibly How can we approach the revision of the operating model responsibly to ensure we operate efficiently without losing sight of the impact we can make for children? To address this question, we looked to the charity reporting agencies. We reviewed the standards set by the Better Business Bureau’s Wise Giving Alliance, Charity Navigator and Imagine Canada Charity Focus to determine how charity ratings may impact any new operating models to be considered. Ratings are based on criteria from financial performance to accountability and transparency measures (Appendix B)

9
TEN-YEAR PROJECTIONS
After a thorough examination of our peers’ financial models and the views of the charity ratings agencies, the committee reviewed Children's Miracle Network Hospitals’ fundraising and cost projections. Fundraising Projections to 2022 The Strategic Plan set the compound annual growth rate needed at 8% overall in order to quadruple fundraising for member hospitals and hospital foundations by 2022. Each fundraising category will have a different growth rate, which is determined by reviewing recent growth and considering future growth potential. We believe the growth rates in every category are both reasonable and achievable based on what we know today. (Appendix C) Cost Projections to 2022 We know what was spent at the national level to raise $300 million. Our costs have been in the range of $0.11 to $0.13 cents per dollar raised for the past several years. In order to determine what budget would be needed by 2022, we identified the key revenue engines—Corporate Partnerships, Youth/Dance Marathon, Radiothon, Hispanic Initiatives, Digital/Extra Life, National Events, Telethon and Direct Mail. We then looked at the cost drivers in each of those categories. From there we projected the budget growth rates required to support fundraising to $1 billion annually by 2022.
National Costs We know that the cost drivers in the Corporate Partnerships category are fundraising campaign materials and staff to build national relationships and develop national campaigns. Corporate Partnerships also require support costs in the areas of Creative Services, Public Relations, Information Technology, Accounting, Insights (data analysis), and Hospital Support. By looking at what we have spent in the past to generate $300 million in fundraising, we can make some assumptions about what we can reasonably expect to spend in the future in these same categories. The primary cost drivers in Programs and Events are staff to build relationships and develop national programs and events. We also know that fundraising events tend to be more expensive and a significant portion of our overall growth will come from new virtual on-line and live national events. Direct mail costs are primarily people, paper, printing and postage. In the start-up phase of a direct mail program, costs can be quite high, but as the donor base grows and renewals increase, costs start to level out.

10
The chart below illustrates the fundraising growth percentage for each category along with projected expense growth percentage to support the fundraising and the range of the cost per dollar raised.
• CAGR: Compound Annual Growth Rate • CPDR: Cost Per Dollar Raised
Another revenue engine in our strategic plan is Innovation. Research and development of new concepts can be quite costly in any business. Many concepts must be developed and market tested in order to achieve one successful launch. In order to achieve our goals in the category, we will develop 20 ideas each year, market test three to four each year and launch one or two. Awareness is an important component in fundraising. We need to increase the investment in this area. There are many ways we can approach this and will develop the plans in collaboration with member hospitals and corporate partners. To summarize national costs, we believe operating expenses will be in the range of $100-$134 million by 2022.
Corporate P
artnerships
Youth /Dance Marathon
Radiothon
Hispanic
Digital /Extra Life
National Events
Telethon
Direct Mail
Fundraising CAGR 8% 22% 2% 20% 37% 39% -3% 4%Expense CAGR 12% 26% 7% 21% 22% 50% 5% 4%CPDR .05-.07 .05-.06 .07-.09 .12-.14 .19-.34 .50-.54 .07-.13 .83-.91
11
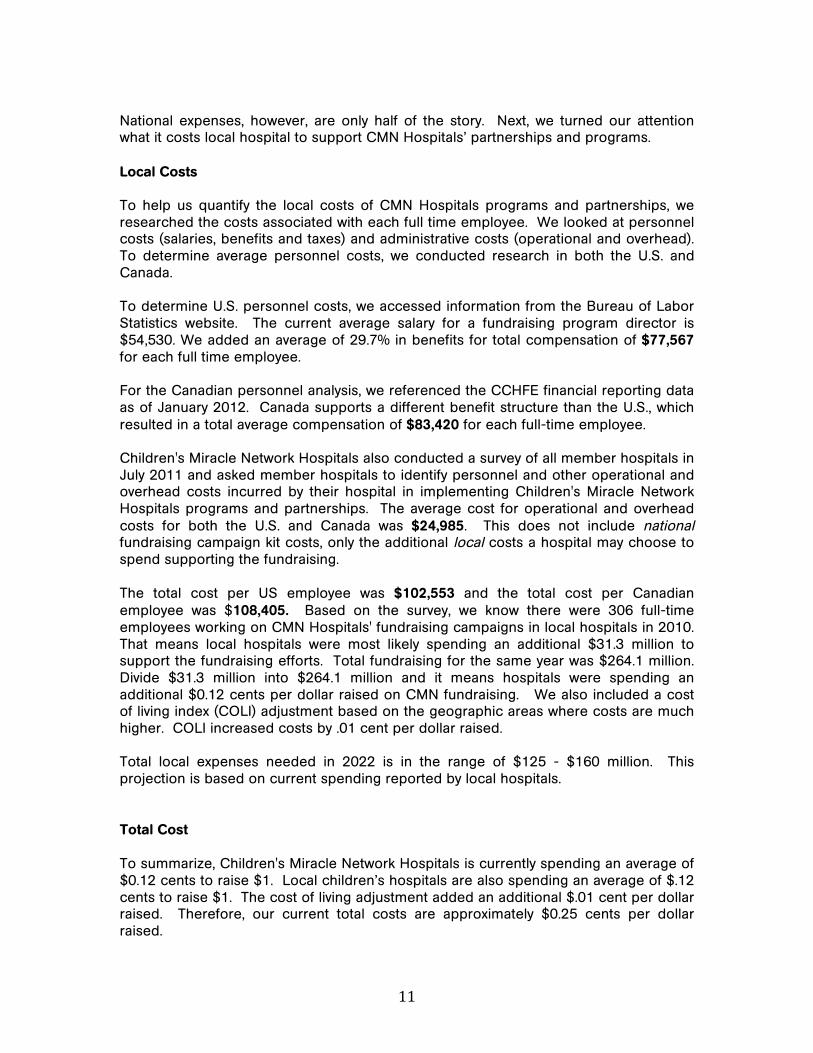
National expenses, however, are only half of the story. Next, we turned our attention what it costs local hospital to support CMN Hospitals’ partnerships and programs. Local Costs To help us quantify the local costs of CMN Hospitals programs and partnerships, we researched the costs associated with each full time employee. We looked at personnel costs (salaries, benefits and taxes) and administrative costs (operational and overhead). To determine average personnel costs, we conducted research in both the U.S. and Canada. To determine U.S. personnel costs, we accessed information from the Bureau of Labor Statistics website. The current average salary for a fundraising program director is $54,530. We added an average of 29.7% in benefits for total compensation of $77,567 for each full time employee. For the Canadian personnel analysis, we referenced the CCHFE financial reporting data as of January 2012. Canada supports a different benefit structure than the U.S., which resulted in a total average compensation of $83,420 for each full-time employee. Children's Miracle Network Hospitals also conducted a survey of all member hospitals in July 2011 and asked member hospitals to identify personnel and other operational and overhead costs incurred by their hospital in implementing Children's Miracle Network Hospitals programs and partnerships. The average cost for operational and overhead costs for both the U.S. and Canada was $24,985. This does not include national fundraising campaign kit costs, only the additional local costs a hospital may choose to spend supporting the fundraising. The total cost per US employee was $102,553 and the total cost per Canadian employee was $108,405. Based on the survey, we know there were 306 full-time employees working on CMN Hospitals' fundraising campaigns in local hospitals in 2010. That means local hospitals were most likely spending an additional $31.3 million to support the fundraising efforts. Total fundraising for the same year was $264.1 million. Divide $31.3 million into $264.1 million and it means hospitals were spending an additional $0.12 cents per dollar raised on CMN fundraising. We also included a cost of living index (COLI) adjustment based on the geographic areas where costs are much higher. COLI increased costs by .01 cent per dollar raised. Total local expenses needed in 2022 is in the range of $125 - $160 million. This projection is based on current spending reported by local hospitals. Total Cost To summarize, Children's Miracle Network Hospitals is currently spending an average of $0.12 cents to raise $1. Local children’s hospitals are also spending an average of $.12 cents to raise $1. The cost of living adjustment added an additional $.01 cent per dollar raised. Therefore, our current total costs are approximately $0.25 cents per dollar raised.

12
Below is a snapshot of the combined US and Canadian projected growth called for in the strategic plan: FUNDRAISING PROJECTIONS
2010 2017 2022 $ 234 M $ 472 M $1 B
COST PROJECTIONS National Operating Cost $ 26 M $ 50-65 M $ 100–130 M Innovation (R&D) $ 0 M $ 4-5 M $ 15-20 M Total National Cost $ 26 M $ 54-$70 M $115-$150 M National CPDR .11¢ .11¢-.15¢ .11¢-.15¢ Local Hospital Cost $ 31 M $ 68-87 M $ 125-160 M Local CPDR .13¢ . .14¢-.18¢ .12¢-.16¢ Combined CPDR .24¢ . .25¢-.28¢. .26¢-.31¢
Based on these estimates, our all-in costs for fundraising at $0.26 to $0.31cents per dollar raised is still below the costs of our aspirational peers. One final note in this cost analysis is the concept of economy of scale. As we develop new partnerships, programs and events, the initial costs may be high in the early years, but as we test and learn more efficient and effective ways of operating, we expect to see costs go down. With a better understanding of what it will cost, we turned our attention to how we can generate the operating funds needed to support the fundraising. WHAT LEVERS CAN WE PULL TO FUND NATIONAL EXPENSES? As we look at each of the options uncovered in the research, there is no perfect solution. Each choice comes with both positive and negative aspects. Any new solution will likely include a blend or combination of the following methods. 1) Using a percentage of the funds raised
• This concept creates a bit of conflict with "All Funds Stay Local". If we move to a business model that is based on a portion of funds raised, we may need to change our messaging to provide more clarity.
• Hospitals would not be required to increase their budgets if expenses were withheld from disbursements.
• Taking fees from proceeds allows hospitals to record the net total as income and expenses are shown on the national side, reducing the local cost per dollar raised.
• Taking fees from proceeds presents a challenge for those who record each individual or location donation in donor management software because the full donation for that individual or location would not be shown, only the amount after expenses.
13
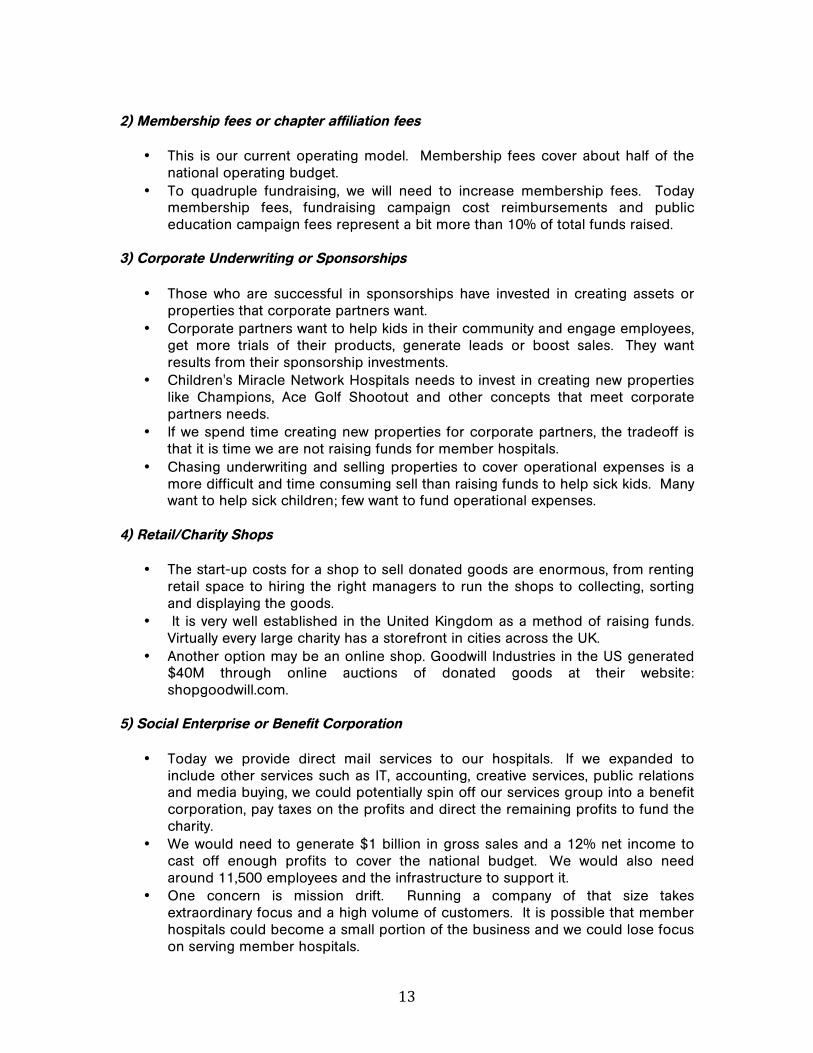
2) Membership fees or chapter affiliation fees
• This is our current operating model. Membership fees cover about half of the national operating budget.
• To quadruple fundraising, we will need to increase membership fees. Today membership fees, fundraising campaign cost reimbursements and public education campaign fees represent a bit more than 10% of total funds raised.
3) Corporate Underwriting or Sponsorships
• Those who are successful in sponsorships have invested in creating assets or properties that corporate partners want.
• Corporate partners want to help kids in their community and engage employees, get more trials of their products, generate leads or boost sales. They want results from their sponsorship investments.
• Children's Miracle Network Hospitals needs to invest in creating new properties like Champions, Ace Golf Shootout and other concepts that meet corporate partners needs.
• If we spend time creating new properties for corporate partners, the tradeoff is that it is time we are not raising funds for member hospitals.
• Chasing underwriting and selling properties to cover operational expenses is a more difficult and time consuming sell than raising funds to help sick kids. Many want to help sick children; few want to fund operational expenses.
4) Retail/Charity Shops
• The start-up costs for a shop to sell donated goods are enormous, from renting retail space to hiring the right managers to run the shops to collecting, sorting and displaying the goods.
• It is very well established in the United Kingdom as a method of raising funds. Virtually every large charity has a storefront in cities across the UK.
• Another option may be an online shop. Goodwill Industries in the US generated $40M through online auctions of donated goods at their website: shopgoodwill.com.
5) Social Enterprise or Benefit Corporation
• Today we provide direct mail services to our hospitals. If we expanded to include other services such as IT, accounting, creative services, public relations and media buying, we could potentially spin off our services group into a benefit corporation, pay taxes on the profits and direct the remaining profits to fund the charity.
• We would need to generate $1 billion in gross sales and a 12% net income to cast off enough profits to cover the national budget. We would also need around 11,500 employees and the infrastructure to support it.
• One concern is mission drift. Running a company of that size takes extraordinary focus and a high volume of customers. It is possible that member hospitals could become a small portion of the business and we could lose focus on serving member hospitals.

14
6) Transformational Gifts from Wealthy Individuals
• If we started up a major gifts program, we would need to invest in staffing and prospect research tools. We would need to make the connections and cut through the competition from every other nonprofit with the same idea.
• Some feel that it would put CMN Hospitals in a competitive position with member hospitals major gift programs while others feel it Is a completely different appeal to major donors.
• To cover the budget, we would need to secure a significant gift every year. Our current national budget is close to $40M and will need to grow at an average annual rate of 13% every year as fundraising results grow reaching $114M in 2022. Is it reasonable to expect we could achieve and sustain gifts in the $40 to $100 million range every year to sustain the budget?
7) Investments – Endowments
• We would need a principle of $ 1 billion that is growing at a rate of 10% annually to generate earnings in the range of $100 million every year.
8) Block or Directed Grants
• This concept would be in addition to a membership fee and would be based on the budgetary needs of the national operations. Hospital/foundation members would allocate additional funding to specific purposes.
ENROLLMENT PROCESS
As the subcommittee begins building a new operating model, we will seek input from our stakeholders on which of the above methods make the most sense. Stakeholder Conversations To ensure we have consulted widely with those who will be affected by a change to the Operating Model, we will engage our stakeholders in conversations between May and September 2013.
• Board of Trustees Meetings May 1-2; July 9-10; Oct 9 • Board of Governors Meeting May 1 and 1:1 May-Sep; Town Hall Call - Sep • Hospital Relations Committee Meeting June 10-11 • Chief Development Officers - 1:1 PVR Meetings & Small Groups June–Aug • Hospital CEOs - 1:1 Hospital PVR Meetings and Town Hall Calls- June - Aug • Hospital Program Directors - 1:1 Hospital PVR Meetings and Town Hall Calls • Corporate Partners – Town Hall Conference Calls - Sep • Hospital and Foundation Leadership 1:1 calls will occur throughout this period • Hospital Test Group (Small & Medium Markets) – Sep • Hospital Test Group (Large Markets) - Sep

15
Online Survey
• Following the above conversations, all stakeholders will be invited to participate in an online survey as a final step in the enrollment process. The survey will be used to give us the statistical data to determine which methods to pursue and which to eliminate.
NEXT STEPS Building A New Operating Model Based on feedback from the network and with the direction of the Board, the Subcommittee will begin developing new models to recommend to the full Board of Trustees at the October 2013 meeting. Evaluating New Operating Models As we consider the levers we can pull to create a new operating model, we want to ensure we are carefully evaluating the impact on member hospitals. The Operating Model Subcommittee developed the following guiding principles along with a scorecard tool to evaluate potential new operating models.
Guiding Principles
1) Scalable: The new model must generate enough funds to cover the projected operating budget needed to quadruple fundraising for member hospitals by 2022.
2) Transparent: The model must be open for scrutiny by key stakeholders.
3) Accountable: The model must provide accountability and return for
invested funds. Changes in membership fees are linked to fundraising results.
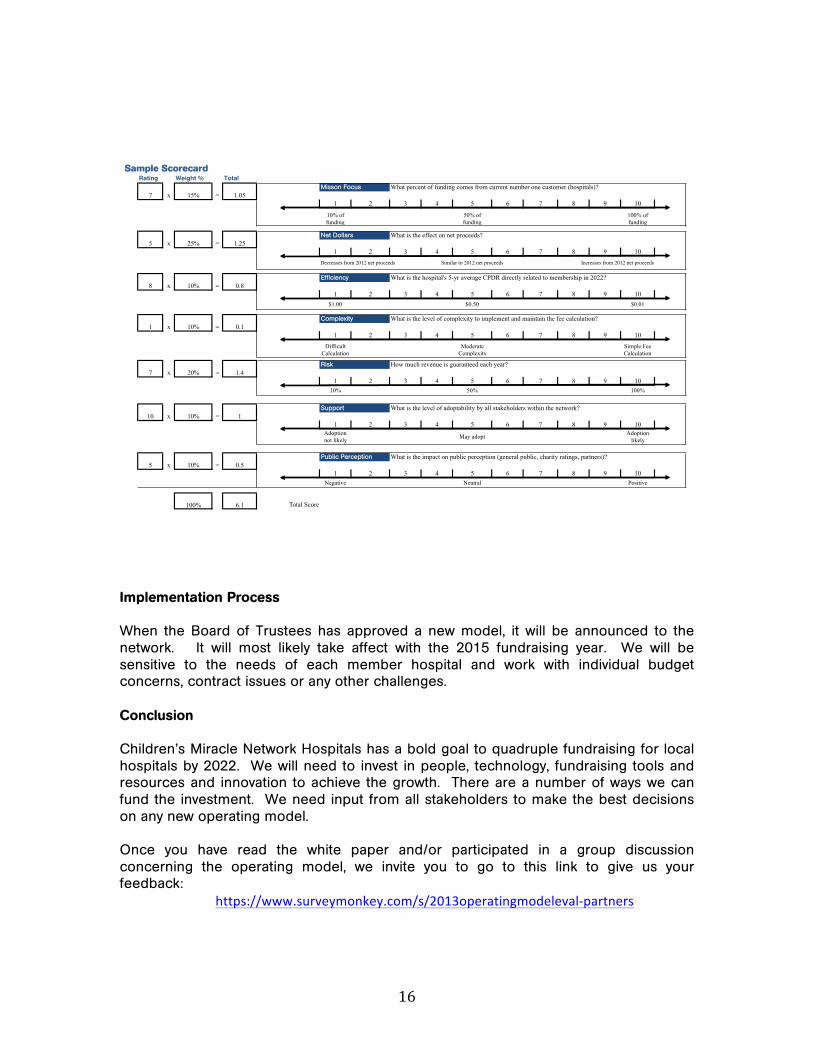
Initially the Subcommittee considered a guiding principle of one model for the US and Canada. However, it was determined that the differences in history, healthcare systems, and operational frameworks may require different solutions. Operating Model Scorecard The scorecard shown below measures the following aspects of any new operating model under consideration: mission focus, net dollars, efficiency, complexity, risk, support and public perception. Each new model will be scored and we will expect to improve the operating model by a minimum of two points above the current model. In addition to the scorecard, we have developed a method to evaluate the impact on every member hospital based on their current investment and results.
16
Implementation Process When the Board of Trustees has approved a new model, it will be announced to the network. It will most likely take affect with the 2015 fundraising year. We will be sensitive to the needs of each member hospital and work with individual budget concerns, contract issues or any other challenges. Conclusion Children’s Miracle Network Hospitals has a bold goal to quadruple fundraising for local hospitals by 2022. We will need to invest in people, technology, fundraising tools and resources and innovation to achieve the growth. There are a number of ways we can fund the investment. We need input from all stakeholders to make the best decisions on any new operating model. Once you have read the white paper and/or participated in a group discussion concerning the operating model, we invite you to go to this link to give us your feedback:
https://www.surveymonkey.com/s/2013operatingmodeleval-‐partners
Sample ScorecardRating Weight % Total
What percent of funding comes from current number one customer (hospitals)? x =
1 2 3 4 5 6 7 8 9 10
10% of funding
50% of funding
100% of funding
What is the effect on net proceeds?x =
1 2 3 4 5 6 7 8 9 10
What is the hospital's 5-yr average CPDR directly related to membership in 2022?x =
1 2 3 4 5 6 7 8 9 10$1.00 $0.50 $0.01
What is the level of complexity to implement and maintain the fee calculation?x =
1 2 3 4 5 6 7 8 9 10
Difficult Calculation
Moderate Complexity
Simple Fee Calculation
How much revenue is guaranteed each year?x =
1 2 3 4 5 6 7 8 9 1010% 50% 100%
What is the level of adoptability by all stakeholders within the network?x =
1 2 3 4 5 6 7 8 9 10Adoption not likely May adopt Adoption
likely
What is the impact on public perception (general public, charity ratings, partners)?x =
1 2 3 4 5 6 7 8 9 10Negative Neutral Positive
Total Score
1
0.5
6.1
1.05
1.25
0.8
0.1
1.4
15%
25%
10%
10%
20%
10%
10%
100%
10
5
7
5
8
1
7Risk
Decreases from 2012 net proceeds Similar to 2012 net proceeds
Support
Public Perception
Increases from 2012 net proceeds
Misson Focus
Net Dollars
Efficiency
Complexity