white paper resiliency microgrids
TRANSCRIPT

Resiliency Microgrids Enabling Cost-Effective Solutions to Both Mitigate Outages from Wildfire and Extreme Weather Risks and to Capture Grid Benefits Published 4Q 2019
Commissioned by Enchanted Rock, LLC Adam Forni Principal Research Analyst
Peter Asmus Research Director
Shayne Willette Research Analyst
WHITE PAPER

Resiliency Microgrids
©2019 Guidehouse Inc. Notice: No material in this publication may be reproduced, stored in a retrieval system, or transmitted by any means, in whole or in part, without the express written permission of Navigant Consulting, Inc.
1
EXECUTIVE SUMMARY
1.1 Bringing Modular and Smart Microgrids to Market
Modular, low cost microgrids can provide long-duration resiliency services to host customer sites while helping integrate variable renewable energy supplies at the grid operations level. The duality such modular microgrids can offer has been clearly demonstrated in the Electricity Reliability Council of Texas (ERCOT) market. Can a similar approach be applied to other markets, such as California, which has faced several long duration outages over the last three years?
In this context, three key trends stand out as affecting the power system in California and beyond:
• The growing market share of intermittent renewables like solar PV and wind.
• This growth in intermittency enhancing the value of dispatchable energy (known as flexible resources, capacity, or resource adequacy) required to integrate renewables and balance the grid.
• Spikes in extreme weather events and wildfires calling for more localized, long-duration, resilient power options beyond traditional backup power preferences.
Deploying smartly resourced microgrids helps address each of these three issues. However, some regulatory constructs stand in the way of releasing the full value of these systems as the world’s electricity markets shift to a greater reliance on distributed energy resources (DER). The issues recommended for reform include resource selection agnosticism, updated rules for integrating resource adequacy (which ties back to transmission-level resource commitments), and a realistic assessment of cleaner alternatives to diesel generators that are still typically the first choice for provision of resilient onsite power.
These hurdles and others preclude creative solutions that could be deployed quickly (and at a lower cost than many alternatives) to help alleviate the effects of California’s policy to reduce wildfire risk through intentional public safety power shutoffs (PSPSs). If regulatory reforms are in place, private capital can be used to help rebuild resilient infrastructure as utilities grapple with the new normal on wildfire risks. California and the rest of the US could create a blueprint that would enable an enhanced sharing economy in the power generation sector, wherein onsite DER is better able to provide services shared between host sites and the larger grid. This, in turn, would allow the near- and behind-the-meter DER to more cost-effectively provide long-duration power that supplements existing investments in distributed renewables—including enabling continued energy production from solar PV systems during a grid outage, which most cannot do.

Resiliency Microgrids
©2019 Guidehouse Inc. Notice: No material in this publication may be reproduced, stored in a retrieval system, or transmitted by any means, in whole or in part, without the express written permission of Navigant Consulting, Inc.
2
A key innovation also driving reduced costs in the microgrid space is a shift toward modularity and standardization. Customized microgrids meet the precise resiliency, economic, and environmental goals of any customer. However, customization often increases both technology and financing costs. An alternative path to market is to standardize components, thereby simplifying installations and shrinking development timelines and costs.
1.2 Modular Microgrid Definition and North America Forecast
Navigant Research, a Guidehouse company, defines modular microgrids in this way:
Modular microgrids meet the basic definitions of a microgrid, with the distinguishing feature being the ability to island and operate autonomously, but include the following attributes: (1) preconfigured key hardware components; (2) ability to tailor operations through software (often in the cloud); and (3) streamlined deployment procedures that reduce the need for onsite engineering during installation.
On a regional basis, North America leads the market and is expected to remain the leader until at least 2029. This leadership position is driven by commercial and industrial (C&I) customer adoption. Companies such as Enchanted Rock, Tecogen, and Bloom Energy are all offering modular microgrids that revolve around low cost natural gas fuels and are often deployed at C&I sites.
Chart 1-1. Annual Modular Microgrid Capacity and Implementation Spending, North America: 2020-2029
(Source: Navigant Research)
$-
$500
$1,000
$1,500
$2,000
$2,500
0
200
400
600
800
1,000
1,200
1,400
1,600
1,800
2,000
2020 2021 2022 2023 2024 2025 2026 2027 2028 2029
($ M
illio
ns)
(MW
)
Institutional/Campus C&I Remote Community Utility Distribution Tactical Military
Resiliency Microgrids
©2019 Guidehouse Inc. Notice: No material in this publication may be reproduced, stored in a retrieval system, or transmitted by any means, in whole or in part, without the express written permission of Navigant Consulting, Inc.
3
Flexible resources that respond quickly, ramp up and down, and operate in ways that minimize GHG emissions (as compared to diesel backup generators and traditional gas peaker plants) are particularly valuable to grid operators in this dynamic environment. Cleaner burning natural gas, if deployed at the distribution level, appears to offer a viable solution—especially if only called upon in rare instances. These instances include unplanned outages or responses to signals from the transmission system that balancing resources are required on short notice to fill in when the wind stops blowing or clouds cover large solar PV farms. Enchanted Rock’s proven and hurricane tested natural gas generator-based microgrids could offer significant value in California as the state responds to the wildfire threat. The company’s solution would also work in other US regions seeking both greater resiliency and a flexible resource that can be called upon to help balance large-scale wholesale wind or solar resources.

Resiliency Microgrids
©2019 Guidehouse Inc. Notice: No material in this publication may be reproduced, stored in a retrieval system, or transmitted by any means, in whole or in part, without the express written permission of Navigant Consulting, Inc.
4
DEFINING CONFLUENT GRID CHALLENGES
2.1 Converging DER Trends Shape the Resiliency Story
Several connected trends shape today’s grid challenges and future opportunities to use distributed energy resources (DER) assets to lower customer costs, reduce emissions, and make the distribution and transmission system more resilient. These include the following:
• Variable renewable DER are proliferating. Growth in variable and intermittent renewable DER is a global phenomenon, and California is among the leaders in terms of current and future capacity additions. As a result, dispatchable resources such as battery energy storage and flexible natural gas generation are increasingly valued by market operators. Dispatchable resources help integrate these intermittent sources (via time shifting, firming, etc.) in locations anywhere from the transmission system to behind the meter (BTM). BTM DER can provide the most value—simultaneously servicing the customer, distribution grid, and transmission grid. Where BTM energy storage growth has been held back by higher capital costs, cheaper natural gas generator sets (gensets), either alone or in tandem with storage, could offer the needed flexibility.
• Electricity consumers demand resilient power especially as outage frequency and duration increase. The digitized, electrified economy is becoming ever more dependent on reliable electricity supplies. Yet, recent extreme weather events and wildfires have rendered the US power grid less reliable. Recent US Energy Information Administration data shows that in 2016, 2017, and 2018, major events accounted for more than half the total customer outage time. Major events in extreme years like 2017 account for a quadrupling of outage durations that would have otherwise occurred.1
• During outages most solar PV shuts down. Despite California adding 7,228 MW of distributed solar PV under the California Solar Initiative2 beginning in 2007 and 2018 —surpassing a state goal of 3,000 MW in three major investor-owned utility (IOU) service territories—most of this capacity is not available during power outages. Due to long-standing safety protocols, the vast majority of solar PV deployed to date shuts off when the larger distribution grid goes down. While recent outages spurred interest in pairing such solar systems with batteries, the goal to sustain long-duration outages with these two resources alone often renders this approach uneconomical for outages 4 hours or longer.
1 EIA 861 data, including https://www.eia.gov/todayinenergy/detail.php?id=37652 2https://www.cpuc.ca.gov/uploadedFiles/CPUC_Public_Website/Content/Utilities_and_Industries/Energy/Energy_Programs/Demand_Side_Management/2019-CSI-APA.pdf.

Resiliency Microgrids
©2019 Guidehouse Inc. Notice: No material in this publication may be reproduced, stored in a retrieval system, or transmitted by any means, in whole or in part, without the express written permission of Navigant Consulting, Inc.
5
• Standby power systems rely on liquid fuels, most often diesel. Thanks to low capital cost and well-established presence, diesel generators are the most prolific form of DER, with an estimated installed base over 150 GW in the US alone. Emissions requirements are less stringent on most diesel generators used for backup power only because it is required that they operate a severely limited number of hours per year. Recent lengthy outages test some of those expectations, however. Typical natural gas gensets have a fraction of the common air pollutants and about 10% less greenhouse gas (GHG) emissions compared to typical diesel gensets. In October 2019, the California Air Resources Board (CARB) stated it will “continue to encourage the development and use of these clean technologies, especially in areas subject to PSPS [public safety power shutoff] events.”3
• Distributed natural gas is hindered from providing resource adequacy in some markets. In California, BTM natural gas-based gensets are disqualified from contributing to resource adequacy in IOU territories unless they have a separate and expensive wholesale generator interconnection.
While markets do not place an economic price to the value of resilience, commercial and industrial (C&I) customers often have internal metrics to reveal how much power outages affected them directly through lost productivity, equipment damage, and customer dissatisfaction. Note that this is a national issue (see Figure 2-1).
Figure 2-1. C&I Outage Frequency by Region, US: 2017
(Source: S&C Electric)
3 CARB, “Use of Back-up Engines for Electricity Generation During Public Safety Power Shutoff Events,” 2019, https://ww2.arb.ca.gov/resources/documents/use-back-engines-electricity-generation-during-public-safety-power-shutoff.

Resiliency Microgrids
©2019 Guidehouse Inc. Notice: No material in this publication may be reproduced, stored in a retrieval system, or transmitted by any means, in whole or in part, without the express written permission of Navigant Consulting, Inc.
6
The S&C Electric report4 noted that 71% of respondents said they own or plan to develop alternative energy sources to supplement their utility power supplies, and 70% see power reliability as an existing cause for concern. This analysis suggests power outages before the PSPS program add up to $18 billion annually for California, which leads the US in number of outages for 9 years in a row (from 2008 through 2017) according to Eaton’s Blackout Tracker.5
Given the series of extreme US weather events since 2011 and the wildfires that have hit California in 2017, 2018, and 2019, a growing pool of customers seek greater resilience since these threats to power reliability appear to be a long-term problem. The costs of such outages—whether intentional or not—can be enormous. Michael Wara, director of Stanford University’s Climate and Energy Policy Program, estimates that the first PSPS event enacted by Pacific Gas and Electric (PG&E) in the fall of 2019 had an economic impact of $1.8 billion. In light of these events, there have been calls by a broad array of stakeholders to update regulations to enable cleaner DER to provide long-duration resilient power when it is most needed—during PSPS events and natural disasters, and to defend against other disruptions like equipment failures and cyber and physical attacks.
4 S&C Electric Company and Frost & Sullivan, S&C’s 2018 State of the U.S. Commercial & Industrial Power Reliability Report, April 23, 2018, https://www.sandc.com/globalassets/sac-electric/documents/sharepoint/documents---all-documents/technical-paper-100-t120.pdf. 5 Eaton, 2018 Blackout Tracker, March 22, 2018 , https://switchon.eaton.com/plug/blackout-tracker.
Resiliency Microgrids
©2019 Guidehouse Inc. Notice: No material in this publication may be reproduced, stored in a retrieval system, or transmitted by any means, in whole or in part, without the express written permission of Navigant Consulting, Inc.
7
MOVING FROM SILOED DER TO GRID-INTERACTIVE MICROGRIDS
3.1 Making Smart Resilient Power Choices with the Expanding DER Palette
Customers face a growing set of DER options for resilient power. Deployments of combined solar PV plus lithium ion (Li-ion) battery storage have grown, thanks in part to significant price declines in both technologies. Navigant Research expects continued growth in both, though there are limitations such as the high cost of long-duration power from batteries (covered in Section 4). A variety of other DER are available, and combinations of these complementary resources are commonly integrated into microgrids for resilient power—often for long durations. Some of these DER include distributed wind, fuel cells, microturbines, and diesel or natural gas reciprocating engine gensets. This section focuses on gensets.
3.2 Smarter Gensets: Innovating a Century-Old Technology
Reciprocating engine gensets are the most widely adopted class of DER, providing standby power to millions of buildings and facilities globally. The technology has been commercially deployed for more than 100 years and is often the de facto choice for onsite power due to the low capital cost, familiarity among service people, and the ability to provide emergency power for days on end.
Gensets are getting smarter and more interactive with other DER and the utility grid. Traditional standby power generation often consists of a genset either manually operated or wired through an automated transfer switch that respond to one type of signal—the loss of utility power—to begin operating. In contrast to their traditional counterparts, smart gensets are defined by their increasing interactivity with humans, other loads and DER, and the larger electrical grid. Navigant Research previously defined the three classifications of smart gensets in the Smart Gensets Market Overview report. Figure 3-1 lists how smart gensets differ from simple gensets.

Resiliency Microgrids
©2019 Guidehouse Inc. Notice: No material in this publication may be reproduced, stored in a retrieval system, or transmitted by any means, in whole or in part, without the express written permission of Navigant Consulting, Inc.
8
Figure 3-1. Smart Genset Classifications
(Source: Navigant Research)
Although smart gensets are not new—they have existed for decades—Navigant Research anticipates significant growth in both the deployment and sophistication of smart gensets in the coming years. The ubiquity of Ethernet and cellular communications enables improved access, while the rapid expansion of computing both in the cloud and at the grid edge provides a platform for aggregating and disseminating data. Customers demand more insights and analytics on the operation of their assets, while requiring higher reliability and better project economics—all of which can be supported by smart gensets. In turn, electricity market operators are pushing for more interactivity with BTM assets as control and analytics are required to enable more open and transparent markets.
3.3 Defining a New Role for Distributed Natural Gas Generators
Natural gas generators have a significant role to play given North America’s plethora of cheap natural gas and the relative lack of economic and logistical options for long-duration power outages (outlined in Section 4). A BTM natural gas generator can be designed to provide the services of a diesel generator (backup power to the local facility) and a natural gas peaker plant (grid services on demand) with lower GHG emissions than either—though the latter is impeded by regulations. (The latter option—replacing a natural gas peaker—would not be available during a PSPS event or a local grid outage.)
Natural gas gensets tend to compare favorably with diesel gensets in terms of economics, emissions, and often reliability. While diesel gensets have lower capital costs, total lifetime costs can be lower for natural gas gensets given the lower cost of fuel, which can be half that of diesel per unit output. Typical natural gas gensets have a fraction of the common air pollutants (such as NOX) and about 10% less GHG emissions compared to typical diesels.
CLASSIFICATION DEFINITION KEY FEATURES MARKET NEED ADDRESSED
Simple Genset Has no smart featuresControlledmanually or responds to loss of utility power
• Basic standby power
Operator-Interactive Genset
Is equipped with telematics for remote monitoring/ control and predictive maintenance
Digitized primary control and monitoring
• Help ensure critical standby power
• Manage fleet profitability• Dispatch maintenance efficiently
Microgrid-Interactive Genset
Is integrated with other local DER like PV, energy storage
Cooperative secondary control and paralleling
• Optimize self-consumption• Provide cleaner long-duration
standby• Displace diesel in remote
locations
Grid-Interactive Genset
Provides energy, other services from behind meter to the larger electric grid
Responsive tertiary control to market conditions, weather
• Capture added value from standby assets
• Support intermittent renewables

Resiliency Microgrids
©2019 Guidehouse Inc. Notice: No material in this publication may be reproduced, stored in a retrieval system, or transmitted by any means, in whole or in part, without the express written permission of Navigant Consulting, Inc.
9
Reliability is defined by a complex formula that must be reviewed against the goals of any given site. Because diesel gensets can ramp quickly and liquid fuel can be stored onsite at ambient pressure, diesel is favored by some facility operators and codes like National Fire Protection Association (NFPA) 110, especially in seismic zones. Conversely, the natural gas grid was found to be more reliable than overland diesel delivery in some cases after recent hurricanes; also, in 2019, the National Renewable Energy Laboratory (NREL)6 found that natural gas generators are less likely to fail during a power outage than diesel generators. (The report also discusses difficulties with diesel deliveries during major events when demand spikes and transportation routes may be blocked, contrasting with the typically unaffected underground natural gas system.) Gensets that are being operated routinely for grid services are also shown to be more reliable to start for backup reasons as compared to those just awaiting the next outage.
3.4 Role of DER Portfolios in Meeting the Reliability Needs of the Grid
Historically, growing DER portfolios, especially variable renewable generation, were seen as challenges to a reliable electricity grid. Early on, when penetrations of such resources were low, transmission system operators ignored these resources because they had little effect on operating their transmission system. More recently, some utilities and grid operators have objected to DER deployments due to concerns over public safety and grid instability issues.
Times have changed. A surge in BTM solar and other DER options still present challenges to grid operations and existing utility business models, but these DER assets—if equipped with the right automation, inverters, and other forms of controls—can help resolve the issues to which they were once seen as contributing. This is especially true if renewables are bundled with dispatchable resources, and ideally at the same distribution level of power service. Grid frequency and voltage issues should be arrested before they can cascade to wholesale market operations.
Creatively aggregating and optimizing diverse DER assets is a strategy playing out in a variety of platforms that range from microgrids to grid-interactive gensets, virtual power plants (VPPs), and DER management systems. As the world relies more on DER technologies, it makes sense to optimize locally as much as possible, all the way down to customer sites. This requires new integration technologies, which have made great advances over the past decade. This evolution in DER optimization has created a path for resources operating at the distribution level to be accessed and presented as solutions at the transmission and distribution levels of power service.
6 Sean Ericson and Dan Olis, A Comparison of Fuel Choice for Backup Generators, National Renewable Energy Laboratory, 2019: https://www.nrel.gov/docs/fy19osti/72509.pdf

Resiliency Microgrids
©2019 Guidehouse Inc. Notice: No material in this publication may be reproduced, stored in a retrieval system, or transmitted by any means, in whole or in part, without the express written permission of Navigant Consulting, Inc.
10
VALUING PRACTICAL RESILIENT DER OPTIONS
4.1 Comparative Analysis: Trade-Offs and Net Benefits
In this section, Navigant Research compares the net present values (NPV) of resilient power systems using NREL’s open-source REopt Lite modeling tool.7 Several considerations for consumers include capital costs and lifetime costs, reliability, expected outage durations, and emissions profiles. We analyze five system configurations:
• Solar PV plus Li-ion battery storage
• Grid interactive natural gas genset
• Diesel genset
• Solar PV plus grid interactive natural gas genset
• Solar PV plus grid interactive natural gas genset plus Li-ion battery storage
We analyzed two use cases: a 0.4 MW grocery store in Napa, California, and a 3 MW hospital in and Santa Rosa, California. We modeled systems designed to withstand a single annual outage ranging in duration from 4 hours to 120 hours (5 days); these outage durations are based on California’s recent multi-day PSPS events and other severe weather events and may become common in the coming decade. The key findings are as follows:
• The highest value configuration is the aggregation of solar PV, storage, and natural gas genset. Solar PV adds value to each of the three systems it is used, thanks in part to its ability to generate clean electricity more cheaply than the grid throughout the modeling period.
• Solar PV plus storage can only economically meet the shortest duration outage requirement, and only for buildings with enough space for solar panels. Without sufficient space, there is limited ability to recharge the batteries.
• For longer duration outages, local generation from some type of backup genset is needed, which can operate as the sole resource or to supplement existing solar PV plus storage systems.
• For larger loads like grocery stores, the natural gas microgrid is a mainstay of the long-duration resilient power systems we analyzed. Its lower price after considering grid
7 NREL, REopt Lite, https://reopt.nrel.gov/tool/.

Resiliency Microgrids
©2019 Guidehouse Inc. Notice: No material in this publication may be reproduced, stored in a retrieval system, or transmitted by any means, in whole or in part, without the express written permission of Navigant Consulting, Inc.
11
interactivity,8 plus its lower emissions and sound levels, often makes it more attractive than alternatives like diesel.
4.1.1 Findings for 0.4 MW Grocery Store
Grocery stores have extensive refrigeration and can be highly valued as community outposts during major outages if onsite power is available. For this modeled system, the following key insights emerge, as seen in Chart 4-1 and Chart 4-2:
• Solar PV plus storage plus natural gas, followed by solar PV plus natural gas, are the two systems with the highest net present values across all durations. The solar PV generates electricity cheaper than the grid throughout the project lifetime, while the natural gas genset provides the long-duration power reliability for outages.
• The NPV of the solar PV plus storage system is positive for short durations, but when approaching 12 hours begins to fall below the traditional fossil-based generation systems. As the outage durations increase, the solar PV plus storage system becomes significantly more expensive due the massive storage requirements. Chart 4-2 provides a more expanded look at solar PV plus storage difficulty to cost-effectively supply power for long duration outages.
Chart 4-1. Net Present Value for 0.4 MW Grocery Store Resilient Power Systems, REopt Model
(Source: Navigant Research)
8 See Section 6 for more details and model assumptions.
(2,000,000)
(1,000,000)
-
1,000,000
4 12 24 72 120
($)
Solar + StorageNatural GasDieselSolar + Natural GasSolar + Storage + Natural Gas

Resiliency Microgrids
©2019 Guidehouse Inc. Notice: No material in this publication may be reproduced, stored in a retrieval system, or transmitted by any means, in whole or in part, without the express written permission of Navigant Consulting, Inc.
12
Chart 4-2. Net Present Value for 0.4 MW Grocery Store Resilient Power Systems, REopt Model
(Source: Navigant Research)
4.1.2 Findings for 3 MW Hospital
Hospitals require standby and emergency power and are typically equipped with diesel generators for 25%-33% of the load. For this modeled system, the following key insights emerge for providing backup to 100% of the load, as seen in Chart 4-3 and Chart 4-4:
• The results are similar to the 0.4 MW grocery store. Increasing outage durations significantly impact the NPVs for the solar PV plus storage configuration compared to the four fossil-based systems. Similar to the grocery store scenario, the NPVs for the fossil-based systems largely track one another relative to the solar PV plus Li-ion storage system.
• The confined roof space on this system—limited to 20,000 square feet to reflect the reality of limited rooftops in many hospital facilities—limits the solar PV system to 217 kW, smaller than the 400 kW system on the grocery store, a much smaller facility. This drops the NPV for all solar PV scenarios twofold: the lifetime revenue generation from bill savings is lower, but more significantly the energy contribution during multi-day outages is also lowered, requiring vastly more battery storage.
(16,000,000)
(14,000,000)
(12,000,000)
(10,000,000)
(8,000,000)
(6,000,000)
(4,000,000)
(2,000,000)
-
2,000,000
4 12 24 72 120
($)
Solar + StorageNatural GasDieselSolar + Natural GasSolar + Storage + Natural Gas

Resiliency Microgrids
©2019 Guidehouse Inc. Notice: No material in this publication may be reproduced, stored in a retrieval system, or transmitted by any means, in whole or in part, without the express written permission of Navigant Consulting, Inc.
13
Chart 4-3. Net Present Values for 3 MW Hospital Resilient Power Systems, REopt Model
(Source: Navigant Research)
Chart 4-4. Net Present Values for 3 MW Hospital Resilient Power Systems, REopt Model
(Source: Navigant Research)
(10,000,000)
(8,000,000)
(6,000,000)
(4,000,000)
(2,000,000)
-4 12 24 72 120
($)
Solar + StorageNatural GasDieselSolar + Natural GasSolar + Storage + Natural Gas
(150,000,000)
(130,000,000)
(110,000,000)
(90,000,000)
(70,000,000)
(50,000,000)
(30,000,000)
(10,000,000)
10,000,000
4 12 24 72 120
($)
Solar + StorageNatural GasDieselSolar + Natural GasSolar + Storage + Natural Gas

Resiliency Microgrids
©2019 Guidehouse Inc. Notice: No material in this publication may be reproduced, stored in a retrieval system, or transmitted by any means, in whole or in part, without the express written permission of Navigant Consulting, Inc.
14
In the REopt model, NPV is expressed as the savings (or costs if negative) realized by the project when revenues and costs are accounted for. Although there are complexities associated with the different revenue generation of DER, NPV is a key metric for comparing these projects on an even basis. Further updates to future studies could include other long-duration energy storage systems not commercialized as widely as Li-ion, such as flow batteries. See Section 6 for the capacity of each DER, as well as other assumptions built into the model. Readers can modify these scenarios using NREL’s open-source tool.
As shown above, grid interactive natural gas gensets can have a significant role to play in the distributed, resilient grid. Solar PV plus storage systems can be effective at generating clean electricity more cheaply than the grid and providing short-duration resilient power. However, in most circumstances they cannot economically address long-duration outages, especially when space for solar PV is constrained. For future longer duration outages like California has already experienced in recent PSPS events, reliable backup power from natural gas gensets can be an attractive choice with lower emissions than alternatives like diesel generators.
4.2 Vision of a Shared Economy Approach to Resilience and Renewable Energy Integration
The sharing economy has created tremendous value in several sectors by breaking down barriers to economic exchanges not thought possible just a short time ago. Perhaps the most ubiquitous examples are ridesharing platforms such as Uber and Lyft. The value is created by a platform to call on these mobility resources in real time and deliver service from assets (motor vehicles) with distributed ownership. The value of these assets has been maximized by software that schedules and then settles each transaction.
This shared economy model is highly relevant to the energy industry. It revolves around concepts such as VPPs—the idea of sharing the value of a grid asset between resiliency at the onsite host and then scheduling for use of this same asset to provide value upstream to a grid network. This model combines two platforms (microgrid and VPP) by throttling back and forth between resiliency at the site (microgrid) and sending energy back into the grid when it is most valuable (VPP).
When referring to a smart genset performing such tasks one could also describe this application as a grid-interactive smart genset. Enchanted Rock is one of the larger players in this space in the US. The company’s total installed capacity to date is approximately 364 MW including front-of-meter installations. This deployed capacity provides resilient power to grocery stores, medical centers, industrial facilities, and other customer sites requiring backup power.
California and the rest of the country would benefit from this shared economy approach. Such a strategy could help meet resource adequacy needs while also firming up local

Resiliency Microgrids
©2019 Guidehouse Inc. Notice: No material in this publication may be reproduced, stored in a retrieval system, or transmitted by any means, in whole or in part, without the express written permission of Navigant Consulting, Inc.
15
resiliency and managing the ever-increasing ratios of renewable energy penetration into control areas such as PJM, New England ISO, Electricity Reliability Council of Texas (ERCOT), New York ISO, and the Midwest ISO. While each control area has its own market rules and dynamics, common goals could help shape markets that invite solutions rather than create barriers to technology and resource innovation.
4.3 Pairing Resiliency Projects with New Business Models
One business model to be paired with flexible natural gas-based microgrids is energy as a service (EaaS), which simplifies operations, reduces capital cost barriers to deployment, and syncs up well with the recent trend on developing modular microgrids. The emergence of modular microgrids flows from lessons learned over the past decade in standard microgrid deployments across the globe. One of the primary challenges facing the microgrid market is the perception that each project is unique and requires significant customized engineering. Many microgrids never seem to make it past the feasibility analysis phase, in part due to this predicament. This bottleneck could frustrate efforts to quickly deploy smart and resilient microgrids in California and other markets.
While few microgrids are exactly alike and, therefore, the idea of standardized configurations seems next to impossible, vendors now offer products and services that are moving the market much closer to a plug-and-play paradigm. One of these vendors is Enchanted Rock, which adds a twist to the general EaaS pitch. The company’s business model helps reduce out of pocket cost to clients by monetizing the microgrid asset via provision of future expected VPP grid services.

Resiliency Microgrids
©2019 Guidehouse Inc. Notice: No material in this publication may be reproduced, stored in a retrieval system, or transmitted by any means, in whole or in part, without the express written permission of Navigant Consulting, Inc.
16
If analyzed by the number of projects deployed, the EaaS business model holds a commanding position globally. If based on capacity, such projects represent approximately one-quarter of all microgrid installed capacity as of 2Q 2019.
Chart 4-5. Market Share of Microgrid Business Models by Project Count, World Markets: 2Q 2019
(Source: Navigant Research)
Owner Financing 11%
Utility Rate-Base 4%
Energy as a Service 81%
Government 2%
Other 2%
Resiliency Microgrids
©2019 Guidehouse Inc. Notice: No material in this publication may be reproduced, stored in a retrieval system, or transmitted by any means, in whole or in part, without the express written permission of Navigant Consulting, Inc.
17
REALIZING THE FULL BENEFITS OF DER WITH A LEVEL PLAYING FIELD
5.1 Leveling the Playing Field Through Smart Regulation
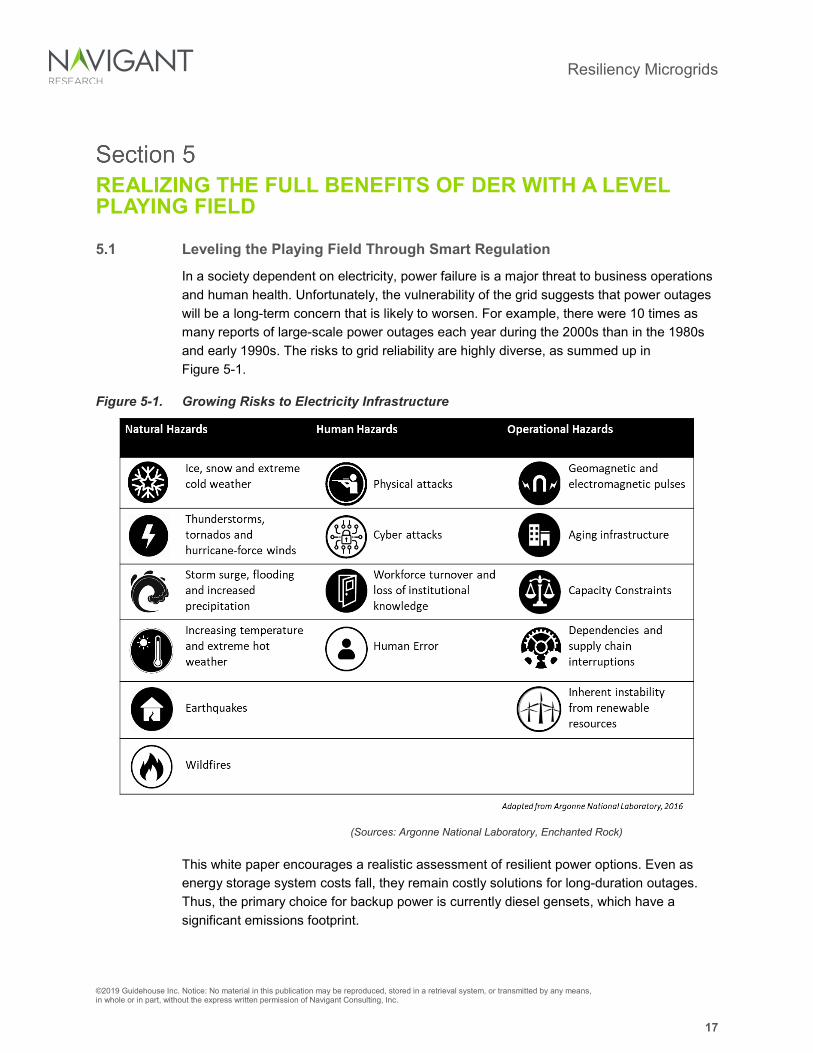
In a society dependent on electricity, power failure is a major threat to business operations and human health. Unfortunately, the vulnerability of the grid suggests that power outages will be a long-term concern that is likely to worsen. For example, there were 10 times as many reports of large-scale power outages each year during the 2000s than in the 1980s and early 1990s. The risks to grid reliability are highly diverse, as summed up in Figure 5-1.
Figure 5-1. Growing Risks to Electricity Infrastructure
(Sources: Argonne National Laboratory, Enchanted Rock)
This white paper encourages a realistic assessment of resilient power options. Even as energy storage system costs fall, they remain costly solutions for long-duration outages. Thus, the primary choice for backup power is currently diesel gensets, which have a significant emissions footprint.

Resiliency Microgrids
©2019 Guidehouse Inc. Notice: No material in this publication may be reproduced, stored in a retrieval system, or transmitted by any means, in whole or in part, without the express written permission of Navigant Consulting, Inc.
18
Aggressive goals are in place to reach near net zero emissions in the coming 3 decades in California and elsewhere. Where fossil-based systems are called for—as reports from NREL, E3, and others have suggested is important in the coming decades of transition—they may be the best controllable distributed assets to provide stacked value by using cleaner burning natural gas and eventually biogas rather than diesel. These systems can enable co-located solar PV systems to ride through outages where they were unable to previously. More generally, they enable the enhanced integration of renewable resources grid-wide by providing resilient, long-duration, dispatchable power. Navigant Research suggests the following regulatory reforms should be given serious consideration by regulators and policymakers.
• Especially where long-duration outages are likely, encourage cleaner options for backup power when compared to diesel gensets, through local air permitting. Given the safety and emissions advantages of natural gas-based backup generators, local air districts and building officials should accommodate this technology choice to reduce health and safety risks whenever possible and feasible.
• Allow direct wholesale energy market participation of all customer-sited microgrids for the entire system BTM regardless of the DER mix deployed within the microgrid. With a single BTM interconnect and the proper metering, accounting for wholesale operation is straightforward.
• Incentivize BTM resiliency microgrids to provide longer durations of continuous backup power based on local needs and outage expectations (e.g., 24 or 72 hours). In exchange for longer duration systems, regulators should expedite required deliverability studies and certify resource adequacy for up to the host customers’ peak load immediately upon interconnect approval. Additional capacity available for exporting to wholesale markets can follow a more traditional timeline.
• Adopt larger-scale utility distribution microgrids to serve neighborhoods, commercial districts, and other critical sensitive loads that have been identified as being vital to overall grid reliability. Allow for utility rate base treatment of long-term resiliency power purchase agreements with private sector providers.
California’s energy future clearly lies with renewable energy, as evidenced by state legislation mandating lowering carbon and reaching 100% clean energy by 2045. Yet the PSPS events, as well as lingering annual wildfire threat and the growth in traditional diesel backup generators, pose unique challenges in the near-term. Regulators need to recognize the growing and changing role BTM DER can provide during power outages—and open the door to creative solutions. There are solutions that allow the state to still meet its stringent air quality goals with a reasonable and realistic approach to providing modular microgrid solutions that can be deployed quickly, and which also offer renewables integration benefits to the larger grid during blue-sky conditions.

Resiliency Microgrids
©2019 Guidehouse Inc. Notice: No material in this publication may be reproduced, stored in a retrieval system, or transmitted by any means, in whole or in part, without the express written permission of Navigant Consulting, Inc.
19
APPENDIX
The tables that follow capture further key assumptions and outputs (in the form of recommended system sizes) associated with the REopt Lite modeling detailed in Section 4.
Table 6-1. REopt Model Key Assumptions, 0.4 MW Grocery Store Inputs Value Unit Focus Resilience Site Location Napa Electricity Rate A10S Land Available 0 Acres Roof Space 40,000 SF Type of Building Supermarket Annual Energy Consumption 2,277,600 kWh Critical Load Factor 100 % Outage Durations 4, 12, 24, 72, 120 Hours Outage Start Date 15-Oct each year Outage Start Time 6:00 p.m. Type of Outage Occurs annually Discount Rate 8.1 % Electricity Cost Escalation 2.6 % PV System Capital Cost 1,600 $/kW Battery Energy Capacity Cost 420 $/kWh Battery Power Capacity Cost 840 $/kW Allow Grid to Charge Battery Yes Natural Gas Generator Install Cost 400 $/kW Natural Gas Fuel Cost 2 $/gal Diesel Generator Install Cost 600 $/kW Diesel Fuel Cost 3 $/gal Fuel Availability 1,000,000,000 gal
Fixed O&M for Natural Gas and Diesel 10 $/kW per year
Variable O&M for Natural Gas and Diesel 0.01 $/kWh
(Source: Navigant Research)

Resiliency Microgrids
©2019 Guidehouse Inc. Notice: No material in this publication may be reproduced, stored in a retrieval system, or transmitted by any means, in whole or in part, without the express written permission of Navigant Consulting, Inc.
20
Table 6-2. REopt Recommended System Sizes, 0.4 MW Grocery Store, 4 Hour Duration
System Units Solar PV Li-Ion Diesel Nat Gas Solar PV + Li-Ion Battery Storage (kW) 400 255 - - Natural Gas Genset (kW) - - - 255 Diesel Genset (kW) - - 255 - Solar PV + Natural Gas Genset (kW) 400 - - 255 Solar PV + Natural Gas + Storage (kW) 400 35 - 219
(Source: Navigant Research)
Table 6-3. REopt Model Key Assumptions, 3 MW Hospital Inputs Value Unit Focus Resilience Site Location Santa Rosa Electricity Rate PG&E E20P Land Available 0.1 Acres Roof Space 20,000 SF Type of Building Hospital Annual Energy Consumption 21,024,000 kWh Critical Load Factor 100 % Outage Durations 4, 12, 24, 72, 120 Hours Outage Start Date 15-Oct each year Outage Start Time 6:00 p.m. Type of Outage Occurs annually Discount Rate 8.1 % Electricity Cost Escalation 2.6 % PV System Capital Cost 1,600 $/kW Battery Energy Capacity Cost 420 $/kWh Battery Power Capacity Cost 840 $/kW Allow Grid to Charge Battery Yes Natural Gas Generator Install Cost 300 $/kW Natural Gas Fuel Cost 2 $/gal Diesel Generator Install Cost 500 $/kW Diesel Fuel Cost 3 $/gal Fuel Availability 1,000,000,000 gal
Fixed O&M for Natural Gas and Diesel 10 $/kW per year
Variable O&M for Natural Gas and Diesel 0.01 $/kWh
(Source: Navigant Research)

Resiliency Microgrids
©2019 Guidehouse Inc. Notice: No material in this publication may be reproduced, stored in a retrieval system, or transmitted by any means, in whole or in part, without the express written permission of Navigant Consulting, Inc.
21
Table 6-4. REopt Recommended System Sizes, 3 MW Hospital, 4 Hour Duration
System
Units
Solar PV Li-Ion Diesel Natural
Gas Solar PV + Li-Ion Battery Storage (kW) 217 1,743 - - Natural Gas Genset (kW) - - - 1,743 Diesel Genset (kW) - - 1,743 - Solar PV + Natural Gas Genset (kW) 217 - - 1,743 Solar PV + Natural Gas + Storage (kW) 217 249 - 1,494
(Source: Navigant Research)
Numerous assumptions, in addition to those listed above, are made when using the REopt model. Most inputs are left as defaults. Notably, no financial incentives are assumed for solar PV and battery systems outside of a default 26% cost reduction for solar PV intended to replicate the federal Investment Tax Credit. The California Self-Generation Incentive Program incentive is not captured in the model.
Below is a key point of deviation from the REopt default values:
• Natural gas gensets were presumed to cost $300/kW to $400/kW (depending on scenario), which includes a capital cost discount based on the Enchanted Rock EaaS business model which monetizes grid revenues.
NREL cautions the following when interpreting results:9
These results assume perfect prediction of both solar irradiance and electrical load. In practice, actual savings may be lower based on the ability to accurately predict solar irradiance and load, and the battery control strategy used in the system. And, when modeling an outage the results assume perfect foresight of the impending outage, allowing the battery system to charge in the hours leading up the outage.
The results include both expected energy and demand savings. However, the hourly model does not capture inter-hour variability of the PV resource. Because demand is typically determined based on the maximum 15-minute peak, the estimated savings from demand reduction may be exaggerated. The hourly simulation uses one year of load data and one year of solar and wind resource data. Actual demand charges and savings will vary from year to year as load and resource vary.
9 NREL, REopt Lite, https://reopt.nrel.gov/tool/.

Resiliency Microgrids
©2019 Guidehouse Inc. Notice: No material in this publication may be reproduced, stored in a retrieval system, or transmitted by any means, in whole or in part, without the express written permission of Navigant Consulting, Inc.
22
ACRONYM AND ABBREVIATION LIST
BTM ...................................................................................................................................... Behind the Meter
C&I ........................................................................................................................ Commercial and Industrial
CAPEX ............................................................................................................................. Capital Expenditure
CARB ............................................................................................................ California Air Resources Board
DER ................................................................................................................. Distributed Energy Resources
EaaS ................................................................................................................................ Energy as a Service
ERCOT ................................................................................................ Electricity Reliability Council of Texas
gal .......................................................................................................................................................... Gallon
genset ....................................................................................................................................... Generator Set
GHG ..................................................................................................................................... Greenhouse Gas
GW .................................................................................................................................................... Gigawatt
IOU ............................................................................................................................... Investor-Owned Utility
kW ...................................................................................................................................................... Kilowatt
kWh ........................................................................................................................................... Kilowatt-Hour
Li-ion .............................................................................................................................................. Lithium Ion
MW .................................................................................................................................................. Megawatt
NFPA ...................................................................................................... National Fire Protection Association
NOX ......................................................................................................................................... Nitrogen Oxide
NPV .................................................................................................................................... Net Present Value
NREL ................................................................................................ National Renewable Energy Laboratory
O&M .................................................................................................................. Operations and Maintenance
PG&E ........................................................................................................................ Pacific Gas and Electric

Resiliency Microgrids
©2019 Guidehouse Inc. Notice: No material in this publication may be reproduced, stored in a retrieval system, or transmitted by any means, in whole or in part, without the express written permission of Navigant Consulting, Inc.
23
PSPS .................................................................................................................. Public Safety Power Shutoff
PV ................................................................................................................................................ Photovoltaic
SF ................................................................................................................................................ Square Feet
US ............................................................................................................................................. United States
VPP .................................................................................................................................. Virtual Power Plant

Resiliency Microgrids
©2019 Guidehouse Inc. Notice: No material in this publication may be reproduced, stored in a retrieval system, or transmitted by any means, in whole or in part, without the express written permission of Navigant Consulting, Inc.
24
SCOPE OF STUDY
This white paper was commissioned by Enchanted Rock and focuses on modular microgrid systems as resilient power solutions in the wake of California’s PSPSs and other grid issues. This paper explores the benefits microgrids offer as a resilient power option, especially in the event of long-duration outages, and how to bring them to market. DER analyzed in this white paper are grid interactive natural gas gensets, solar PV, and Li-ion battery storage. Navigant Research white papers are designed to be objective, third-party documents. As such, Navigant Research does not endorse any specific company or products.
SOURCES AND METHODOLOGY
Navigant Research’s industry analysts utilize a variety of research sources in preparing Research Reports. The key component of Navigant Research’s analysis is primary research gained from phone and in-person interviews with industry leaders including executives, engineers, and marketing professionals. Analysts are diligent in ensuring that they speak with representatives from every part of the value chain, including but not limited to technology companies, utilities and other service providers, industry associations, government agencies, and the investment community.
Additional analysis includes secondary research conducted by Navigant Research’s analysts and its staff of research assistants. Where applicable, all secondary research sources are appropriately cited within this report.
These primary and secondary research sources, combined with the analyst’s industry expertise, are synthesized into the qualitative and quantitative analysis presented in Navigant Research’s reports. Great care is taken in making sure that all analysis is well-supported by facts, but where the facts are unknown and assumptions must be made, analysts document their assumptions and are prepared to explain their methodology, both within the body of a report and in direct conversations with clients.
Navigant Research is a market research group whose goal is to present an objective, unbiased view of market opportunities within its coverage areas. Navigant Research is not beholden to any special interests and is thus able to offer clear, actionable advice to help clients succeed in the industry, unfettered by technology hype, political agendas, or emotional factors that are inherent in cleantech markets.

Resiliency Microgrids
©2019 Guidehouse Inc. Notice: No material in this publication may be reproduced, stored in a retrieval system, or transmitted by any means, in whole or in part, without the express written permission of Navigant Consulting, Inc.
25
Published 4Q 2019
©2019 Guidehouse Inc. 1375 Walnut Street, Suite 100 Boulder, CO 80302 USA Tel: +1.303.997.7609 http://www.navigantresearch.com
Navigant Consulting, Inc., n/k/a Guidehouse Inc. (Navigant),10 has provided the information in this publication for informational purposes only. The information has been obtained from sources believed to be reliable; however, Navigant does not make any express or implied warranty or representation concerning such information. Any market forecasts or predictions contained in the publication reflect Navigant’s current expectations based on market data and trend analysis. Market predictions and expectations are inherently uncertain and actual results may differ materially from those contained in the publication. Navigant and its subsidiaries and affiliates hereby disclaim liability for any loss or damage caused by errors or omissions in this publication.
Any reference to a specific commercial product, process, or service by trade name, trademark, manufacturer, or otherwise, does not constitute or imply an endorsement, recommendation, or favoring by Navigant.
This publication is intended for the sole and exclusive use of the original purchaser. No part of this publication may be reproduced, stored in a retrieval system, distributed or transmitted in any form or by any means, electronic or otherwise, including use in any public or private offering, without the prior written permission of Navigant Consulting, Inc., Chicago, Illinois, USA.
Government data and other data obtained from public sources found in this report are not protected by copyright or intellectual property claims.
Note: Editing of this report was closed on December 4, 2019.
10 On October 11, 2019, Guidehouse LLP completed its previously announced acquisition of Navigant Consulting Inc. In the months ahead, we will be working to integrate the Guidehouse and Navigant businesses. In furtherance of that effort, we recently renamed Navigant Consulting Inc. as Guidehouse Inc. We will continue to perform as proposed during and after this consolidation, using the same personnel and methods described in this report.