white paper tco study for sap on amazon web services (aws) · pdf filewhite paper tco study...
TRANSCRIPT

White Paper TCO Study for SAP on Amazon Web Services (AWS)
Date: February 12, 2013
Author: VMS AG, Burgstrasse 61, Heidelberg, Germany
Tel.: +49 (6221) 4 38 52 – 0, [email protected], www.vms.net

White Paper TCO Study SAP on AWS Content and Design © 2013ff by VMS AG Page 2
Content
1 Executive Summary ........................................................................................................................ 3 2 Amazon Web Service (AWS) .......................................................................................................... 6
Update of previous study ................................................................................................................................... 6 3 Method ........................................................................................................................................... 7
3.1 Background and Approach................................................................................................... 7
3.2 SAP TCO Model .................................................................................................................... 8
3.3 Reference Groups ..............................................................................................................10 3.3.1 Forming Profiles ................................................................................................................................... 10 3.3.2 Profiles for the TCO Study .................................................................................................................... 11
3.4 FAQ – Highlights on some typical TCO related questions .................................................12 3.4.1 What’s In – What’s Out ........................................................................................................................ 12 3.4.2 Pay Only for What You Need ............................................................................................................... 12 3.4.3 The Comparison Base........................................................................................................................... 13 3.4.4 Percentages ......................................................................................................................................... 13
4 Savings by AWS ............................................................................................................................15 4.1 Level 1 Aggregation ...........................................................................................................15
4.2 Level 2 Aggregation ...........................................................................................................17
5 AWS Savings in Detail ...................................................................................................................18 5.1 Hardware/Software Investment ........................................................................................18
5.2 Implementation .................................................................................................................19
5.3 Hardware/Software Ongoing Costs ...................................................................................21
5.4 Operations .........................................................................................................................22
5.5 Continuous Improvement Projects ....................................................................................24
5.6 Upgrade Projects ...............................................................................................................25
6 Appendix – Cloud Worthiness Index (CWI) ..................................................................................26 6.1 Introduction .......................................................................................................................26
6.2 Customer-specific Cloud Worthiness Index .......................................................................27
6.3 Cloud-Provider-specific Cloud Worthiness Index ..............................................................27
Copyright © 2013ff VMS AG
All rights reserved, including those regarding reproduction, copying or other use or communication of the contents of this document or parts thereof. This publication may only be reproduced, processed using electronic retrieval systems, or copied in its entirety. We reserve the right to update or modify the contents.
VMS references and indicates its own trademarks as is practical and appropriate to do so. Other trademarks used in this document are trademarks of their respective owners and will be respected by VMS.
VMS registered trademarks are: VMS, the VMS logo, DNA-level benchmark, VMS Report, VMS Monitor, VMS Process Dashboard, VMS IT Dashboard, VM Solutions, Cloud Worthiness Index, CWI.
SAP, R/3, SAP NetWeaver, Duet, PartnerEdge, ByDesign, SAP BusinessObjects Explorer, StreamWork, and other SAP products and services mentioned herein as well as their respective logos are trademarks or registered trademarks of SAP AG in Germany and other countries. Amazon Web Services, Inc. is a subsidiary of Amazon.com, Inc. Amazon.com is a registered trademark of Amazon.com, Inc.

White Paper TCO Study SAP on AWS Content and Design © 2013ff by VMS AG Page 3
1 Executive Summary
Amazon Web Services (AWS) delivers a set of services that together form a reliable, scalable and inexpensive computing platform “in the cloud”. VMS AG is specialized in analyzing and optimizing SAP landscapes (DNA-level Benchmark for SAP) and owns the largest and most detailed database for SAP operation benchmark results worldwide.
In this white paper, VMS presents its research into the Total Cost of Ownership (TCO) of running and using SAP systems and provides in-depth views of costs involved.
The overall result is a Cloud Worthiness Index (CWI) of 59.
In order to derive this Amazon-specific CWI (for an explanation of the CWI calculation see appendix) VMS compared the following four SAP scenarios running in a dedicated environment (on-premise or outsourced) against running them on AWS:
1. A typical large ERP solution with 6,000 users running on-premises,
2. A typical small ERP solution for 300 users running on-premises,
3. The same ERP solution for 300 users outsourced and managed by an authorized SAP partner,
4. An SAP All-in-One system for 100 users running on-premises.
The study provides an overview of costs associated with running SAP systems over a typical platform related life cycle of 5 years. The comparison of on-premise or outsourced environments to an AWS-cloud-based infrastructure reveals substantial savings of using AWS. The study uses the SAP TCO Model and the VMS Benchmarkbase that holds TCO data from over 2,700 measured SAP systems. It carefully analyzes cost items that are affected by AWS and highlights savings in terms of an overall TCO. For a more in-depth view the study also identifies clearly where AWS has an impact on lowering cost and which areas are not affected.
HIGHLIGHTS
AWS is a public cloud service.
The platform is certified for running SAP solutions.
AWS recently extended the capabilities to accommodate large ERP systems on AWS e.g. 6,000 users, 90,000 SAPS.
Up to 94% savings on storage and server operations.
80% savings on servers for large ERP systems.
Up to 71% savings on the sum of all TCO elements, AWS has an impact on.
No long-term contract or upfront investment required.
Cloud advantages in system provisioning, backups and snapshots.

White Paper TCO Study SAP on AWS Content and Design © 2013ff by VMS AG Page 4
The AWS-specific CWI (Cloud Worthiness Index) aggregates the following detailed calculations:
Savings (5 Years) vs. large ERP (on premises)
vs. small ERP (on premises)
vs. small ERP (outsourcing)
vs. SAP All-in-One (on-premises)
% Savings in overall TCO 16% 18% 15% 22%
% Savings on items that AWS has an impact on
62% 63% 59% 71%
The difference between overall TCO and AWS-impacted-TCO needs a bit of explanation:
The SAP TCO model includes all hardware, software and service components, needed for an implementation plus a 5 year life cycle of an SAP installation. It includes cost components where using AWS makes a difference, e.g. compute capacity and storage. But it also holds components that are not affected by AWS, e.g. like SAP software licensing costs and maintenance fees.
Our research shows that if only those TCO components that are relevant to AWS are taken into account, such as infrastructure and operational costs, AWS offers savings between 59% and 71%.
Beyond lowering platform and operations cost, AWS turns infrastructure costs from being capital expenses (CAPEX) into variable operational costs (OPEX).
The overall 5-year TCO savings when running SAP on AWS ranges between 16% and 22%.
The savings in the areas, where AWS has an impact on, range between 59% and 71%.

White Paper TCO Study SAP on AWS Content and Design © 2013ff by VMS AG Page 5
Amazon, a Fortune 500 company based in Seattle, Washington, is the global leader in e-commerce. Amazon Web Services, Inc. (“AWS”), an Amazon.com company, offers a completely new way to run virtually any business that uses technology. Since officially launched in 2006, AWS has enabled developers and hundreds of thousands of companies of all sizes across 190 countries easy access to AWS suite of infrastructure web services to build their businesses and run their applications in the cloud. Companies incur no up-front expenses or long-term commitments, turn capital expense into variable operating expense, pay only for what is used, add or shed resources quickly, free up scarce engineering resources from the undifferentiated heavy lifting of running their own infrastructure. AWS helps customers focus on work that truly differentiates their business, rather than worrying about the infrastructure. For more information, visit http://aws.amazon.com.
VMS is a service provider based in Heidelberg, Germany. Main service provided is the benchmarking of SAP systems, supported by the VMS Benchmarkbase™, which at this point contains the measured data of more than 2,850 SAP systems, making it the largest and most detailed SAP benchmark database worldwide. For more information, visit www.vms.net.

White Paper TCO Study SAP on AWS Content and Design © 2013ff by VMS AG Page 6
2 Amazon Web Service (AWS)
AWS for SAP is based on:
Amazon Elastic Compute Cloud (Amazon EC2), a web service that provides resizable compute capacity in the cloud.
Amazon Elastic Block Store (EBS), which provides block level storage volumes for use with Amazon EC2 instances.
Amazon Simple Storage Service (Amazon S3), which is used to store and retrieve any amount of data, at any time, from anywhere on the web.
Amazon Virtual Private Cloud (Amazon VPC), which lets you provision a private, isolated section of the Amazon Web Services (AWS) cloud where you can launch AWS resources in a virtual network that you define and connect to your existing IT infrastructure using encrypted IPsec VPN.
AWS provides customers the flexibility to place SAP instances and store data within multiple geographic regions worldwide as well as across multiple Availability Zones within each region. Each Availability Zone is designed as an independent failure zone.
Update of previous study
VMS released a first version of this study in April 2012, when only smaller SAP systems could be run on AWS. This has changed now by more powerful servers and enhancements in the AWS infrastructure, like provisioned IOPS. SAP has responded to these efforts with releasing the SAP business suite for the AWS platform.
Today, it is possible to run a single large ERP system on AWS with up to 90,000 SAPS. This extends AWS capabilities as a strong competitor not only as a cloud platform vendor but also in the SAP outsourcing market.
In this update to the previous study, we extend the investigated landscape by a large ERP environment with a production system of 90,000 SAPS and additional development and test systems. The entire landscape has 120,000 SAPS.
Companies enjoy a fierce competition between platform und computing services providers these days. So we have seen prices drops in all aspects of IT platforms over the last six months, which have been incorporated into this update of the study.
Nevertheless, AWS plays strong here and even improved the savings potential slightly in comparison to other platform offerings.

White Paper TCO Study SAP on AWS Content and Design © 2013ff by VMS AG Page 7
3 Method
This section outlines the method VMS uses to perform the TCO analysis. In this section we discuss in detail the study’s background (section 3.1) and introduce the SAP TCO Model, the basis of the TCO analysis (section 3.2). An outline of the reference groups shows how the reference groups were derived that are later subject to separate cost analysis (section 3.3), followed by Frequently Asked Questions (section 3.4).
3.1 Background and Approach
The goal of this study is to investigate the benefits of the cloud computing architecture for SAP environments and understand the existing benefits (investments, ongoing costs and operations) and expected benefits (for the years of living on an AWS platform to come). The focus is to compare TCO of SAP landscapes running in a traditional setting with same landscapes running in the AWS cloud.
Stages from non-virtualized environments up to cloud computing
The framework for this comparison is the SAP TCO Model (section 3.2); the SAP TCO Model provides a multi-level hierarchy of cost categories. It covers all significant components of a SAP environment (hardware, software, and operations) and considers the complete lifecycle of SAP systems (plan, purchase, roll-out, operate, maintain, fix, change, and improve). By using the SAP TCO Model to calculate the total (and partial) costs of varying scenarios, it is possible to obtain a highly comparable cost overview. The overview allows for the comparison and identification of cost discrepancies in detail, as well as in the total costs.
Although AWS is around for 6 years, SAP deployments on AWS are fairly new and hence the study is limited due to the novelty of the product.
VMS is able to extrapolate the required data from both the features of the product, as well as from the available data of thousands of measured systems in the VMS Benchmarkbase. The VMS Benchmarkbase contains data of more than 2,850 SAP environments, along with their respective costs. VMS analyzes best practices based on detailed measurements along with cost data from the VMS AdaptiveTCO workbench.
Traditional Setup
Typical Unix-like or Windows based SAP landscape
(non-virtualized)
x86 based Environment
Without virtualization
Virtualized Environment
Cloud Computing
Standardized and preconfigured IT
Infrastructure and IT Services

White Paper TCO Study SAP on AWS Content and Design © 2013ff by VMS AG Page 8
3.2 SAP TCO Model
The SAP TCO model covers investment, expenses and activities around running SAP over its entire lifecycle. It is structured hierarchically, consisting of 3 levels originally (levels 1 and 2 are shown in the figure below), each enabling a more detailed view of the subject. To better understand the impact of AWS, VMS provides an even greater level of detail where applicable (section 5). The drill-down helps readers to understand their flow of resources when running SAP. The study covers CAPEX (investments) and OPEX (operational costs) elements. This study is based on a 5 year lifecycle.
Table 3: SAP TCO Model (Level 1 and 2)

White Paper TCO Study SAP on AWS Content and Design © 2013ff by VMS AG Page 9
Remarks:
In this study we do not consider the following elements of the SAP TCO model:
End-User related elements like cost of workplace and business process operation is not in the scope for making a computing platform decision.
The End-User usage second-level category “productivity loss” makes ROI studies look randomly good or bad because even a small figure for loss per hour multiplied with a high number of users will lead to savings that look significant. In reality these savings potential will rarely become effective. For that reason, VMS does not take these costs into account when highlighting TCO.
Cost for WAN traffic is excluded, but may play a role when SAP is outsourced (externally or on AWS).

White Paper TCO Study SAP on AWS Content and Design © 2013ff by VMS AG Page 10
3.3 Reference Groups
The reference group for this study corresponds with SAP’s penetration of these industries. One exception is IT because IT providers appear more likely as customers of VMS in the VMS Benchmarkbase due to their continuous struggle for optimization of running SAP effectively.
Reference Group Share
Manufacturing 36%
Utilities 17%
Finance 10%
Services 12%
IT 12%
HealthCare 9%
Others 4%
Table 5: Distribution according to the number of systems
3.3.1 Forming Profiles
Starting Point
Although SAP is standard software and the TCO model is universally valid, each single company and each SAP installation is unique.
Solution
For the purpose of the study, VMS defines four different profiles that represent typical SAP customer landscape components and provides criteria to explain the differences between the four profiles.
The TCO model is a quite abstract model that groups different aspects of cost over the SAP project lifecycle. With the help of these four company profiles, readers may find themselves within the model more easily.

White Paper TCO Study SAP on AWS Content and Design © 2013ff by VMS AG Page 11
3.3.2 Profiles for the TCO Study
Large ERP Small ERP
(on-premises) Small ERP
(outsourcing) SAP All-in-One (on-premises)
Revenue1 $8,000,000,000 $ 300,000,000 $ 300,000,000 $ 75,000,000
Employees1 40,000 1,000 1,000 300
Users 6,000 300 300 100
Daily active users 3,000 250 250 75
Systems2 3-tier ERP system
line plus one sandbox
3-tier ERP system line
3-tier ERP system line
SAP All-in-One (on premise)
with ERP, BI and CRM functionality.
3-tier ERP system line
Modules All modules are
used FI/CO, PS, LO, MM,
SD, and HR FI/CO, PS, LO, MM,
SD, and HR
ERP functionality: FI/CO, MM, SD with BI dashboards and CRM functionality:
Lead-, Account-, Activity-,
Opportunity,- and Order-Management
Database, P system only3
2,500 GB 500 GB 500 GB 350 GB
SAPS, P system only4
90,000 3,000 3,000 1,000
SLA Availability5 99.5% No 99.5% No
Operation on-premise on-premise outsourcing on-premise
1 Reference for quantification purposes only. This can differ depending on the industry. 2 3-tier system line means development, quality assurance and production system 3 Assumption: Q-systems need the same disk space as the P-systems. 4 Amount of SAPS offered by AWS, the typical amount of SAPS for a system of this size is lower. 5 Service Level Agreement: availability per month.
Table 6: Prototype Profiles

White Paper TCO Study SAP on AWS Content and Design © 2013ff by VMS AG Page 12
3.4 FAQ – Highlights on some typical TCO related questions
3.4.1 What’s In – What’s Out
The SAP TCO model includes all elements necessary to run SAP in the enterprise but excludes end user equipment and WAN network elements to reach them.
The study also excludes initial business process (re)design efforts when implementing SAP for the first time. Those efforts are largely driven by the status and demand of an enterprise but not by the hardware, software, or infrastructure used.
The use of cloud computing, such as AWS, defines a change in landscape architecture. Such a change, especially in business processes, triggers the need for education of IT staff, a one-time effort. Since the steepness of the learning curve is very individual and depends on the individual IT team, it is not considered in this TCO model.
3.4.2 Pay Only for What You Need
With AWS, you can benefit from the economies of scale. You pay a very low rate for the compute capacity you consume. There is no minimum fee and no long-term contracts required. Moving from the capital expenditure (CAPEX) model of an on-premises system to the operational expenditure (OPEX) model of the cloud means that you have operational expenses rather than expenditures of capital assets. So operating statements rather than balance sheet management is used in the calculation of TCO, and this change has a great impact. In addition to providing the flexibility to easily choose the number, size, and configuration of the compute instances you need for your application, AWS provides to SAP customers two different purchasing models that give you the flexibility to optimize your costs.
On-Demand Instances let you pay for compute capacity by the hour with no long-term commitments. This frees you from the costs and complexities of planning, purchasing, and maintaining hardware, and transforms what are commonly large fixed costs into much smaller variable costs. On-Demand Instances also remove the need to buy “safety net” capacity to handle periodic traffic spikes.
Reserved Instances give you the option to make a one-time payment for each instance you want to reserve and in turn receive a significant discount on the hourly charge for that instance. There are three Reserved Instance types (Light, Medium, and Heavy Utilization Reserved Instances) that enable you to balance the amount you pay upfront with your effective hourly price.

White Paper TCO Study SAP on AWS Content and Design © 2013ff by VMS AG Page 13
3.4.3 The Comparison Base
We compare AWS against typical scenarios of systems in use today, including various Unix, Linux, and Windows-based implementations with a variety of database products running on dedicated servers. The base for the comparison is provided by the VMS Benchmarkbase. The Benchmarkbase contains the real-life usage, quality, and cost data of more than 2,850 SAP environments. It covers a broad variety of industries and geographies and accurately reflects the current dissemination of SAP’s products in use.
The distribution of the reference groups is presented on the following pages. The comparison group does not include any mainframe-based installations. From a CAPEX point of view this would lead to even more significant savings when a company switches from mainframe to cloud computing. VMS acknowledges this as a reasonable, albeit rare, step. The focus of this study, however, remains on mainstream elements and attempts to avoid special cases such as this.
3.4.4 Percentages
VMS shows savings as precise percentages (e.g., 22% savings on implementing SAP) rather than as a range (e.g., 15%-30%).
The VMS TCO model allows the calculation of typical savings for the specific defined profile, which VMS doesn’t want to dilute by showing ranges. Of course a new AWS user might come up with slightly different percentages in the end, because the real-world implementation will not be exactly identical to the prototyped profile.

White Paper TCO Study SAP on AWS Content and Design © 2013ff by VMS AG Page 14
How to read the following TCO Level tables
Within the details (section 5), the savings potential is shown on level 3. There are cost elements where using AWS (background light blue/darker) allows SAP to pass on cost savings, but there are also elements that has no influence due to use of AWS, e.g., SAP licenses (background light grey/more light color). On the bottom line, the consolidated savings are shown for each company profile.
SAP TCO Model VMS Weight AWS triggered Savings
Level 1 Level 2 Level 3 Details Large
ERP ERP (on
premise) ERP
(outsourcing) SAP All-in-
One
Hardware/ Software Investment
Technical Infrastructure
Computing Hardware
Application Server W1% AA% BB% CC% DD%
Computing Software
Operating System
W2% - - - -
Consolidated Level 1 Savings: WW% XX % YY% ZZ%
In this example, AWS allows customers to reduce their required investments in the area of Application Server, but not for Operating System. Each cost element has a different weight within its category. Therefore the consolidated savings: WW%, XX%, YY%, and ZZ%, are lower in comparison to Application Server related savings: AA%, BB%, CC% and DD%. Please do not simply add up percentages since this will give you wrong results. Percentages multiplied by weight might be added.

White Paper TCO Study SAP on AWS Content and Design © 2013ff by VMS AG Page 15
4 Savings by AWS
4.1 Level 1 Aggregation
Overall TCO savings of the SAP Application Lifecycle for the three scenarios is as shown below:
SAP TCO model Savings by AWS in %
Level 1 Weight Large ERP ERP (on premise) ERP (outsourcing) SAP All-in-One
Hardware/Software Investment
11% 22% 15% 2% 29%
Implementation 9% 26% 39% 36% 39%
Hardware/Software Ongoing Cost
12% 19% 9% 19% 17%
Operations 33% 2% 2% 1% 2%
Continuous Improvement Projects
20% 22% 37% 35% 45%
Upgrade Projects 15% 23% 38% 33% 45%
Consolidated 16% 17% 15% 22%
Table 7: Level 1 Aggregation
As you can see, the major savings are in the area of infrastructure investment and implementation. This is because, when you use the cloud, you don’t need any capital investments except the license cost for SAP and the database.
The second major area of savings is around projects. Here the advantage is that AWS capacity can be added or released right as you need it.
Operations (application management and support) remain the biggest cost driver in SAP environments. Systems and application management widely exceed more obvious and directly measurable costs such as infrastructure investments. AWS does not have a direct impact on application operations and hence the savings seem low. However, because they have a very high impact on TCO, the potential savings (savings percentage multiplied by weight) are huge.

White Paper TCO Study SAP on AWS Content and Design © 2013ff by VMS AG Page 16
On the following pages savings up to level 3 of the SAP TCO model will be detailed and combined with arguments that look at the AWS solution. Looking at different TCO elements, similar reasons for cost reduction will re-occur.
Taking a second view with only the elements that are relevant to AWS, the picture looks different:
EXTRACT EXTRACT: AWS triggered savings
Level 1 Only elements, where the operational model has an impact on
Weight Large ERP ERP (on premise) ERP (outsourcing) SAP All-in-One
Hardware/Software Investment
6% 100% 100% 100% 100%
Implementation 16% 56% 63% 59% 63%
Hardware/Software Ongoing Cost
10% 88% 71% 83% 76%
Operations 4% 94% 70% 60% 58%
Continuous Improvement Projects
31% 52% 58% 56% 65%
Upgrade Projects 34% 52% 57% 52% 64%
Consolidated 62% 63% 59% 71%
When considering only the items that are relevant to AWS, you can see significant savings over on-premises deployments.
Impact: a variety of different hardware investments; planning and setup of infrastructure; ongoing costs for hosting and operating servers and storage; implementation of test and training systems.
No impact: license cost and maintenance fee; business tasks and project management during implementation, upgrade or continuous improvement; incident and problem management, change management, process design.
26%
74%
Impact
No impact

White Paper TCO Study SAP on AWS Content and Design © 2013ff by VMS AG Page 17
4.2 Level 2 Aggregation
SAP TCO Model AWS triggered savings
Level 1 Level 2 Weight Large ERP ERP (on
premise) ERP (outs.)
SAP All-in-One
Hardware/Software Investment
Technical Infrastructure
2% 100% 100% - 100%
System Software 2% 27% 13% - 16%
Application Software 8% - - - -
Implementation Process Design 1% 45% 45% 37% 45%
Organizational Change
1% - - - -
Technical Setup 1% 90% 90% 88% 90%
Business Setup 2% - - - -
Project Mgt. 1% - - - -
Testing 1% 35% 35% 35% 35%
Training 2% 35% 35% 35% 35%
Hardware/Software Ongoing Cost
Technical Infrastructure
1% 96% 64% 82% 73%
System Software 2% 32% 14% - 17%
Application Software 7% - - -
Operations System Operations 5% 24% 35% 15% 16%
Application Operations
32% - - - -
Continuous Improvement Projects
Continuous Business Improvement
15% 18% 31% 30% 42%
Continuous Technical Improvement
1% 90% 90% 90% 90%
Rollouts 2% 40% 40% 40% 40%
Upgrade Projects Application Upgrade 12% 18% 31% 30% 42%
System Upgrade 2% 55% 55% 55% 55%
Table 8: Level 2 Aggregation

White Paper TCO Study SAP on AWS Content and Design © 2013ff by VMS AG Page 18
5 AWS Savings in Detail
5.1 Hardware/Software Investment
SAP TCO Model VMS AWS triggered savings
Level 1 Level 2 Level 3 Details Weight Large ERP
ERP (on premise)
ERP (outs.)
SAP All-in-One
Hardware/ Software Investment
Technical Infrastructure
Computing Hardware
Application Server 2% 100% 100% - 100%
Database Server
2% 100% 100% - 100%
Storage 7% 100% 100% - 100%
Backup Hardware
2% 100% 100% - 100%
Network 0% 100% 100% - 100%
System Software
Computing Software
Operating System
0% 100% 100% - 100%
Database 16% - - - -
Tools 2% 100% 100% 100% 100%
Backup Software
4% 100% 100% 100% 100%
Application Software
Licenses 65% - - - -
Consolidated Level 1 Savings: 22% 15% 2% 29%
Table 9: Hardware/Software Investment
Where are the potential savings of between 2% and 29% in the Hardware/Software Investment category coming from?
This answer is very simple: When AWS is used there are no required up-front costs, except for the SAP and database license. The server, storage, data center, and software tools are included in the monthly price of AWS. Therefore, the savings compared to on-premises solutions are high.
Since AWS is a type of outsourcing, the comparison with “traditional” outsourcing doesn’t show big effects.
Considering the TCO for AWS, we note that 81% of the implementation costs for AWS are independent of the operation mode. These costs are for the SAP license and database.
White Paper TCO Study SAP on AWS Content and Design © 2013ff by VMS AG Page 19
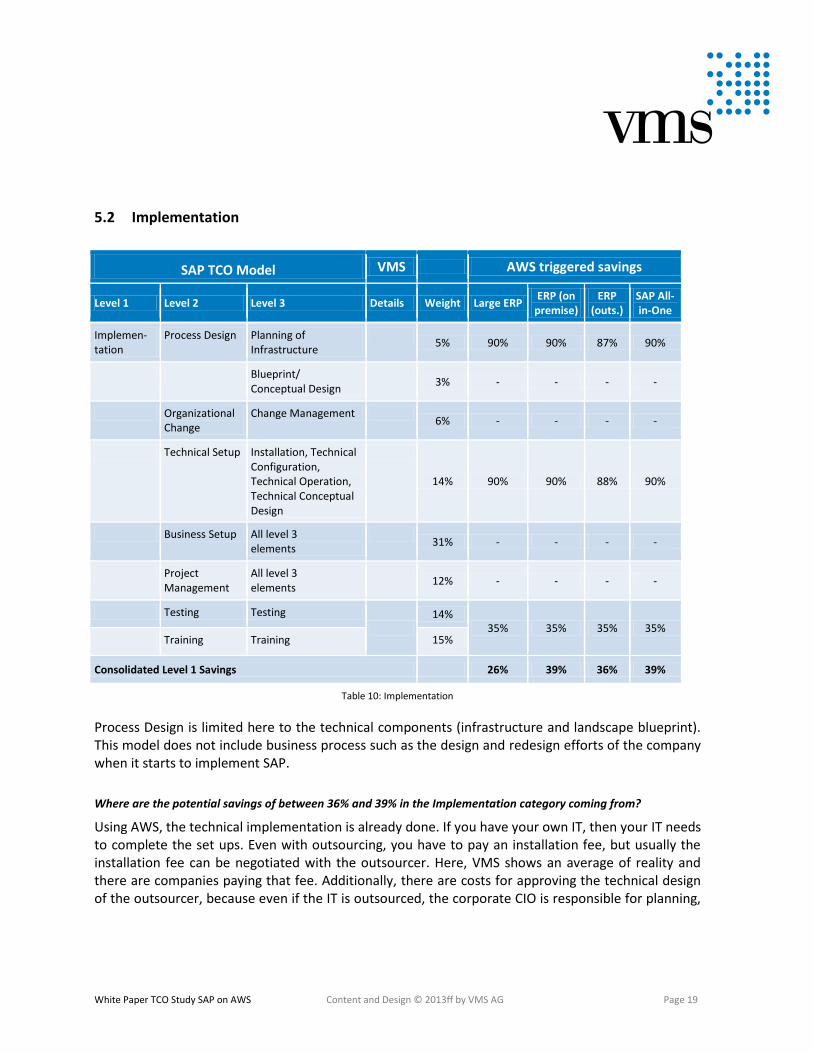
5.2 Implementation
SAP TCO Model VMS AWS triggered savings
Level 1 Level 2 Level 3 Details Weight Large ERP ERP (on
premise) ERP
(outs.) SAP All-in-One
Implemen-tation
Process Design Planning of Infrastructure
5% 90% 90% 87% 90%
Blueprint/ Conceptual Design
3% - - - -
Organizational Change
Change Management 6% - - - -
Technical Setup Installation, Technical Configuration, Technical Operation, Technical Conceptual Design
14% 90% 90% 88% 90%
Business Setup All level 3 elements
31% - - - -
Project Management
All level 3 elements
12% - - - -
Testing Testing
14%
35% 35% 35% 35% Training Training 15%
Consolidated Level 1 Savings 26% 39% 36% 39%
Table 10: Implementation
Process Design is limited here to the technical components (infrastructure and landscape blueprint). This model does not include business process such as the design and redesign efforts of the company when it starts to implement SAP.
Where are the potential savings of between 36% and 39% in the Implementation category coming from?
Using AWS, the technical implementation is already done. If you have your own IT, then your IT needs to complete the set ups. Even with outsourcing, you have to pay an installation fee, but usually the installation fee can be negotiated with the outsourcer. Here, VMS shows an average of reality and there are companies paying that fee. Additionally, there are costs for approving the technical design of the outsourcer, because even if the IT is outsourced, the corporate CIO is responsible for planning,

White Paper TCO Study SAP on AWS Content and Design © 2013ff by VMS AG Page 20
blueprint, and conceptual design of the SAP infrastructure. Only the planning for the integration into the existing IT landscape is required.
The provisioning and management of SAP training and test systems can be simplified and accelerated by cloning and recovery functions.
Surrounding systems of a SAP landscape (e.g., middleware and Add-Ons) can be hosted and operated on AWS as well.
Companies with large ERP systems have a higher effort for change management or business setup. Installing and running such a system on AWS does not change these costs. Therefore the saving potential with 26% is lower than those of smaller companies.

White Paper TCO Study SAP on AWS Content and Design © 2013ff by VMS AG Page 21
5.3 Hardware/Software Ongoing Costs
SAP TCO Model VMS AWS triggered savings
Level 1 Level 2 Level 3 Details Weight Large ERP ERP (on
premise) ERP
(outs.) SAP All-in-One
Hardware/ Software Ongoing Cost
Technical Infrastructure
Computing Hardware
Application Server
2% 79% 28% 60% 37%
Database Server
2% 81% 28% 60% 37%
Storage 9% 80% 85% 93% 92%
Backup Hardware
2% 87% 56% - 56%
Network 1% 100% 100% 100% 100%
System SW Computing SW
Operating System
0% 100% 100% 100% 100%
Database 12% - - - -
Tools 2% 100% 100% 100% 100%
Backup Software
3% 100% 100% 100% 100%
Application Software
Maintenance Fees
67% - - - -
Consolidated Level 1 Savings 19% 11% 20% 22%
Table 11: Hardware/Software Ongoing Costs
Where are the potential savings of between 11% and 22% in the Hardware/Software Ongoing Costs category coming from?
There is an effect similar to the one in the investments category. When we consider TCO, most of the AWS costs are independent of the operation model (maintenance cost for the SAP license and database).
The flexibility of AWS in providing computing and storage resources prevents immediate additional investments due to typically slighter changes in hardware needs by individual systems. If needed, AWS offers easy scalability as it is possible to expand the capacity of the AWS infrastructure without re-arranging existing landscape elements. Considering only server and storage, the savings by AWS are huge. Especially storage has a potential of over 80% for all SAP systems. For the large ERP with 120,000 SAPS in total the advantage of Cloud computing is much more visible than for small installations.

White Paper TCO Study SAP on AWS Content and Design © 2013ff by VMS AG Page 22
5.4 Operations
SAP TCO Model VMS AWS triggered savings
Level 1 Level 2 Level 3 Details Weight Large ERP
ERP (on premise)
ERP (outs.)
SAP All-in-One
Opera-tions
System Operations
System Monitoring Storage, Server, OS
0% 89% 55% 53% 23%
Database 0% - - - -
SAP Basis 1% - - - -
System Administration
Storage, Server, OS
1% 100% 100% 100% 100%
Database 1% - - - -
SAP Basis 2% - - - -
Backup 1% 86% 44% 20% 33%
User Administration
2% - - - -
System Problem Management
Storage, Server, OS
0% 89% 55% 53% 23%
Database 0% - - - -
SAP Basis, Early Watch
1% - - - -
Software Change Management
- 1% - - - -
System Service Desk & Incident Mgt.
- 1% - - - -
General/ Administrative Costs
- 1% - - - -
Application Operations
Monitoring, Administration, Problem Mgt., Software Change Mgt., Service Desk, General Administration
-
88% - - - -
Consolidated Level 1 Savings 2% 3% 1% 2%
Table 12: Operations

White Paper TCO Study SAP on AWS Content and Design © 2013ff by VMS AG Page 23
Where are the potential savings of up to 3% in the Operations category coming from?
The largest part of operations is Application Support (Incident & Problem Management), which mainly belongs to Application Operations. This part is independent of the operational model, so there are no savings. So the overall savings are low, between 1% and 3% due to the technical part.

White Paper TCO Study SAP on AWS Content and Design © 2013ff by VMS AG Page 24
5.5 Continuous Improvement Projects
SAP TCO Model VMS AWS triggered savings
Level 1 Level 2 Level 3 Details Weight Large ERP ERP (on
premise) ERP
(outs.) SAP All-in-One
Continuous Improvement Projects
Continuous Business Improvement
Process Design 4% - - - -
Organizational Changes
5% - - - -
Technical Setup
10% 90% 90% 90% 90%
Business Setup
30% - - - -
Interfaces 5% - - - -
Project Management
13% - - - -
Testing
14% 35% 35% 35% 35%
Training 9%
Continuous Technical Improvement
Continuous Technical Improvement
3% 90% 90% 90% 90%
Rollouts Rollouts 7% 40% 40% 40% 40%
Consolidated Level 1 Savings 22% 37% 35% 45%
Table 13: Continuous Improvement Projects
Where are the potential savings of between 22% and 45% in the Continuous Improvement Projects category coming from?
Business effort will stay the same independent of running SAP on AWS, but the technical setup on AWS is much easier. When AWS is used, you just add another resource that you need. The simple expansion and scaling of SAP instances, in the case of higher demand due to an increasing number of users or new functions, is based on the ability to expand the capacity of AWS infrastructures. The AWS architecture is very flexible and extensible. The provisioning and management of SAP training and test systems can be simplified and accelerated using cloning and recovery functions.
Fallback scenarios (return to original state in case of failure) are available right out of the box. Here we see again the difference between a large and a small company: Small companies have a much lower share of business related effort within their projects, so the technical share is higher, leading to the fact that the relative saving potential is higher than that of a larger company.

White Paper TCO Study SAP on AWS Content and Design © 2013ff by VMS AG Page 25
5.6 Upgrade Projects
SAP TCO Model VMS AWS triggered savings
Level 1 Level 2 Level 3 Details Weight Large ERP ERP (on
premise) ERP
(outs.) SAP All-in-
One
Upgrade Projects
Application Upgrade
Process Design 3% - - - -
Organizational Changes
5% - - - -
Technical Setup
10% 90% 90% 90% 90%
Business Setup 28% - - - -
Interfaces 5% - - - -
Project Management
13% - - - -
Testing 14% 35% 35% 35% 35%
Training 9%
System Upgrade
System Upgrade
13% 55% 55% 55% 55%
Consolidated Level 1 Savings 23% 38% 33% 45%
Table 14: Upgrade Projects
Where are the potential savings of between 23% and 45% in the Upgrade Projects category coming from?
Business effort will stay the same independent of running SAP on AWS, but the technical setup is much easier on AWS. When AWS is used, you just add another resource that you need. The simple expansion and scaling of SAP instances, in the case of higher demand due to an increasing number of users or new functions, is based on the ability to expand the capacity of AWS infrastructures. The AWS architecture is very flexible and extensible.
The provisioning and management of SAP training and test systems can be simplified and accelerated using cloning and recovery functions.
Fallback scenarios (return to original state in case of failure) are available right out of the box.

White Paper TCO Study SAP on AWS Content and Design © 2013ff by VMS AG Page 26
6 Appendix – Cloud Worthiness Index (CWI)
6.1 Introduction
Everybody “knows” that one of the key benefits of the cloud is its – perceived or real – economic value. But virtually nobody can actually quantify the economic value of the cloud in financial terms. Nobody knows how many dollars could be generated by leveraging the cloud for their SAP environment.
Thus VMS AG has decided to make the economic value of the cloud easily quantifiable and comparable. Based on our insights of more than 2,700 SAP systems we have derived the so-called Cloud Worthiness Index (CWI).
The CWI can be characterized as follows:
True indicator of the economic value of cloud platforms.
Easily understandable and comparable simple number between 1 and 10.
For Cloud Providers the cloud-platform-specific CWI ranges from 10 to 100.
Expressing the customer-specific cost savings potential in Dollars/Euros.
For Cloud Providers it is the cloud-platform-specific cost savings potential.
Leveraging best practices of more than 2,700 SAP systems.
Applicable to all leading cloud platforms.
Applicable to Private AND Public Cloud platforms.
Applicable to SAP HANA.
Independent of VMS.
We know that there is a public interest in quantifying the economic value of cloud platforms. Hence we have donated our vast benchmarking intelligence in the form of the CWI to the community of interested SAP customers and partners. In order to foster the usage of the CWI we would be more than happy to answer any questions regarding the CWI as fast as possible.
White Paper TCO Study SAP on AWS Content and Design © 2013ff by VMS AG Page 27
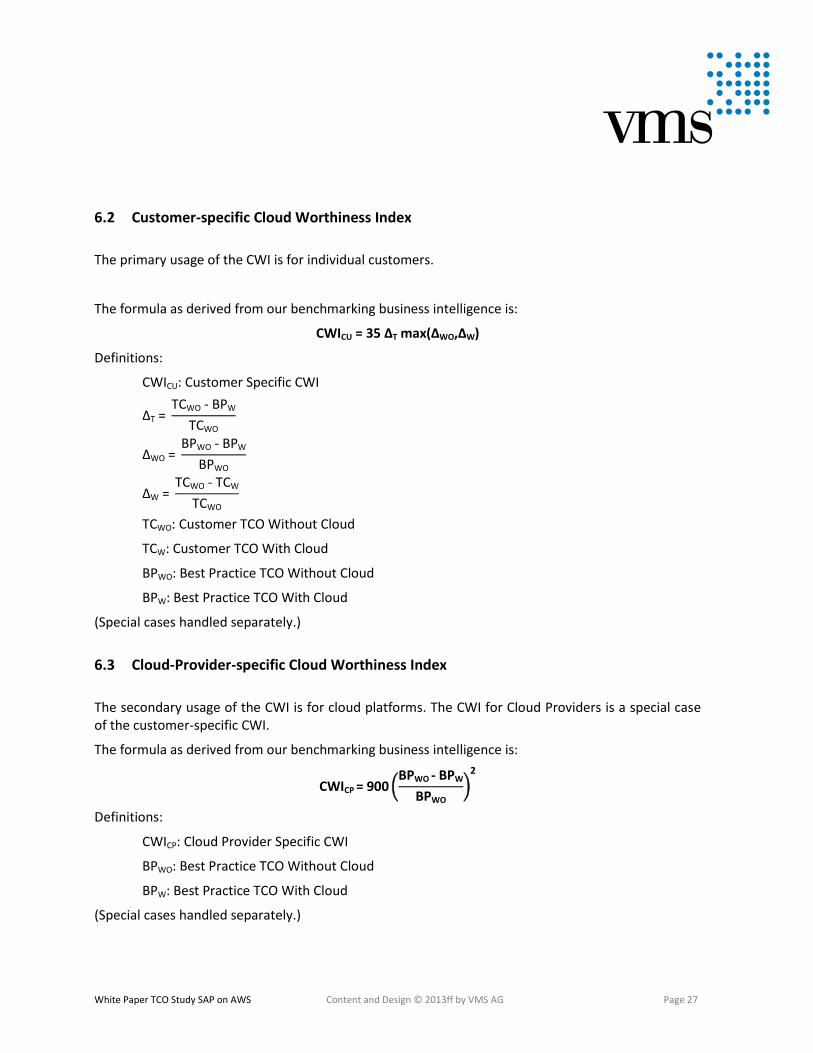
6.2 Customer-specific Cloud Worthiness Index
The primary usage of the CWI is for individual customers.
The formula as derived from our benchmarking business intelligence is:
CWICU = 35 ΔT max(ΔWO,ΔW)
Definitions:
CWICU: Customer Specific CWI
CWO BPW
CWO
WO BPWO BPW
BPWO
W CWO CW
CWO
TCWO: Customer TCO Without Cloud
TCW: Customer TCO With Cloud
BPWO: Best Practice TCO Without Cloud
BPW: Best Practice TCO With Cloud
(Special cases handled separately.)
6.3 Cloud-Provider-specific Cloud Worthiness Index
The secondary usage of the CWI is for cloud platforms. The CWI for Cloud Providers is a special case of the customer-specific CWI.
The formula as derived from our benchmarking business intelligence is:
CWICP ( PWO PW
PWO
)
Definitions:
CWICP: Cloud Provider Specific CWI
BPWO: Best Practice TCO Without Cloud
BPW: Best Practice TCO With Cloud
(Special cases handled separately.)

White Paper TCO Study SAP on AWS Content and Design © 2013ff by VMS AG Page 28
VMS AG Headquarter: Burgstrasse 61 69121 Heidelberg Office Berlin: Woerther Strasse 27 10405 Berlin Germany www.vms.net E-mail [email protected] Tel. + 49 6221 4 38 52 - 0 Fax + 49 6221 4 38 52 – 22