whitehaven coal limited - home - australian securities …€¦ · · 2017-02-16graeme rigg is a...
TRANSCRIPT
Whitehaven Coal Limited
HALF YEAR RESULTS FY2017
17 FEBRUARY 2017
Australia’s Leading High Quality Coal Company
For
per
sona
l use
onl
y
Disclosure
2 //
STATEMENTS CONTAINED IN THIS MATERIAL, PARTICULARLY THOSE REGARDING THE POSSIBLE OR ASSUMED FUTURE PERFORMANCE, COSTS, DIVIDENDS,
RETURNS, PRODUCTION LEVELS OR RATES, PRICES, RESERVES, POTENTIAL GROWTH OF WHITEHAVEN COAL LIMITED, INDUSTRY GROWTH OR OTHER TREND
PROJECTIONS AND ANY ESTIMATED COMPANY EARNINGS ARE OR MAY BE FORWARD LOOKING STATEMENTS. SUCH STATEMENTS RELATE TO FUTURE EVENTS
AND EXPECTATIONS AND AS SUCH INVOLVE KNOWN AND UNKNOWN RISKS AND UNCERTAINTIES. ACTUAL RESULTS, ACTIONS AND DEVELOPMENTS MAY DIFFER
MATERIALLY FROM THOSE EXPRESSED OR IMPLIED BY THESE FORWARD LOOKING STATEMENTS DEPENDING ON A VARIETY OF FACTORS.
THE PRESENTATION OF CERTAIN FINANCIAL INFORMATION MAY NOT BE COMPLIANT WITH FINANCIAL CAPTIONS IN THE PRIMARY FINANCIAL STATEMENTS
PREPARED UNDER IFRS. HOWEVER, THE COMPANY CONSIDERS THAT THE PRESENTATION OF SUCH INFORMATION IS APPROPRIATE TO INVESTORS AND NOT
MISLEADING AS IT IS ABLE TO BE RECONCILED TO THE FINANCIAL ACCOUNTS WHICH ARE COMPLIANT WITH IFRS REQUIREMENTS.
ALL DOLLARS IN THE PRESENTATION ARE AUSTRALIAN DOLLARS UNLESS OTHERWISE NOTED.
COMPETENT PERSONS STATEMENT
INFORMATION IN THIS REPORT THAT RELATES TO COAL RESOURCES AND COAL RESERVES IS BASED ON AND ACCURATELY REFLECTS REPORTS PREPARED BY
THE COMPETENT PERSON NAMED BESIDE THE RESPECTIVE INFORMATION. GREG JONES IS A PRINCIPAL CONSULTANT WITH JB MINING SERVICES. PHILLIP
SIDES IS A SENIOR CONSULTANT WITH JB MINING SERVICES. BEN THOMPSON IS A GEOLOGIST WITH WHITEHAVEN COAL. JOHN ROGIS IS A GEOLOGIST WITH
WHITEHAVEN COAL. RICK WALKER IS A GEOLOGIST WITH WHITEHAVEN COAL. GRAEME RIGG IS A FULL TIME EMPLOYEE OF RUNGEPINCOCKMINARCO LTD.
DOUG SILLAR IS A FULL TIME EMPLOYEE OF RUNGEPINCOCKMINARCO LTD. SHAUN TAMPLIN IS A FULL TIME EMPLOYEE OF TAMPLIN RESOURCES PTY LTD.
JAMES SMITH IS A SENIOR MINING ENGINEER WITH WHITEHAVEN COAL. MICHAEL BARKER IS A FULL TIME EMPLOYEE OF PALARIS LTD.
NAMED COMPETENT PERSONS CONSENT TO THE INCLUSION OF MATERIAL IN THE FORM AND CONTEXT IN WHICH IT APPEARS. ALL COMPETENT PERSONS
NAMED ARE MEMBERS OF THE AUSTRALIAN INSTITUTE OF MINING AND METALLURGY AND/OR THE AUSTRALIAN INSTITUTE OF GEOSCIENTISTS AND HAVE THE
RELEVANT EXPERIENCE IN RELATION TO THE MINERALISATION BEING REPORTED ON BY THEM TO QUALIFY AS COMPETENT PERSONS AS DEFINED IN THE
AUSTRALIAN CODE FOR REPORTING OF EXPLORATION RESULTS, MINERAL RESOURCES AND ORE RESERVES (THE JORC CODE, 2012 EDITION).
ADDITIONAL INFORMATION
ANY REFERENCES TO RESERVE AND RESOURCE ESTIMATES SHOULD BE READ IN CONJUNCTION WITH THE WHITEHAVEN’S ORE RESERVES AND COAL
RESOURCES STATEMENT FOR ITS COAL PROJECTS AT 31 MARCH 2016 AS RELEASED TO THE AUSTRALIAN SECURITIES EXCHANGE ON 15 AUGUST 2016.
WHITEHAVEN CONFIRMS IN SUBSEQUENT PUBLIC REPORTS THAT IT IS NOT AWARE OF ANY NEW INFORMATION OR DATA THAT MATERIALLY EFFECTS THE
INFORMATION INCLUDED IN THE RELEVANT MARKET ANNOUNCEMENT AND IN THE CASE OF ESTIMATES OF COAL RESOURCES OR ORE RESERVES, THAT ALL
MATERIAL ASSUMPTIONS AND TECHNICAL PARAMETERS UNDERPINNING THE ESTIMATES IN THE RELEVANT MARKET ANNOUNCEMENT CONTINUE TO APPLY
AND HAVE NOT MATERIALLY CHANGED.
HALF YEAR RESULTS PRESENTATION FY2017
For
per
sona
l use
onl
y
– Highlights
– Safety
– Financial Performance
– Operations
– Community
– Outlook for Coal Use
– Outlook for Whitehaven
– Appendices
– Additional Information
Agenda
HALF YEAR RESULTS PRESENTATION FY20173 //
For
per
sona
l use
onl
y
Highlights
HALF YEAR RESULTS PRESENTATION FY20174 //
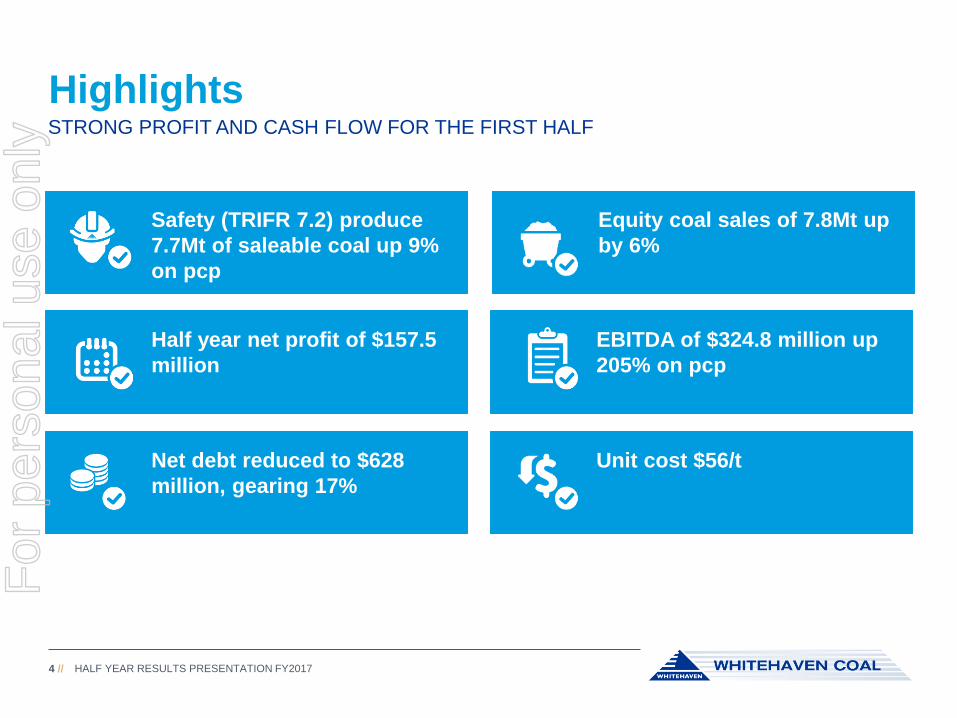
Profitable half year at cycle lows
Profitable half year at cycle lows
Safety (TRIFR 7.2) produce
7.7Mt of saleable coal up 9%
on pcp
Equity coal sales of 7.8Mt up
by 6%
Half year net profit of $157.5
million
EBITDA of $324.8 million up
205% on pcp
Net debt reduced to $628
million, gearing 17%
Unit cost $56/t
STRONG PROFIT AND CASH FLOW FOR THE FIRST HALF
For
per
sona
l use
onl
y

Safety
For
per
sona
l use
onl
y
Safety Performance
HALF YEAR RESULTS PRESENTATION FY20176 //
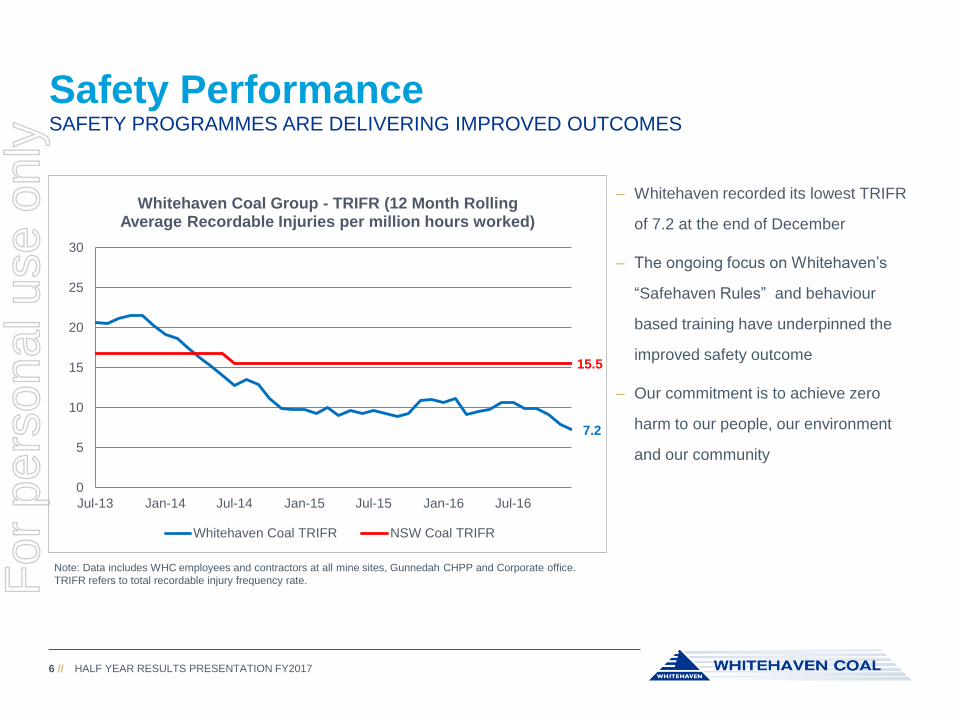
– Whitehaven recorded its lowest TRIFR
of 7.2 at the end of December
– The ongoing focus on Whitehaven’s
“Safehaven Rules” and behaviour
based training have underpinned the
improved safety outcome
– Our commitment is to achieve zero
harm to our people, our environment
and our community
7.2
15.5
0
5
10
15
20
25
30
Jul-13 Jan-14 Jul-14 Jan-15 Jul-15 Jan-16 Jul-16
Whitehaven Coal Group - TRIFR (12 Month Rolling Average Recordable Injuries per million hours worked)
Whitehaven Coal TRIFR NSW Coal TRIFR
Note: Data includes WHC employees and contractors at all mine sites, Gunnedah CHPP and Corporate office.
TRIFR refers to total recordable injury frequency rate.
SAFETY PROGRAMMES ARE DELIVERING IMPROVED OUTCOMES
For
per
sona
l use
onl
y
Financial Performance
For
per
sona
l use
onl
y
Financial Highlights
HALF YEAR RESULTS PRESENTATION FY20178 //
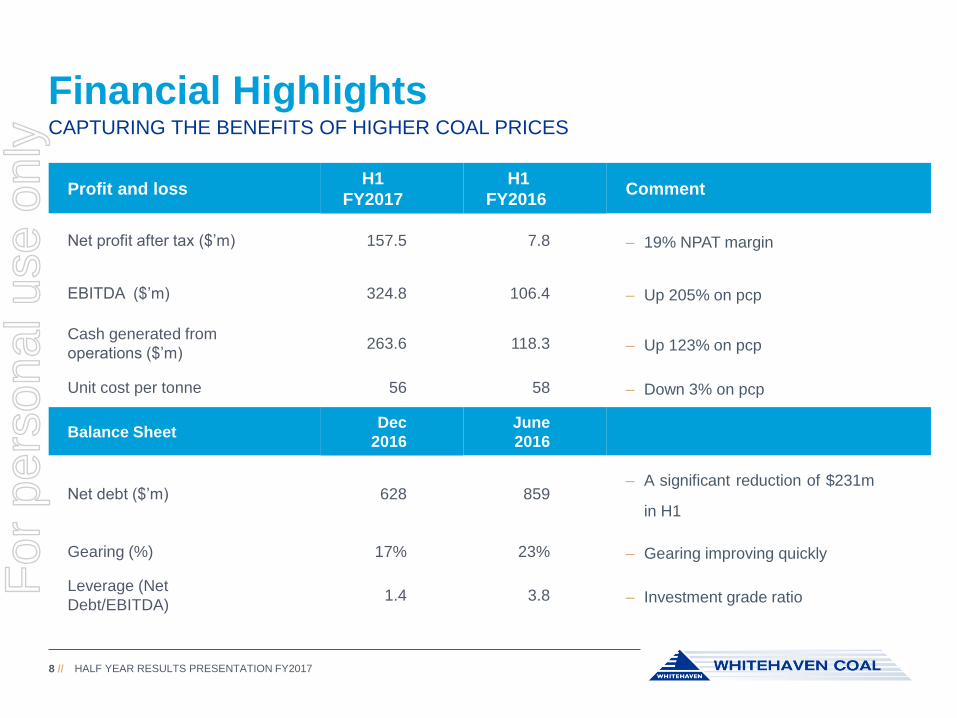
CAPTURING THE BENEFITS OF HIGHER COAL PRICES
Profit and lossH1
FY2017
H1
FY2016Comment
Net profit after tax ($’m) 157.5 7.8 – 19% NPAT margin
EBITDA ($’m) 324.8 106.4 – Up 205% on pcp
Cash generated from
operations ($’m)263.6 118.3 – Up 123% on pcp
Unit cost per tonne 56 58 – Down 3% on pcp
Balance SheetDec
2016
June
2016
Net debt ($’m) 628 859– A significant reduction of $231m
in H1
Gearing (%) 17% 23% – Gearing improving quickly
Leverage (Net
Debt/EBITDA)1.4 3.8 – Investment grade ratioF
or p
erso
nal u
se o
nly
Strong Profit Growth
HALF YEAR RESULTS PRESENTATION FY20179 //
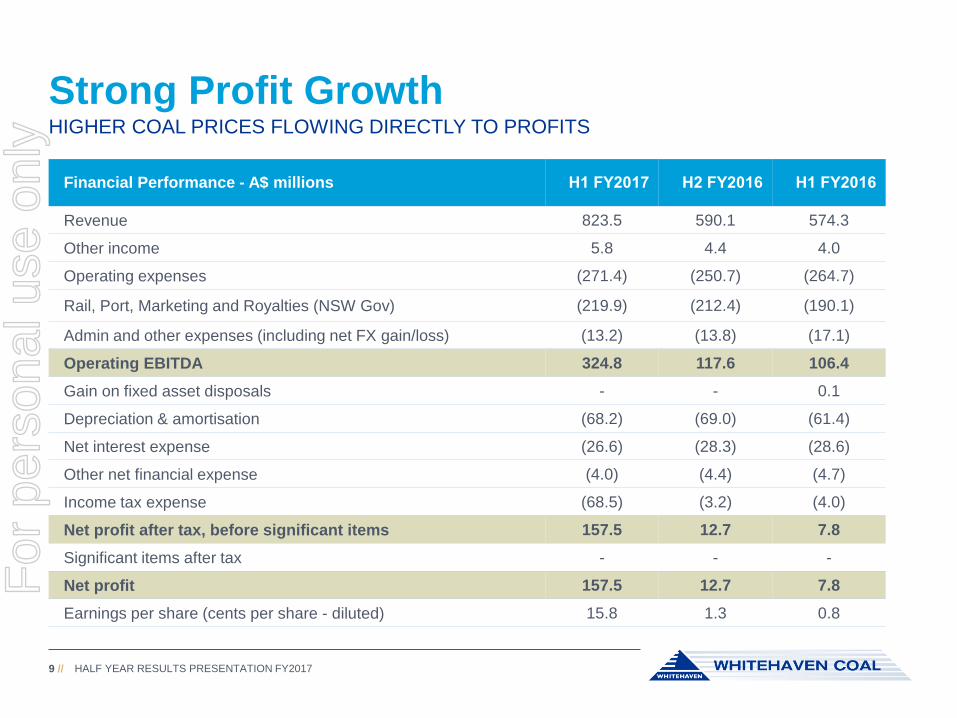
HIGHER COAL PRICES FLOWING DIRECTLY TO PROFITS
Financial Performance - A$ millions H1 FY2017 H2 FY2016 H1 FY2016
Revenue 823.5 590.1 574.3
Other income 5.8 4.4 4.0
Operating expenses (271.4) (250.7) (264.7)
Rail, Port, Marketing and Royalties (NSW Gov) (219.9) (212.4) (190.1)
Admin and other expenses (including net FX gain/loss) (13.2) (13.8) (17.1)
Operating EBITDA 324.8 117.6 106.4
Gain on fixed asset disposals - - 0.1
Depreciation & amortisation (68.2) (69.0) (61.4)
Net interest expense (26.6) (28.3) (28.6)
Other net financial expense (4.0) (4.4) (4.7)
Income tax expense (68.5) (3.2) (4.0)
Net profit after tax, before significant items 157.5 12.7 7.8
Significant items after tax - - -
Net profit 157.5 12.7 7.8
Earnings per share (cents per share - diluted) 15.8 1.3 0.8
For
per
sona
l use
onl
y
Revenue and Margin Increasing
HALF YEAR RESULTS PRESENTATION FY201710 //
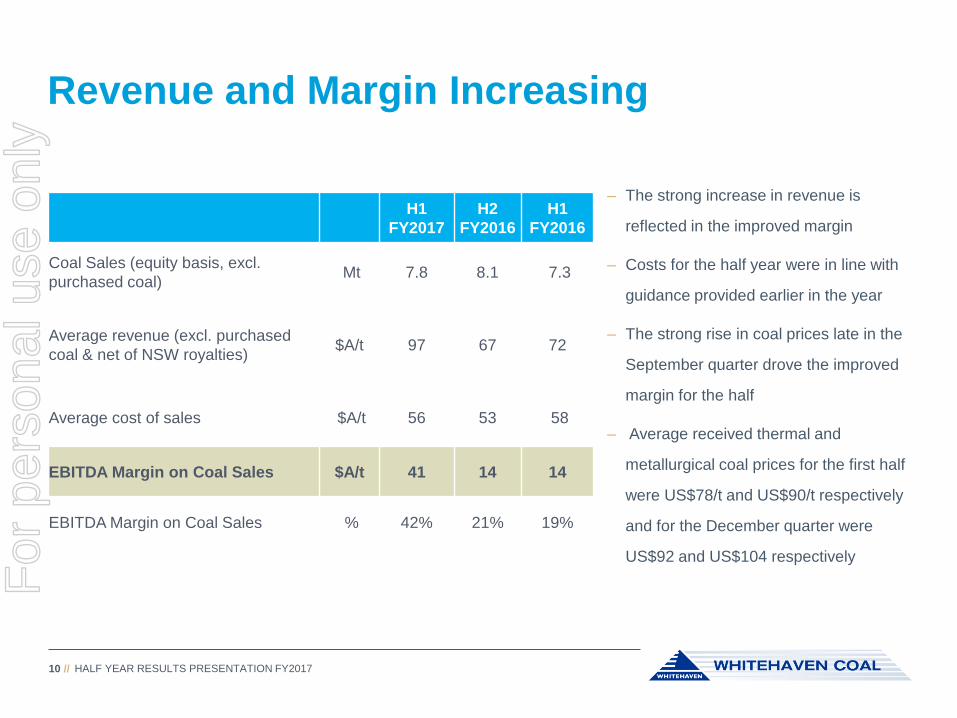
– The strong increase in revenue is
reflected in the improved margin
– Costs for the half year were in line with
guidance provided earlier in the year
– The strong rise in coal prices late in the
September quarter drove the improved
margin for the half
– Average received thermal and
metallurgical coal prices for the first half
were US$78/t and US$90/t respectively
and for the December quarter were
US$92 and US$104 respectively
H1
FY2017
H2
FY2016
H1
FY2016
Coal Sales (equity basis, excl.
purchased coal) Mt 7.8 8.1 7.3
Average revenue (excl. purchased
coal & net of NSW royalties)$A/t 97 67 72
Average cost of sales $A/t 56 53 58
EBITDA Margin on Coal Sales $A/t 41 14 14
EBITDA Margin on Coal Sales % 42% 21% 19%
For
per
sona
l use
onl
y
Balance Sheet
HALF YEAR RESULTS PRESENTATION FY201711 //
STRENGTHENING QUICKLY
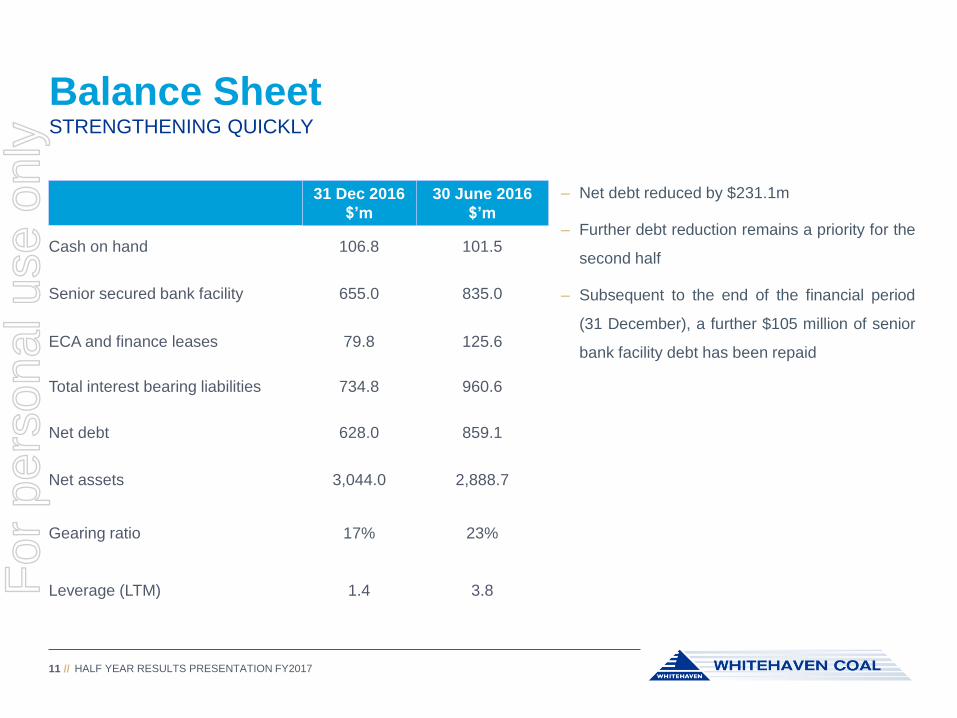
– Net debt reduced by $231.1m
– Further debt reduction remains a priority for the
second half
– Subsequent to the end of the financial period
(31 December), a further $105 million of senior
bank facility debt has been repaid
31 Dec 2016
$’m
30 June 2016
$’m
Cash on hand 106.8 101.5
Senior secured bank facility 655.0 835.0
ECA and finance leases 79.8 125.6
Total interest bearing liabilities 734.8 960.6
Net debt 628.0 859.1
Net assets 3,044.0 2,888.7
Gearing ratio 17% 23%
Leverage (LTM) 1.4 3.8For
per
sona
l use
onl
y
Capital Allocation
HALF YEAR RESULTS PRESENTATION FY201712 //
SUSTAINING CAPEX BEING MAINTAINED AND GROWTH CAPEX DECLINING
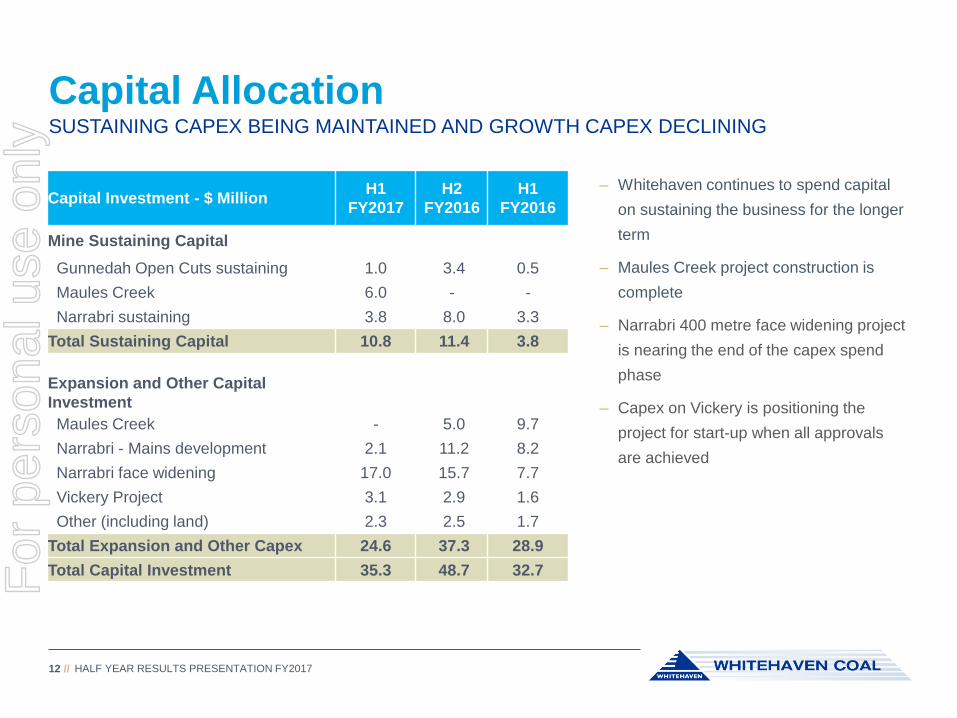
– Whitehaven continues to spend capital
on sustaining the business for the longer
term
– Maules Creek project construction is
complete
– Narrabri 400 metre face widening project
is nearing the end of the capex spend
phase
– Capex on Vickery is positioning the
project for start-up when all approvals
are achieved
Capital Investment - $ MillionH1
FY2017
H2
FY2016
H1
FY2016
Mine Sustaining Capital
Gunnedah Open Cuts sustaining 1.0 3.4 0.5
Maules Creek 6.0 - -
Narrabri sustaining 3.8 8.0 3.3
Total Sustaining Capital 10.8 11.4 3.8
Expansion and Other Capital
Investment
Maules Creek - 5.0 9.7
Narrabri - Mains development 2.1 11.2 8.2
Narrabri face widening 17.0 15.7 7.7
Vickery Project 3.1 2.9 1.6
Other (including land) 2.3 2.5 1.7
Total Expansion and Other Capex 24.6 37.3 28.9
Total Capital Investment 35.3 48.7 32.7For
per
sona
l use
onl
y

Operations
For
per
sona
l use
onl
y
Coal Sales
HALF YEAR RESULTS PRESENTATION FY201714 //
STRONG INCREASE IN SALES FROM MAULES CREEK
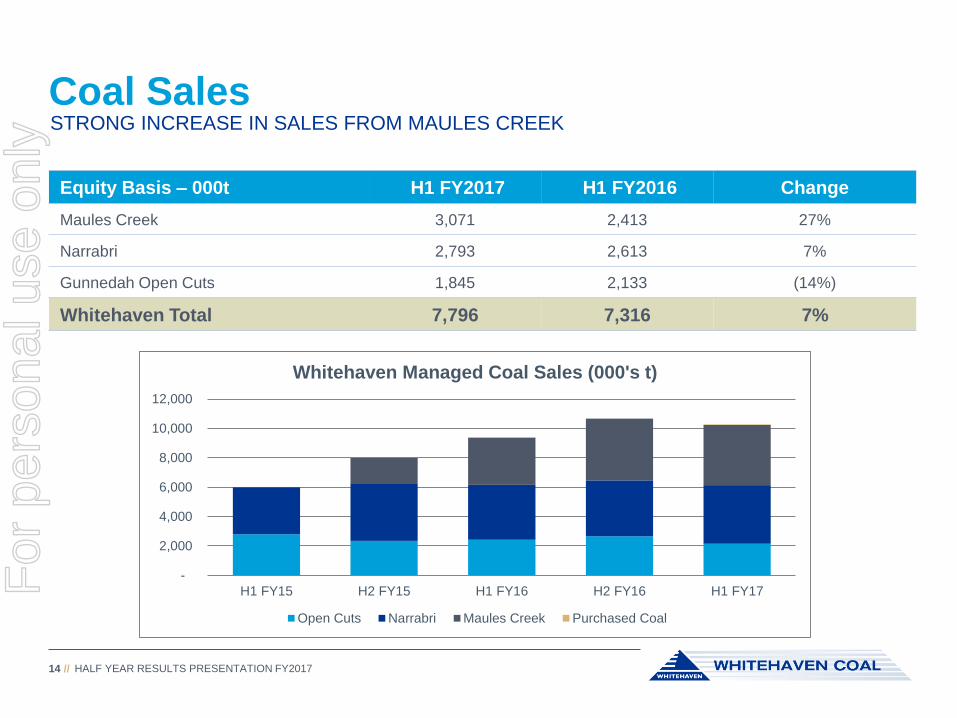
Equity Basis – 000t H1 FY2017 H1 FY2016 Change
Maules Creek 3,071 2,413 27%
Narrabri 2,793 2,613 7%
Gunnedah Open Cuts 1,845 2,133 (14%)
Whitehaven Total 7,796 7,316 7%
-
2,000
4,000
6,000
8,000
10,000
12,000
H1 FY15 H2 FY15 H1 FY16 H2 FY16 H1 FY17
Whitehaven Managed Coal Sales (000's t)
Open Cuts Narrabri Maules Creek Purchased Coal
For
per
sona
l use
onl
y
HALF YEAR RESULTS PRESENTATION FY201715 //
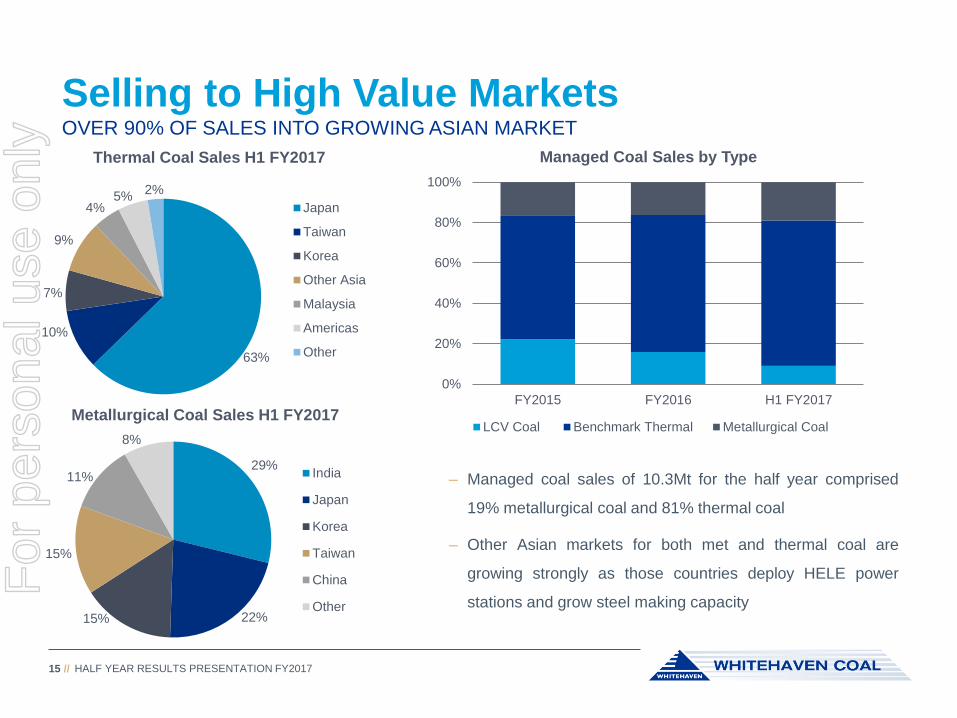
– Managed coal sales of 10.3Mt for the half year comprised
19% metallurgical coal and 81% thermal coal
– Other Asian markets for both met and thermal coal are
growing strongly as those countries deploy HELE power
stations and grow steel making capacity
27%
53%
20%
22%
61%
16%
16%
68%
16%
63%
10%
7%
9%
4%5%
2%
Thermal Coal Sales H1 FY2017
Japan
Taiwan
Korea
Other Asia
Malaysia
Americas
Other
29%
22%15%
15%
11%
8%
Metallurgical Coal Sales H1 FY2017
India
Japan
Korea
Taiwan
China
Other
0%
20%
40%
60%
80%
100%
FY2015 FY2016 H1 FY2017
Managed Coal Sales by Type
LCV Coal Benchmark Thermal Metallurgical Coal
Selling to High Value MarketsOVER 90% OF SALES INTO GROWING ASIAN MARKET
For
per
sona
l use
onl
y
ROM Coal Production
HALF YEAR RESULTS PRESENTATION FY201716 //
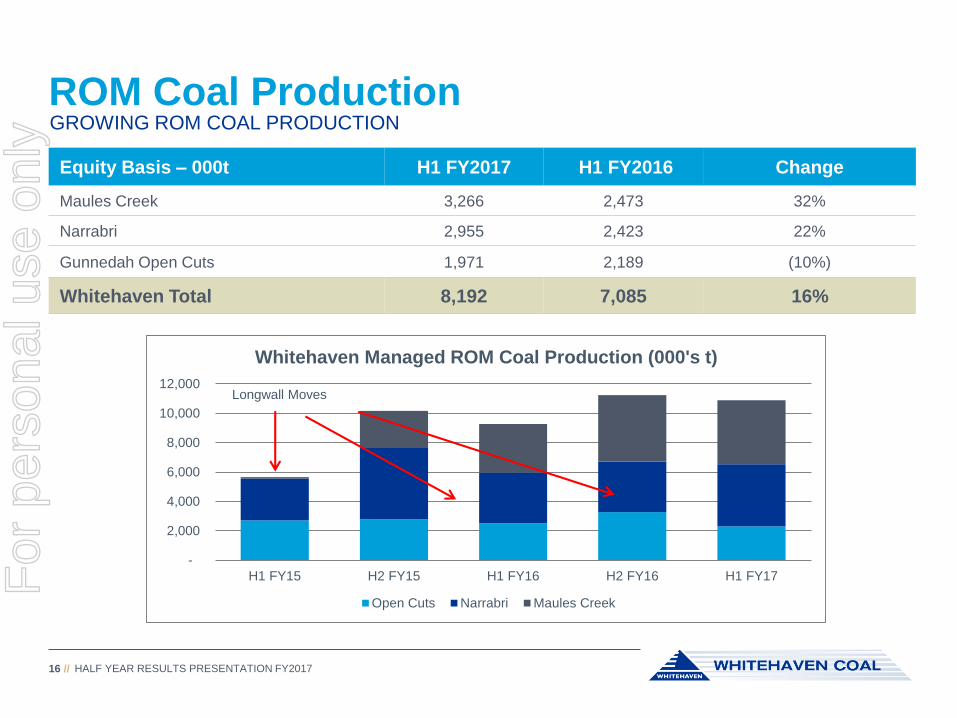
GROWING ROM COAL PRODUCTION
Equity Basis – 000t H1 FY2017 H1 FY2016 Change
Maules Creek 3,266 2,473 32%
Narrabri 2,955 2,423 22%
Gunnedah Open Cuts 1,971 2,189 (10%)
Whitehaven Total 8,192 7,085 16%
-
2,000
4,000
6,000
8,000
10,000
12,000
H1 FY15 H2 FY15 H1 FY16 H2 FY16 H1 FY17
Whitehaven Managed ROM Coal Production (000's t)
Open Cuts Narrabri Maules Creek
Longwall Moves
For
per
sona
l use
onl
y
Maules Creek
HALF YEAR RESULTS PRESENTATION FY201717 //
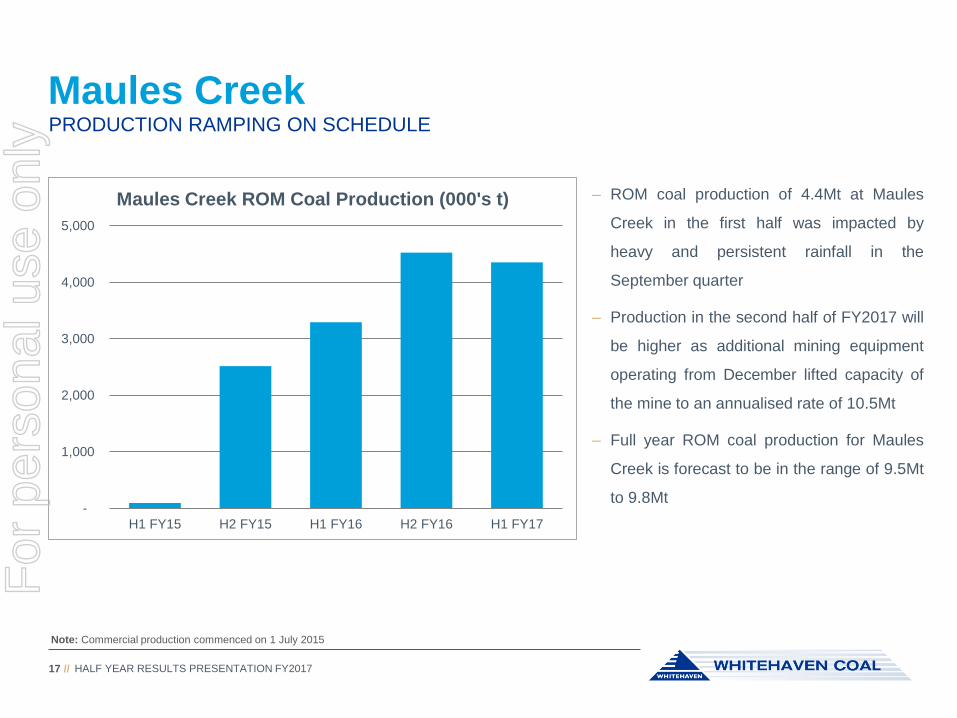
PRODUCTION RAMPING ON SCHEDULE
– ROM coal production of 4.4Mt at Maules
Creek in the first half was impacted by
heavy and persistent rainfall in the
September quarter
– Production in the second half of FY2017 will
be higher as additional mining equipment
operating from December lifted capacity of
the mine to an annualised rate of 10.5Mt
– Full year ROM coal production for Maules
Creek is forecast to be in the range of 9.5Mt
to 9.8Mt
Note: Commercial production commenced on 1 July 2015
-
1,000
2,000
3,000
4,000
5,000
H1 FY15 H2 FY15 H1 FY16 H2 FY16 H1 FY17
Maules Creek ROM Coal Production (000's t)
For
per
sona
l use
onl
y
Maules Creek Product Mix
HALF YEAR RESULTS PRESENTATION FY201718 //
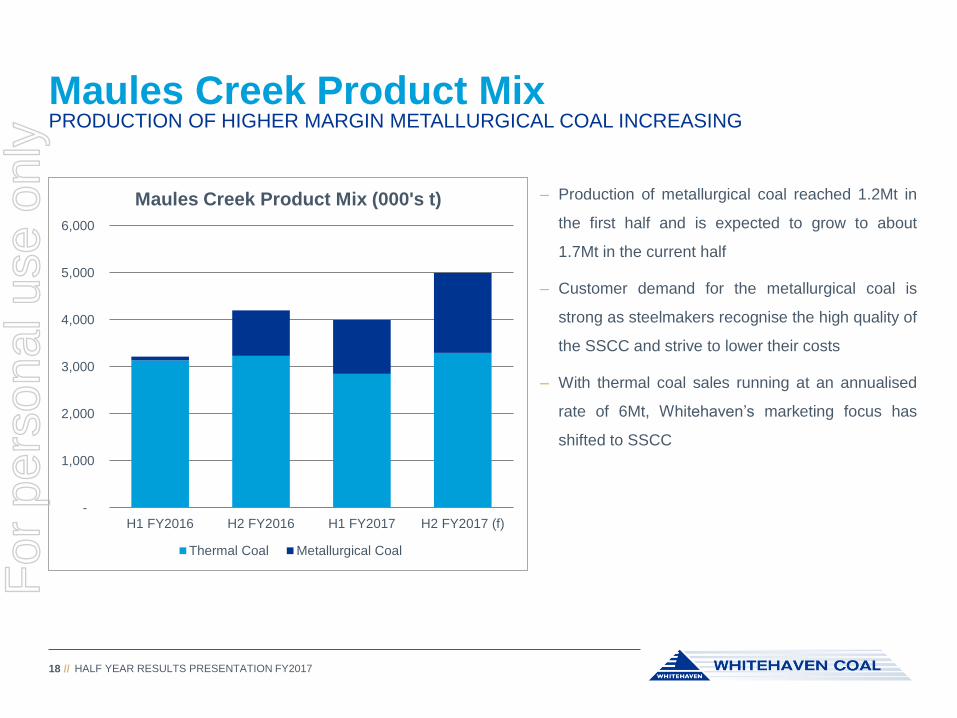
PRODUCTION OF HIGHER MARGIN METALLURGICAL COAL INCREASING
– Production of metallurgical coal reached 1.2Mt in
the first half and is expected to grow to about
1.7Mt in the current half
– Customer demand for the metallurgical coal is
strong as steelmakers recognise the high quality of
the SSCC and strive to lower their costs
– With thermal coal sales running at an annualised
rate of 6Mt, Whitehaven’s marketing focus has
shifted to SSCC
-
1,000
2,000
3,000
4,000
5,000
6,000
H1 FY2016 H2 FY2016 H1 FY2017 H2 FY2017 (f)
Maules Creek Product Mix (000's t)
Thermal Coal Metallurgical Coal
For
per
sona
l use
onl
y
Narrabri Performance
HALF YEAR RESULTS PRESENTATION FY201719 //
FACE WIDENING PROJECT ON SCHEDULE
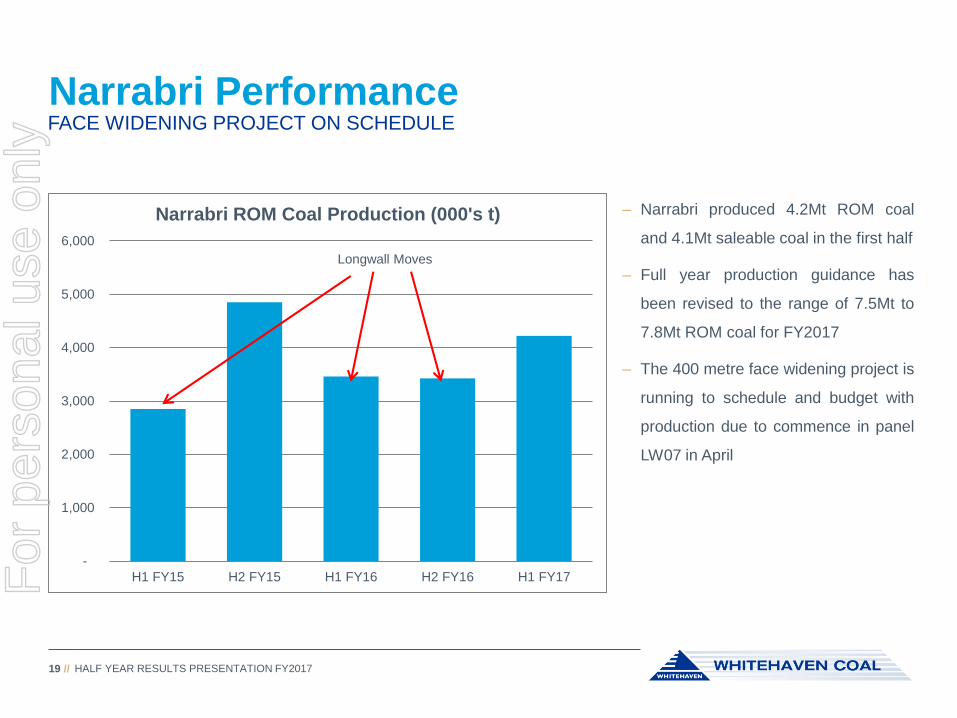
– Narrabri produced 4.2Mt ROM coal
and 4.1Mt saleable coal in the first half
– Full year production guidance has
been revised to the range of 7.5Mt to
7.8Mt ROM coal for FY2017
– The 400 metre face widening project is
running to schedule and budget with
production due to commence in panel
LW07 in April
Longwall Moves
-
1,000
2,000
3,000
4,000
5,000
6,000
H1 FY15 H2 FY15 H1 FY16 H2 FY16 H1 FY17
Narrabri ROM Coal Production (000's t)
For
per
sona
l use
onl
y
Gunnedah Open Cuts
HALF YEAR RESULTS PRESENTATION FY201720 //
PRODUCTION TO BE HIGHER IN THE SECOND HALF
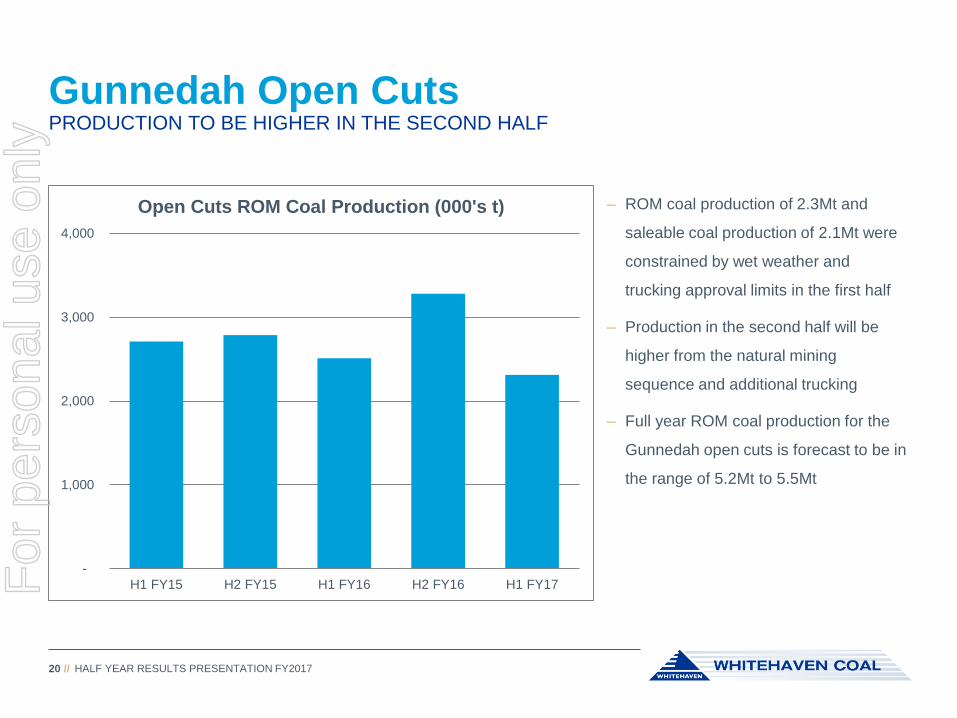
– ROM coal production of 2.3Mt and
saleable coal production of 2.1Mt were
constrained by wet weather and
trucking approval limits in the first half
– Production in the second half will be
higher from the natural mining
sequence and additional trucking
– Full year ROM coal production for the
Gunnedah open cuts is forecast to be in
the range of 5.2Mt to 5.5Mt
-
1,000
2,000
3,000
4,000
H1 FY15 H2 FY15 H1 FY16 H2 FY16 H1 FY17
Open Cuts ROM Coal Production (000's t)
For
per
sona
l use
onl
y
Vickery Update
HALF YEAR RESULTS PRESENTATION FY201721 //
EIS TO BE LODGED IN THE CURRENT HALF
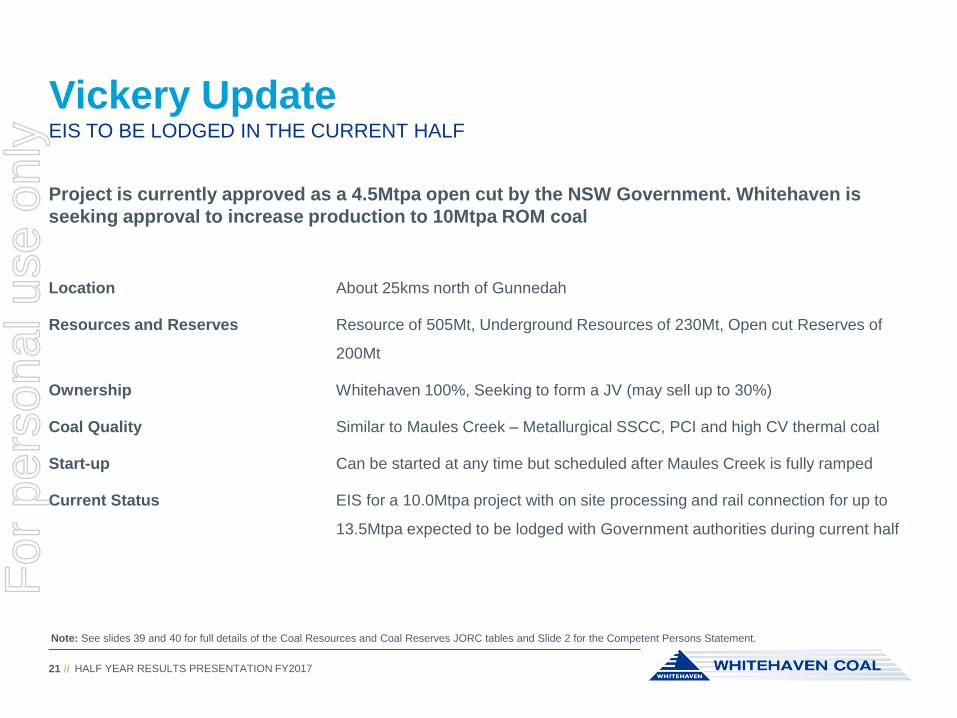
Project is currently approved as a 4.5Mtpa open cut by the NSW Government. Whitehaven is
seeking approval to increase production to 10Mtpa ROM coal
Location About 25kms north of Gunnedah
Resources and Reserves Resource of 505Mt, Underground Resources of 230Mt, Open cut Reserves of
200Mt
Ownership Whitehaven 100%, Seeking to form a JV (may sell up to 30%)
Coal Quality Similar to Maules Creek – Metallurgical SSCC, PCI and high CV thermal coal
Start-up Can be started at any time but scheduled after Maules Creek is fully ramped
Current Status EIS for a 10.0Mtpa project with on site processing and rail connection for up to
13.5Mtpa expected to be lodged with Government authorities during current half
Note: See slides 39 and 40 for full details of the Coal Resources and Coal Reserves JORC tables and Slide 2 for the Competent Persons Statement.
For
per
sona
l use
onl
y
Indicative Timetable for Vickery
HALF YEAR RESULTS PRESENTATION FY201722 //
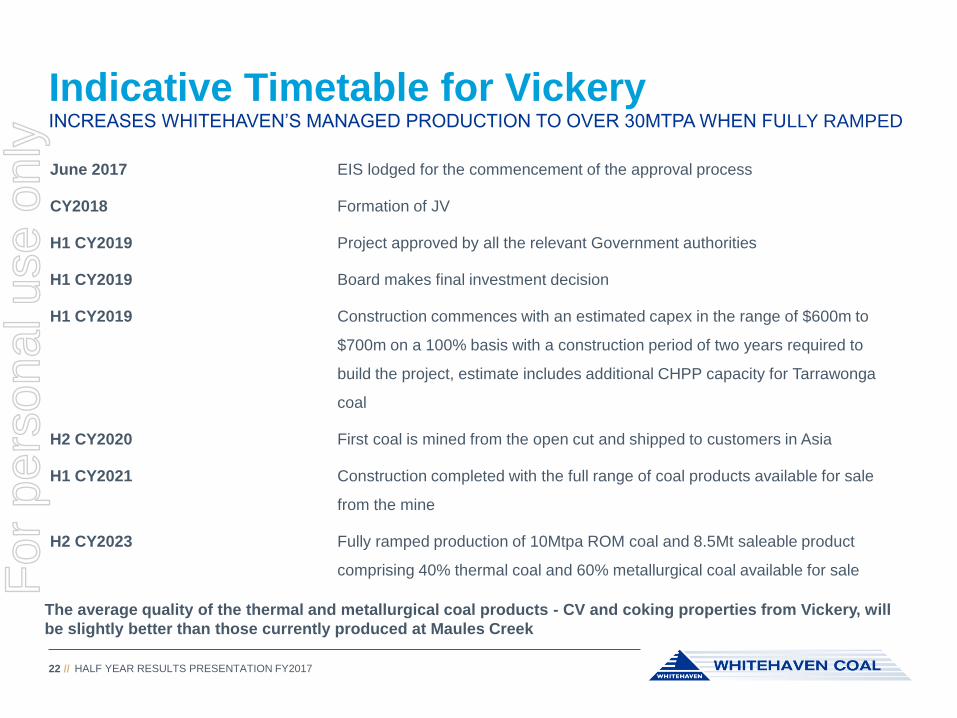
INCREASES WHITEHAVEN’S MANAGED PRODUCTION TO OVER 30MTPA WHEN FULLY RAMPED
June 2017 EIS lodged for the commencement of the approval process
CY2018 Formation of JV
H1 CY2019 Project approved by all the relevant Government authorities
H1 CY2019 Board makes final investment decision
H1 CY2019 Construction commences with an estimated capex in the range of $600m to
$700m on a 100% basis with a construction period of two years required to
build the project, estimate includes additional CHPP capacity for Tarrawonga
coal
H2 CY2020 First coal is mined from the open cut and shipped to customers in Asia
H1 CY2021 Construction completed with the full range of coal products available for sale
from the mine
H2 CY2023 Fully ramped production of 10Mtpa ROM coal and 8.5Mt saleable product
comprising 40% thermal coal and 60% metallurgical coal available for sale
The average quality of the thermal and metallurgical coal products - CV and coking properties from Vickery, will
be slightly better than those currently produced at Maules Creek
For
per
sona
l use
onl
y

Community
For
per
sona
l use
onl
y
Working with the Community
HALF YEAR RESULTS PRESENTATION FY201724 //
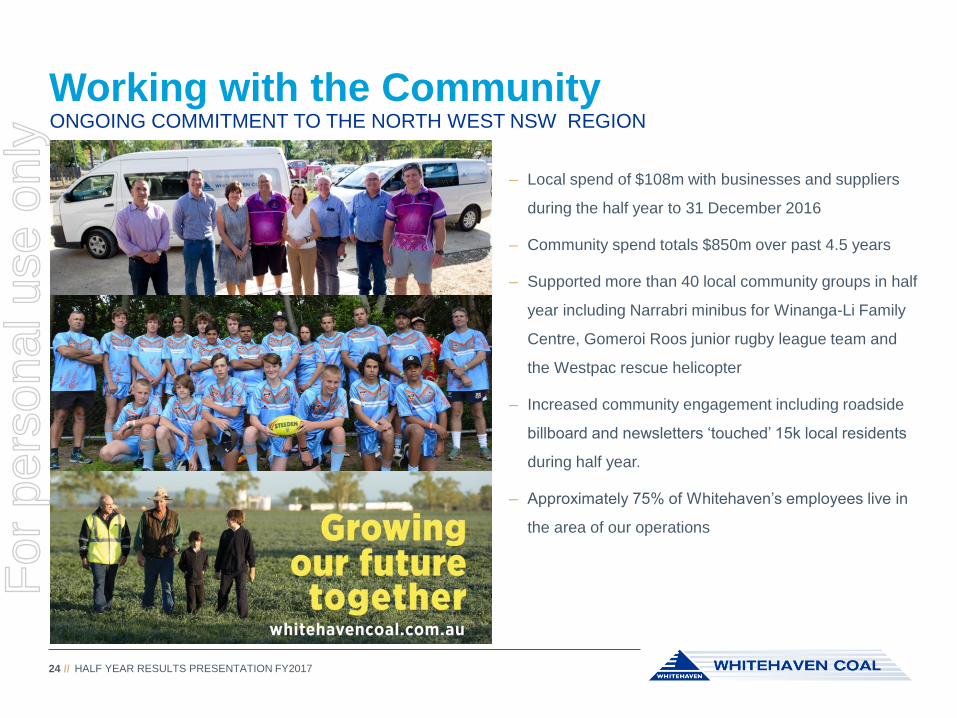
ONGOING COMMITMENT TO THE NORTH WEST NSW REGION
– Local spend of $108m with businesses and suppliers
during the half year to 31 December 2016
– Community spend totals $850m over past 4.5 years
– Supported more than 40 local community groups in half
year including Narrabri minibus for Winanga-Li Family
Centre, Gomeroi Roos junior rugby league team and
the Westpac rescue helicopter
– Increased community engagement including roadside
billboard and newsletters ‘touched’ 15k local residents
during half year.
– Approximately 75% of Whitehaven’s employees live in
the area of our operations
For
per
sona
l use
onl
y
Maules Creek Open Days
HALF YEAR RESULTS PRESENTATION FY201725 //
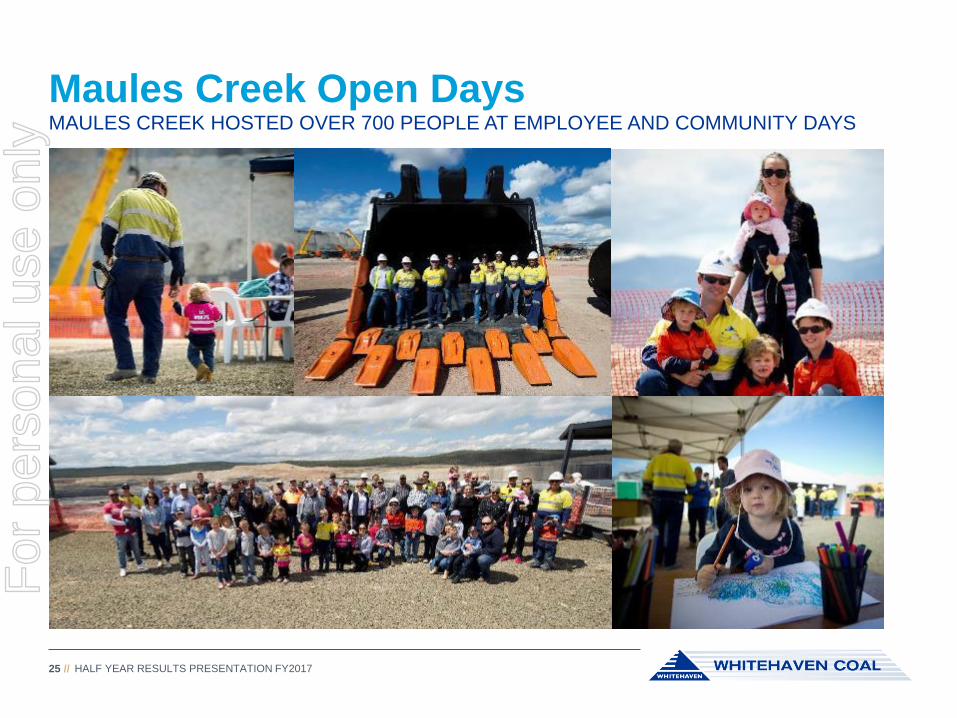
MAULES CREEK HOSTED OVER 700 PEOPLE AT EMPLOYEE AND COMMUNITY DAYS
For
per
sona
l use
onl
y
Outlook for Coal Use
For
per
sona
l use
onl
y
IEA Medium Term Forecasts
HALF YEAR RESULTS PRESENTATION FY201727 //
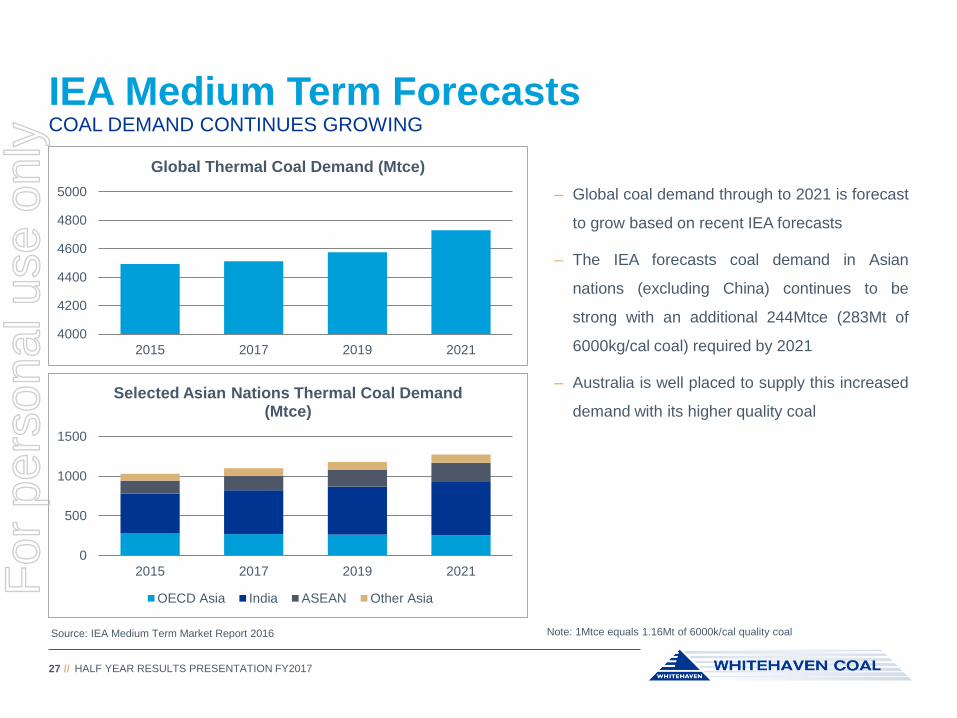
COAL DEMAND CONTINUES GROWING
– Global coal demand through to 2021 is forecast
to grow based on recent IEA forecasts
– The IEA forecasts coal demand in Asian
nations (excluding China) continues to be
strong with an additional 244Mtce (283Mt of
6000kg/cal coal) required by 2021
– Australia is well placed to supply this increased
demand with its higher quality coal
Source: IEA Medium Term Market Report 2016 Note: 1Mtce equals 1.16Mt of 6000k/cal quality coal
4000
4200
4400
4600
4800
5000
2015 2017 2019 2021
Global Thermal Coal Demand (Mtce)
0
500
1000
1500
2015 2017 2019 2021
Selected Asian Nations Thermal Coal Demand (Mtce)
OECD Asia India ASEAN Other Asia
For
per
sona
l use
onl
y
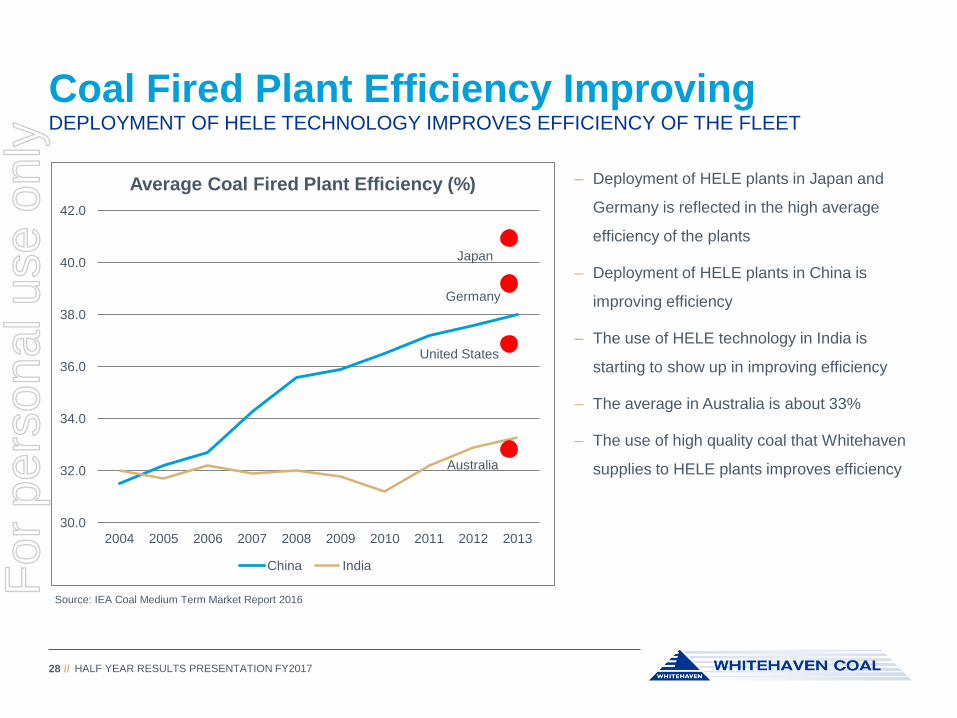
Coal Fired Plant Efficiency Improving
HALF YEAR RESULTS PRESENTATION FY201728 //
DEPLOYMENT OF HELE TECHNOLOGY IMPROVES EFFICIENCY OF THE FLEET
– Deployment of HELE plants in Japan and
Germany is reflected in the high average
efficiency of the plants
– Deployment of HELE plants in China is
improving efficiency
– The use of HELE technology in India is
starting to show up in improving efficiency
– The average in Australia is about 33%
– The use of high quality coal that Whitehaven
supplies to HELE plants improves efficiency
Source: IEA Coal Medium Term Market Report 2016
30.0
32.0
34.0
36.0
38.0
40.0
42.0
2004 2005 2006 2007 2008 2009 2010 2011 2012 2013
Average Coal Fired Plant Efficiency (%)
China India
Japan
Germany
United States
Australia
For
per
sona
l use
onl
y
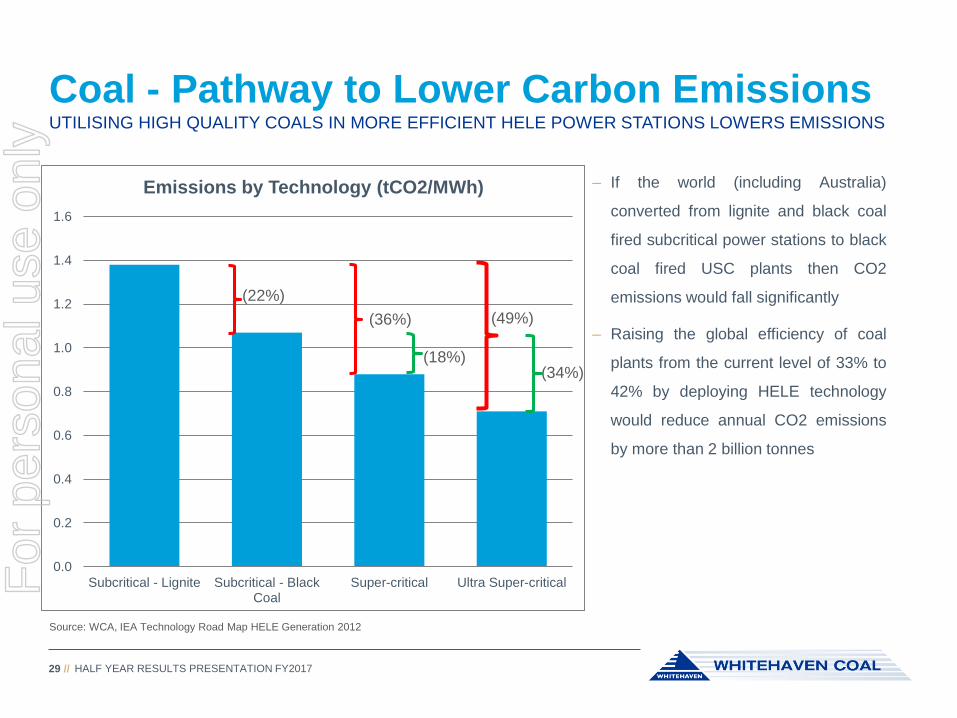
UTILISING HIGH QUALITY COALS IN MORE EFFICIENT HELE POWER STATIONS LOWERS EMISSIONS
Coal - Pathway to Lower Carbon Emissions
HALF YEAR RESULTS PRESENTATION FY201729 //
0.0
0.2
0.4
0.6
0.8
1.0
1.2
1.4
1.6
Subcritical - Lignite Subcritical - BlackCoal
Super-critical Ultra Super-critical
Emissions by Technology (tCO2/MWh)
(34%)(18%)
(22%)
(36%) (49%)
Source: WCA, IEA Technology Road Map HELE Generation 2012
– If the world (including Australia)
converted from lignite and black coal
fired subcritical power stations to black
coal fired USC plants then CO2
emissions would fall significantly
– Raising the global efficiency of coal
plants from the current level of 33% to
42% by deploying HELE technology
would reduce annual CO2 emissions
by more than 2 billion tonnes
For
per
sona
l use
onl
y
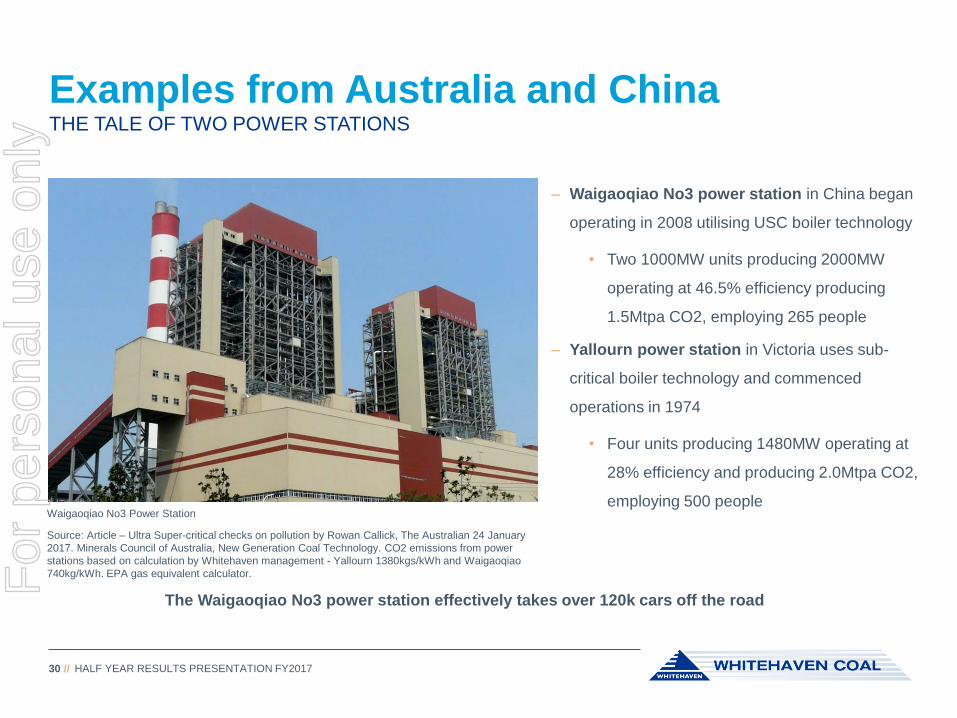
Examples from Australia and China
HALF YEAR RESULTS PRESENTATION FY201730 //
THE TALE OF TWO POWER STATIONS
– Waigaoqiao No3 power station in China began
operating in 2008 utilising USC boiler technology
• Two 1000MW units producing 2000MW
operating at 46.5% efficiency producing
1.5Mtpa CO2, employing 265 people
– Yallourn power station in Victoria uses sub-
critical boiler technology and commenced
operations in 1974
• Four units producing 1480MW operating at
28% efficiency and producing 2.0Mtpa CO2,
employing 500 peopleWaigaoqiao No3 Power Station
Source: Article – Ultra Super-critical checks on pollution by Rowan Callick, The Australian 24 January
2017. Minerals Council of Australia, New Generation Coal Technology. CO2 emissions from power
stations based on calculation by Whitehaven management - Yallourn 1380kgs/kWh and Waigaoqiao
740kg/kWh. EPA gas equivalent calculator.
The Waigaoqiao No3 power station effectively takes over 120k cars off the road
For
per
sona
l use
onl
y

Outlook for Whitehaven
For
per
sona
l use
onl
y
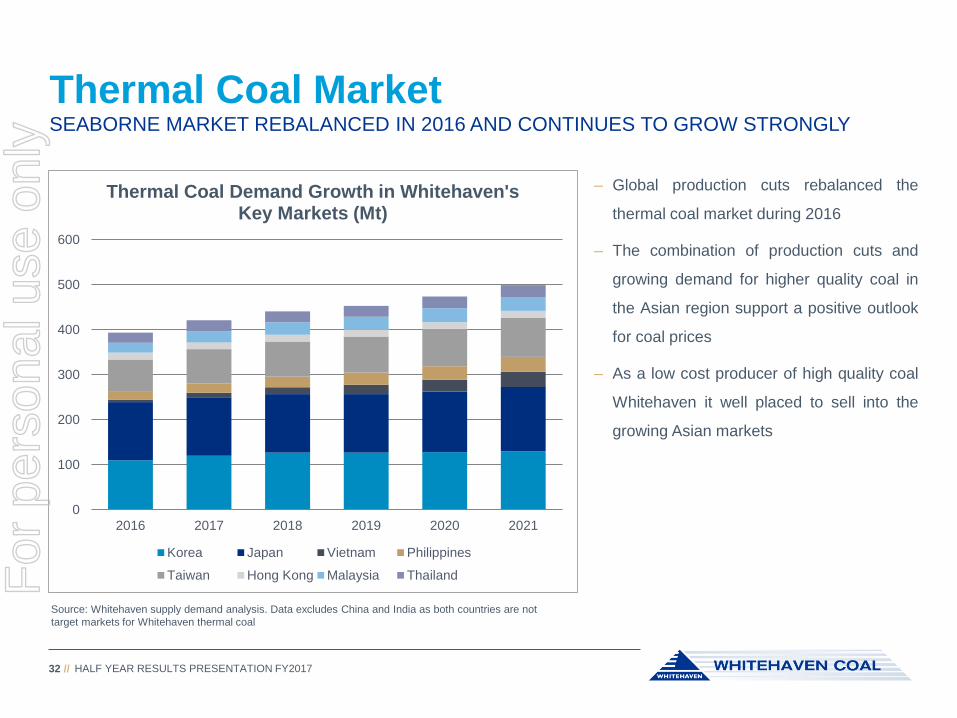
Thermal Coal Market
HALF YEAR RESULTS PRESENTATION FY201732 //
SEABORNE MARKET REBALANCED IN 2016 AND CONTINUES TO GROW STRONGLY
– Global production cuts rebalanced the
thermal coal market during 2016
– The combination of production cuts and
growing demand for higher quality coal in
the Asian region support a positive outlook
for coal prices
– As a low cost producer of high quality coal
Whitehaven it well placed to sell into the
growing Asian markets
0
100
200
300
400
500
600
2016 2017 2018 2019 2020 2021
Thermal Coal Demand Growth in Whitehaven's Key Markets (Mt)
Korea Japan Vietnam Philippines
Taiwan Hong Kong Malaysia Thailand
Source: Whitehaven supply demand analysis. Data excludes China and India as both countries are not
target markets for Whitehaven thermal coal
For
per
sona
l use
onl
y
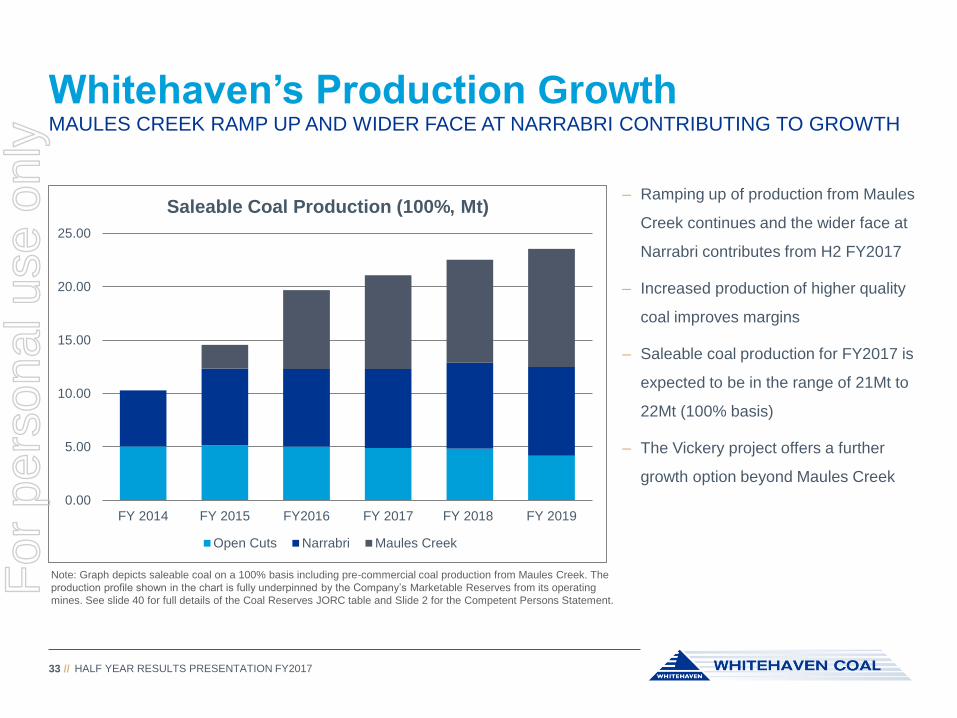
Whitehaven’s Production Growth
HALF YEAR RESULTS PRESENTATION FY201733 //
MAULES CREEK RAMP UP AND WIDER FACE AT NARRABRI CONTRIBUTING TO GROWTH
– Ramping up of production from Maules
Creek continues and the wider face at
Narrabri contributes from H2 FY2017
– Increased production of higher quality
coal improves margins
– Saleable coal production for FY2017 is
expected to be in the range of 21Mt to
22Mt (100% basis)
– The Vickery project offers a further
growth option beyond Maules Creek
Note: Graph depicts saleable coal on a 100% basis including pre-commercial coal production from Maules Creek. The
production profile shown in the chart is fully underpinned by the Company’s Marketable Reserves from its operating
mines. See slide 40 for full details of the Coal Reserves JORC table and Slide 2 for the Competent Persons Statement.
0.00
5.00
10.00
15.00
20.00
25.00
FY 2014 FY 2015 FY2016 FY 2017 FY 2018 FY 2019
Saleable Coal Production (100%, Mt)
Open Cuts Narrabri Maules Creek
For
per
sona
l use
onl
y
Embedded Growth Opportunities
HALF YEAR RESULTS PRESENTATION FY201734 //
WHITEHAVEN HAS MANY OPTIONS TO GROW SHAREHOLDER VALUE
– Increase the approval limit at Maules Creek from 13Mtpa ROM to 15+Mtpa ROM
– Extend the longwall panels into the south area at Narrabri, increasing LOM and annual production
– Seek opportunities to increase the footprint of the Narrabri mine and extend mine life
– Introduce autonomous truck fleets to Maules Creek to increase productivity and reduce costs
– Develop the Vickery project adding 10Mtpa ROM coal production to the portfolio
– Use autonomous truck fleets at Vickery from early in the project life to reduce operating costs
For
per
sona
l use
onl
y
Targets for CY2017
HALF YEAR RESULTS PRESENTATION FY201735 //
FOCUSSED ON GROWING PRODUCTION SAFELY AND DEBT REDUCTION
Operations
− Continue improving safety performance
− Deliver saleable coal production guidance in the range of 21Mt to 22Mt (100% basis)
− Deliver the face widening project at Narrabri and commence mining in the initial 400m wide panel
− Ensure Maules Creek is operating at 10.5Mtpa in H2 FY2017
− Grow higher margin metallurgical coal sales from both Maules Creek and Narrabri
− Lodge EIS documentation for Vickery project
Financial
− Continue to reduce debt
− Ensure that costs remain in the first quartile
− Increase contracted position for Maules Creek SSCC and thermal coal
For
per
sona
l use
onl
y
For
per
sona
l use
onl
y

Appendices
For
per
sona
l use
onl
y
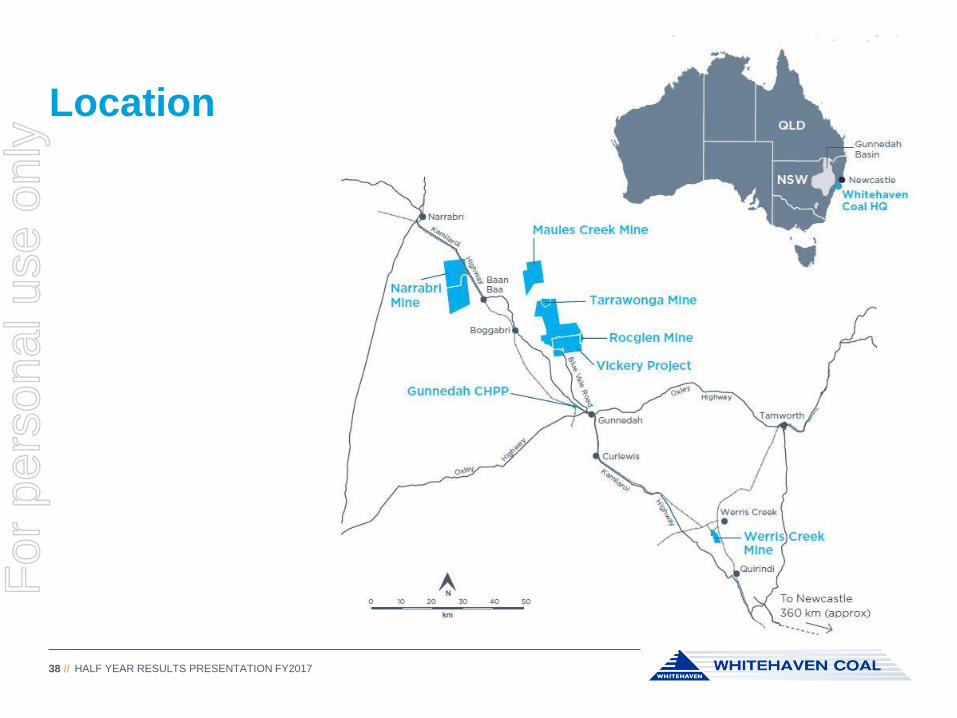
Location
HALF YEAR RESULTS PRESENTATION FY201738 //
For
per
sona
l use
onl
y
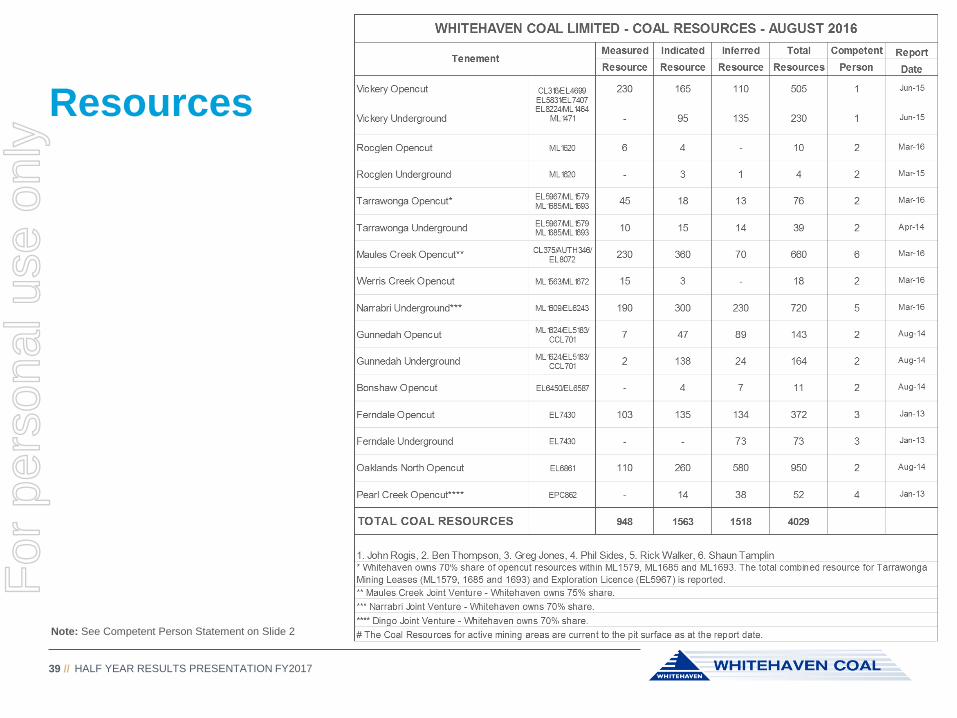
Resources
HALF YEAR RESULTS PRESENTATION FY201739 //
Note: See Competent Person Statement on Slide 2
For
per
sona
l use
onl
y
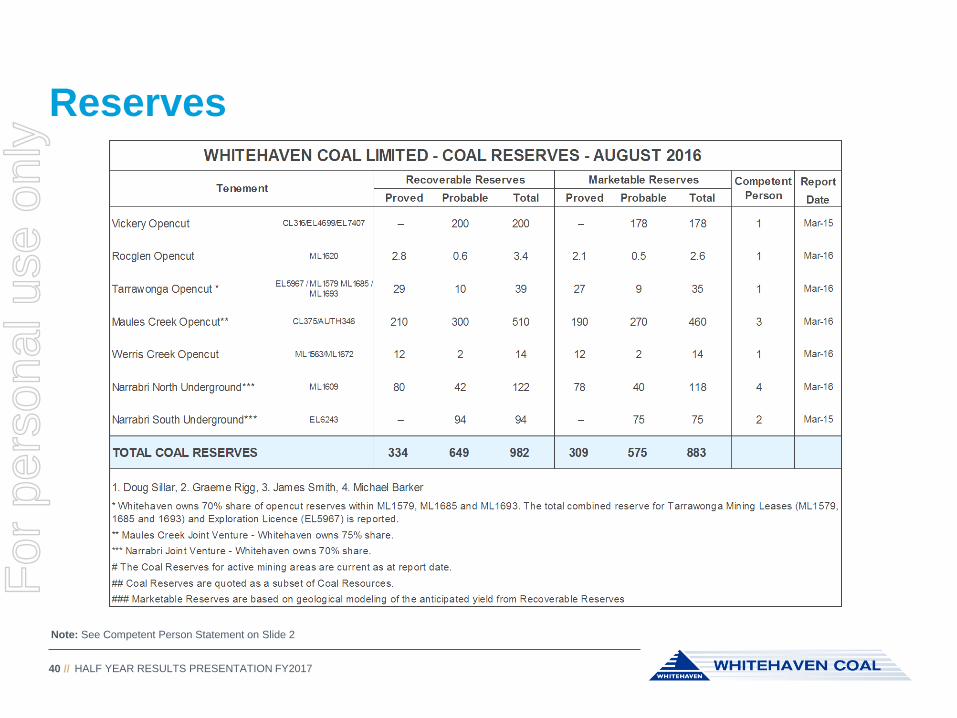
Reserves
HALF YEAR RESULTS PRESENTATION FY201740 //
Note: See Competent Person Statement on Slide 2
For
per
sona
l use
onl
y

Additional Information
For
per
sona
l use
onl
y
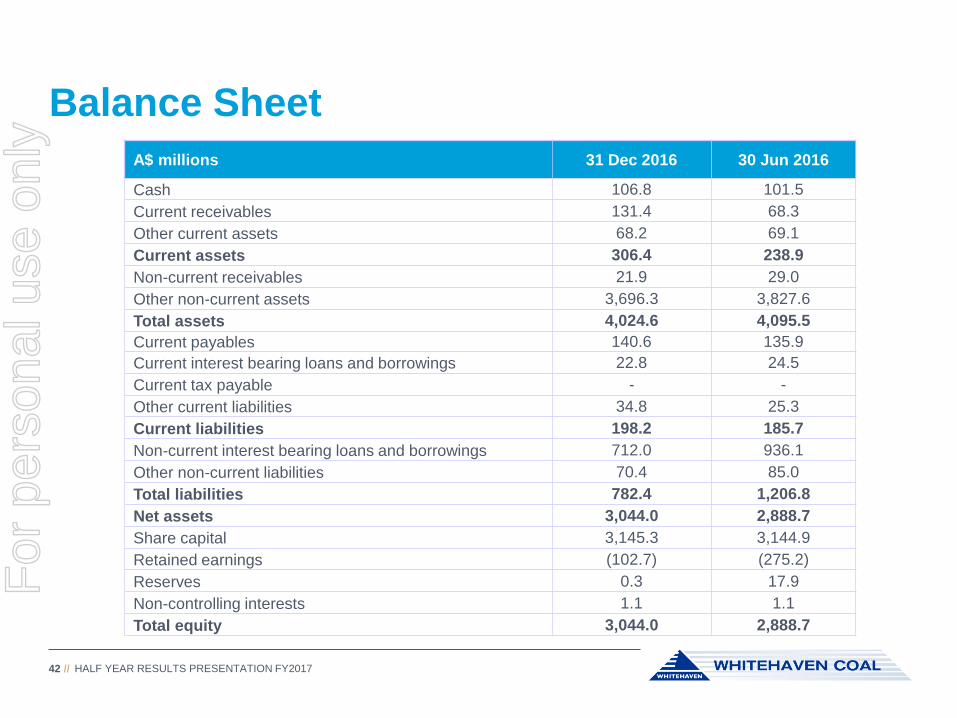
Balance Sheet
HALF YEAR RESULTS PRESENTATION FY201742 //
A$ millions 31 Dec 2016 30 Jun 2016
Cash 106.8 101.5
Current receivables 131.4 68.3
Other current assets 68.2 69.1
Current assets 306.4 238.9
Non-current receivables 21.9 29.0
Other non-current assets 3,696.3 3,827.6
Total assets 4,024.6 4,095.5
Current payables 140.6 135.9
Current interest bearing loans and borrowings 22.8 24.5
Current tax payable - -
Other current liabilities 34.8 25.3
Current liabilities 198.2 185.7
Non-current interest bearing loans and borrowings 712.0 936.1
Other non-current liabilities 70.4 85.0
Total liabilities 782.4 1,206.8
Net assets 3,044.0 2,888.7
Share capital 3,145.3 3,144.9
Retained earnings (102.7) (275.2)
Reserves 0.3 17.9
Non-controlling interests 1.1 1.1
Total equity 3,044.0 2,888.7
For
per
sona
l use
onl
y
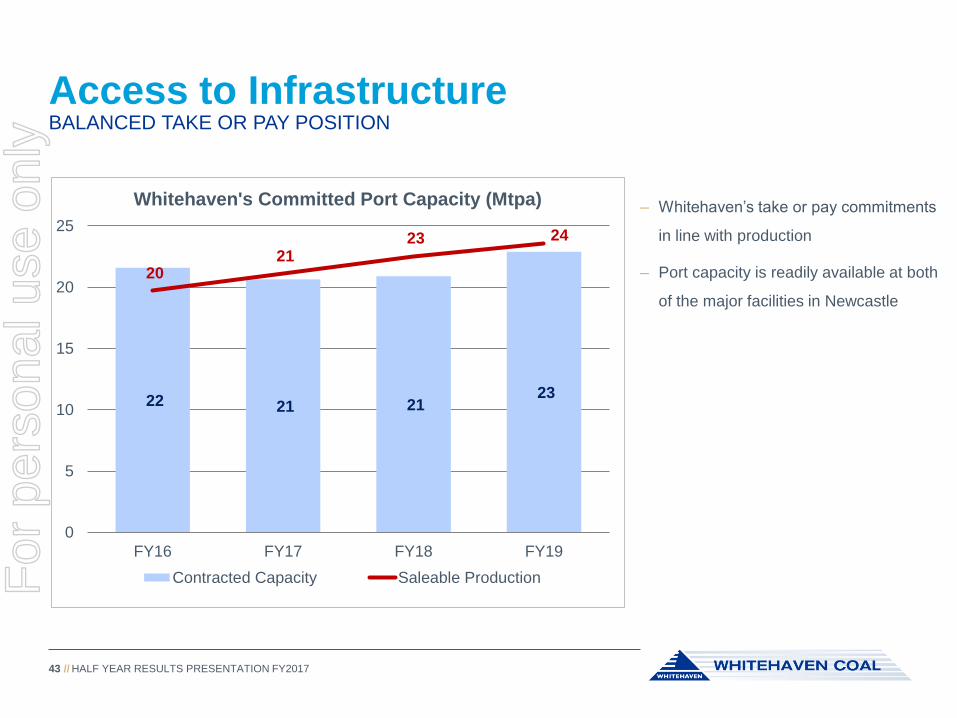
Access to Infrastructure
43 //
BALANCED TAKE OR PAY POSITION
– Whitehaven’s take or pay commitments
in line with production
– Port capacity is readily available at both
of the major facilities in Newcastle
22 21 21 23
20 21
23 24
0
5
10
15
20
25
FY16 FY17 FY18 FY19
Whitehaven's Committed Port Capacity (Mtpa)
Contracted Capacity Saleable Production
HALF YEAR RESULTS PRESENTATION FY2017
For
per
sona
l use
onl
y