whitepaper sharepoint operations checklist - mark van lunenburg, daniel mcpherson - rapid circle -...
TRANSCRIPT

SharePoint Server 2010: Operations Framework and Checklists
This document is provided ―as-is‖. Information and views expressed in this document,
including URL and other Internet Web site references, may change without notice. You bear
the risk of using it.
Some examples depicted herein are provided for illustration only and are fictitious. No real
association or connection is intended or should be inferred.
This document does not provide you with any legal rights to any intellectual property in any
Microsoft product. You may copy and use this document for your internal, reference
purposes. You may modify this document for your internal, reference purposes.
© 2010 Microsoft Corporation. All rights reserved.
SharePoint Server 2010: Operations Framework and Checklists Authors: Mark van Lunenburg, Serge Salomons, Daniel McPherson
Microsoft Corporation
October 2010
Abstract
This document provides information, such as checklists for daily, weekly, and monthly tasks,
which are related to the operations management of a Microsoft® SharePoint
® Server 2010
environment. In addition, guidance is provided for using Microsoft System Center Operations
Manager 2007 R2 to monitor a SharePoint environment.
Tip:
To read more operations and monitoring topics, visit the SharePoint Server 2010
Library (http://go.microsoft.com/fwlink/?LinkID=181463)

Contents
SharePoint Server 2010: Operations Framework and Checklists ............................................ 1
Contents .................................................................................................................................... 3
Operations Management and Monitoring of a SharePoint Server 2010 Environment ............. 5
Microsoft Operations Framework .............................................................................................. 6
MOF and SharePoint Server 2010 ........................................................................................ 6
The MOF Service Lifecycle.................................................................................................... 6
Best Practices for SharePoint Environments .......................................................................... 17
Capacity and Availability Management ................................................................................ 18
Change Management .......................................................................................................... 21
Monitoring SharePoint............................................................................................................. 30
Diagnostic Logging .............................................................................................................. 31
Usage Data and Health Data Collection .............................................................................. 33
SharePoint Health Analyzer ................................................................................................ 35
Web Analytics ...................................................................................................................... 37
How to check if SharePoint Server is ―Alive‖ ....................................................................... 39
SharePoint Developer Dashboard ....................................................................................... 39
Custom Applications and Object Disposal........................................................................... 40
Operations Management......................................................................................................... 42
Standard Procedures ........................................................................................................... 42
Centralized Versus Decentralized Administration ............................................................... 43
Daily Tasks .......................................................................................................................... 43
Weekly Tasks ...................................................................................................................... 51
Monthly Tasks ...................................................................................................................... 52
Impromptu Tasks ................................................................................................................. 53
Operations Checklists ............................................................................................................. 54
Daily Operations Checklist................................................................................................... 54
Weekly Operations Checklist ............................................................................................... 63
Monthly Operations Checklist .............................................................................................. 65
Summary Checklist .............................................................................................................. 68
Monitoring SharePoint Server 2010 with Microsoft Systems Operations Manager 2007 R2 . 70
Overview of Microsoft SharePoint 2010 Products Management Pack for SCOM 2007 R2 70
More Information about the Microsoft SharePoint 2010 Products Management Pack for
SCOM 2007 R2 ................................................................................................................ 72

Appendix A: Enabling the Developer Dashboard ................................................................... 73
Enable Developer Dashboard via Object model: ................................................................ 73
Enable Developer Dashboard by using Windows PowerShell ............................................ 73
5
Operations Management and Monitoring of a SharePoint Server 2010 Environment
This document details the operational processes, tasks, and tools that are required to operate
and maintain a SharePoint Server 2010 environment. It explains how the management of
SharePoint Server 2010 fits in with the overall Microsoft Operations Framework (MOF)
model. It will help you design your approach to operational management and give you the
means to implement processes and procedures that help keep your environment running
smoothly.
Within a SharePoint Server 2010 environment, the procedures, roles, and responsibilities that
are involved in operations should be formalized. You can use the Microsoft Operations
Framework (MOF) to help model your organization's formalization efforts. Implementing
SharePoint Server 2010 operations procedures according to the MOF processes requires:
Understanding MOF
MOF is a collection of best practices, principles, and models that give you technical
guidance about the management of IT projects such as daily SharePoint Server 2010
operations. MOF guidelines will help you achieve mission-critical production system
reliability, availability, supportability, and manageability for Microsoft products.
Learning about best practices for the management of SharePoint environments
We recommend that you implement proven and practical procedures to manage a
SharePoint Server 2010 environment. Tried, tested, and documented methods of
managing operations in your organization may be more efficient than developing your
own methods.
Separating operations into daily, weekly, and monthly processes
Document the operational tasks that are performed regularly in your company.
Documenting how and when tasks are performed ensures that the information is
preserved when members of the operations staff change jobs or leave the company. New
employees also benefit from this documentation because it helps them quickly learn how
your IT department conducts its SharePoint operations.
Deploying the tools required for operating a SharePoint Server 2010 environment
Many tools are available to help troubleshoot problems, automate tasks, and aid in the
monitoring and maintenance of your SharePoint Server 2010 environment. You can
define a standard set of tools for your organization so that the tasks performed by your
operations team are performed accurately, efficiently, consistently, and in a controlled
manner. You should also implement processes to track incidents and major configuration
changes.
For more information, see the following sections:
Microsoft Operations Framework
6
Monitoring SharePoint Server 2010 with Microsoft Operations Manager 2007 R2
Microsoft Operations Framework
The Microsoft Operations Framework (MOF) 4.0 is a collection of integrated best practices,
principles, and activities that provide comprehensive guidelines for achieving reliability in IT
solutions and services.
MOF provides question-based guidance that enables you to determine what is needed for
your organization now, as well as activities that will keep the IT organization running
efficiently and effectively in the future.
MOF 4.0 supports the integration of any policies, tasks, or activities based on other
frameworks (such as ITIL, COBIT, and ISO 20000) with the Microsoft platform.
The guidance in MOF encompasses all of the activities and processes involved in managing
an IT service: its conception, development, operation, maintenance, and—ultimately—its
retirement. MOF organizes these activities and processes into service management functions
(SMFs), which are grouped together in phases that mirror the IT service lifecycle. Each SMF
is anchored within a lifecycle phase and contains a unique set of goals and outcomes that
support the objectives of that phase. An IT service’s readiness to move from one phase to the
next is confirmed by management reviews (MRs), which ensure that goals are achieved in an
appropriate fashion and that IT’s goals are aligned with the goals of the organization.
MOF and SharePoint Server 2010 It’s important to understand the connection between sound operational practices, sound
procedures, and a healthy SharePoint Server 2010 infrastructure. Well-documented,
thorough operational processes and procedures ensure that all the components in an
organization's environment, on which SharePoint Server relies, are managed efficiently and
effectively through all the design, deployment, and supporting phases.
Changes to the components of an organization's infrastructure, such as firmware updates to
routers and firewall rules changes, on which SharePoint Server relies can result in an
unexpected outage. Modification in these areas can happen without the involvement of the
organization's SharePoint team. By using MOF-based processes to help make sure that there
is documentation of these service interdependencies, an organization can help minimize the
chances of preventable outages and reduce the impact of scheduled changes.
The MOF Service Lifecycle MOF provides guidelines about how to design, plan, deploy, and maintain IT operational
processes in support of mission-critical service solutions. Because MOF is a generic model,
you must adapt many of the recommendations for use in your company. When you see
references to ―roles‖ in the MOF model, understand that a single person may be assigned
7
many roles, especially in small companies. However, even if a single person represents the
whole IT department, the procedures and recommendations in this model are generally
applicable.
MOF is a structured and flexible model that is based on the following resources:
Microsoft Consulting Services (MCS) and Customer Support teams and their experiences
working with enterprise customers and partners, as well as the internal IT operations
groups at Microsoft.
The IT Infrastructure Library (ITIL), which describes the processes and best practices that
are required for the delivery of mission-critical service solutions.
ISO/IEC 15504 from the International Organization for Standardization (ISO), which
provides a normalized approach to assessing software process maturity.
MOF provides recommendations about how to design, plan, deploy, and maintain various
Microsoft products, such as Microsoft® Windows
® Server 2008, Microsoft
® SQL Server
® 2008
and SharePoint Server 2010 among others.
For detailed information about the Microsoft Operations Framework, see Microsoft
Operations Framework (http://go.microsoft.com/fwlink/?LinkId=21640). For more information
about ITIL see ITIL Service Management (http://go.microsoft.com/fwlink/?LinkId=202814) and
ISO (http://go.microsoft.com/fwlink/?LinkId=84073).
Note:
The third-party Web site information in this article is provided to help you find the
technical information you need. The URLs are subject to change without notice.
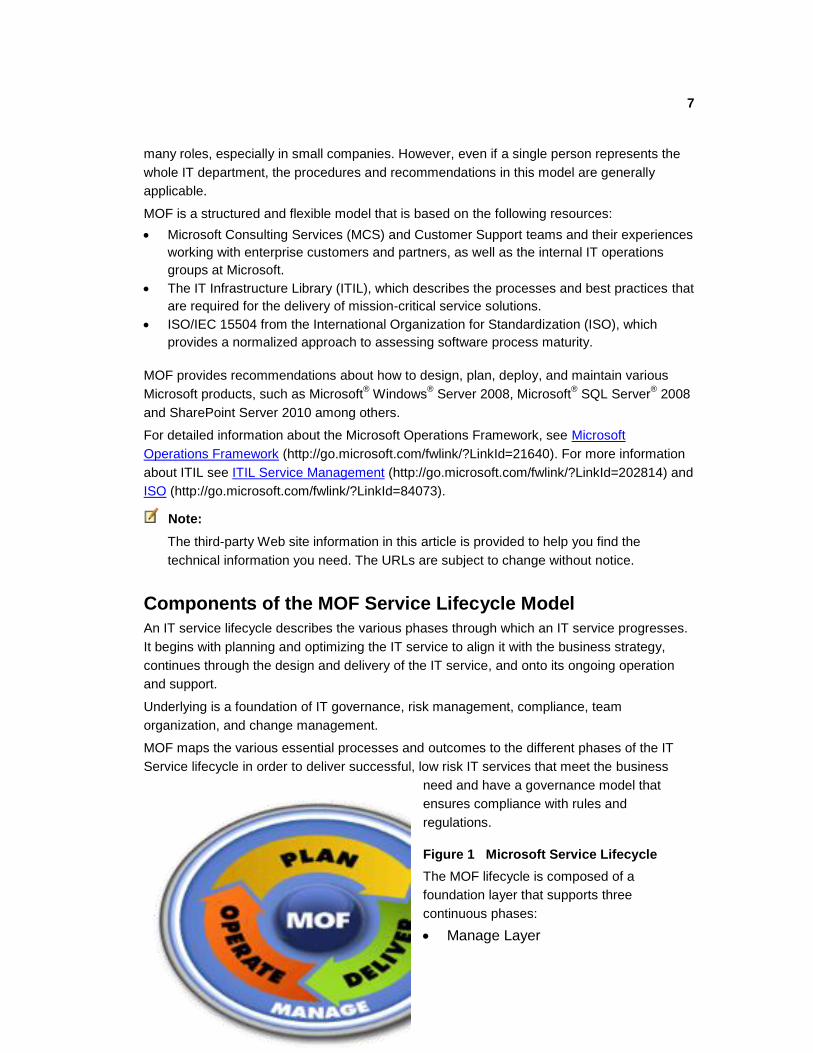
Components of the MOF Service Lifecycle Model
An IT service lifecycle describes the various phases through which an IT service progresses.
It begins with planning and optimizing the IT service to align it with the business strategy,
continues through the design and delivery of the IT service, and onto its ongoing operation
and support.
Underlying is a foundation of IT governance, risk management, compliance, team
organization, and change management.
MOF maps the various essential processes and outcomes to the different phases of the IT
Service lifecycle in order to deliver successful, low risk IT services that meet the business
need and have a governance model that
ensures compliance with rules and
regulations.
Figure 1 Microsoft Service Lifecycle
The MOF lifecycle is composed of a
foundation layer that supports three
continuous phases:
Manage Layer

8
Plan Phase
Deliver Phase
Operate Phase
These components, taken together, form a circular lifecycle that can be applied to services
that range from a single application to a complete IT landscape made up of multiple data
centers.
Service management functions (SMFs) support each phase in the process model. It’s
important to note that although the model describes the MOF quadrants sequentially,
activities from all quadrants can occur at the same time.
Briefly, the lifecycle phases involve the following activities:
The Plan Phase provides guidance about how to plan for and optimize an IT service
strategy. It helps to deliver services that are valuable and compelling for the organization,
predictable and reliable, policy-compliant, cost-effective, and adaptable to changing
business needs.
The Deliver Phase helps IT professionals more effectively deliver IT services,
infrastructure projects, or packaged product deployments, and it ensures that those
services are envisioned, planned, built, stabilized, and deployed in line with business
requirements and the customer’s specifications.
The Operate Phase helps IT professionals efficiently operate, monitor, and support
deployed services in line with agreed-to service level agreement (SLA) targets.
The Manage Layer establishes an integrated approach to IT service management
activities. This integration is enhanced through the establishment of decision-making
processes and the use of risk management, change management, and controls.
The MOF framework formally describes the steps that are involved in this improvement cycle,
assigning responsibilities for each step and enabling the whole process to be managed. At
the end of each phase, there is a review point. With a large IT department, this is likely to be
a review meeting between the people or teams involved, such as release management,
operations, and security. In a smaller company, review points are possibly only a checkpoint
that indicates that you are ready to proceed.
Service Management Functions within the Phases
Each phase of the IT service lifecycle contains service management functions (SMFs) that
define the processes, people, and activities required to align IT services to the requirements
of the business. Each SMF has its own guide that explains the flow of the SMF and details
the processes and activities within.
Although each SMF can be thought of as a stand-alone set of processes, it is important to
understand how the SMFs in all of the phases work to ensure that service delivery is of the
desired quality and risk level. In some phases (such as Deliver), the SMFs are performed
sequentially. In other phases (such as Operate), the SMFs may be performed simultaneously
to create the outputs for the phase.
9
Management Reviews
For each phase in the lifecycle, management reviews (MRs) bring together information and
people to determine the status of IT services and to establish readiness to move forward in
the lifecycle. MRs are internal controls that provide management validation checks, which
ensure that goals are being achieved in an appropriate fashion and that business value is
considered throughout the IT service lifecycle. The goals of management reviews, no matter
where they happen in the lifecycle, are straightforward:
Provide management oversight and guidance.
Act as internal controls at the phase level of the IT lifecycle.
Assess the state of activities and prevent premature advancement into the next phases.
Capture organizational learning.
Improve processes.
During a management review, the criteria that a service must meet to move through the
lifecycle are reviewed against actual progress. The MRs make sure that business objectives
are being met and that IT services are on track to deliver expected value.
The next paragraphs briefly introduce the supported phases, the structure of service
management functions, and the involvement of teams when using the model.
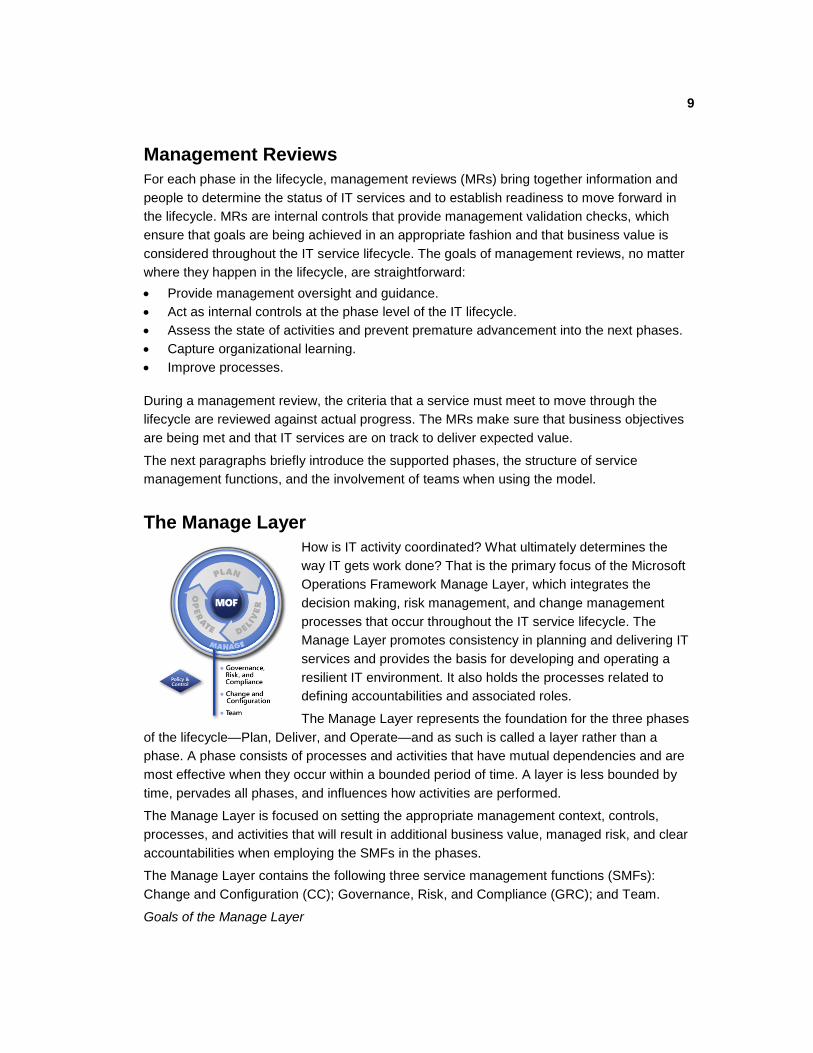
The Manage Layer
How is IT activity coordinated? What ultimately determines the
way IT gets work done? That is the primary focus of the Microsoft
Operations Framework Manage Layer, which integrates the
decision making, risk management, and change management
processes that occur throughout the IT service lifecycle. The
Manage Layer promotes consistency in planning and delivering IT
services and provides the basis for developing and operating a
resilient IT environment. It also holds the processes related to
defining accountabilities and associated roles.
The Manage Layer represents the foundation for the three phases
of the lifecycle—Plan, Deliver, and Operate—and as such is called a layer rather than a
phase. A phase consists of processes and activities that have mutual dependencies and are
most effective when they occur within a bounded period of time. A layer is less bounded by
time, pervades all phases, and influences how activities are performed.
The Manage Layer is focused on setting the appropriate management context, controls,
processes, and activities that will result in additional business value, managed risk, and clear
accountabilities when employing the SMFs in the phases.
The Manage Layer contains the following three service management functions (SMFs):
Change and Configuration (CC); Governance, Risk, and Compliance (GRC); and Team.
Goals of the Manage Layer
10
The primary goal of the Manage Layer is to establish an integrated approach to IT service
management activities. This approach helps to coordinate processes that are described in
the SMFs in the three lifecycle phases.
This coordination is enhanced by establishing decision-making processes, employing risk
management and controls as part of all processes, promoting change and configuration
processes that are appropriately controlled, and dividing work so that accountabilities for
results are clear and do not conflict.
Specific guidance is provided to increase the likelihood that:
The investment in IT delivers the expected business value.
Investment and resource allocation decisions involve the appropriate people.
There is an acceptable level of risk.
Controlled and documented processes are used.
Accountabilities are communicated and have clear ownership.
Policies and internal controls are effective and reliable.
Meeting these goals is most likely to be achieved if IT works towards:
o Explicit IT governance structures and processes.
o IT organization and business sharing the same approach to risk management.
o Periodic management reviews of policies and internal controls.
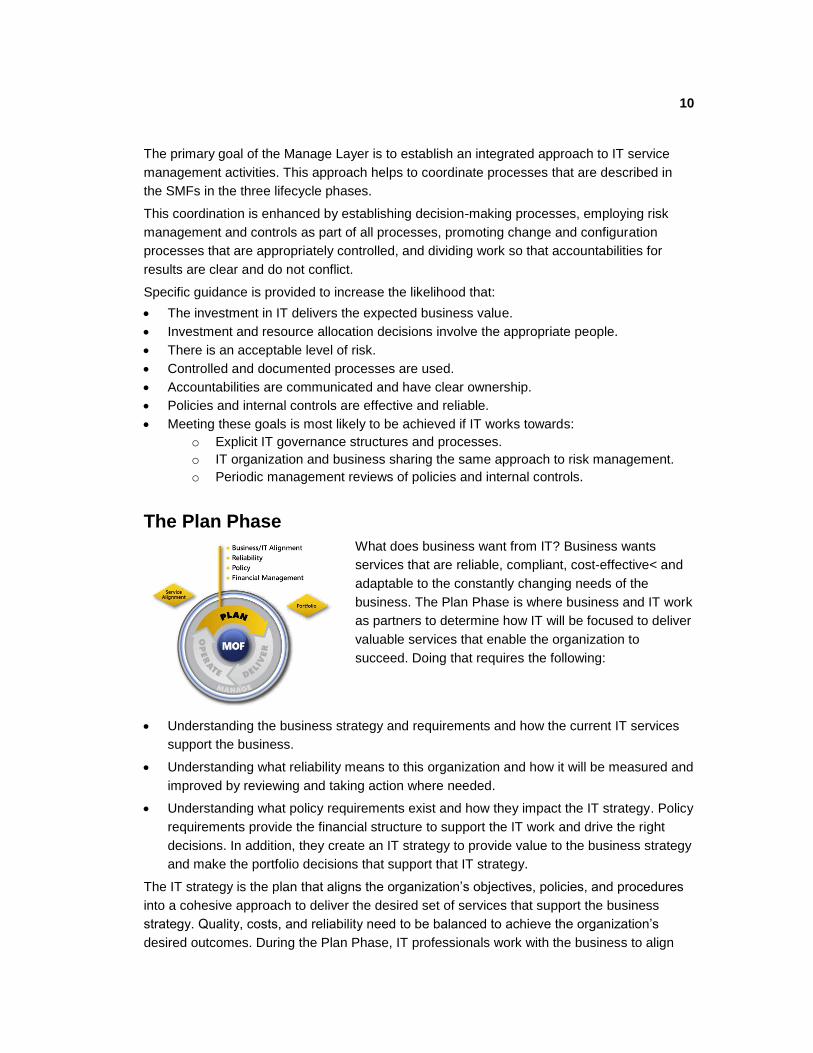
The Plan Phase
What does business want from IT? Business wants
services that are reliable, compliant, cost-effective< and
adaptable to the constantly changing needs of the
business. The Plan Phase is where business and IT work
as partners to determine how IT will be focused to deliver
valuable services that enable the organization to
succeed. Doing that requires the following:
Understanding the business strategy and requirements and how the current IT services
support the business.
Understanding what reliability means to this organization and how it will be measured and
improved by reviewing and taking action where needed.
Understanding what policy requirements exist and how they impact the IT strategy. Policy
requirements provide the financial structure to support the IT work and drive the right
decisions. In addition, they create an IT strategy to provide value to the business strategy
and make the portfolio decisions that support that IT strategy.
The IT strategy is the plan that aligns the organization’s objectives, policies, and procedures
into a cohesive approach to deliver the desired set of services that support the business
strategy. Quality, costs, and reliability need to be balanced to achieve the organization’s
desired outcomes. During the Plan Phase, IT professionals work with the business to align
11
business objectives and functions with the capabilities and constraints of IT. The IT strategy
is the result of this alignment and serves as a roadmap for IT. The strategy continually
evolves and improves as organizations improve their optimizing skills and ability to adapt to
business changes.
Goals of the Plan Phase
The primary goals of the Plan Phase are to provide guidance to IT groups about how to
continually plan and optimize the IT service strategy to ensure that the delivered services are:
Valuable and compelling.
Predictable and reliable.
Compliant.
Cost-effective.
Adaptable to the changing needs of the business.
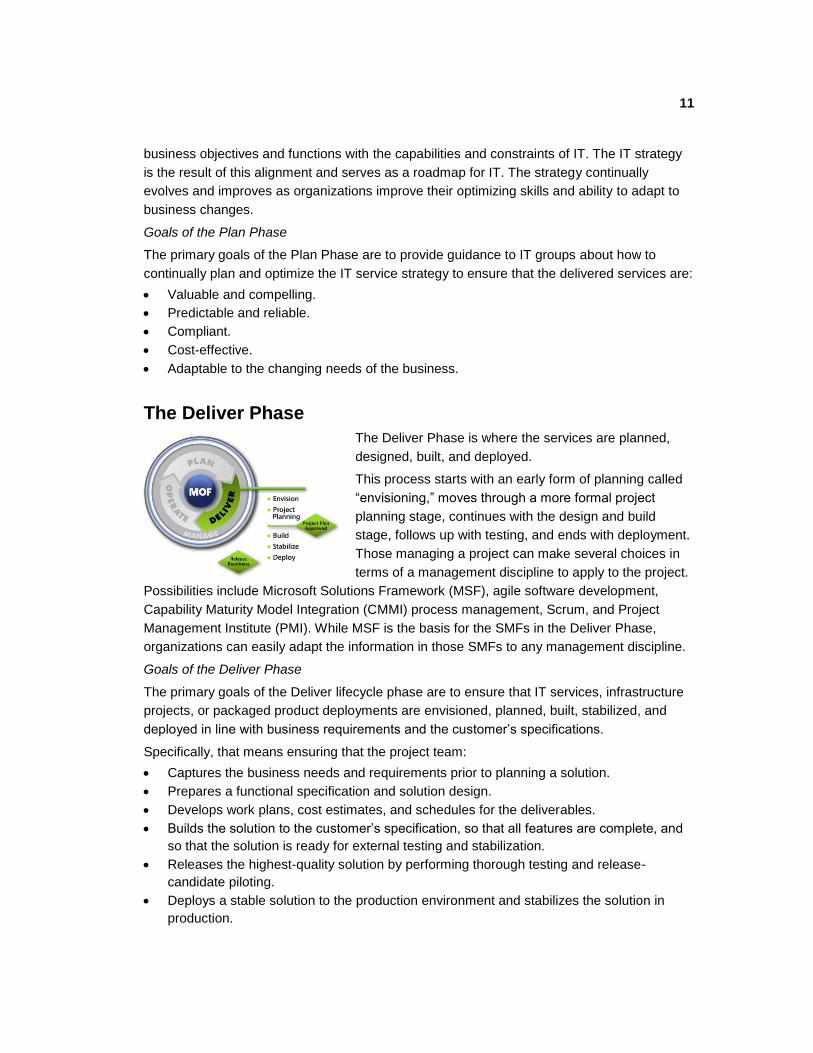
The Deliver Phase
The Deliver Phase is where the services are planned,
designed, built, and deployed.
This process starts with an early form of planning called
―envisioning,‖ moves through a more formal project
planning stage, continues with the design and build
stage, follows up with testing, and ends with deployment.
Those managing a project can make several choices in
terms of a management discipline to apply to the project.
Possibilities include Microsoft Solutions Framework (MSF), agile software development,
Capability Maturity Model Integration (CMMI) process management, Scrum, and Project
Management Institute (PMI). While MSF is the basis for the SMFs in the Deliver Phase,
organizations can easily adapt the information in those SMFs to any management discipline.
Goals of the Deliver Phase
The primary goals of the Deliver lifecycle phase are to ensure that IT services, infrastructure
projects, or packaged product deployments are envisioned, planned, built, stabilized, and
deployed in line with business requirements and the customer’s specifications.
Specifically, that means ensuring that the project team:
Captures the business needs and requirements prior to planning a solution.
Prepares a functional specification and solution design.
Develops work plans, cost estimates, and schedules for the deliverables.
Builds the solution to the customer’s specification, so that all features are complete, and
so that the solution is ready for external testing and stabilization.
Releases the highest-quality solution by performing thorough testing and release-
candidate piloting.
Deploys a stable solution to the production environment and stabilizes the solution in
production.
12
Prepares the operations and support teams to manage and provide customer service for
the solution.
Meeting these goals requires:
Alignment with the service management functions (SMFs) for this phase.
Using periodic management reviews (MRs) to evaluate the effectiveness of the phase.
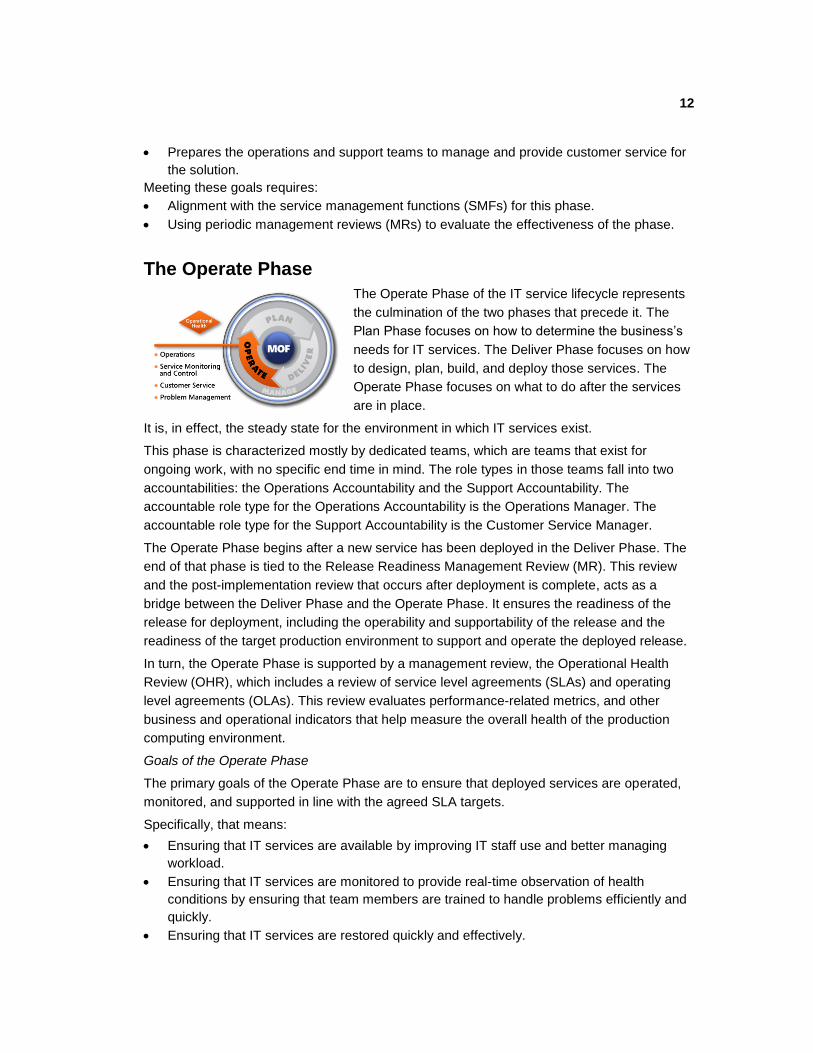
The Operate Phase
The Operate Phase of the IT service lifecycle represents
the culmination of the two phases that precede it. The
Plan Phase focuses on how to determine the business’s
needs for IT services. The Deliver Phase focuses on how
to design, plan, build, and deploy those services. The
Operate Phase focuses on what to do after the services
are in place.
It is, in effect, the steady state for the environment in which IT services exist.
This phase is characterized mostly by dedicated teams, which are teams that exist for
ongoing work, with no specific end time in mind. The role types in those teams fall into two
accountabilities: the Operations Accountability and the Support Accountability. The
accountable role type for the Operations Accountability is the Operations Manager. The
accountable role type for the Support Accountability is the Customer Service Manager.
The Operate Phase begins after a new service has been deployed in the Deliver Phase. The
end of that phase is tied to the Release Readiness Management Review (MR). This review
and the post-implementation review that occurs after deployment is complete, acts as a
bridge between the Deliver Phase and the Operate Phase. It ensures the readiness of the
release for deployment, including the operability and supportability of the release and the
readiness of the target production environment to support and operate the deployed release.
In turn, the Operate Phase is supported by a management review, the Operational Health
Review (OHR), which includes a review of service level agreements (SLAs) and operating
level agreements (OLAs). This review evaluates performance-related metrics, and other
business and operational indicators that help measure the overall health of the production
computing environment.
Goals of the Operate Phase
The primary goals of the Operate Phase are to ensure that deployed services are operated,
monitored, and supported in line with the agreed SLA targets.
Specifically, that means:
Ensuring that IT services are available by improving IT staff use and better managing
workload.
Ensuring that IT services are monitored to provide real-time observation of health
conditions by ensuring that team members are trained to handle problems efficiently and
quickly.
Ensuring that IT services are restored quickly and effectively.
13
Meeting these goals requires:
Alignment with the service management functions (SMFs) for this phase.
Using periodic management reviews (MRs) to evaluate the effectiveness of the phase.
Service Management Functions
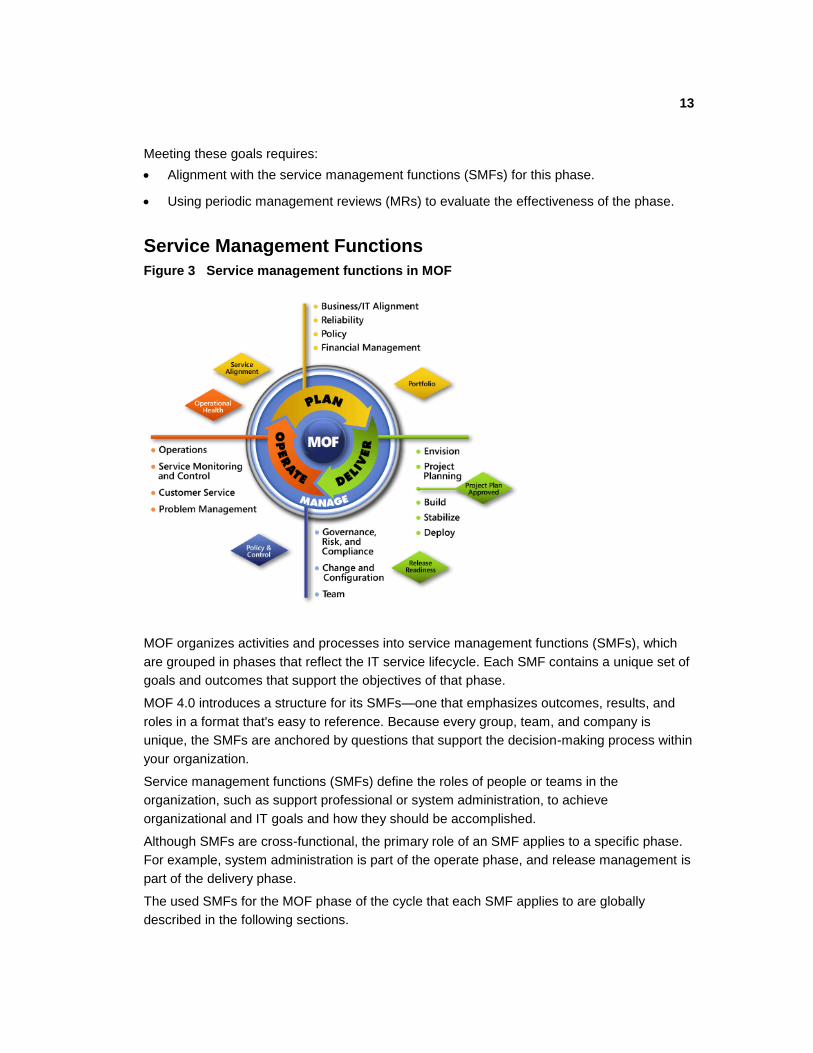
Figure 3 Service management functions in MOF
MOF organizes activities and processes into service management functions (SMFs), which
are grouped in phases that reflect the IT service lifecycle. Each SMF contains a unique set of
goals and outcomes that support the objectives of that phase.
MOF 4.0 introduces a structure for its SMFs—one that emphasizes outcomes, results, and
roles in a format that's easy to reference. Because every group, team, and company is
unique, the SMFs are anchored by questions that support the decision-making process within
your organization.
Service management functions (SMFs) define the roles of people or teams in the
organization, such as support professional or system administration, to achieve
organizational and IT goals and how they should be accomplished.
Although SMFs are cross-functional, the primary role of an SMF applies to a specific phase.
For example, system administration is part of the operate phase, and release management is
part of the delivery phase.
The used SMFs for the MOF phase of the cycle that each SMF applies to are globally
described in the following sections.
14
Service Management Functions within the Plan Phase
Business/IT Alignment SMF
Used to align business and IT strategy to ensure that IT services provide business value.
Reliability SMF
An SMF that is incorporated to understand, set targets for, and measure IT service
reliability.
Policy SMF
The purpose of this SMF is to help the IT organization remain in compliance with
directives and is for anyone with responsibility for IT policy.
Financial Management SMF
This SMF covers the responsibility for measuring and evaluating the costs and benefits—
or more comprehensively, the business value—of IT services.
Service Management Functions within the Deliver Phase
Envision SMF
Used to establish a project team, preparing and delivering a vision/scope document, and
preparing a risk assessment.
Project Planning SMF
This SMF is used for preparing the functional specification, solution design and preparing
work plans, cost estimates, and schedules needed for managing the builds.
Build SMF
The build SMF can be used during actual development of an IT service solution, where a
development and a test lab are created, and during the preparation of an IT service
solution for pilot deployment.
Stabilize SMF
Used for supporting the process of the release of the highest-quality IT service solution
possible at the Release Readiness Milestone this SMF is used to test a feature-complete
solution, prepare release candidate versions, deal with feedback, and fix reported issues.
Deploy SMF
This SMF is used when the team will be stabilizing the solution in the production
environment and transferring responsibility for the solution from the project team to the
Operations and Support teams.
Service Management Functions within the Operate Phase
Operations SMF
15
This SMF is used for managing the daily operations like the required work that is
identified and to discover how a team can aim to reduce reactive time, minimize
disruptions, and ensure that recurring tasks are executed well.
Service Monitoring and Control SMF
Using the Service monitoring and Control SMF, we can observe the health of the IT
services and take action to minimize the impact of service and system incidents.
Customer Service SMF
Customer Service SMF is used to provide a positive experience for the service provider
and the end-users and to address the complaints and issues that arise during the normal
use of an IT service.
Problem Management SMF
The Problem Management SMF defines processes to provide root cause analysis to
identify problems and to predict future problems.
Service Management Functions within the manage layer
Governance, Risk and Compliance SMF
This SMF is used to support an organization and sustain its growth while managing the
risk and constraints facing an IT environment.
Change and Configuration Management SMF
Ensures that changes are planned and controlled to deliver robust IT Services
Team SMF
Ensures clear accountability, team roles and realistic work assessment for using with
agile, flexible, and scalable teams.
Management Reviews (MRs)
For each phase in the lifecycle, management reviews (MRs) serve to bring together
information and people to determine the status of IT services and to establish readiness to
move forward in the lifecycle. MR’s are internal controls that provide management validation
checks, ensuring that goals are being achieved in an appropriate fashion, and that business
value is considered throughout the IT service lifecycle. The goals of management reviews, no
matter where they happen in the lifecycle, are straightforward:
Provide management oversight and guidance.
Act as internal controls at the phase level of the IT lifecycle.
Assess the state of activities and prevent premature advancement into the next phases.
Capture organizational learning.
Improve processes.
16
During a management review, the criteria that a service must meet in order to move through
to the next phases in the lifecycle are reviewed against actual progress. The MRs make sure
that business objectives are being met, and that IT services are on track to deliver expected
value.
The MRs, their locations in the IT service lifecycle, and their inputs and outputs are shown in
the following table.
Table 1. MOF Management Reviews
MR Owned
by
Phase
Inputs Outputs
Service
Alignment
Plan Results of the Operational Health Review
Service Level Agreements (SLA)
Customer input
Opportunity for a new or improved project
Request for changes to SLA
Portfolio Plan Project proposals Formation of a team
Initial project charter
Project Plan
Approved
Deliver Business requirements
Vision statement
Formation of the project team
Approved project plan
Release
Readiness
Deliver Documentation showing that the release meets requirements
Documentation showing that the release is stable
Documentation showing that the release is ready for operations
Go/no go decision about release
Operational
Health
Operate Operating level agreement (OLA) documents
OLA performance reports
Operational guides and service-solution specifications
Request for changes to the OLA documents
Request for changes to the IT services
Configuration changes to underlying technology components
17
MOF Team Model Roles
The MOF Process Model and the MOF Team Model are the core models that define the
Microsoft Operations Framework. The MOF Team Model provides guidelines for organizing
teams and the functions and competencies of each role cluster. The role clusters in the Team
Model work with the SMFs of the Process Model. The Team Model role clusters enable the
SMF processes to be followed.
The MOF Team Model also suggests combinations of functions that should be kept separate.
For example, the team that tests a change before it is released to the production environment
should be separate from the team that developed the change. This can be critical to ensuring
that changes to your SharePoint environment are effectively tested in a lab environment that
mimics your production environment as closely as practicable. This practice ensures that
unforeseen impacts that may result from implementing a change are identified and mitigated
before a change is implemented in your production environment. Examples of this include,
but are not limited to, installation of hardware firmware updates, application hotfixes, and
service packs.
Best Practices for SharePoint Environments
Best practices are recommendations that are based on the knowledge and experience that IT
professionals have gained across many environments. They provide standard procedures for
typical tasks that your SharePoint administrators must accomplish daily, and list the tools that
they should use to manage a SharePoint environment.
Typical tasks for SharePoint administrators include the following:
Capacity and Availability Management
Define how and what to measure to predict future capacity requirements and to report
about the capacity, reliability, and availability of your systems. You must ensure that
servers that are running SharePoint Server are sized to handle the load on the system,
and that unplanned downtime is kept under the levels defined in the SLA. Additionally,
you will have to upgrade hardware to continue to meet the defined requirements.
Change Management and Configuration Management
Control how changes are made to your IT systems. This should include testing,
application feedback and contingency plans, documentation of all changes, and approval
from management if problems occur. Keep a record of your software and hardware
assets and their configurations.
System Administration
Outline standard methods for doing administrative tasks, such as database administration
and site administration.
Security Administration
18
Have a detailed policy and plan which protects data confidentiality, data integrity, and
data availability of your IT infrastructure. This includes day-to-day activities and tasks that
are related to maintaining and adjusting the IT security infrastructure.
System Troubleshooting
Outline methods for dealing with unexpected issues, including steps to prevent similar
issues in the future.
Service Level Agreements
Maintain a set of goals for the performance of your IT systems and regularly measure
performance against these goals.
Documentation
Document standard procedures, such as configuration information and lessons learned,
and make them available to the staffs that need them. As changes to the configuration
are made, update the documentation accordingly.
Capacity and Availability Management The purpose of capacity management and availability management is to measure and control
system performance. We recommend that you implement capacity management and
availability management procedures so that you can measure and control system
performance. You need to know whether the system is available and whether it can handle
the current and the projected demands by setting baselines and monitoring the system to
look for trends.
Capacity Management
Capacity management involves planning, sizing, and controlling service capacity to ensure
that the minimum performance levels specified in your SLA are exceeded. Good capacity
management ensures that you can provide IT services at a reasonable cost and still meet the
levels of performance defined in your SLAs with the client. These criteria can include the
following:
System Response Time
This is the measured time that the system takes to do typical actions. Examples include,
the time for a client to receive the ―last byte‖ of a SharePoint site homepage, the time that
Windows allowed to do a full backup of a SharePoint content database, or the time taken
to download a specific document from a document library.
Storage Capacity
This is the capacity of a storage system, whether it is a content database, a backup
device, or a local drive. Examples include the maximum amount of storage space to be
provided per site and the amount of time that backups should be stored before being
overwritten.
19
Adjusting capacity is frequently a case of ensuring that enough physical resources are
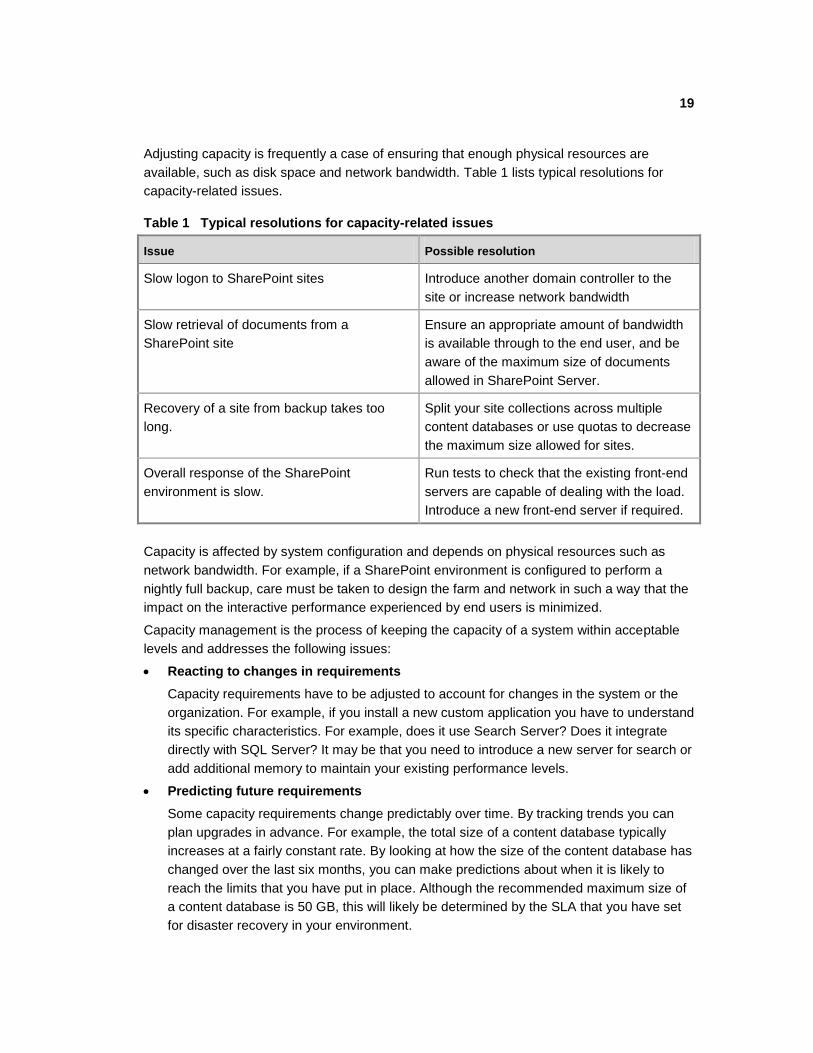
available, such as disk space and network bandwidth. Table 1 lists typical resolutions for
capacity-related issues.
Table 1 Typical resolutions for capacity-related issues
Issue Possible resolution
Slow logon to SharePoint sites Introduce another domain controller to the
site or increase network bandwidth
Slow retrieval of documents from a
SharePoint site
Ensure an appropriate amount of bandwidth
is available through to the end user, and be
aware of the maximum size of documents
allowed in SharePoint Server.
Recovery of a site from backup takes too
long.
Split your site collections across multiple
content databases or use quotas to decrease
the maximum size allowed for sites.
Overall response of the SharePoint
environment is slow.
Run tests to check that the existing front-end
servers are capable of dealing with the load.
Introduce a new front-end server if required.
Capacity is affected by system configuration and depends on physical resources such as
network bandwidth. For example, if a SharePoint environment is configured to perform a
nightly full backup, care must be taken to design the farm and network in such a way that the
impact on the interactive performance experienced by end users is minimized.
Capacity management is the process of keeping the capacity of a system within acceptable
levels and addresses the following issues:
Reacting to changes in requirements
Capacity requirements have to be adjusted to account for changes in the system or the
organization. For example, if you install a new custom application you have to understand
its specific characteristics. For example, does it use Search Server? Does it integrate
directly with SQL Server? It may be that you need to introduce a new server for search or
add additional memory to maintain your existing performance levels.
Predicting future requirements
Some capacity requirements change predictably over time. By tracking trends you can
plan upgrades in advance. For example, the total size of a content database typically
increases at a fairly constant rate. By looking at how the size of the content database has
changed over the last six months, you can make predictions about when it is likely to
reach the limits that you have put in place. Although the recommended maximum size of
a content database is 50 GB, this will likely be determined by the SLA that you have set
for disaster recovery in your environment.

20
Availability Management
Availability management is the process of ensuring that any IT service consistently and cost-
effectively delivers the level of availability that is required by the customer. Availability
management is concerned with minimizing loss of service and with ensuring that appropriate
action is taken if service is lost. In a SharePoint environment, you may be concerned about
whether the Search Service is available, whether a content database is online, and so on. An
SLA defines an acceptable frequency and length of outages and allows for certain periods
when the system is unavailable for planned maintenance and unexpected failures.
If you have to provide reports to your management about the availability of systems, or if you
have financial or other penalties associated with missing availability targets, you must record
availability data. Even if you do not have such formal requirements, it is a good idea to at
least know how frequently a system has failed in a certain time period, for example, system
availability in the last 12 months and how long it took to recover from each failure. This
information will help you measure and improve your team’s effectiveness in responding to a
system failure. It can also provide you with useful information if there is a dispute.
Measures related to availability are as follows:
Availability
This is typically expressed as the time that a system or service is accessible compared to
the time that it is down. It is typically expressed as a percentage. (You may see
references to ―three nines‖ or ―five nines‖. These refer to 99.9% or 99.999% availability.)
Reliability
This is a measure of the time between failures of a system and is sometimes expressed
as mean (or average) time between failures (MTBF).
Time to Repair
This is the time taken to recover a service after a failure has occurred and is sometimes
expressed at mean (or average) time to repair (MTTR).
Availability, reliability, and time to repair are related as follows:
Availability = (MTBF – MTTR) / MTBF
For example, if a server fails twice over a six-month period and is unavailable for an average
of 20 minutes, the MTBF is three months or 90 days and the MTTR is 20 minutes. Therefore,
Availability = (90 days – 20 minutes) / 90 days = 99.985%
Availability management is the process of ensuring that availability is maximized and kept
within the parameters defined in SLAs. Availability management includes the following
processes:
Monitoring
Examining when and for how long services are unavailable.
Reporting
Availability figures should be regularly provided to management, users, and operations
teams. These reports should highlight trends and identify areas that are doing well and
21
areas that require attention. The report should summarize compliance with targets set in
the SLAs.
Improvement
If availability does not meet targets that are defined in the SLAs or where the trend is
toward reduced availability, the availability management process should plan remedial
steps. This should include working with other responsible teams to highlight reasons for
outages and to plan remedial actions to prevent a recurrence of the outages.
Capacity and availability measurements are repetitive tasks that are ideally suited to
automated tools and scripts such as Microsoft Systems Center Operations Manager, which is
discussed later in this document.
Change Management Changes to your IT environment are inevitable. Changes include new technologies, systems,
applications, hardware, tools, processes, and changes in roles and responsibilities. An
effective change management system lets you introduce changes to your IT environment
quickly and with minimal service disruption. A change management system brings together
the teams involved in modifying a system. For example, deciding to take advantage of the
Office Web Applications. This is an integrated SharePoint Service application that enables
users to read and edit documents within a browser. The implementation of this service, after
you have gone into production, requires the involvement of a several teams:
Test Team
This team load-tests the Office Web Applications on a test server, in the process
providing information on the expected usage patterns and expected performance of the
productions servers.
SharePoint Administrators
This team determines the deployment strategy and scripts the installation where possible.
The team is responsible for ensuring that the change is deployed on the production
environment and, it is responsible for administration afterwards. The team must
understand the effect of the changes and incorporate them in procedures before the
changes are put into production
Network Team
This team is responsible for changes to firewall rules which allow access from the
Internet to the Office Web Applications servers if required. The team is also responsible
for ensuring that the amount of available bandwidth can support the additional load.
Security Team
This team assesses security and minimizes risks. The security team must review known
vulnerabilities and ensure that security risks are minimized.
User Acceptance Team
22
This team is composed of users who are willing to test the system and offer feedback for
improvements.
The change management process defines the responsibilities of each team and schedules
the work to be performed, incorporating checks and tests where they are required. Change
controls will vary depending on the complexity and expected effect of a change. They can
vary from automatic approval of minor changes, to change review meetings, to full project-
level reviews. To illustrate this better, the groups of changes are discussed in this section.
Major Changes
Major changes have a global effect on the system and may require input from various
teams. An example of this is upgrading from Office SharePoint Server 2007 to
SharePoint Server 2010. Major changes affect many different teams and perhaps
different systems. The change management process may follow a procedure that is
similar to the Office Web Applications example discussed earlier, but it will probably
include one or more change review meetings to inform the teams that will be involved in
the change or be affected by the change.
Significant Changes
Significant changes require significant resources to plan, build, and implement.
Appropriate change controls should be introduced to ensure that the effect of the change
is understood, deployment procedures are tested, and the rollback and contingency plans
are ready. An example of a significant change is deploying a new service pack.
Minor Changes
Minor changes do not significantly affect the IT environment, for example, modifying
certain SharePoint security policies.
Standard Changes
Standard changes are performed regularly and are well understood and documented.
Examples include creating a new SharePoint site collection or configuring a new
SharePoint content source. Regular changes should be documented in standard
operating procedures (SOPs), but they do not require change controls. For example, a
procedure for creating a new content database may state that the maximum number of
site collections should always be set to 600.with the basic storage quota allowing for 250
MB of storage. The change management process should review all changes to the
procedure, but it should not, for example, be involved in creating every content database.
The following example of change management examines how different teams interact and
the actions that are performed when a new service pack is deployed. These actions are
organized and managed by the change management process.
Raise a change request
The security team has assessed the latest service pack and confirmed that it resolves a
possible vulnerability in the production system. The team raises a change request to
have the new service pack applied to all servers running SharePoint Server.
Service pack release notes review

23
The SharePoint administrator team reviews the service pack release notes to identify the
effect on the system.
A series of lab tests is done
The SharePoint administrator team must perform test updates on a server in a non-
production environment to decide whether the service pack can be applied successfully
without affecting any of the installed applications and server systems. If there are third-
party or internally-created applications that interface with SharePoint Server in a
production environment, these should be also tested. These tests can also be used to
estimate the time required to perform the upgrades.
Users are informed of the outage
The SharePoint administrator team, communications team, or user help desk informs all
affected users about the planned maintenance cycle and how long the service will be
unavailable.
A full backup of SharePoint is performed before the upgrade
The SharePoint administrator team must ensure that there is a valid backup in place to
be able to revert to the original system state if the service pack installation fails. It is
recommended that the backup be restored to a standby server to have this system
readily available if there are problems.
The service pack is deployed
The SharePoint administrator team does the installation during the planned maintenance
cycle.
Managing the Timing of Changes
We recommend that you implement a procedure for scheduling changes to avoid disruptions
in overlapping sections of your work. For example, two teams may both be planning a minor
change to a system. One team may be applying a service pack while another team is
installing a custom Web Part that displays the weather in your location. Neither team is
affected by the changes that the other team is planning, and each team may not necessarily
know about changes that the other team is planning. If both changes occurred at the same
time, there could be problems implementing the changes. Also, if there are issues after the
changes have been applied, for example if the weather Web Part fails, it may be difficult to
decide which change should be rolled back. There should be regular maintenance periods
set up between IT and management to test the changes and accept them.
Configuration Management
Configuration management is the process of recording and tracking hardware and software
assets and system configuration information. It is generally used to track software licenses,
maintain a standard hardware and software build for client computers and servers, and define
naming standards for new computers. Configuration management generally covers the
following categories:

24
Hardware
This category tracks the pieces of equipment that the IT organization owns, where
equipment is located, and who uses equipment. This information enables an organization
to plan and budget for upgrades, maintain standard hardware builds, report on the value
of IT assets for accounting purposes, and help prevent theft.
Software
This category tracks software that is installed on each computer, the version numbers,
and where the licenses are held. This information helps plan upgrades, ensure that
software is licensed, and detect the existence of unauthorized (and unlicensed) software.
Standard Builds
This category tracks the current standard build for the client computers and servers and
whether the client computers and servers meet this standard. The existence and
enforcement of standard builds helps support staff because the staff is required to
maintain only a limited number of versions of each piece of software.
Service Packs and Hotfixes
This category tracks which service packs are tested and approved for use and which
computers are up-to-date. This information is important to minimize the risk of computers
being compromised and to detect users who have installed unapproved updates.
System Configuration Information
This category tracks the function of a system, the interaction between system elements,
and the processes that depend on the system running smoothly. For example, a
connector to a third-party e-mail system may be configured on a single server. The e-mail
system’s dependence on this server should be understood and contingency plans may
be required if there is a failure. If a second connector is installed on another server,
dependencies and contingency plans will probably change.
Implementing Configuration Management
After you determine the purpose of your configuration management exercise and decide what
items need managing, you need to implement configuration management by collecting data
and reporting data. The simplest approach for small organizations is to collect data manually
(number and model of client computers, operating system, software installed) and store it in a
Microsoft Office Word or Microsoft Office Excel document. For larger, more complex, and
constantly changing systems, the discovery of assets and collection of detailed information
must be automated. Decide what information is relevant to your organization and record it in
a database.
The configuration management database is a useful tool for support staff and management in
the following areas:
Security Audits
25
The database enables you to identify servers running SharePoint Server and client
computer systems that need to have hotfixes applied or that have missed the installation
of a service pack or the latest antivirus updates.
Software Installation
If you identify client computers that already have Microsoft Office installed, this will save
time if you are manually deploying Office.
Configuration Information
If you maintain an up-to-date list of all settings that have been modified from their default,
then you will be able to troubleshoot issues quickly and more effectively.
Planning Upgrades
If a capacity review reveals that additional storage space is required on your SharePoint
database servers, it’s important to know if each server has an internal RAID controller. If
they do, then are they the same model? Do they have the same number of disks
installed? The configuration management database will indicate the type of disk that can
be installed, the number, and the upgrade path in each case.
Tools Used for Configuration Management
There are many tools to discover, audit, and report assets. Some of these tools are
discussed in this section.
Automated Scripts
You can write simple scripts to report items like the operating system, service pack level,
and existence of software on a specific set of computers. You can writer these scripts to
an organization’s exact requirements; however, the required number of scripts and their
complexity can make scripts expensive to create and maintain.
Automated Tools
Depending on the size of your business and your organizational needs, you may want to
consider using automated tools. Tools such as Microsoft Systems Center Configuration
Manager incorporate standard report templates (such as service pack level) and also
enable you to create customized reports, for example, for a custom application. Microsoft
Systems Center Operations Manager (SCOM) can also be used to report on hardware
and software configurations.
SharePoint Server can be used to record configuration data and make it accessible to the
appropriate IT personnel.
Relationship with Change Management
Configuration management is closely related to change management. Configuration
management identifies the need for change and identifies and records that a change has
occurred. For example, the configuration management database can be used to identify
servers that require a hotfix. Change management then defines the process for applying the
hotfix.
26
Conversely, if a new software package is rolled out, the change management process should
supply this information to the configuration management system. The configuration
management tools will probably need to be configured to identify the new software so that
they can discover and track where and when the software is deployed.
System Administration
System administration includes the day-to-day administrative tasks, both planned and on-
demand, that are required to keep an IT system operating smoothly. Typically, system
administration tasks are covered by written procedures. These procedures ensure that the
same standard tools and methods are used by all support staff.
In a SharePoint environment, typical system administration tasks include creating site
collections, backing up and archiving sites, monitoring logs, maintaining and recovering
documents, and updating antivirus software.
System Troubleshooting
An organization must be prepared to deal with unexpected problems and should have a
procedure to manage problems from the point at which they are reported until their resolution.
Information about how support staff diagnosed a problem should be recorded and used in the
future to avoid unnecessarily repeating completed work.
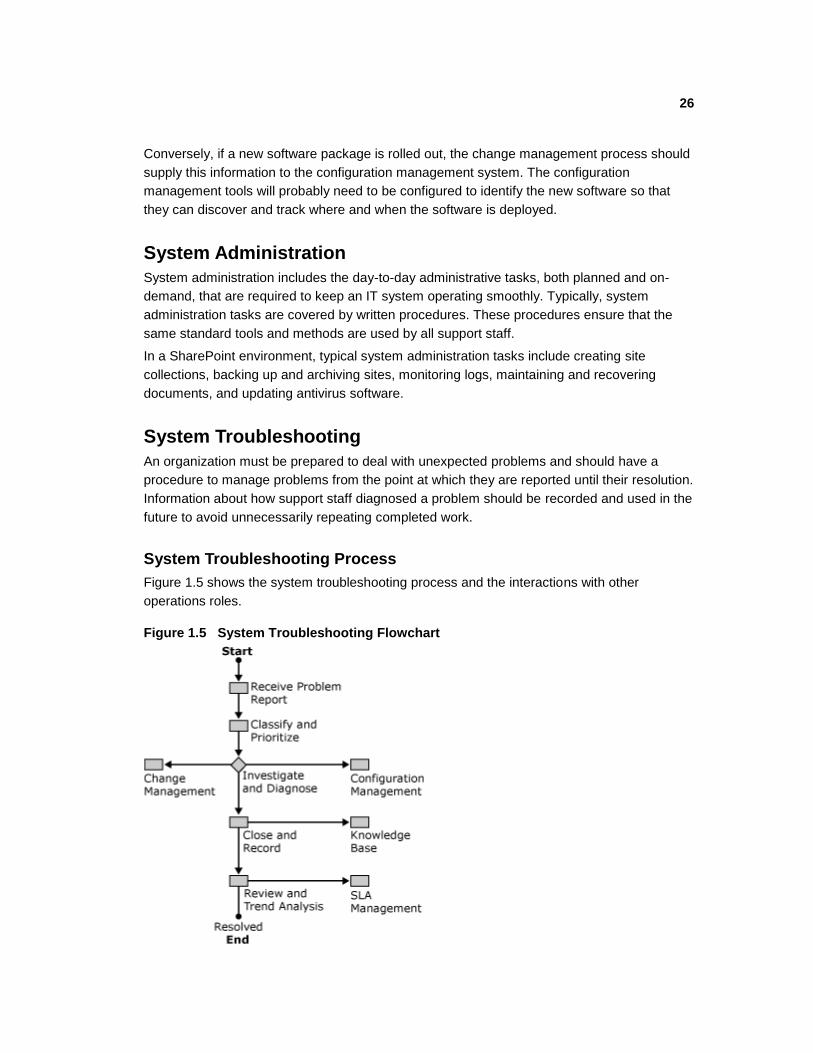
System Troubleshooting Process
Figure 1.5 shows the system troubleshooting process and the interactions with other
operations roles.
Figure 1.5 System Troubleshooting Flowchart

27
Classify and Prioritize
This task is typically performed by the service desk. For example, a problem may be
grouped as a software issue or a hardware issue. The problem is then routed to the
appropriate support team for investigation. The rules for determining the priority of a
problem, together with the time to respond and time to resolve, are typically defined in the
SLA.
Investigate and Diagnose
The appropriate support team diagnoses the problem and proposes changes to resolve
the problem. If the solution is simple and does not require change control, the solution
can be applied immediately. If the solution is not simple, a request for change should be
raised and the proposed work should be managed by the change management process,
frequently under a ―fast-track‖ procedure. Any changes that are made should be recorded
using the configuration management process.
Close and Record
After testing the resolution, the problem should be closed. If there are lessons to be
learned from the problem, an entry should be created in the knowledge base.
Review and Trend Analysis
Periodic reviews of recent problems should be performed to identify problem trends. For
example, if your users are experiencing frequent problems with slow logons to their
SharePoint sites, network bandwidth issues may be the cause. Problem resolution times
and the effect of any outages on system availability should be reviewed and compared
with the SLA. The person who liaises with the customer on service issues, such as an
account manager, should be informed of any significant problems.
Problem Management Tools
Service desk tools enable staff to record, classify, and prioritize new problems. Tools will then
provide the workflow processes to manage the problem ―ticket‖ through investigation and
diagnosis, often by more than one support team. Tools, which will frequently provide reports
about resolution times and historical trends, may also include a knowledge base database,
which can be used to search through past problems.
The Microsoft Knowledge Base is a useful record of support issues that have been
encountered by Microsoft. For more information, see the Microsoft Help and Support Web
site (http://go.microsoft.com/fwlink/?linkid=14898).
Third-party software typically requires customization to suit the organization’s needs, such as
the organization of teams, reporting requirements, and measures required by the SLA.
Service-Level Agreements
The service-level agreement (SLA) is a document that defines the services that your
customer expects from you. The complexity and content of this document depends largely on
whether customers are internal (within your company) or external.
28
External Customers
If your customer is external, the SLA may be part of a legal contract with financial incentives
and penalties for performance that falls inside or outside defined levels of service. Defining
these levels of service should be part of the overall contract negotiation.
As with all contracts, it’s important that both parties understand expectations. The SLA
defines these expectations. The contents of the document should change infrequently and
only because of negotiations with the customer.
Internal Customers
If your customer is internal, you may still want to define the services that are expected of
operations teams and of IT systems. The SLA may be created by the operations staff and
intended as a set of goals for the availability of IT services within your organization.
Alternatively, performance levels may be set by management and used as benchmarks when
assessing staff performance.
Typical Criteria
Service level agreements include components that define criteria of minimum levels of
availability, support, and capacity.
Availability
Define the hours and the operating systems on which sites and other SharePoint services
will be available. Any routine maintenance that affects service availability should be
defined. Define external factors that affect service, for example the loss of Internet
connectivity.
Support
Define the hours when support for a system will be available. Specify methods for
customers to contact support staff, how incidents are grouped, and target time to respond
and to resolve the incident. Define frequency and content of feedback to the customer.
Capacity
Define the maximum allowed size of SharePoint sites and the steps to take if the limit is
exceeded. Define the maximum allowed time to do standard tasks, such as the time to
retrieve a document from a document library. Define the maximum number of users and
agree to a process to follow to increase capacity if more users are added.
Documentation
The Microsoft Operations Framework (MOF) model is composed of many service
management functions. Documentation about how and when tasks are performed can be
shared with members of the same team or with other teams. The method of storing and
sharing documentation can vary according to the type of function. For example, the
procedures for system administration may be stored as Word documents because they are
likely to be printed and referenced frequently. Configuration management information may be
29
automatically generated and stored in a database for easy searching and indexing. Some
documentation may be sensitive and should be restricted.
Document Management Systems
A documentation management system acts as a central repository for documents and
ensures that only the latest revision of a document is available. You can also consider
archiving the older version of the document for reference purposes. SharePoint Server
provides functionality suitable to this task.
Databases
Several tools and management functions have been discussed that are suited to using
databases. The configuration management process is likely to use automated processes that
store large amounts of data that require indexing and searching. Support staff may search a
database of past problems and resolutions when troubleshooting new problems.
It is likely that there will be different databases being used for different purposes. Decide if
these databases should be linked or consolidated. For example, if the service desk identifies
several problems with a common theme (such as new software causing a problem with a
particular network card), the support staff can query the configuration database to predict
how many computers might be affected.
30
Monitoring SharePoint
To ensure the availability and reliability of your SharePoint Server 2010 environment, you
must actively monitor the physical platform, the operating system, and all important
SharePoint Server 2010 services. Preventative maintenance will help you identify potential
errors before an error causes problems with the operation of your SharePoint environment.
Preventative maintenance combined with disaster recovery planning and regular backups will
help minimize problems if they occur. Monitoring your SharePoint environment involves
checking for problems with connections, services, server resources, and system resources.
You can also set alerts to notify administrators when problems occur. Windows Server and
SharePoint Server 2010 provide many monitoring tools and services to ensure that your
SharePoint environment is running smoothly. The key advantages to daily monitoring are as
follows:
Ensures that the performance requirements of your service level agreements (SLAs) are
being met.
Ensures that specific administrative tasks, such as daily backup operations and checking
server health, are being successfully completed.
Enables you to detect and address issues, such as bottlenecks in the server performance
or need for additional resources, in your SharePoint environment before they affect
productivity.
The following maintenance tasks let you establish criteria for normal behavior of your
environment and to detect abnormal activity. It is important to implement these daily
maintenance tasks so that you can capture and maintain data about your SharePoint
environment, such as usage levels, possible performance bottlenecks, and administrative
changes.
By using and customizing the checklists in this document, you ensure that potential problems
are discovered and remedial action taken as early as possible. The following sections
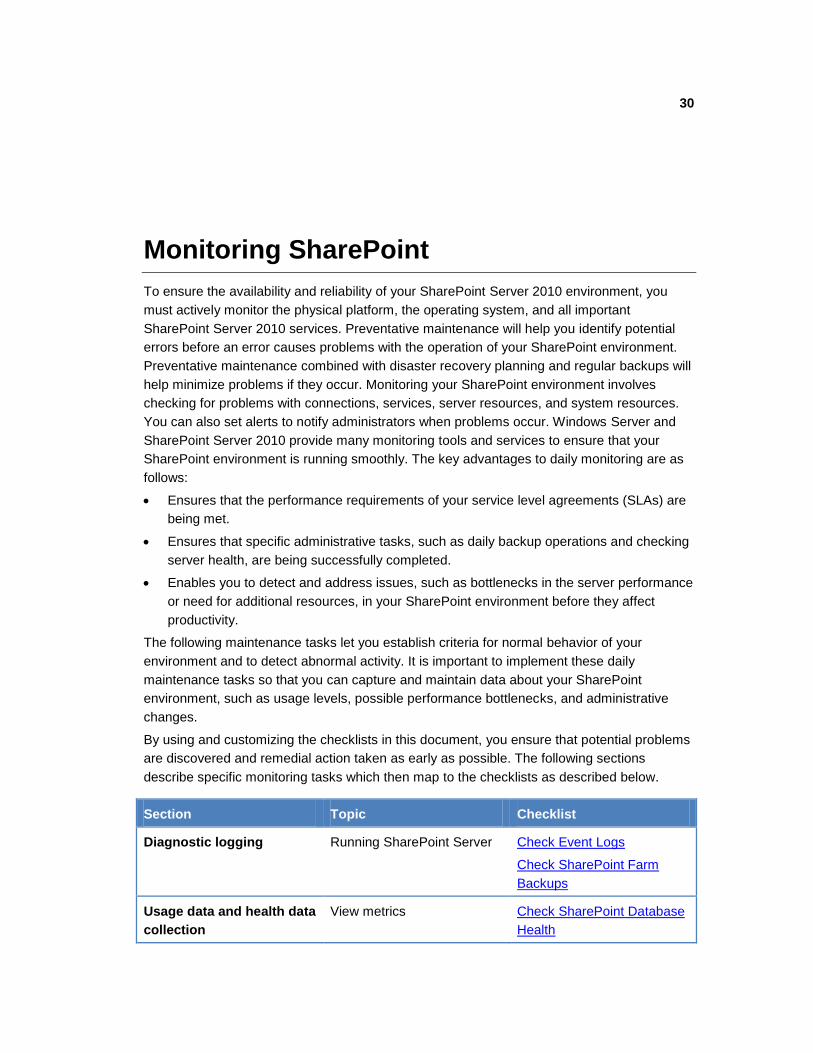
describe specific monitoring tasks which then map to the checklists as described below.
Section Topic Checklist
Diagnostic logging Running SharePoint Server Check Event Logs
Check SharePoint Farm
Backups
Usage data and health data
collection
View metrics Check SharePoint Database
Health
31
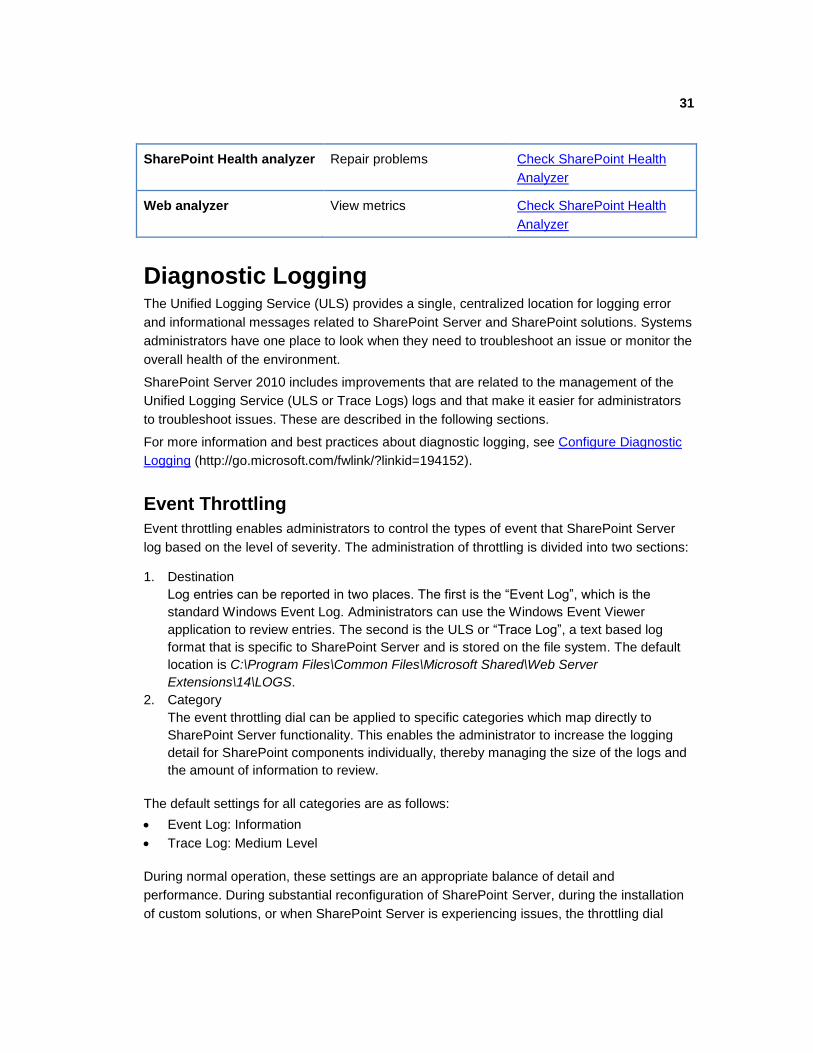
SharePoint Health analyzer Repair problems Check SharePoint Health
Analyzer
Web analyzer View metrics Check SharePoint Health
Analyzer
Diagnostic Logging The Unified Logging Service (ULS) provides a single, centralized location for logging error
and informational messages related to SharePoint Server and SharePoint solutions. Systems
administrators have one place to look when they need to troubleshoot an issue or monitor the
overall health of the environment.
SharePoint Server 2010 includes improvements that are related to the management of the
Unified Logging Service (ULS or Trace Logs) logs and that make it easier for administrators
to troubleshoot issues. These are described in the following sections.
For more information and best practices about diagnostic logging, see Configure Diagnostic
Logging (http://go.microsoft.com/fwlink/?linkid=194152).
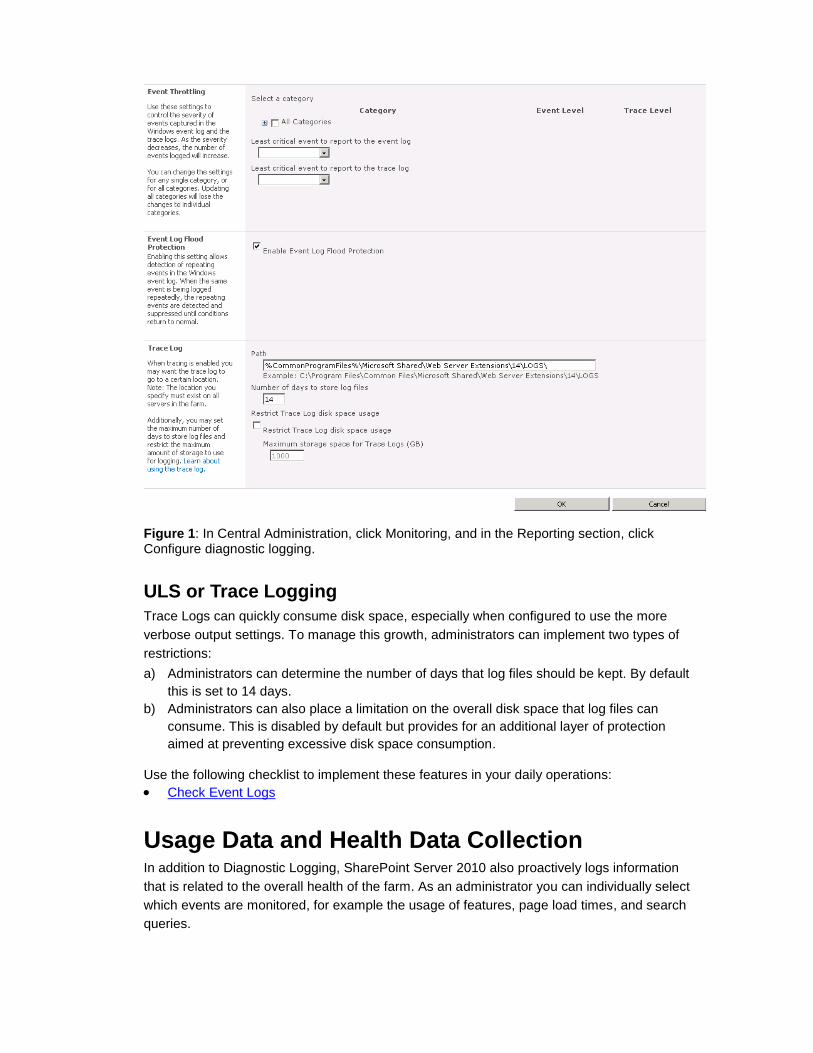
Event Throttling
Event throttling enables administrators to control the types of event that SharePoint Server
log based on the level of severity. The administration of throttling is divided into two sections:
1. Destination
Log entries can be reported in two places. The first is the ―Event Log‖, which is the
standard Windows Event Log. Administrators can use the Windows Event Viewer
application to review entries. The second is the ULS or ―Trace Log‖, a text based log
format that is specific to SharePoint Server and is stored on the file system. The default
location is C:\Program Files\Common Files\Microsoft Shared\Web Server
Extensions\14\LOGS.
2. Category
The event throttling dial can be applied to specific categories which map directly to
SharePoint Server functionality. This enables the administrator to increase the logging
detail for SharePoint components individually, thereby managing the size of the logs and
the amount of information to review.
The default settings for all categories are as follows:
Event Log: Information
Trace Log: Medium Level
During normal operation, these settings are an appropriate balance of detail and
performance. During substantial reconfiguration of SharePoint Server, during the installation
of custom solutions, or when SharePoint Server is experiencing issues, the throttling dial
32
should be turned down. This ensures as much information is available as possible for
troubleshooting.
Finally, after completing any troubleshooting, logging can be returned to the default by
selecting the ―Reset to default‖ option in the throttling drop-downs. Settings that are not
currently configured with the default option will appear in a bold font.
Correlation IDs
Correlation IDs are GUIDs that are assigned to events which occur during the lifecycle of a
resource request. This value is surfaced within error messages, the ULS logs, and tools like
the Developer Dashboard. This value helps an administrator locate and isolate a specific
request across the ULS log, Usage Logging database, and SQL Server Profiler data sets for
debugging purposes.
For example, administrators can take the Correlation ID that appears on an error page in their
browsers and then rapidly locate any related entries in the ULS logs through a simple search.
Correlation IDs also span machine boundaries. If a request, such as a front-end Web server
calling a Web service on an application server, crosses a machine boundary the assigned
Correlation ID can provide a complete overview of activities during the life-cycle of the
request.
Event Log Flood Protection
Event Log Flood Protection prevents the ―Event Log‖ from being overwhelmed with many
repetitive events. When Event Log Flood Protection is enabled (default), it will start trimming
events after the same event is logged five times within two minutes. At this point it
suppresses additional entries. After an additional two minutes, it throws a summary event that
describes the number of times that the event would have been repeated. An administrator
can modify these thresholds.
33
Figure 1: In Central Administration, click Monitoring, and in the Reporting section, click Configure diagnostic logging.
ULS or Trace Logging
Trace Logs can quickly consume disk space, especially when configured to use the more
verbose output settings. To manage this growth, administrators can implement two types of
restrictions:
a) Administrators can determine the number of days that log files should be kept. By default
this is set to 14 days.
b) Administrators can also place a limitation on the overall disk space that log files can
consume. This is disabled by default but provides for an additional layer of protection
aimed at preventing excessive disk space consumption.
Use the following checklist to implement these features in your daily operations:
Check Event Logs
Usage Data and Health Data Collection In addition to Diagnostic Logging, SharePoint Server 2010 also proactively logs information
that is related to the overall health of the farm. As an administrator you can individually select
which events are monitored, for example the usage of features, page load times, and search
queries.

34
This functionality both consumes disk space and has a performance overhead. Like
Diagnostic Logging, care needs to be taken to manage it appropriately. The following options
are available to administrators:
1) Health Data Collection
Health reports are built by taking snapshots of various resources, data, and processes at
specific points in time. The number of Timer Jobs to schedule will depend on the number
of events that you selected to monitor. The frequency of these jobs can be modified to
manage the performance impact.
2) Log Collection Schedule
The Log Collection Schedule Timer Job is responsible for collecting Usage Logs from the
various servers in the farm, processing them, and then populating a centralized database
from where they can be queried for reporting. Once processed, the logs are deleted from
disk, freeing up the space they were consuming. The frequency of this job can be
modified to manage the consumption of disk space.
Note:
Everything that is being logged to the Windows Event Viewer and to the SharePoint log
files is also being stored in the SharePoint Server 2010 logging database. The logging
database is also used by the SharePoint Health Analyzer and by SharePoint usage
reporting.
Use the following checklist to implement these features in your daily operations:
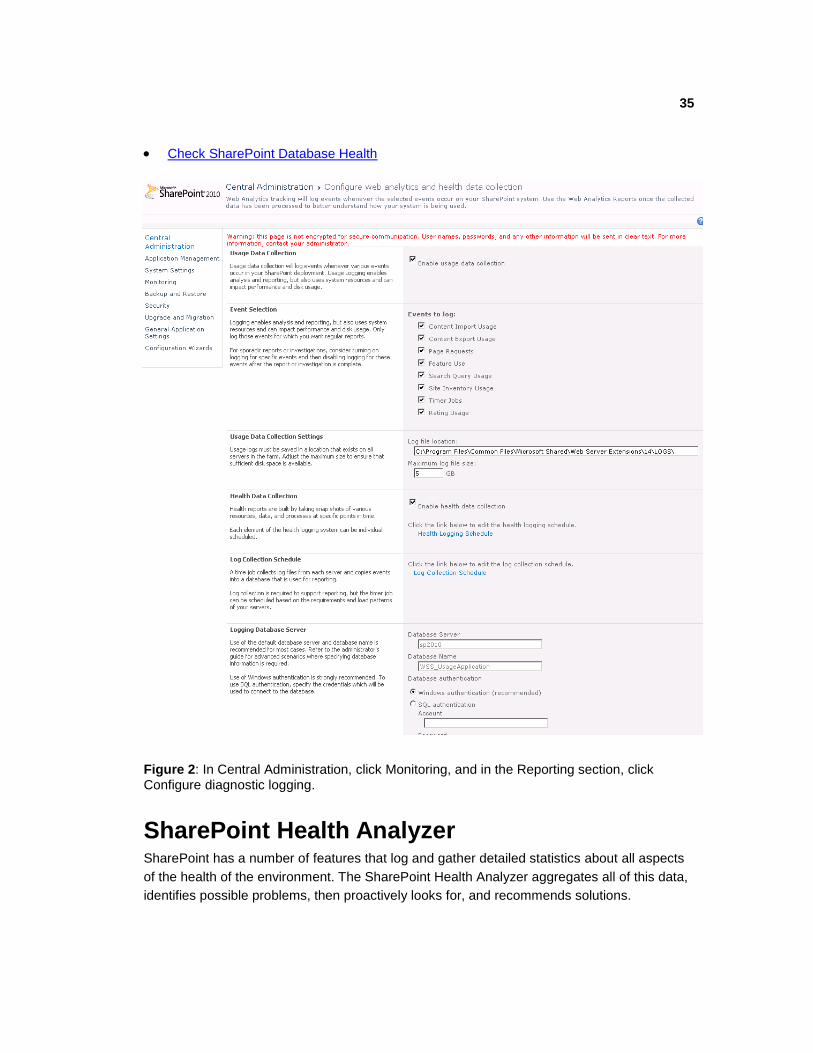
35
Check SharePoint Database Health
Figure 2: In Central Administration, click Monitoring, and in the Reporting section, click Configure diagnostic logging.
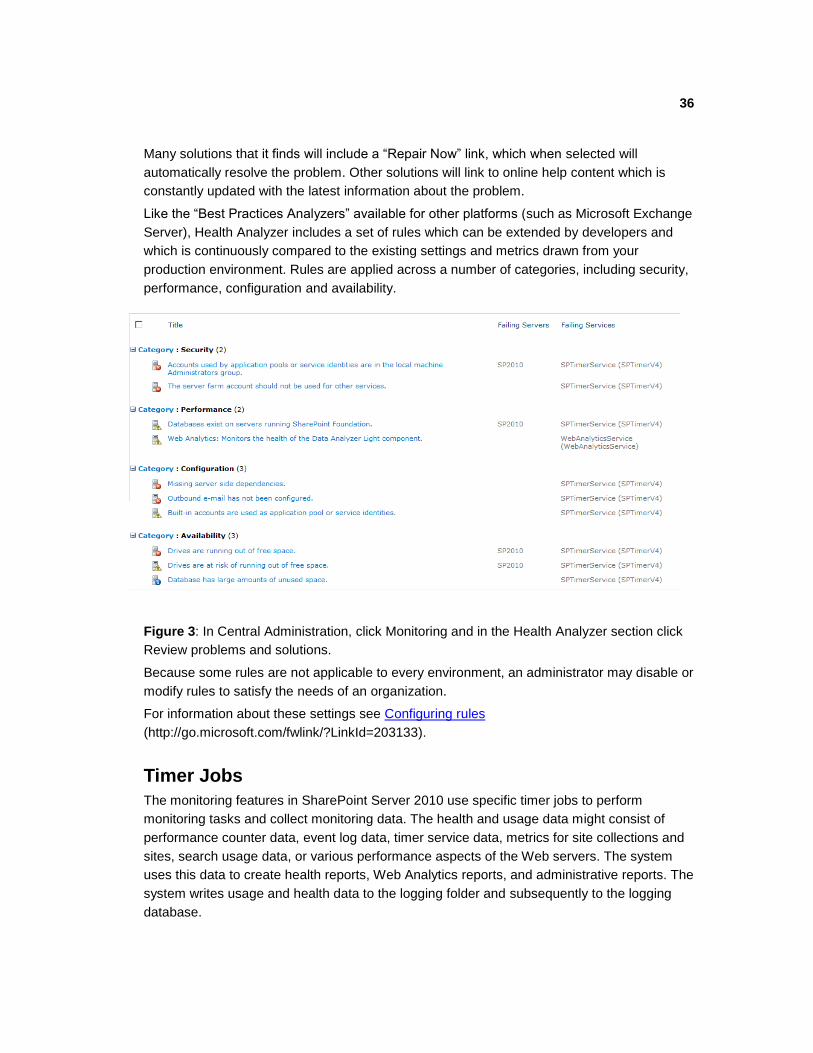
SharePoint Health Analyzer SharePoint has a number of features that log and gather detailed statistics about all aspects
of the health of the environment. The SharePoint Health Analyzer aggregates all of this data,
identifies possible problems, then proactively looks for, and recommends solutions.
36
Many solutions that it finds will include a ―Repair Now‖ link, which when selected will
automatically resolve the problem. Other solutions will link to online help content which is
constantly updated with the latest information about the problem.
Like the ―Best Practices Analyzers‖ available for other platforms (such as Microsoft Exchange
Server), Health Analyzer includes a set of rules which can be extended by developers and
which is continuously compared to the existing settings and metrics drawn from your
production environment. Rules are applied across a number of categories, including security,
performance, configuration and availability.
Figure 3: In Central Administration, click Monitoring and in the Health Analyzer section click
Review problems and solutions.
Because some rules are not applicable to every environment, an administrator may disable or
modify rules to satisfy the needs of an organization.
For information about these settings see Configuring rules
(http://go.microsoft.com/fwlink/?LinkId=203133).
Timer Jobs
The monitoring features in SharePoint Server 2010 use specific timer jobs to perform
monitoring tasks and collect monitoring data. The health and usage data might consist of
performance counter data, event log data, timer service data, metrics for site collections and
sites, search usage data, or various performance aspects of the Web servers. The system
uses this data to create health reports, Web Analytics reports, and administrative reports. The
system writes usage and health data to the logging folder and subsequently to the logging
database.
37
You might want to change the schedules that the timer jobs run on to collect data more
frequently or less frequently. You might even want to disable jobs that collect data if you are
not interested in them. You can perform the following tasks on timer jobs:
Modify the schedule that the timer job runs on.
Run timer jobs immediately.
Enable or disable timer jobs.
View timer job status. You can view currently scheduled jobs, failed jobs, currently
running jobs, and a complete timer job history.
For more information about how to configure these settings, see Configure SharePoint Health
Analyzer timer jobs (http://go.microsoft.com/fwlink/?LinkID=200593).
Use the following checklist to implement these features in your daily operation:
Check SharePoint Health Analyzer
For More Information
For more information about configuring the Health analyzer, see Configuring monitoring
(http://go.microsoft.com/fwlink/?LinkId=203134).
Web Analytics The reports that the Web Analytics functionality in SharePoint Server generates provide
detailed insight into how your SharePoint environment is being used, and how well it’s
performing. Administrators should become familiar with these reports and how they can
create their own (directly in the browser) to plan future capacity and to produce benchmarks
to compare with future farm configurations.
All of these reports can be used to help you decide if the current architecture remains ―fit for
purpose,‖ meaning that it meets the desired service levels.
The reports are broken down into three categories and can be reviewed based on Web
Application, Site Collection, Site and Search Service.
Traffic
The traffic reports help administrators answer questions such as the following:
How much traffic does my farm serve? (# of Page Views)
Who visits the most often? (Top Visitors)
How do visitors find your site? (Top Referrers)
In addition, traffic reports provide statistics about the ―Daily Unique Visitors‖, ―Top
Destinations‖ and the browsers used, among others.
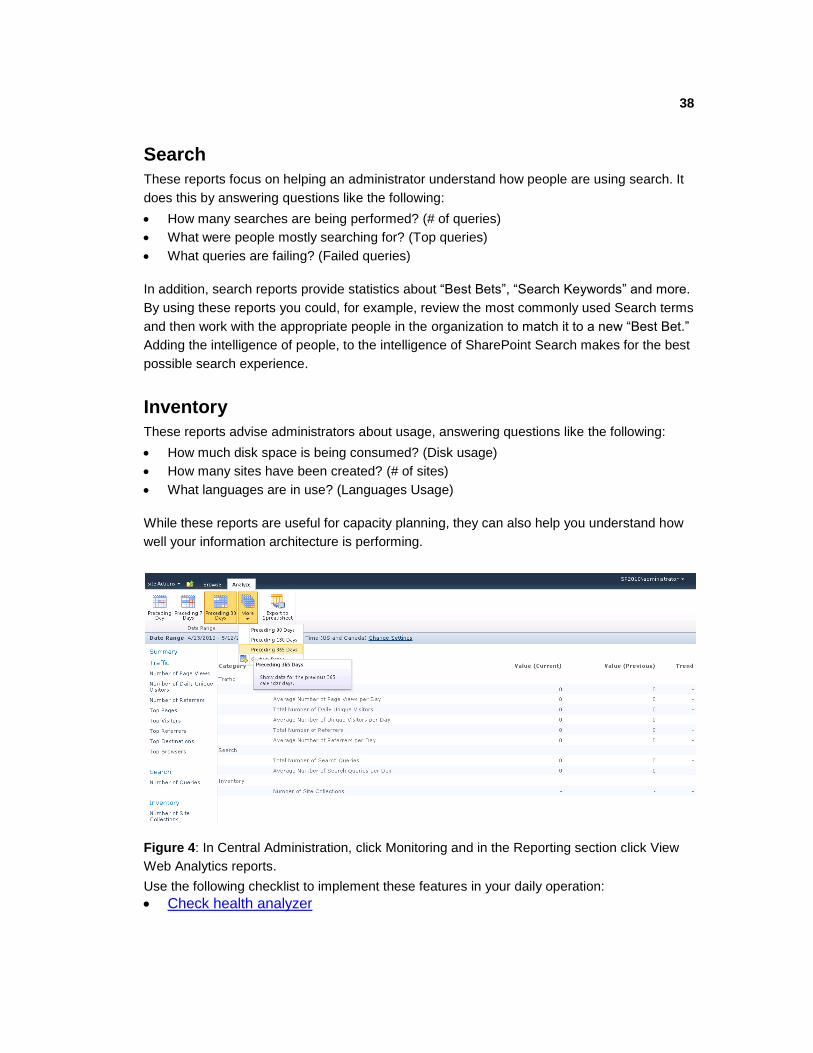
38
Search
These reports focus on helping an administrator understand how people are using search. It
does this by answering questions like the following:
How many searches are being performed? (# of queries)
What were people mostly searching for? (Top queries)
What queries are failing? (Failed queries)
In addition, search reports provide statistics about ―Best Bets‖, ―Search Keywords‖ and more.
By using these reports you could, for example, review the most commonly used Search terms
and then work with the appropriate people in the organization to match it to a new ―Best Bet.‖
Adding the intelligence of people, to the intelligence of SharePoint Search makes for the best
possible search experience.
Inventory
These reports advise administrators about usage, answering questions like the following:
How much disk space is being consumed? (Disk usage)
How many sites have been created? (# of sites)
What languages are in use? (Languages Usage)
While these reports are useful for capacity planning, they can also help you understand how
well your information architecture is performing.
Figure 4: In Central Administration, click Monitoring and in the Reporting section click View
Web Analytics reports.
Use the following checklist to implement these features in your daily operation:
Check health analyzer
39
How to check if SharePoint Server is “Alive” The most basic element of IT service monitoring is the creation of a tool that monitors an
application for a ―heartbeat‖, that is, a response from the application that verifies that it is in
an operational state. This is particularly important with high availability designs that have a
load balancer capable of automatically removing a server from the rotation when a heartbeat
stops.
The most common approach to the implementation of a heartbeat for Web applications is a
―HTTP Ping‖, which essentially sends a request to a Web server and awaits a response.
The important thing to consider when creating such a ―heartbeat‖ for SharePoint Server is
that the product implements custom error messages. The result is that standard Web
response codes (404, 401) can be ―hidden‖ behind an HTML error page. In other words,
simply checking that the server running SharePoint Server is correctly returning HTML is not
enough to determine that the server is alive.
For this reason, we recommend that any heartbeat tool that you develop takes a more
sophisticated approach to checking if SharePoint Server is alive. The actual implementation
comes down to your requirements, but it might be that you develop a page that checks key
SharePoint services and returns a very specific HTML page to represent an ―alive‖ response.
SharePoint Developer Dashboard While the Developer Dashboard was primarily designed for developers, administrators may
find it’s a useful tool for debugging page-level performance problems. It provides detailed
information on the performance characteristics of code that is running as part of the rendering
of a SharePoint page. The report shows the following information:
Web server section
o Execution Time – The time that it takes to render a page o Current User – The user who is currently logged in o Page Checkout Level – Indicates if the page is checked out o Current SharePoint Operations – The number of SharePoint requests
(SPRequest) o Log Correlation Id – The ID under which SharePoint Server writes messages to
the ULS logs to see the relevant messages
Asserts and Critical Events section
Here you will find errors and critical events. The messages include details about errors
and their Correlation IDs. When a critical message has occurred you can drill down to the
actual callstack of the message by clicking the critical event.
Asserts and Critical Events section
Here you can find every database query that has occurred during the rendering of the
page together with the execution time.
You can drill down and see more information by clicking about the query:
o Query Text: the full SQL Server query. o Callstack: Displays the full SQL Server call stack. o IO Stats: Allows you to see how extensive the read/writes are on the specified
SQL Server query.
40
Service Calls section
The service calls section displays the requests to SharePoint Web services. This gives
you an indication of the response time from a Web service call, which allows you to
determine if it’s taking longer than expected. SPRequest Allocations section
In this section you can check whether the SPRequest objects are properly disposed.
WebPart Events Offsets section
This section displays how long each Web Part takes to render.
More information about enabling and disabling the dashboard is available in Appendix A:
Enabling the Developer Dashboard.
Custom Applications and Object Disposal One of the most difficult to troubleshoot, most persistent and severe issues that a SharePoint
administrator can encounter is the incorrect management of SharePoint objects in custom
applications. It’s critical to the reliability of your environment that governance processes are
put in place to ensure that custom code complies with the published best practices around
the disposal of objects in the SharePoint Object Model. When these objects are not disposed
correctly you introduce memory leaks which in turn can introduce system downtime and
instability.
What are the best practices concerning object disposal?
Correct object disposal is just one best practice that SharePoint developers should be aware
of. It is however, probably the most critical, and most complex to apply.
The following resource is the recommended source for developers surrounding the aspects of
proper object disposal.
Using Disposable Windows SharePoint Services Objects
(http://go.microsoft.com/fwlink/?LinkId=203135).
How do I know I have a memory leak?
Here are the two most common ways to determine you have a memory leak:
1) Review your ULS logs
SharePoint Server constantly tracks the lifecycle of objects to proactively report
potential issues that are related to object disposal. It does this by recording potential
issues in the ULS logs as follows:
“An SPRequest object was not disposed before the end of this thread. To avoid
wasting system resources, dispose of this object or its parent (such as a SPSite
or SPWeb) as soon as you are done using it. This object will now be disposed”
41
Because these events occasionally may be ―false positives,‖ administrators should be
concerned with either an exceptionally large number of these errors (the ULS will
actually provide an object count), or a change in the frequency, especially soon after
a change to the environment, such as the installation of a new solution.
2) Application Pool Recycles
The most common symptom that is associated with a memory leak is usually
described as ―The application pools recycle intermittently‖. The result is down time.
The challenge for an administrator is that this downtime happens intermittently, which
makes it difficult to reproduce and to debug. Most commonly this problem typically
occurs during peaks in usage.
The reason this occurs is due to a protective mechanism built into application pools.
Because the SharePoint objects are not being disposed correctly, the .NET garbage
collector is not able to reclaim the memory consumed by the objects. This results in
the memory leak, which in turn, results in a potentially dramatic increase in memory
consumption. Application pools, by default, are configured to automatically recycle
when they consume too much memory, and this is the intermittent instability.
Reviewing the event viewer for application pool recycle events is critical to isolating
and identifying memory leaks in custom applications.
Other common symptoms which suggest that you may have a memory leak include database
connectivity issues.
How can I check solutions for memory leaks?
Microsoft has released the SharePoint Dispose Checker Tool
(http://go.microsoft.com/fwlink/?LinkId=203138) which quickly identifies possible issues with
the disposal of SharePoint objects in custom applications. The tool only requires access to
the solution assembly to work, and it can also be integrated into a developer's build process.

42
Operations Management
Operations management involves the administration of an organization's infrastructure
components and includes the day-to-day administrative tasks, both planned and impromptu,
which are required to keep an IT system operating smoothly. Typically, operations
management tasks are covered by written procedures. These procedures provide all support
staff with the same standard tools and methods.
In a SharePoint Server 2010 environment, examples of system administration tasks include
creating Web Applications, backing up and archiving sites and site collections, monitoring
logs, and maintaining service applications.
Standard Procedures Several resources can help you define what standard procedures are required in your
organization and how to perform them. For more information about how to administer your
SharePoint environment, see Operations (http://go.microsoft.com/fwlink/?LinkID=89152).
Because each company is unique, you will have to customize and adapt these references to
suit your requirements.
Standard procedures will change, and documentation will occasionally need to be revised. As
changes are made, your change management process should identify how each change is
likely to affect various parties. The change management function should be used to update
and control the documentation.
The tasks that need to be performed can generally be separated into the following general
categories:
Daily Tasks
Weekly Tasks
Monthly Tasks
As Needed Tasks
When preparing documentation for operations management, checklists are useful to help
make sure that the required tasks are performed at the appropriate time. For detailed
information about how to prepare operations checklists, see the sample checklists located in
Operations Checklists.
Frequently, change management takes over where system administration finishes. If a task is
documented by a standard procedure, it is part of the system administration function. If there
is no standard procedure for a task, it should be handled by using the change management
function.
43
Centralized Versus Decentralized Administration Roles and responsibilities for performing system administration tasks depend on whether the
organization follows a centralized model, a decentralized model, or a combination of both.
Centralized Model
In a centralized model, one or several administrative groups maintain complete control of the
SharePoint environment. This administrative model is similar to a data center where all
administration tasks are performed by a single information technology group. Roles and
responsibilities within the team should be defined according to experience and expertise.
Decentralized Model
Decentralized organizations are located in several geographic locations and have servers
running SharePoint Server and teams of administrators in different locations. For example,
there may be local administration staff and one or more servers running SharePoint Server
for each office in each country. Alternatively, there may be a cluster of servers running
SharePoint Server and an administrative team for North America and one for Europe.
Sometimes, you may want administrators to be responsible only for their own geographical
area and restrict permissions to administer resources in other areas.
In SharePoint Server, you can do this by managing users in Central Administration where the
rights of administrators can be set by using permissions and policy.
For More Information
For more information about delegating control of SharePoint Server, see Security and
Protection (http://go.microsoft.com/fwlink/?LinkID=89441).
Daily Tasks To help ensure the availability and reliability of your SharePoint Server 2010 environment,
you must actively monitor the physical platform, the operating system, and all important
SharePoint Server, IIS, and SQL Server services.
Preventative maintenance helps you identify potential errors before an error causes problems
with the operation of your SharePoint environment. Combined with disaster recovery planning
and regular backups, you minimize the impact of problems that might arise.
Monitoring your SharePoint environment involves checking for problems with connections,
services, server resources, and system resources. Microsoft Windows Server 2008, SQL
Server 2008 and, of course, SharePoint Server itself, provide many monitoring tools and
services to help make sure that your SharePoint environment is running smoothly.
44
The key advantages to daily monitoring are as follows:
Meeting the performance requirements of your service level agreements (SLAs).
Completing successfully specific administrative tasks, such as daily backup
operations, and checking server health.
And probably the most important one: detecting and addressing issues upfront, such
as bottlenecks in the server performance or need for additional resources before they
affect productivity.
The daily maintenance tasks that you are going to use depend on your organization and your
organization’s needs. It is important to have daily maintenance tasks in place so that you can
capture and maintain data about your SharePoint environment, such as usage levels,
possible performance bottlenecks, and administrative changes. See the following sections for
information about tasks that you can perform daily:
Performing Physical Environmental Checks
Performing and Monitoring Backups
Checking Disk Usage
Checking the Event Viewer
Monitoring Server Performance
Monitoring Network Performance
For More Information
To help organize tasks that are performed daily, see the Daily Operations Checklist. To learn
more about how to monitor SharePoint Server 2010, see Monitoring SharePoint Server 2010
with Microsoft Operations Manager 2007 R2.
Performing Physical Environmental Checks
Before you check performance, availability, and functionality of your SharePoint environment,
you should check the physical environment. For example, determine whether the server and
its connections are fully secured in a rack, and determine whether the server room
temperature is appropriate.
Perform the following physical environmental inspections:
Physical security measures
Physical security protection such as locks, doors, and restricted-access rooms must be
secured. Check for any unauthorized and forced entries and signs of equipment damage.
Temperature and humidity
High temperature and humidity can cause hardware components to overheat. Check
temperature and humidity to help make sure that the environmental systems such as
heating and air conditioning can maintain acceptable conditions and function within the
hardware manufacturer's specifications.
Devices and components
45
Your SharePoint environment relies on a functioning physical network and related
hardware. Ensure that routers, switches, hubs, physical cables, and connectors are
properly connected and operational.
For More Information
For information about other important daily operations tasks, see Daily Tasks.
Performing and Monitoring Backups
Performing backups of your servers is your first line of defense when planning for a disaster.
You must have a well-planned and well-rehearsed disaster recovery plan for your
SharePoint environment.
Your disaster recovery plan should include backing up SharePoint configuration and content
daily. By backing up your SharePoint environment regularly you reduce the possibility of
losing data as a result of a power outage, hardware failure, or any number of other events.
While performing a backup doesn’t affect the state of your SharePoint environment, it does
require significant system resources, which in turn, can have a negative impact on the
performance of your environment. For this reason, backups are typically run outside of
business hours or when the system sees its lowest demand from end-users.
SharePoint Server 2010 makes it possible to configure and schedule backups on various
levels:
Back up a Web application (http://go.microsoft.com/fwlink/?LinkId=203218)
Back up a service application (http://go.microsoft.com/fwlink/?LinkId=203219)
Back up a farm configuration (http://go.microsoft.com/fwlink/?LinkId=203220)
Back up search (http://go.microsoft.com/fwlink/?LinkId=203221)
Back up the Secure Store service (http://go.microsoft.com/fwlink/?LinkId=203222)
Back up a content database (http://go.microsoft.com/fwlink/?LinkId=197242)
Back up databases to snapshots (http://go.microsoft.com/fwlink/?LinkId=203223)
Back up customizations (http://go.microsoft.com/fwlink/?LinkId=203224)
Back up a site collection (http://go.microsoft.com/fwlink/?LinkId=197243)
Export a site, list, or document library (http://go.microsoft.com/fwlink/?LinkId=197239)
Back up or archive logs (http://go.microsoft.com/fwlink/?LinkId=203226)
These capabilities mean you can design a backup/restore and disaster recovery strategy that
meets the specific requirements of your organization.
Most of these options also provide for two different types of backup:
Full – Complete backup of all the content, including full history.
Differential – Backup of only the content that has changed since the last full backup
In addition to backing up SharePoint content and configuration, you should also consider
backing up all logged events and performance data. This includes information that is being
logged in the event viewer, SQL Server logs and SharePoint ULS log files.
46
No matter which backup strategy you choose, proactively monitoring the successful
completion of your SharePoint backups is critical to the success of your disaster recovery
plan. Regular testing of the disaster recovery plan for your organization's SharePoint
infrastructure should be performed in a lab environment that mimics your production
environment as closely as possible.
A disaster recovery plan is necessary to ensure high availability of your SharePoint
environment. A solid backup and recovery strategy is an important part of that; however you
should also strongly consider a separate fail-over strategy. This is an environment that is a
duplicate of your production environment but only comes online, by using a DNS change, in
the event that your primary environment becomes unavailable for any reason.
For more information about disaster recovery planning, see Plan for disaster recovery
(http://go.microsoft.com/fwlink/?LinkId=203228).
For More Information
For information about other important daily operations tasks, see Daily Tasks.
For more information about backup operations, see Backup
(http://go.microsoft.com/fwlink/?LinkId=203229).
For more information about recovery operations, see Recovery
(http://go.microsoft.com/fwlink/?LinkId=203230)
Checking Disk Space
SharePoint requires disk space to store its logs, search indexes, SQL Server databases, and
SQL Server transaction logs.
You should monitor the amount of disk space available regularly to ensure that servers
running SharePoint Server or SQL Server databases are not being negatively impacted by
insufficient storage resources.
Comparing and maintaining statistical information about available disk space on each disk
volume, and tracking the expected growth of the databases and transaction log files helps
you with capacity planning.
You can check free disk space by using the following methods:
Windows Explorer Use Windows Explorer to check for disk space on volumes that store
SharePoint logs, databases and search indexes.
Performance monitor Monitor disk space by running a script that will send you an alert
message if the hard disk space falls below 100 MB. You can find a sample script on the
TechNet Script Center (http://go.microsoft.com/fwlink/?linkid=33284).
Use Microsoft Operations Manager Microsoft Systems Center Operations Manager
(SCOM) can be used to alert administrators when volume space is constrained. For more
information, see Microsoft SharePoint 2010 Products Management Pack for Microsoft
Systems Center Operations Manager 2007 R2.

47
For More Information
For information about other important daily operations tasks, see Daily Tasks.
Checking the Event Viewer
You can use the Event Viewer to obtain information about service failures and warnings
about system resources such as virtual memory and disk space. Use the Event Viewer to
view and manage event logs; obtain information about hardware, software, and system
problems that must be resolved; and identify trends that require future action.
Event Viewer maintains logs about application, security, and system events on your
computer. It also provides a central location for installed applications, for example SharePoint
Server and SQL Server, to report warnings and error conditions. This makes it vitally
important to review event logs daily.
A server that is running a Windows Server 2008 operating system records events by default
in three types of logs:
Application logs
The Application log contains events logged by applications or programs. Developers of
those applications determine which events to log. For example, a database program
might record a file error in the Application log. Most events that are related to SharePoint
Server will be found in the Application log.
Security logs
The Security log records events such as successful and unsuccessful logon attempts, as
well as events related to resource use such as creating, opening, or deleting files or other
objects. For example, if logon auditing is enabled, attempts to log on to the system are
recorded in the Security log.
System logs
The System log contains events that Windows system components log. For example, the
failure of a driver or other system component to load during start-up is recorded in the
System log. The event types logged by system components are predetermined by the
server.
SharePoint administrators can also create their own custom views of the Event Logs, for
example, one that collects events that can negatively impact SharePoint Server. When
creating a new view, choose ―Event sources‖ and then select all sources that are related to
SharePoint Server. For more information, see Create a Custom View
(http://go.microsoft.com/fwlink/?LinkId=203233).
Managing the Event Logs
In the SharePoint Central Administration you can throttle the amount and level of detail that
Event Viewer logs. See Event Throttling.

48
Note:
Do not use the maximum logging settings unless you are instructed to do so by
Microsoft Product Support Services. Maximum logging drains significant resources
and can give many "false positives," that is, errors that get logged only at maximum
logging but are really expected and are not a cause for concern. We also recommend
that you do not enable diagnostic logging permanently. Use it only when
troubleshooting.
Within each Event Viewer log, Windows 2008 records informational, warning, and error
events. Monitor these logs closely to track the types of transactions being conducted on
servers running SharePoint Server. You should periodically archive / backup the logs or use
automatic rollover to avoid running out of space. Because log files can occupy a finite amount
of space, increase the log size (for example, to 50 MB) and set it to overwrite, so that
Windows 2008 can continue to write new events.
The event viewer within Windows 2008 has some automated features which make monitoring
easier:
Subscriptions – Subscriptions will let you gather events from different servers. This is
valuable for getting an overview of all the events that have occurred in your server farm.
Within the properties of each of the above mentioned Windows logs (Application, Security
and system) you have the ability to add a subscription, where you then establish a
connection to the Event Log on a different server.
To make use of this feature you will need to enable the Windows Event Collector Service.
Attach Tasks - Within the event viewer you are able to ―Attach a Task‖ to either a
specific log view or an individual event. For example sending an email message or
running a program. This functionality basically integrates the Windows ―Task Scheduler‖
tool with the Event Viewer.
Combining this functionality with Windows PowerShell opens up many opportunities for
automating management and problem solving tasks. For example, you could write a
Windows PowerShell script that kicks off a management workflow in SharePoint Server.
This could then be attached to any events that require action from an administrator,
thereby ensuring it gets done.
Microsoft Systems Center Operations Manager - You can use Microsoft Systems
Center Operations Manager (SCOM) to monitor the health of your server. The Microsoft
SharePoint 2010 Products Management Pack extends SCOM by providing specialized
monitoring of the critical services and components that make up SharePoint Server 2010.
This management pack includes a definition of ―good health‖ for a server running
SharePoint Server and will automatically alert the administrator if it detects a state
diverging from that and requiring intervention. For more information about Microsoft
Systems Center Operation Manager and the SharePoint Management Pack, see the
Microsoft Systems Center Operations Manager
(http://go.microsoft.com/fwlink/?LinkId=203235).
49
For More Information
For information about other important daily operations tasks, see Daily Tasks.
Monitoring Server Performance
Microsoft SharePoint Server performance is affected by many factors such as system
architecture, software, hardware, and network components. Make sure each server in your
environment meets the SharePoint Server hardware and software requirements; see
Hardware and software requirements (http://go.microsoft.com/fwlink/?LinkID=119403).
Monitoring server performance helps to ensure your servers are functioning correctly and
allows you to identify bottlenecks in the system. By reviewing and analyzing the data
produced by performance monitoring, you can identify problems and apply corrective action.
You can also use the monitoring data to further enhance the performance of your servers by
identifying areas that need additional resources. For example, you may need to increase your
storage capacity to handle the growing number of users in your organization or increase
memory when using more SharePoint services.
Task Manager
Task Manager is a Windows Server 2008 tool that provides information about the processes
and programs that are running on your local computer. You can use Task Manager to monitor
key indicators of your computer's performance in real time. It shows you the status of the
programs that are running and allows you to end programs that have stopped responding.
You can also assess the activity of running processes by using up to 15 parameters, and see
graphs and data on CPU and memory usage. In addition, you can view the network status
and see how your network adapter is functioning. If you have more than one user logged on
to your computer, you can see who is connected, what they are working on, and you can
send them a message.
System Monitor
Using the System Monitor tool, you can define, collect, and view extensive data about the
usage of hardware resources and the activity of system services on computers that you
administer. System Monitor lets you monitor a single computer or several computers
simultaneously. This flexibility can be helpful when you want to locate a problem within your
SharePoint farm.
You specify the type of data that you want to monitor, the source of the data, and establish
sampling parameters. You can even change the appearance of your System Monitor to use
graph, histogram, or report views.
50
Performance Logs and Alerts
With Performance Logs and Alerts, you can collect performance data automatically from local
or remote computers. You simply need to select the counters relevant to the investigation you
wish to perform, and a sampling interval.
The resulting data can be reviewed by using System Monitor or imported to a spreadsheet or
databases for analysis and report generation.
Alerts can also be configured. This is a system-generated event that is triggered when
counters that you are tracking perform outside predefined thresholds. When it does you can
configure an action to occur, for example have a message be sent, a program executed, or
an entry made in the application event log.
Note:
The alert functionality depends on the Windows Server 2008 Messenger Service, the
Windows Server 2008 Alerter Service, and the existence of the recipient account
registration in the Windows Internet Name Service (WINS). The Messenger and
Alerter services are disabled by default and must be enabled and started to allow
network messages to be transmitted.
For more information about creating and configuring alerts in Windows Server 2008, see
Performance and Reliability Monitoring Step-by-Step Guide for Windows Server 2008
(http://go.microsoft.com/fwlink/?LinkId=178005).
For More Information
For information about other important daily operations tasks, see Daily Tasks.
Monitoring Network Performance
It is important to monitor your network performance because its performance can affect the
performance of your SharePoint Server 2010 environment. You can monitor your network by
using the following tools:
Network Monitor
Windows Management Instrumentation (WMI)
Simple Network Management Protocol (SNMP)
You can also use third-party monitoring tools or Microsoft Systems Center Operations
Manager (SCOM) to monitor your SharePoint system. For more information about
SCOM 2007, see Monitoring SharePoint 2010 with Systems Center Microsoft Operations
Manager 2007 R2.
Network Monitor
Network Monitor for Microsoft Windows collects, displays, and analyzes resource usage on a
server and measures network traffic. Network Monitor exclusively monitors network activity.
By capturing and analyzing network data and using this data with performance logs, you can
51
determine your network usage, identify network problems, and forecast your network needs
for the future.
Download Network Monitor (http://go.microsoft.com/fwlink/?LinkId= 198217).
Windows Management Instrumentation
Windows Management Instrumentation (WMI) helps you manage your network and
applications as they become larger and more complex. With WMI, you can monitor, track,
and control system events that are related to software applications, hardware components,
and networks.
SharePoint Server 2010 provides many WMI classes that you can use to monitor and
analyze SharePoint servers. The SharePoint 2010 SDK contains complete information about
the SharePoint WMI providers, including many sample scripts to help you get started. You
can download or view the SharePoint 2010 SDK
(http://go.microsoft.com/fwlink/?LinkId=166675) and FAST Search: WMI classes
(http://go.microsoft.com/fwlink/?LinkId=203240)from SharePoint 2010 Reference.
Simple Network Management Protocol
Simple Network Management Protocol (SNMP) lets you capture configuration and status
information about your network and send the information to a designated computer for event
monitoring. For more information about SNMP, see SNMP in Windows Server 2008 Help.
For More Information
For information about other important daily operations tasks, see Daily Tasks.
Weekly Tasks As a best practice, perform the following tasks and procedures weekly:
Archive Event Logs
If event logs are not configured to overwrite events as required, they must be regularly
archived and deleted. This action is especially important for security logs, which may be
required when investigating attempted security breaches.
Check for Security Updates
Identify any new service packs, hotfixes, or updates. If appropriate, test these in a test lab
and use change control procedures to arrange for deployment to the production servers.
Review SLA Performance Figures
Check the key performance data for the previous week. Review performance against the
requirements of the Service Level Agreement (SLA). Identify trends and items that have
not met their targets.
Archive Data
52
Archive data to CD, DVD, tape, or similar media. When a user leaves the organization or
after a set period of time, information in SharePoint sites and site collections may need to
be archived. This helps to keep the information stored by SharePoint Server relevant,
and the overall online storage size manageable.
Environmental Tests
Check periodically and maintain air conditioning, temperature and humidity monitors, and
physical security measures.
Database Maintenance
While SharePoint Server 2010 automatically performs a number of critical database
maintenance tasks, administrators should be familiar with the maintenance tasks outlined
in the Database maintenance for Office SharePoint Server 2007
(http://go.microsoft.com/fwlink/?LinkId=111531) whitepaper. While it describes tasks for
Office SharePoint Server 2007, it remains relevant to SharePoint Server 2010.
To help organize your performance of weekly tasks, see Weekly Operations Checklist.
Monthly Tasks As a best practice, perform the following tasks and procedures monthly:
Security Checks
Depending on the level of security that your organization requires, it may be appropriate
to perform regular audits of security such as firewall rules, user rights, group
membership, delegate rights, and so on.
Capacity Planning
Review capacity figures for the previous month, and produce a plan for any upgrades that
may be required in the coming months to keep the system operating within limits
specified by the organization's Service Level Agreements (SLAs).
Disaster Recovery Test
Perform a system recovery for a single server to test your organization's documented
recovery process. This test will simulate a complete hardware failure for one server, and
make sure that the resources, plans, and data are available for recovery. Try to rotate the
focus of the test each month, so that you test the failure of a different server or other
piece of equipment every time. For example, Search Server, Database Servers, Business
Connectivity Services, and so on.
For More Information
To help organize your performance of monthly tasks, see Monthly Operations Checklist.
53
Impromptu Tasks Perform the following tasks as necessary. However, they are frequently also covered by
standard procedures:
Full Security Audit You can perform this audit regularly, in response to an upgrade or
redesign of the SharePoint environment, or in response to an attempted (or successful)
security breach. The procedure may involve port scans on servers and firewalls, audits of
security fixes, and third-party penetration tests.
Update Performance Baselines Update performance baselines after an upgrade or
configuration change. You can use baselines to measure performance changes and to
detect problems that affect system performance.
SharePoint Health Analyzer The health analyzer helps you to monitor your SharePoint
environment which enables you to check for potential configuration, performance, and
usage problems. See SharePoint Health Analyzer.
SharePoint developer dashboard The SharePoint developer dashboard offers you
additional performance and tracing information that can be used to debug and
troubleshoot issues with page rendering time. See SharePoint Developer Dashboard.
For More Information
For information about other tasks that you can perform to maintain your SharePoint
environment, see Operations Management.

54
Operations Checklists
The SharePoint Server 2010 Operations Checklists provide guidelines for IT professionals to
perform the required daily, weekly, and monthly maintenance tasks to keep your server
running SharePoint Server performing optimally. Use the following checklists as is, or adapt
them to suit your company's specific needs:
Daily Operations Checklist
Weekly Operations Checklist
Monthly Operations Checklist
Summary Checklist
Daily Operations Checklist Use these checklists to record daily operations. You can modify these checklists based on
your organization's requirements.
Checklist: Check Backups
Complete this checklist to check backups.
Prepared by:
Date:
Completed Task
Make sure that the recommended minimum
backup strategy of a daily backup completed
successfully. This should be done according
to the backup strategy in place at your
organization.
Check if the trace logs are being backed up.
Verify that the previous backup operation
completed.
Analyze and respond to errors and warnings
during the backup operation.
Follow the established procedure for backup
rotation, labeling, and storage.

55
Completed Task
Make sure that backups complete with the
tolerance specified in service level
agreements (SLA).
Determine whether custom solutions are part
of the backup plan. If not; include these in the
backup plan.
Confirm that the backup can be successfully
restored.
Checklist: SharePoint Farm Backups
Complete this checklist to check SharePoint Server backups.
Prepared by:
Date:
Completed Task
Perform backup
Note:
If you are backing up the farm for the first
time, you must use the Full option. You
must perform a full backup before you
can perform a differential backup.
Verify if the backup operation completed
Note:
Note: Check the backup or restore status
in Central Administration.
Analyze and respond to errors and warnings
during the backup operation.
Checklist: SharePoint Audit
Complete this checklist to check SharePoint services and functionality.
Prepared by:
Date:
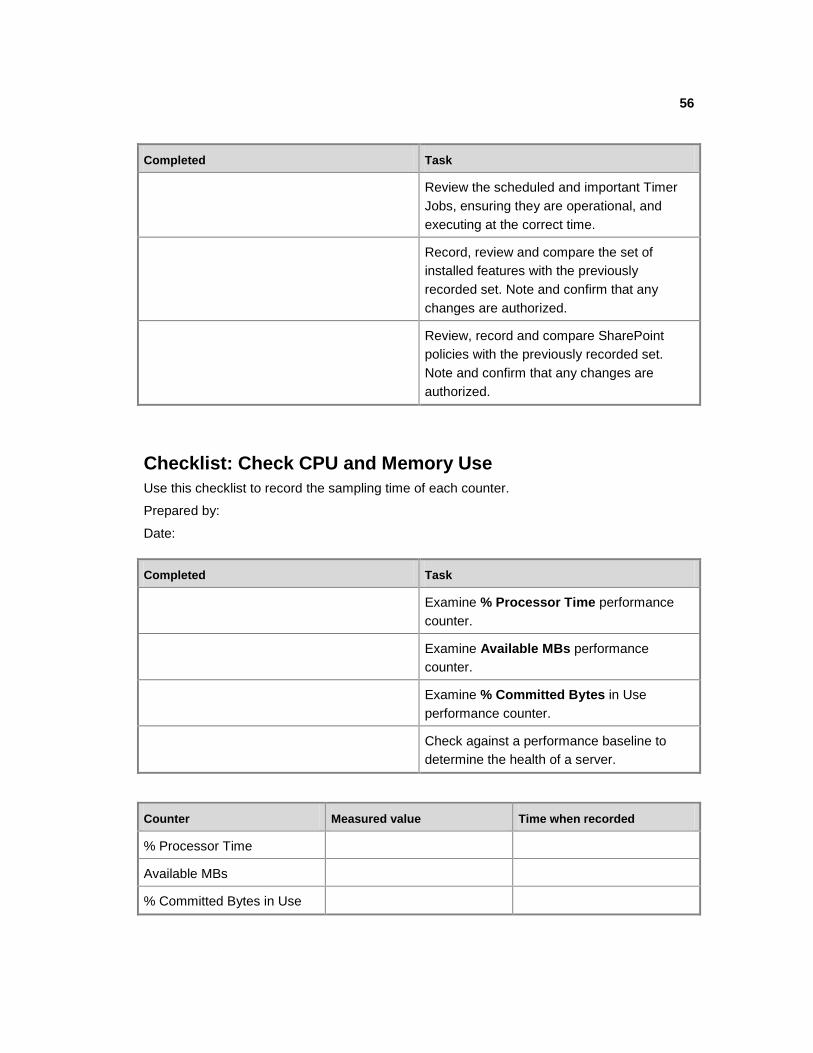
56
Completed Task
Review the scheduled and important Timer
Jobs, ensuring they are operational, and
executing at the correct time.
Record, review and compare the set of
installed features with the previously
recorded set. Note and confirm that any
changes are authorized.
Review, record and compare SharePoint
policies with the previously recorded set.
Note and confirm that any changes are
authorized.
Checklist: Check CPU and Memory Use
Use this checklist to record the sampling time of each counter.
Prepared by:
Date:
Completed Task
Examine % Processor Time performance
counter.
Examine Available MBs performance
counter.
Examine % Committed Bytes in Use
performance counter.
Check against a performance baseline to
determine the health of a server.
Counter Measured value Time when recorded
% Processor Time
Available MBs
% Committed Bytes in Use
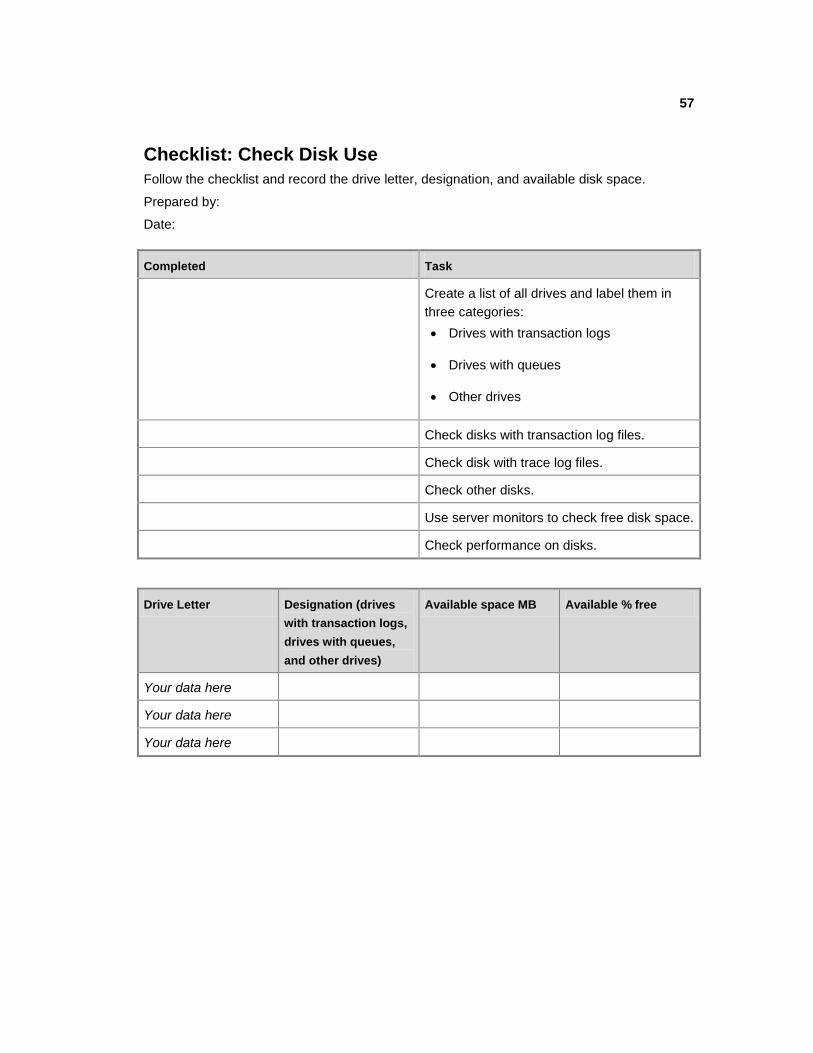
57
Checklist: Check Disk Use
Follow the checklist and record the drive letter, designation, and available disk space.
Prepared by:
Date:
Completed Task
Create a list of all drives and label them in
three categories:
Drives with transaction logs
Drives with queues
Other drives
Check disks with transaction log files.
Check disk with trace log files.
Check other disks.
Use server monitors to check free disk space.
Check performance on disks.
Drive Letter Designation (drives
with transaction logs,
drives with queues,
and other drives)
Available space MB Available % free
Your data here
Your data here
Your data here
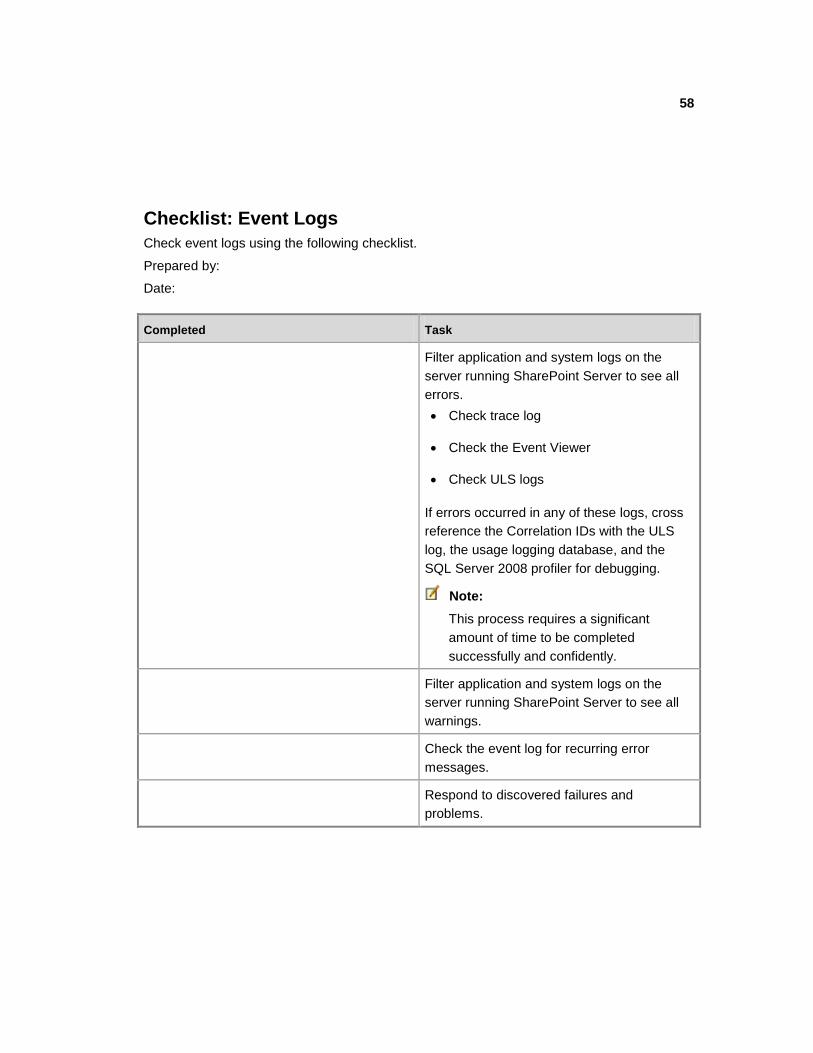
58
Checklist: Event Logs
Check event logs using the following checklist.
Prepared by:
Date:
Completed Task
Filter application and system logs on the
server running SharePoint Server to see all
errors.
Check trace log
Check the Event Viewer
Check ULS logs
If errors occurred in any of these logs, cross
reference the Correlation IDs with the ULS
log, the usage logging database, and the
SQL Server 2008 profiler for debugging.
Note:
This process requires a significant
amount of time to be completed
successfully and confidently.
Filter application and system logs on the
server running SharePoint Server to see all
warnings.
Check the event log for recurring error
messages.
Respond to discovered failures and
problems.

59
Checklist: Check IIS, IIS Logs and Performance
Complete this checklist to check IIS logs and performance and the status of services such as
SharePoint services and SQL Server services. For more information about monitoring IIS
logs and performance, see Monitoring Activity on a Web Server
(http://go.microsoft.com/fwlink/?LinkId=200915).
Prepared by:
Date:
Completed Task
Examine event log and filter. IIS logs give you
information about your changes.
Note:
If you are a medium-size
organization, examine your event
logs weekly.
Examine System Monitor for IIS performance
to examine the output of performance
counters. Examine the following performance
counters:
Web Service counters to monitor the
World Wide Web Publishing Service
(WWW service).
Web Service Cache counters to monitor
the WWW service cache.
Active Server Pages counters to monitor
applications that run as Active Server
Pages (ASPs).
Check whether the application pools have
enough memory or check if they are running
correctly. In particular look for Application
Pool recycle events, which may reveal a
memory leak.
Ensure that the application pools are recycled
every day.
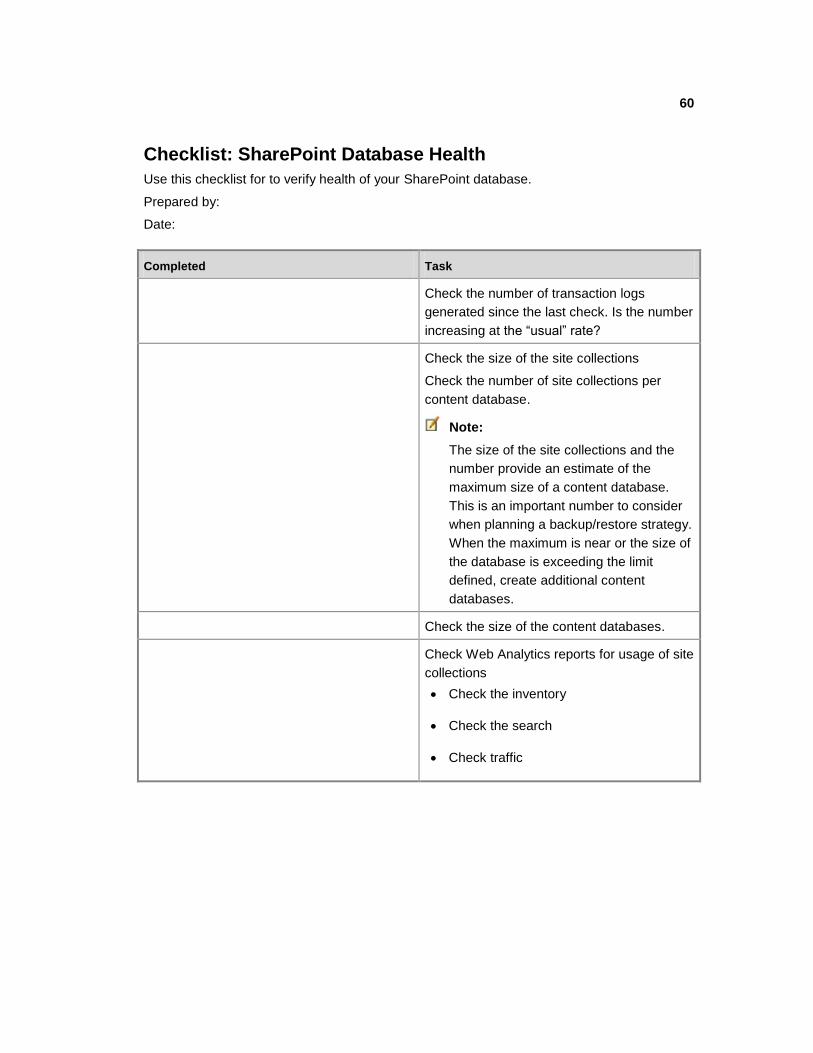
60
Checklist: SharePoint Database Health
Use this checklist for to verify health of your SharePoint database.
Prepared by:
Date:
Completed Task
Check the number of transaction logs
generated since the last check. Is the number
increasing at the ―usual‖ rate?
Check the size of the site collections
Check the number of site collections per
content database.
Note:
The size of the site collections and the
number provide an estimate of the
maximum size of a content database.
This is an important number to consider
when planning a backup/restore strategy.
When the maximum is near or the size of
the database is exceeding the limit
defined, create additional content
databases.
Check the size of the content databases.
Check Web Analytics reports for usage of site
collections
Check the inventory
Check the search
Check traffic
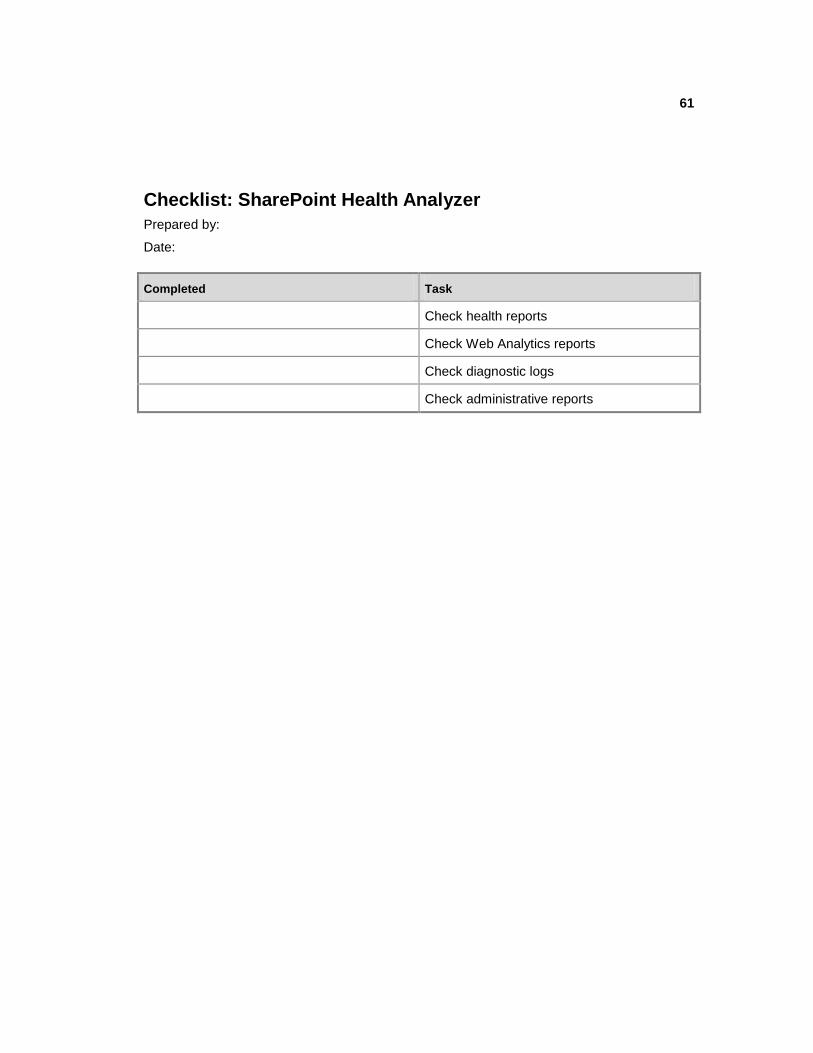
61
Checklist: SharePoint Health Analyzer
Prepared by:
Date:
Completed Task
Check health reports
Check Web Analytics reports
Check diagnostic logs
Check administrative reports

62
Checklist: Security Logs
To effectively correct known and discovered security issues, complete the following checklist.
Prepared by:
Date:
Completed Task
View the security event log on Event Viewer
and match security changes to known,
authorized configuration changes.
Investigate unauthorized security changes
discovered in security event log.
Check security news for latest viruses,
worms, and vulnerabilities.
Update and fix discovered security problems
and vulnerabilities.
If a server is running the SMTP service,
ensure it does not relay anonymously or lock
down to specific servers that require
functionality.
Verify that SSL is functioning for configured
secure channels, for example SharePoint
Central Administration.
Update antivirus signatures.
Check the Farm Administrators group to
ensure it contains only authorized accounts.
Confirm that all firewall configuration is active
and that only authorized traffic is allowed. For
example, settings prevent access to servers
in the farm that does not service end users.
Run a security report which outputs a full
audit of the permissions assigned to sites to a
file. This can be valuable in identify when
security changes have been made.
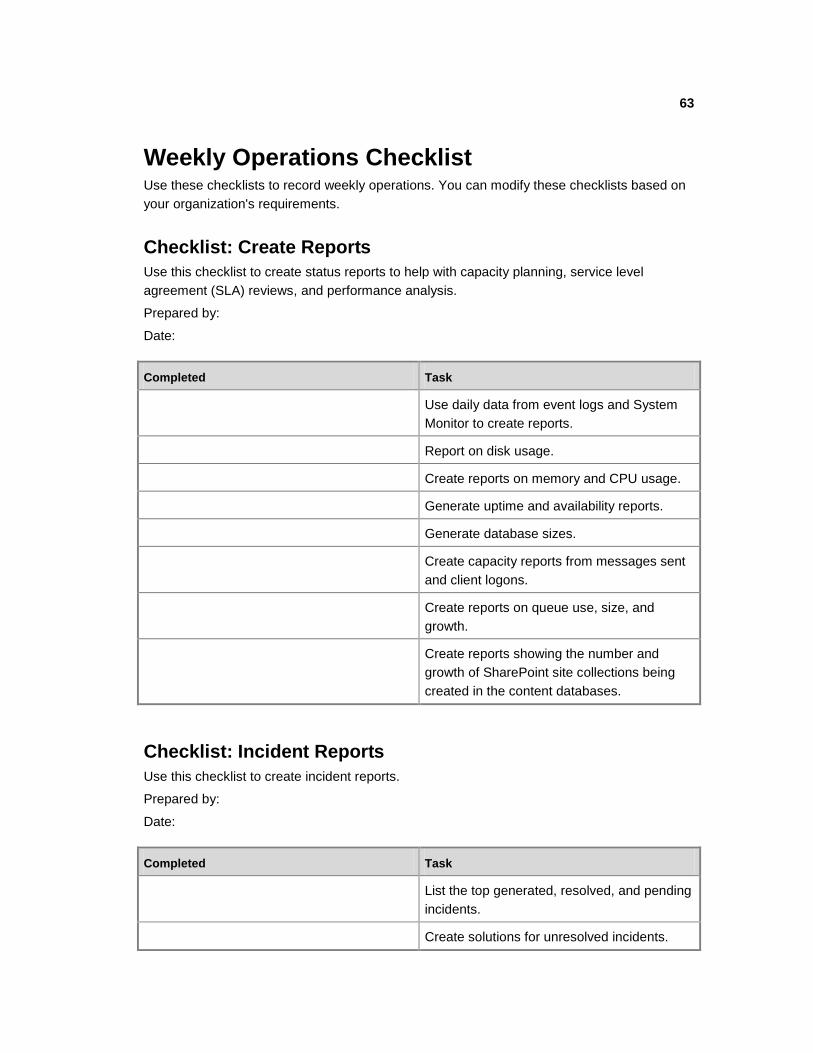
63
Weekly Operations Checklist Use these checklists to record weekly operations. You can modify these checklists based on
your organization's requirements.
Checklist: Create Reports
Use this checklist to create status reports to help with capacity planning, service level
agreement (SLA) reviews, and performance analysis.
Prepared by:
Date:
Completed Task
Use daily data from event logs and System
Monitor to create reports.
Report on disk usage.
Create reports on memory and CPU usage.
Generate uptime and availability reports.
Generate database sizes.
Create capacity reports from messages sent
and client logons.
Create reports on queue use, size, and
growth.
Create reports showing the number and
growth of SharePoint site collections being
created in the content databases.
Checklist: Incident Reports
Use this checklist to create incident reports.
Prepared by:
Date:
Completed Task
List the top generated, resolved, and pending
incidents.
Create solutions for unresolved incidents.
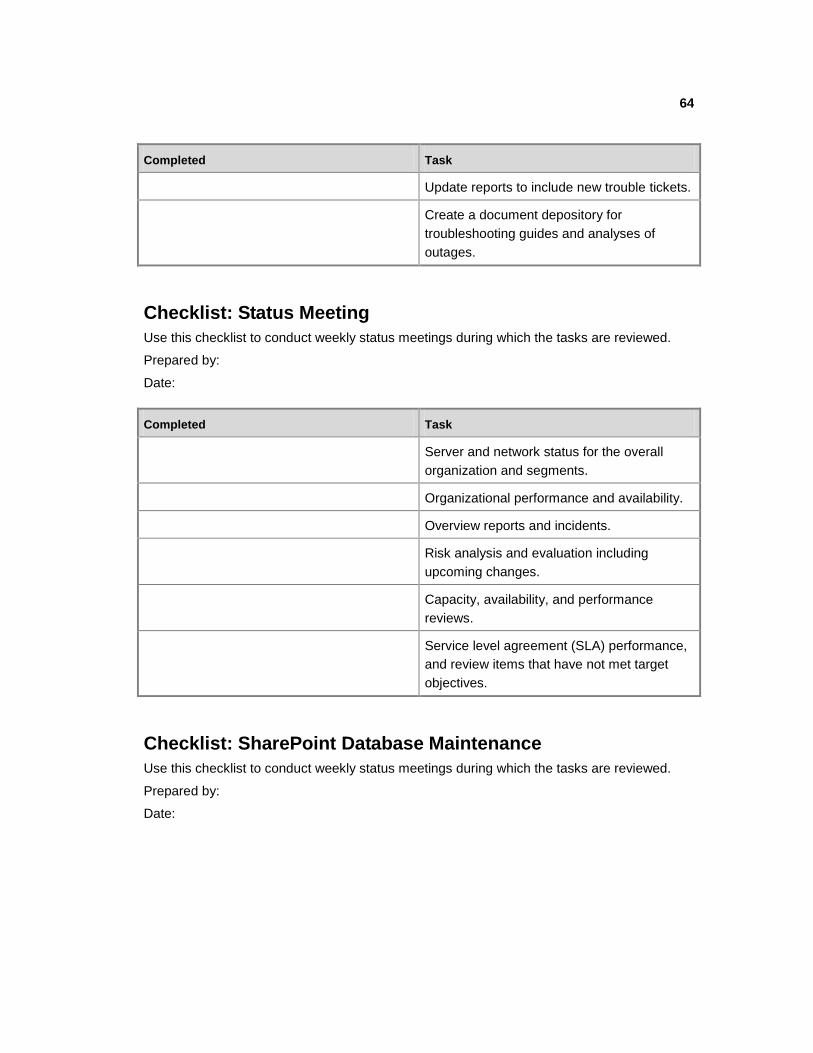
64
Completed Task
Update reports to include new trouble tickets.
Create a document depository for
troubleshooting guides and analyses of
outages.
Checklist: Status Meeting
Use this checklist to conduct weekly status meetings during which the tasks are reviewed.
Prepared by:
Date:
Completed Task
Server and network status for the overall
organization and segments.
Organizational performance and availability.
Overview reports and incidents.
Risk analysis and evaluation including
upcoming changes.
Capacity, availability, and performance
reviews.
Service level agreement (SLA) performance,
and review items that have not met target
objectives.
Checklist: SharePoint Database Maintenance
Use this checklist to conduct weekly status meetings during which the tasks are reviewed.
Prepared by:
Date:
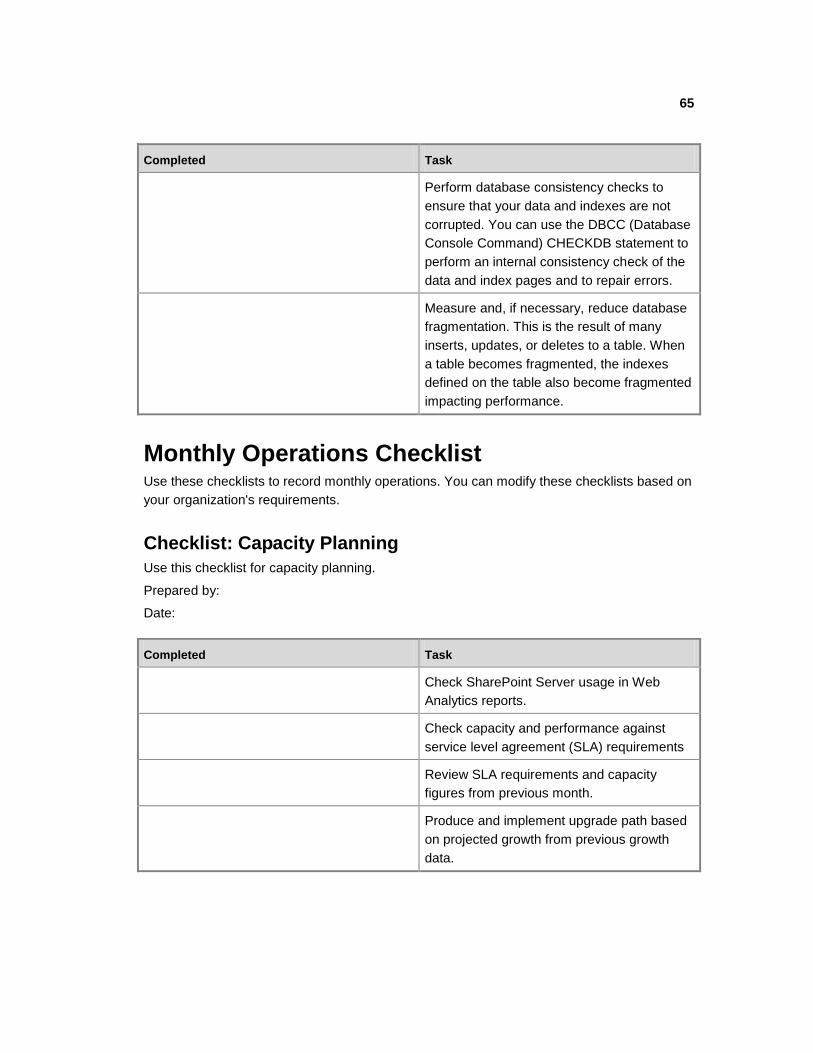
65
Completed Task
Perform database consistency checks to
ensure that your data and indexes are not
corrupted. You can use the DBCC (Database
Console Command) CHECKDB statement to
perform an internal consistency check of the
data and index pages and to repair errors.
Measure and, if necessary, reduce database
fragmentation. This is the result of many
inserts, updates, or deletes to a table. When
a table becomes fragmented, the indexes
defined on the table also become fragmented
impacting performance.
Monthly Operations Checklist Use these checklists to record monthly operations. You can modify these checklists based on
your organization's requirements.
Checklist: Capacity Planning
Use this checklist for capacity planning.
Prepared by:
Date:
Completed Task
Check SharePoint Server usage in Web
Analytics reports.
Check capacity and performance against
service level agreement (SLA) requirements
Review SLA requirements and capacity
figures from previous month.
Produce and implement upgrade path based
on projected growth from previous growth
data.

66
Checklist: Hotfixes, Service Packs, Update Rollups, and Security Updates
Use this checklist to update your systems with hotfixes, service packs, update rollups, and
security updates in your organization.
Prepared by:
Date:
Completed Task
Maintain a list of applied hotfixes, service
packs, update rollups, and security updates.
Check product and patch installation status in
SharePoint Server.
Verify that each server in the farm is
running the correct version
Verify that each server is running the
correct build version
Verify the status of each component in
the farm
See if there are new hotfixes for
Microsoft Windows Server, SQL Server, and
SharePoint Server.
See if there are service packs for
Windows Server, SQL Server, and
SharePoint Server.
See if there are updates to complementary
services such as Internet Information
Services (IIS), Active Directory Domain
Services, and DNS Server.
Apply updates uniformly across servers and
workstations in the organization.
Perform critical security updates as soon as
possible, based on company policy.
Checklist: Documentation and Procedures
Use this checklist for documentation.
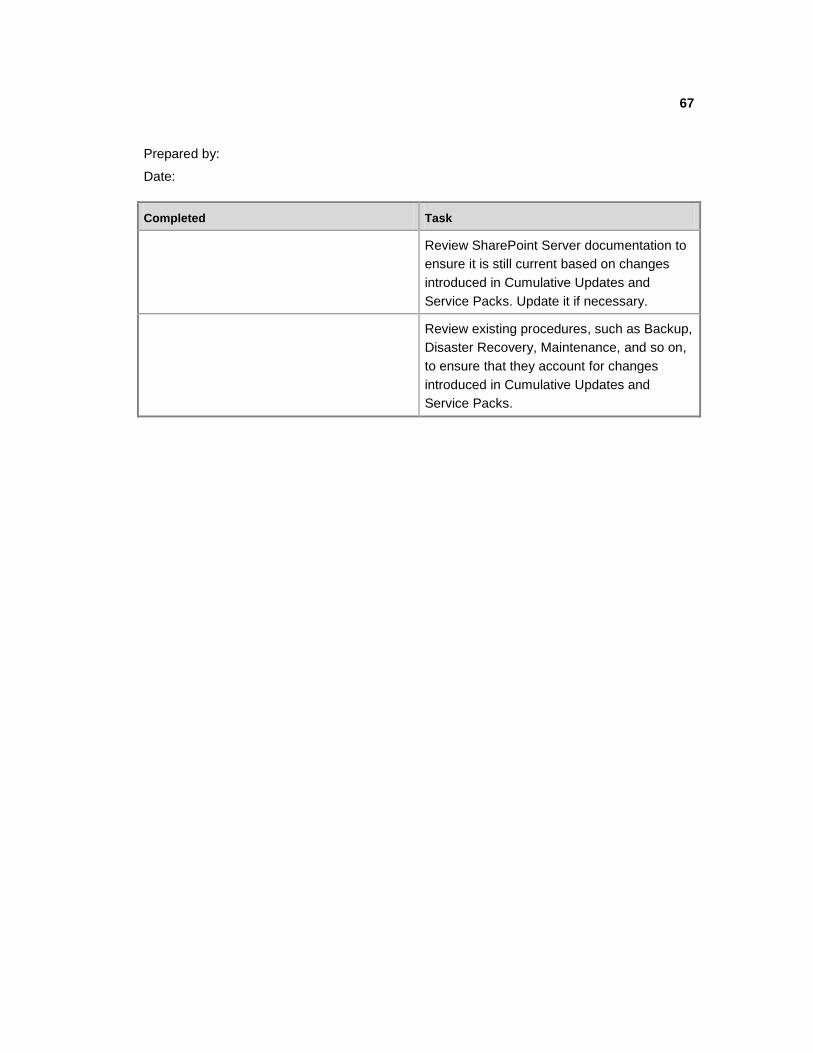
67
Prepared by:
Date:
Completed Task
Review SharePoint Server documentation to
ensure it is still current based on changes
introduced in Cumulative Updates and
Service Packs. Update it if necessary.
Review existing procedures, such as Backup,
Disaster Recovery, Maintenance, and so on,
to ensure that they account for changes
introduced in Cumulative Updates and
Service Packs.

68
Summary Checklist This checklist provides a summary of SharePoint Server 2010 operations tasks on a daily,
weekly, and monthly basis. You can modify these checklists based on your organization's
requirements.
Checklist: Summary
Prepared by:
Date:
Completed Daily
Check backups.
Check CPU/memory use.
Check disk use.
Check disk health (S.M.A.R.T.)
Examine event logs.
Check backups.
Check Internet Information Service (IIS)
performance.
Check SharePoint Server database health.
Check SharePoint Health Analyzer
Check non-SharePoint Server connectors.
Check security logs.
Update virus definitions and scan for viruses.
Verify that SharePoint Server and required
Windows services have started correctly.
Completed Weekly
Create reports.
Complete incident reports.
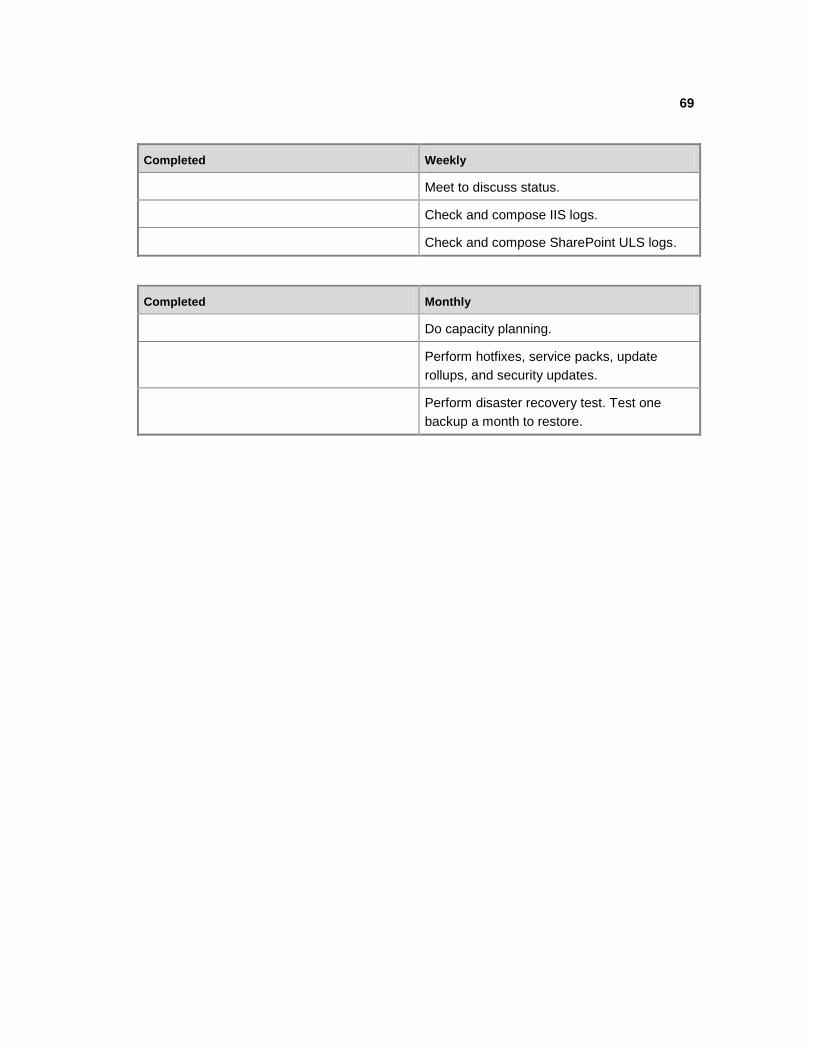
69
Completed Weekly
Meet to discuss status.
Check and compose IIS logs.
Check and compose SharePoint ULS logs.
Completed Monthly
Do capacity planning.
Perform hotfixes, service packs, update
rollups, and security updates.
Perform disaster recovery test. Test one
backup a month to restore.

70
Monitoring SharePoint Server 2010 with Microsoft Systems Operations Manager 2007 R2
Making sure that servers running SharePoint Server 2010 are operating reliably is a key
objective for daily operations. Therefore, it should be systematically approached based on the
principles outlined in the Microsoft Operations Framework (MOF). For more information about
the MOF, see Microsoft Operations Framework
(http://go.microsoft.com/fwlink/?linkid=25297).
A significant aspect of SharePoint Server 2010 daily operations is monitoring the health of the
SharePoint components to achieve the following functions:
Generate alerts when operational failures and performance problems occur.
Represent the health state of servers and server roles.
Generate reports of operational health over time so that you can estimate future
demands based on usage patterns and other performance data.
Overview of Microsoft SharePoint 2010 Products Management Pack for SCOM 2007 R2 The Microsoft SharePoint 2010 Products Management Pack is designed to be used for
monitoring SharePoint events, collecting SharePoint component-specific performance
counters in one central location, and for raising alerts for operator intervention as necessary.
By detecting, sending alerts, and automatically correlating critical events, this management
pack helps indicate, correct, and prevent possible service outages or configuration problems,
allowing you to proactively manage servers running SharePoint Server and identify issues
before they become critical. The Microsoft SharePoint 2010 Products Management Pack
monitors and provides alerts for automatic notification of events which indicate service
outages, performance degradation, and health monitoring.
The Microsoft SharePoint 2010 Products Management Pack is built to detect, diagnose, and
alert on software and hardware incidents discovered by agents installed on servers running
SharePoint Server.
Health monitoring of SharePoint Server 2010, Search Server 2010, and Office Web Apps
Monitors Events and Services and alerts when service outages are detected
Monitors Performance and warns users when SharePoint performance is at risk
Forwards users to up-to-date TechNet knowledge articles
This Management Pack monitors the following services:
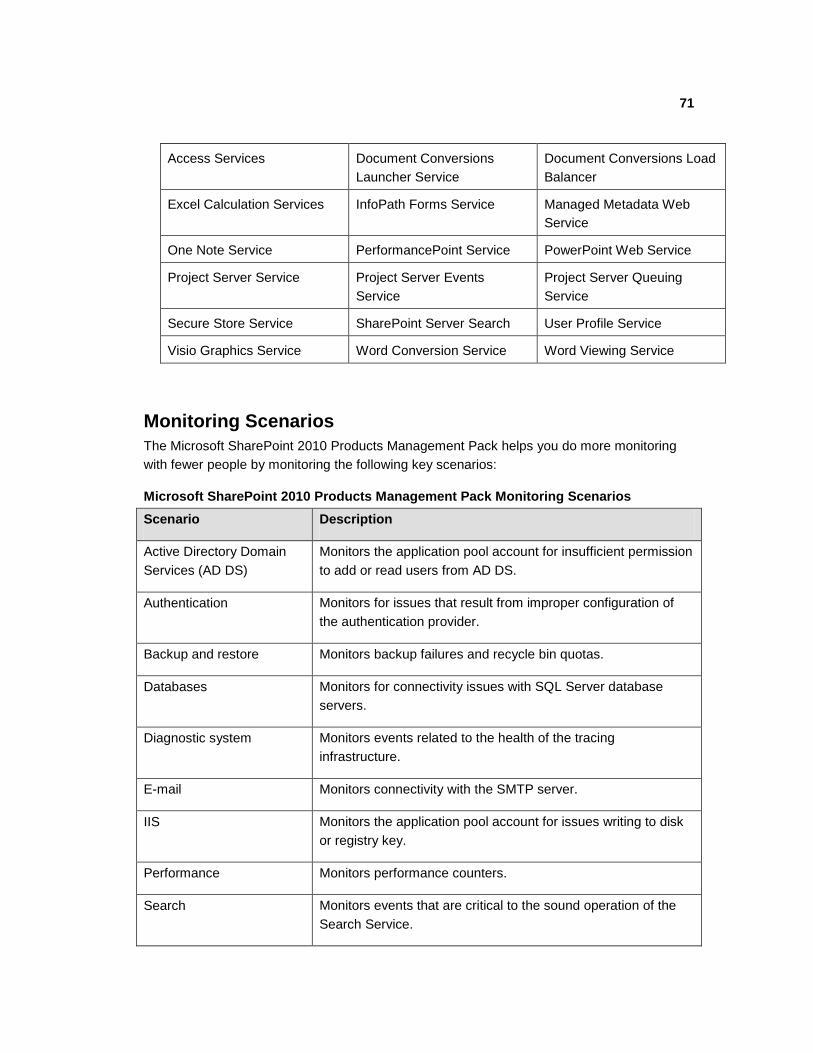
71
Access Services Document Conversions
Launcher Service
Document Conversions Load
Balancer
Excel Calculation Services InfoPath Forms Service Managed Metadata Web
Service
One Note Service PerformancePoint Service PowerPoint Web Service
Project Server Service Project Server Events
Service
Project Server Queuing
Service
Secure Store Service SharePoint Server Search User Profile Service
Visio Graphics Service Word Conversion Service Word Viewing Service
Monitoring Scenarios
The Microsoft SharePoint 2010 Products Management Pack helps you do more monitoring
with fewer people by monitoring the following key scenarios:
Microsoft SharePoint 2010 Products Management Pack Monitoring Scenarios
Scenario Description
Active Directory Domain
Services (AD DS)
Monitors the application pool account for insufficient permission
to add or read users from AD DS.
Authentication Monitors for issues that result from improper configuration of
the authentication provider.
Backup and restore Monitors backup failures and recycle bin quotas.
Databases Monitors for connectivity issues with SQL Server database
servers.
Diagnostic system Monitors events related to the health of the tracing
infrastructure.
E-mail Monitors connectivity with the SMTP server.
IIS Monitors the application pool account for issues writing to disk
or registry key.
Performance Monitors performance counters.
Search Monitors events that are critical to the sound operation of the
Search Service.
72
Scenario Description
State monitoring and
service discovery
Monitors Windows NT service availability, including the
following:
Microsoft SharePoint Foundation 2010 Timer
Microsoft SharePoint Foundation 2010 Tracing
Microsoft SharePoint Foundation 2010 Search
Microsoft Internet Information Service
Timer Monitors events associated with the Timer service.
Web Parts and event
handlers
Monitors events associated with failures to load event handlers
and safe control assembly paths.
More Information about the Microsoft SharePoint 2010 Products Management Pack for SCOM 2007 R2 The information contained in this document is designed to provide an overview of the
capabilities of the Microsoft SharePoint 2010 Products Management Pack for SCOM 2007
R2. For detailed information about the pack, its installation and configuration, see Microsoft
SharePoint 2010 Products Management Pack for System Center Operations Manager 2007
(http://go.microsoft.com/fwlink/?LinkId=203252).
73
Appendix A: Enabling the Developer Dashboard
The dashboard is turned off by default, but you can enable it by using the object model or
Windows PowerShell. When the dashboard is turned on you will find information about the
controls, queries, and execution time that occur as part of the page rendering process. This
information appears at the bottom of the page.
The developer dashboard has three different modes:
1. Off - The dashboard will not be displayed.
2. On - The dashboard is rendered and accessible on each page.
3. On Demand - Enables the Developer Dashboard but hides it until a user manually clicks
the Developer Dashboard icon.
Enable Developer Dashboard via Object model: SPPerformanceMonitor Dashboard = SPFarm.Local.PerformanceMonitor;
Dashboard.DeveloperDashboardLevel = SPPerformanceMonitoringLevel.On;
Dashboard.Update();
Enable Developer Dashboard by using Windows PowerShell
Param ([String]$mode)
function Main() { $dashboard = [Microsoft.SharePoint.Administration.SPWebService]::ContentService.DeveloperDashboardSettings; $dashboard.DisplayLevel = $mode; $dashboard.RequiredPermissions ='EmptyMask'; $dashboard.TraceEnabled = $true; $dashboard.Update()
Write-Host "Configured Developer Dashboard with mode $mode." }