who do we trust on social policy interventions?
TRANSCRIPT

1
This is an Accepted Manuscript of an article published by Taylor & Francis in Basic and Applied Social Psychology Vol 40(5) 249-268, 2018 available online:
https://doi.org/10.1080/01973533.2018.1469986].
Who do we trust on social policy interventions?
Magda Osman1, Norman Fenton1, Toby Pilditch2,
David Lagnado2, Martin Neil1
Abstract Social policy interventions, such as nudges (behavioral change techniques), have gained
significant traction globally. But what do the public think? Does the type of expert proposing
a nudge influence the kinds of evaluations the public make about nudges? Three experiments
investigated this by presenting a US (N = 689) and UK sample (N = 978) with descriptions of
nudges (genuine and fictitious) proposed by either scientists or the government. Overall,
compared to opaque and fictitious nudges, transparent, and genuine nudges were judged
more ethical and plausible, and scientists proposing them were judged more trustworthy
than a government working group. Also, trust in fictitious interventions proposed by
scientists was higher than in genuine interventions proposed by a government working
group.
Keywords: Behavioral interventions, Nudge, Scientists vs. Government, Trust, social policy
interventions
1Queen Mary University of London: [email protected], [email protected], [email protected]
2 University College London: [email protected], [email protected]
2
Introduction
Social scientific claims have become highly influential in the public domain, particularly
recently in the context of social policy interventions. A dominant example of this is behavioral
interventions, under the catch all term “nudges” (Thaler & Sunstein, 2008), which have
become highly popular decision-support methods used by governments to help in a wide
range of areas such as health, personal finances, and general wellbeing (Curchin, 2017;
Osman, 2016). The scientific claim, informed by psychological and behavioral economic
research, is that to help people make better decisions regarding their lifestyle choices, and
those that improve the welfare of the state, what is potentially effective is subtly changing
the framing of the decision-making context, which makes prominent the option which
maximizes long term future gains (Thaler & Sunstein, 2008; Sunstein, 2016a). In essence the
position adopted by Nudge enthusiasts is that poor social outcomes are often the result of
poor decision-making, and in order to address this, behavioral interventions such as nudges
can be used to reduce the likelihood of poor decisions being made in the first place (Curchin,
2017). This article aims to shed light on public opinion regarding social policy interventions,
particularly with respect to the agent (Government, Scientist) that is proposing the
intervention, and the extent to which trust is attributed to them. The key question of interest
is the extent to which congruence between specific level of expertise (Government, Scientist)
and the subject domain (behavioral interventions) impacts public trust in the agent for
different types of interventions being proposed (plausibility of the interventions).
Nudges generally come in two types – opaque and transparent. Opaque nudges are
purported to work covertly, so that the decision-maker has minimal awareness of the
manipulation, and how it is designed to influence their behavior (e.g., defaults, re-
arrangement of choice alternatives, or using visual images to promote a positive or negative
message). In contrast, transparent nudges explicitly identify what behavior needs changing
and the reasons for this change (e.g., educational campaigns, clearer labelling on consumer
products) (Felsen, Castelo, & Reiner, 2013). In addition, nudges work for either the good of
the individual (e.g., reducing calorie intake, increasing retirement funds, increasing exercise),
referred to as pro-self nudges, or the good of the population (e.g., increasing organ

3
donations, promoting recycling, home reducing energy usage), referred to as pro-social
nudges (Hagman et al., 2015).
Considerable work has discussed and evaluated the effectiveness of different types of nudges
(Benartzi et al, 2017; Berman & Johnson, 2015; Johnson & Goldstein, 2003; Marteau et al,
2011), how best to implement them (Grüne-Yanoff, & Hertwig, 2016; Marteau, 2017), their
ethical issues (Oliver, 2013; Osman, 2016; Sunstein, 2016a), and when they should be used to
complement more conventional regulatory methods (e.g., mandates, taxes, bans, financial
incentives) (House of Lords, 2011; Michie, van Stralen, & West, 2011; Sunstein, 2014, 2016a).
While the predominate focus on studying nudges has been on establishing their efficacy, a
new research focus in the social sciences has been directed towards examining public opinion
towards them (Arad, & Rubinstein, 2015; Felsen, Castelo, & Reiner, 2013; Hagman et al.,
2015; Hedlin, & Sunstein, 2016; Jung & Mellers, 2016; Reisch, & Sunstein, 2016; Reisch,
Sunstein & Gwozdz, 2016; Sunstein, 2016b). Also, there has been work examining the publics’
appetite for nudges over more conventional methods of social policy regulation (Mazzocchi
et al., 2015; Sunstein, Reisch, & Rauber, 2017). The findings show that the public is
overwhelmingly more accepting of transparent over opaque nudges, though if told that
opaque nudges are more effective, then there is marginal switching of favourable opinion
towards opaque ones (Sunstein, 2016). Moreover, when presented with a choice between
personal active choice or a behavioral intervention, the public opt for active choice,
expressing an interesting in maintaining their own agency over their lifestyle choices (Arad, &
Rubinstein, 2015; Hedlin, & Sunstein, 2016). There is also a stronger preference for pro-self
(which impinge more on personal lifestyle choices) over pro-social nudges, although liberal
political affiliation and higher empathic dispositions shift preferences towards pro-social
nudges (Hagman et al., 2015; Jung & Mellers, 2016; Tannenbaum, Fox, & Rogers, 2015).
While these findings provide some indication of how the public in the US, Europe, Africa, and
Asia tend to consider nudges, the surveys predominately concern judgements of acceptance,
approval, or preference. Few surveys consider the extent to which nudges are judged as
restricting an individual’s freedom, or whether they are judge to be effective (Arad, &
Rubinstein, 2015; Hagman et al., 2015), and none thus far have focused on examining the
issue of trust, particularly with respect to the agent that is proposing the nudge. As such, the

4
present set of experiments address, in depth, how the public judge the plausibility of
behavioral interventions, their perceived transparency, their ethicality, and trust in the agent
that is proposing them. In the experiments presented here, the public were required to make
judgments about transparent and opaque nudges, in which the expert proposing the nudges
was either a group of scientists with relevant expertise in the area, or a government working
group with comparatively less relevant expertise (Experiment 1a, 1b; in Experiment 2
relevant expertise was matched in both groups). From the findings discussed here, public
opinion is generally more favourable towards transparent compared to opaque nudges. By
extension, in the set of experiments we conduct, we test the following hypothesis:
1. Hypothesis 1: Compared to actual opaque behavioral interventions, judgments of the
perceived transparency of actual transparent behavioural interventions will be higher.
2. Hypothesis 2: Compared to opaque behavioral interventions, judgments of ethicality
of transparent behavioural interventions will be higher.
3. Hypothesis 3: Compared to opaque behavioral interventions, judgments of plausibility
of transparent behavioural interventions will be higher.
4. Hypothesis 4: Compared to opaque behavioral interventions, judgments of trust in
the proposer of transparent behavioural interventions will be higher.
With respect to the first hypothesis, the vast majority of public surveys commonly explore
public attitude towards transparent and opaque nudges. We extend this by examining the
perceived transparency of the intervention that is designed to change behavior. The reason
for including a question of this kind is as follows: we expect, given the critical differences in
the social scientific definition between transparent and opaque nudges, that if the definitions
are consistent with the public’s perception of them, then as is outlined in Hypothesis 1, the
more the public perceive a nudge as transparent the easier it is to identify how it changes
behavior.
Taken together, the predicted direction of judgments outlined in Hypotheses 1-4 is based on
the well-known Halo effect (Nisbett & Wilson, 1977; Thorndike, 1920). A positive evaluation
of transparent nudges should lead to positive attributions made regarding other dimensions
which are related (perceived transparency, ethicality), as well as unrelated (plausibility). Also,
as mentioned, there have been no public surveys on nudges that have explicitly examined

5
trust in relation to the expert proposing the nudge (i.e. government, scientists). By expert we
mean a speaker that is perceived to be capable of making correct and informed assertions
(Pornpitakpan, 2004). By trust we mean the degree to which an audience perceives the
assertions made by a communicator to be ones that the speaker considers valid (Hovland,
Janis, & Kelley, 1953).
Exploring these issue not only provides new insights in the domain of public attitudes on
nudges, but also sheds light on growing academic interest in public trust of scientists. In
particular, how people navigate and evaluate scientific communication (Strong, 2017). The
way scientists communicate claims regarding matters of public interest has been investigated
in areas such as climate change (Hmielowski,et al, 2014), genetically modified food (Lang, &
Hallman, 2005) and stem cell research (Critchley, 2008), to name but a few. Much of the
work has considered the extent to which the public trusts scientific claims being made, and in
some cases, how trust in scientists differs from the same claims being made by policy makers,
political activists, and the media. Some work shows that scientists fare better than policy
makers, government officials, and the media (Gauchat, 2012; IPSOS MORI, 2016; Marques,
Critchley, & Walshe, 2015). However, the opinion of scientists is guided by the public’s own
scientific knowledge regarding the topic of the scientific claims (Lewandowsky & Oberauer,
2016; Sturgis, & Allum, 2004), and their political affiliation; those leaning towards
conservative political positions showing greater scepticism in scientists (Gauchat, 2012).
Moreover, if scientists are seen to act in collaboration with politicians and industry then
opinion drops (Critchley, 2008; Oreskes & Conway, 2011). The latter finding suggests that the
incentives that motivate scientific research also influences judgments of trust.
One of the many factors that can make communication persuasive to an audience (Petty &
Cacioppo, 1986; McGuire, 1978) is the source of the communication (Lewandowsky &
Oberauer, 2016; Lupia, 2013; Teeny, Briñol, & Petty, 2016; for review see, Pornpitakpan,
2004). How does this apply in the context of scientific communication? Several studies have
investigated the impact of credibility on the uptake of science communication online; there
are now a vast range of online outlets from which scientific findings are communicated
(Brossard, 2013). The evidence suggests that science communication is better recalled
(McKnight & Coronel, 2017), and is more appealing (Winter & Krämer, 2012), when the topic

6
and the expertise of the scientist are congruent. In other words, congruency effects based on
the compatibility between the domain of expertise of the source (i.e. the expert) with the
scientific topic make the communication more persuasive. The explanation here is that
subject-area experts tend to have richer and more detailed knowledge of their own scientific
topics of interest (Ericsson & Lehmann, 1996). This means the information they communicate
on the topic is more credible. Also, if the public has little or no expertise in the scientific
topic, they will more likely put more trust in those judged to have highly relevant expertise in
the topic they are discussing, especially if they communicate the information confidently
(Sniezek & Van Swol, 2001). Much the same is found in the area of advertising where the
importance of congruency effects in source credibility has also been explored through what is
known as the matching-hypothesis (Kamins, & Gupta, 1994). When congruent, consumers
will process both the endorser and the product more favourably (Amos, Holmes, & Strutton,
2008; Fleck, Korchia, & Le Roy, 2012).
In fact, congruency effects have a long established history in cognitive psychology,
particularly in the domain of cognitive control (Notebaert, Gevers, Verbruggen, & Liefooghe,
2006; Osman, 2014; Stroop, 1935). The congruency effect is well explained by the Monitoring
Hypothesis (Botvinick, Braver, Barch, Carter, & Cohen, 2001). This is based on a theoretical
account of cognitive control which claims that there is top-down monitoring of information
such that when a conflict is detected this prompts additional cognitive resources being
allocated to the task at hand. A conflict, such as one between the scientific domain of
expertise and the topic of communication, will lead to greater effort in processing which can
then have damaging effects on judgments associated with the scientist and the topic.
Extending the Monitoring hypothesis to the focus of interest of the present set of
experiments we consider the following: if there is a greater congruence between the domain
of expertise and scientific topic area, then less cognitive effort will be spent processing the
content of the scientific communication. Also, by the same token, more favourable
judgments about the source and the content of the communication will be made. In the
present set of experiments, the congruency between source and scientific communication
was high in conditions where the expert (i.e. scientists researching in the topic of behavioural
interventions) and the communication (i.e. presenting findings advocating behavioral

7
interventions) closely matched. Congruency was low in conditions where the expert (i.e. a
government working group that had no specific expertise in behavioural interventions) and
the communication (i.e. presenting findings advocating behavioral interventions) was not
specifically matched. Thus, in line with the monitoring hypothesis, and taken together with
the evidence from research examining the congruency of domain of expertise and scientific
topic, we test the following hypothesis:
5. Hypothesis 5: As a result of higher congruency between source and the topic of the
science communication, the public will show higher judgments of trust for the high
congruency conditions [scientists] compared to the low congruency conditions [a
government group].
To further test the impact of the congruency manipulation we also manipulated the
plausibility of the scientific details regarding the behavioral interventions. Two (i.e. exercise,
personal finance) out of the five behavioral interventions described to participants have
actually been implemented (i.e. plausible). To encourage more exercise nudges have been
employed in stairwells to entice people to use them more (Åvitsland, Solbraa, & Riiser, 2017;
Kerr, Eves, & Carroll, 2001; Marshall et al, 2002). To improving personal finance (e.g.,
investments, retirement funds) a pre-selected option is built into products to ease the
burden of choice (Benartzi, et al, 2017; Drescher, Roosen, & Marette, 2014). The remaining
three nudges included in our experiments were completely fictitious and have not been
implemented as behavioral interventions. However, they have attracted media attention
because of their dubious nature as sources of behavioral change, and have featured in many
discussions on scienceforum.com. On this point, the implausible inventions share a
commonality with the plausible interventions, for the reason that serious doubts have been
raised regarding their efficacy (for review see Lin, Osman, & Aschroft, 2017).
As specified by the Monitoring Hypothesis (Notebaert, et al, 2006; Osman, 2014), when there
is greater congruence, in this case between the domain of expertise and scientific topic area,
then less cognitive effort will be spent processing critical information, i.e. the content of the
scientific communication. Here we used the level of scrutiny regarding the plausibility of the
behavioral interventions as a proxy for the amount of processing effort directed towards the

8
content of the communication. So that we further test the impact of congruency in the
following way:
6. Hypothesis 6: As a result of higher congruency between source and science
communication, there will be higher judgments of trust in the High Congruency
conditions [scientists proposing the interventions] compared to the Low Congruency
conditions [a government working group], regardless of the plausibility of the
behavioral intervention.
While public trust of scientific claims can be gained through high levels of source credibility, it
can be easily eroded through revelations of financial ties to multinationals and conflicts of
interest (Cho, et al, 2000; Dana & Loewenstein, 2003; Elliott & Resnik, 2014; Lewandowsky,
Ecker, Seifert, Schwarz, & Cook, 2012; McComas, 2008; Rosenstock & Lee, 2002). Given that
the present set of experiments are concerned with whether source credibility might
influence trust in the communication of social science to support social policy interventions,
we are also concerned with how easily trust can be eroded. Therefore, we examine the
extent to which additional information about funding conditions that motivate the research
carried out by the experts (i.e. scientists, government working group) differentially impacts
judgments of trust. There is work to suggest that if trust in respected and credible institutions
is high, then a revelation that can potential undermine that trust will lead to a more
substantial drop in trust compared to institutions in which trust is already relatively lower
(Löfstedt, 2003, 2005; McComas, 2008).
7. Hypothesis 7: Providing information regarding potential conflicts of interest in the
motivatations behind proposing behavioral interventions will lead to a decrease in
judgments of trust in the High Congruency conditions [scientists] compared to the
Low Congruency conditions [a government working group].
Experiment 1a and 1b
Methods
Design

9
To investigate the various factors of interest we introduced the following critical between
subject manipulations: 1) The agent proposing the social policy intervention (World leading
scientists, Government working group, Control Condition – in which no information was
provided); 2) The transparency of the intervention (transparent, opaque) which refers to the
distinctions as defined in the nudge literature; 3) the presence of conflicts of interest in which
information was presented indicating the underlying incentives for the
scientists/government working group that motivated their proposing the interventions
(Conflicts of Interest Absent [Experiment 1a], Conflict of Interest Present [Experiment 1b]).
Thus, Experiment 1a involved the following conditions: 1) High congruency condition
(transparent) [interventions proposed by scientists]; 2) High congruency condition (opaque
interventions) [interventions proposed by scientists]; 3) Low congruency condition
(transparent) [interventions proposed by a government working group]; 4) Low congruency
condition (opaque) [interventions proposed by a government working group]; 5) Control
condition (transparent); 6) Control condition (opaque). In Experiment 1b the same six
conditions were presented, but the only difference was an additional piece of text that
indicated the underlying incentives for the scientists/government working group that would
have motivated the interventions they proposed; these details were only presented to the
High Congruency and Low Congruency conditions, and not the control conditions.
Experiment 1a and 1b presented participants with descriptions of five different behavioral
interventions, and in each case participants were either presented with a transparent or
opaque version of one of the interventions. Both experiments were run in November 2016
Two of the five behavioral interventions were based on genuine interventions that are
currently being implemented presented in Table 1. The three other interventions were
completely fictitious. As mentioned, this was to examine the extent to which public opinion is
sensitive to the plausibility of behavioral interventions that are proposed, and whether as a
result of congruency effects, their higher estimation of the credibility of the scientists
proposing the interventions overwhelms the assessment of the plausibility of the scientific
claims being made. These are presented in Table 1.

10
Table 1. Genuine and Fictitious behavioral interventions.
Genuine Intervention Transparent version Opaque version
Increasing fitness posters on stairwells art work on stairwells
Increasing retirement savings
a traffic light system (red, amber, green) indicating riskiness of retirement products
an automatic opt-out system
Fictitious Intervention Transparent version Opaque version
Increasing energy efficiency by reducing hair-drier usage
Educational programme An automatic shut off system after 3 mins
Decreasing the negative (carcinogenic) impact of drinking coffee by stirring for 60 seconds
Posters informing people to stir coffee for 60 seconds
Having café staff stir coffee for 60 seconds
Increasing energy efficiency by reducing number of right hand turns made in vehicles (left in USA)
Signals on dashboards instructing drivers to make left turn
Vehicles fitted with steering wheels that make it hard to perform right turns
In sum, in the design of Experiment 1a and 1b participants were randomly allocated to one of
six conditions based on two critical manipulations adopting the following design: 2(Conflict of
Interest: Absent [Experiment 1a], Present [Experiment 1b]) x 2 (Sample: US, UK) x 3
(Congruency of source and content: High congruency (i.e. Top Scientists), Low congruency
(Government working group), Control) x 2 (Transparency: Transparent, Opaque) x 2
(Plausibility: High [Genuine interventions], Low [Fictitious interventions]). After they were
presented with 5 demographic questions, participants were then provided descriptions of 5
behavioral interventions, the presentation of which was randomized for each. For the 5
behavioral interventions (2 genuine, 3 fictitious) all participants were required to respond to
for judgment questions concerning: 1) the perceived transparency of the intervention
designed to change behavior, 2) plausibility of behavioral interventions, 3) the ethicality of
the interventions, and 4) trust in the agent that is proposing the interventions, also presented
in random order.

11
Participants
Experiment 1a and 1b included US and UK samples (Experiment 1a: US N = 322, UK N = 246;
Experiment 1b: US N = 367, UK N = 368) They were presented via Qualtrics and launched via
Prolific Academic - a crowd sourcing system for participant recruitment worldwide. All
participants were financially compensated for their time (90 cents). The eligible population
size from which participants were recruited on Prolific academic was approximately 10,000
US citizens, and 9,000 UK citizens. We used this as a basis on which to determine our sample
sizes. For a confidence interval of 99% with a margin of error of 5%, the required sample size
is 610-622 (Barlett, Kotrlik, & Higgins, 2001). For both experiments ethics approval from
QMUL college ethics board was granted under the project titled Ethical concerns around
nudges, QMERC2014/54. Participants were presented with the questions online. Participants
were given 4 probative questions regarding behavioral interventions but were first presented
with 5 demographic questions (the responses to which are summarised in Table 2). With
regards to the demographic questions, participants were asked to type their age in a text box
[continuous measure], and provide details of their gender (Female [score 1], Male [score 2],
Rather not say [Score 3]), along with their political affiliation (Left [Score 1], Centre [Score 2],
Right [Score 3], Other [Score 4]), their educational background (High school [Score 1],
diploma/foundation [Score 2], Bachelors degree [Score 3], Masters degree [Score 4], PhD
[Score 5], Other [Score 6]), and religious orientation (Definitely religious [Score 1], Not sure
[Score 2], Definitely not religious [Score 3]). These formed the basic question regarding
demographics and social/cultural characteristics.
Table 2 Participants profile from Experiment 1a and 1b combined, and Experiment 2.
Experiment Experiment 1a & 1b Experiment 1a & 1b Experiment 2
Sample US UK UK
Total participants
689 (all US residents or nationals, first language English)
614 (all UK residents or nationals, first language English)
364 (all UK residents or nationals, first language English)
Females 313 (45%) 337 (55%) 276 (75%)
Age Mean 32.66 (SD = 12.01) ranging from 18-74
Mean 36.09 (SD = 12.73) ranging from 18-72
Mean 36.23 (SD = 11.06) ranging from 18-72

12
Educational background
Mixed, 54.4% qualified with a degree (at bachelor degree and postgraduate level).
Mixed, 58.4% qualified with a degree (at bachelor degree and postgraduate level).
Mixed, 54.4% qualified with a degree (at bachelor degree and postgraduate level).
Political affiliation
54.3% identifying as left, 12% as centre, 19% as right, and 14.7% as other
45.3% identifying themselves as left, 10.4% as centre, 17.8% as right, and 26.5% as other
32.1% identifying themselves as left, 13.7% as centre, 14.3% as right, and 39.8% as other
Religion 31.9% reported that they did not have one, 24.2% reported that they were not sure, 1% preferred not to say, and 43.1% reported that they had a religion
51% reported that they did not have one, 17.3% reported that they were not sure, 1% preferred not to say, and 30.8% reported that they had a religion
53.1% reported that they did not have one, 8% reported that they were not sure, 1% preferred not to say, and 37.9% reported that they had a religion
Procedure
General instructions for all six conditions: After consenting to take part in the Experiment, all
participants were provided with the following general instructions which were implemented
for Experiment 1a and 1b. “This study examines attitudes towards Behaviour Change. In this
study we are going to ask you a number of questions on the subject of the use of methods to
change people’s behavior. If you agree to take part in this research, you will be asked to give
your views on the methods that have been proposed, and also answer some demographic
questions. Your participation in this study will take about 14 minutes. This study has been
approved by Queen Mary University Ethics board. Your participation is voluntary. Also, your
participation in this research is confidential. In the event of publication of this research, no
personally identifying information will be disclosed.”
Instructions presented to the High congruent conditions in both Experiment 1a & 1b;
Participants were presented with the following: “For each of the following five scenarios that
you will soon be presented with, the world’s leading scientists in the relevant subject domain
have developed a set of simple methods that adjust the way information is presented, so that
it can help people to make better decisions. In each case the work was based on studies over
more than 8 years, involved at least 3 Nobel prize winners and Professors working
collaboratively from Universities including Harvard, MIT, Oxford and Cambridge. Each study

13
was based on at least 120 peer-reviewed publications in the relevant leading academic
journals. The reason for using these methods is to help improve people’s behaviour, because
in many day-to-day contexts people may not make a decision that is best for their own health,
wealth, and their happiness”.
In Experiment 1b, the following additional text, which was absent in Experiment 1a, directly
followed after the above paragraph: “Depending on the success of the proposed methods,
which requires an uptake of 20% of the target population, the Scientists will receive financial
support for their continuing work on related activities for the next 5 years” This piece of text
was also presented at the end of each of the five scenarios.
Instructions presented to the Low congruent conditions in both (Experiment 1a & 1b): After
the main instructions participants were then presented the following: “For each of the five
following scenarios you will soon be presented with, a small working group of political
activists with interests relevant to the subject matter have been developing a set of simple
methods that adjust the way information is presented, so that it can help people to make
better decisions. In each case the working groups were made up of politicians, members of the
relevant special interest groups and members of the public, and for each case the
recommendations were based on extended discussions with relevant stakeholders. The reason
for using these methods in each scenario is to help improve people’s behavior, because in
many day-to-day contexts people may not make a decision that is best for their own health,
wealth, and their happiness.”
In Experiment 1b, the following additional text, which was absent in Experiment 1a, directly
followed after the above paragraph: “Depending on the success of the proposed methods,
which requires an uptake of 20% of the target population, the Government Working Group
will receive financial support for their continuing work on related activities for the next 5
years” This piece of text was also presented at the end of each of the five scenarios.
Instructions presented to the Control conditions (Experiment 1a & 1b): The instructions
presented after the main general instructions were “In the following pages, you will review 5
contexts and within each context you will answer a set of questions in relation to that

14
context.” Then for each description of the behavioural intervention, participants were
presented with just those details (none of the additional text presented in the High
Congruent and Low Congruent conditions) and then asked to respond to the four dependent
measures (identification, ethicality, plausibility, trust – detailed below). Crucially for the trust
question, participants in all Control conditions were presented with two versions. They had to
respond to both for each of the five descriptions of the behavioural interventions. Imagine
that a Government working group planned to recommend this method, to what extent do
you trust that they have your best interests in mind? [Scale 1 = I don’t trust them at all – 9 = I
fully trust them]. Imagine that a group of Top Scientists planned to recommend this method,
to what extent do you trust that they have your best interests in mind? [Scale 1 = I don’t trust
them at all – 9 = I fully trust them]. The reason for this was to provide a direct baseline
comparison for responses to the trust questions presented in the High congruent and Low
congruent conditions.
The general details of the scenarios presented in Table 3 were amended so that they were
sensitive to the sample, i.e. National Health Service (NHS) for the UK sample was replaced
with Health services for the US sample, and financial details were converted into $ for the US
sample, finally, the left/right hand steering for Fictitious scenario 3 was amended to be
sample sensitive (UK = Right turn, US = left turn).
Table 3. Genuine and Fictitious scenarios.
Transparent Opaque
This piece of text appeared at the end of each
scenario. There are two types of
methods: Transparent and non-transparent.
A transparent method works in such a way that
anyone can easily identify the actual method used
to change their behavior, as well as easily identify
how their behavior is changed by it.
A non-transparent method works in such a way
that no one can identify the actual method used
to change their behavior, and no one can identify
how their behavior is changed by it.

15
Genuine
1
In order to increase exercise, and increase peoples’ fitness levels, people should climb between 20-25 flights of stairs each day in order to improve their aerobic power and in turn their cardiorespiratory fitness. It is estimated that doing this will increase individual life expectancy by 5 years, and if undertaken by each person not currently doing regular exercise, it would save the NHS £1.2 billion per year within 3 years.
METHOD: Stairwells now have posters with
messages placed at strategic positions so as to encourage people to use stairs instead of lifts or escalators/elevators.
In order to increase exercise, and increase peoples’ fitness levels, people should climb between 20-25 flights of stairs each day in order to improve their aerobic power and in turn their cardiorespiratory fitness. It is estimated that doing this will increase individual life expectancy by 5 years, and if undertaken by each person not currently doing regular exercise it would save the NHS £1.2 billion per year within 3 years.
METHOD: Stairwells have art work place on
each floor so as to encourage people to walk up the stairs to view the art work.
Genuine
2
In order to save more money for their retirement, people should pay more attention to the riskiness of their investment schemes, because in most cases people make poor financial decisions. By taking fewer risks, it is estimated that doing this will increase individual personal savings by 42%, and if undertaken by each person that is not currently saving enough for their retirement the economic burden on social services would be reduced by 28% within a 5 year period.
METHOD: For any investment scheme that an
individual plans to put their savings into (for retirement purposes), a traffic light system is presented to them to indicate which is the low risk and which is the high risk investment scheme.
In order to save more money for their retirement, people should pay more attention to the riskiness of their investment schemes, because in most cases people make poor financial decisions. By taking fewer risks, it is estimated that doing this will increase individual personal savings by 42%, and if undertaken by each person that is not currently saving enough for their retirement the economic burden on social services would be reduced by 28% within a 5 year period.
METHOD: Banks and public service employers
are now introducing default methods, so that the low risk investment fund is the default fund that people are automatically allocated to for any savings plan for their retirement.
Fictitious
1
In order to reduce energy consumption in the home, and save money on fuel bills, the most effective means is to limit the usage of hair dryers to 3 minutes. Compared to all other common home appliances, hair dryers use the most power (Watts) per hour, especially if they were bought before January 2016. It is estimated that if this measure was adopted across the world it would lead to a reduction of 30 tons of carbon emissions and would help most countries meet their carbon reduction emission targets within 20 years.
METHOD: An advertising campaign has been
used to educate people as to the appropriate length of time that they should use hair dryers.
In order to reduce energy consumption in the home, and save money on fuel bills, the most effective means is to limit the usage of hair dryers to 3 minutes. Compared to all other common home appliances, hair dryers use the most power (Watts) per hour, especially if they were bought before January 2016. It is estimated that if this measure was adopted across the world it would lead to a reduction of 30 tons of carbon emissions and would help most countries meet their carbon reduction emission targets within 20 years.
METHOD: Hairdryers will have automatic shut-
off systems such that after 3 minutes of use, they will switch-off, and won’t operate again until 10 minutes later.
Fictitious
2
In order to prevent any of the harmful effects of drinking coffee regularly, the most reliable way to do this is to continuously stir the coffee for
In order to prevent any of the harmful effects of drinking coffee regularly, the most reliable way to do this is to continuously stir the coffee for

16
approximately 60 seconds in order to prevent the release of chemicals (salicylates) that increase blood glucose levels and increase inflammation associated with diabetes and cardiovascular disease. It is estimated that doing this will increase individual life expectancy of regular coffee drinkers by 3 years, and if undertaken by each regular coffee drinker would save the NHS £1 billion per year within 5 years.
METHOD: The signage in cafes reminds you of
the health benefits of stirring coffee for 60 seconds.
approximately 60 seconds in order to prevent the release of chemicals (salicylates) that increase blood glucose levels and increase inflammation associated with diabetes and cardiovascular disease. It is estimated that doing this will increase individual life expectancy of regular coffee drinkers by 3 years, and if undertaken by each regular coffee drinker would save the NHS £1 billion per year within 5 years.
METHOD: The Defaulted option is that coffee
served in cafes is stirred for you for 60 seconds.
Fictitious
3
In order to help reduce carbon emissions, and improve fuel efficiency, all vehicles in the UK should minimize making right turns wherever possible. Fuel consumption of all motor vehicles is substantially uneven with right turns consuming nearly twice as much fuel as left turns. It is estimated that if every driver in the UK reduced the number of right turns they make by 85% then within 5 years the UK will meet its carbon reduction emission targets.
METHOD: Vehicles now have signals on the
dashboard that indicate the level of fuel consumed after each turn is performed.
In order to help reduce carbon emissions, and improve fuel efficiency, all vehicles in the UK should minimize making right turns wherever possible. Fuel consumption of all motor vehicles is substantially uneven with right turns consuming nearly twice as much fuel as left turns. It is estimated that if every driver in the UK reduced the number of right turns they make by 85% then within 5 years the UK will meet its carbon reduction emission targets.
METHOD: Vehicles are fitted with steering
wheel devices that make it harder to complete a full right turn.
Dependent Measures presented to every participant:
For each scenario participants were asked the following four probative questions.
1) To what extent is it easy for you to identify HOW your behavior is going to be
changed by the psychological method? [Scale 1 = I cannot easily identify how my behavior is
changed by the method to 100 = I can easily identify how my behavior is changed by the
method]. The mean responses were calculated separately for genuine and fictitious
interventions.
2) To what extent do you think the proposed method is plausible? [Scale 1 = not
plausible at all – 100 = completely plausible]. The mean responses were calculated separately
for genuine and fictitious interventions.

17
3) Do you think there are ethical issues concerning this method? [Response options
Yes/No]. The proportion of y/n responses were coded separately for genuine and fictitious
interventions.
4) Given that the {“Government working group”/”Academic working group”} plan to
recommend this method, to what extent do you trust that they have your best interests in
mind? [Scale 1 = I don’t trust them at all – 9 = I fully trust them]. The mean responses were
calculated separately for genuine and fictitious interventions.
Once participants had completed all questions for all five scenarios, the experiment was
complete.
Results Both Cohen’s d and partial η2 are presented in the results section in Experiment 1(1a,1b) and
Experiment 2. Cohen (1988) provides a benchmark to define small (.1), medium (.3) and large
(.5) effects where Cohen’s d is presented. Where partial η2 effect sizes are presented we use
the classification which specifies effects as small (.02), medium (.13) and large (.26)
(Bakeman, 2005). As a consequence of the experimental design, our models include more
than one IV, and only in a few planned comparisons did we compare against a control
condition. Therefore, for these reasons, and to keep the continuity of reporting the results
simple across comparisons, and erring on the side of caution, we use partial η2 effect size
classification, which in all comparisons appears to be more conservative that Cohen’s d.

18
Table 4.
Results of pairwise comparisons across Experiments 1a, Experiment 1b, and Experiment 2 in which
the comparison statistics are presented (η2 and Cohen’s d).
The results presented in Table 4 are the pairwise comparisons (for all Experiments) organised
in the order they appear in the results section of the present paper, separated by dependent
Measure Intervention type M SD N Intervention type M SD N
Experiments 1a & 1b
Identifiability (1-100)
Transparent 70.1126 22.21622 1302 Opaque 63.38229 22.16401 1304 0.022 0.303305
Genuine 68.5936 20.79881 1303 Fictitious 64.89614 23.83351 1303 0.007 0.165687
Plausibility (1-100)
Genuine 58.7222 22.39171 1303 Fictitious 30.91097 21.48613 1303 0.287 1.267665
Transparent 47.1398 26.08321 1302 Opaque 42.49693 25.67035 1304 0.008 0.179422
High Congruency (Academic working group) 46.7992 25.92512 884 Low Congruency (Government working group) 43.425 26.02423 880 0.006 0.129904
High Congruency (Academic working group) 46.7992 25.92512 884 Control (Academic working group) 44.18943 25.88493 842 0.003 0.100744
US Sample 47.6364 25.91881 1378 UK Sample 41.65228 25.68525 1228 0.013 0.231926
Ethicality (Percentage)
Genuine 91.3277 20.96012 1303 Fictitious 74.03428 28.32804 1303 0.108 0.701727
Transparent 90.1434 21.66634 1302 Opaque 75.23006 28.46875 1304 0.080 0.594925
US Sample 84.2525 25.11897 1378 UK Sample 80.91748 27.61375 1228 0.004 0.126489
Experiment 1a 83.7148 25.36761 1136 Experiment 1b 81.88209 27.10349 1470 0.001 0.069856
Transparent (Experiment 1a & Genuine only) 94.5035 16.22578 282 Opaque (Experiment 1a & Genuine only) 90.38462 21.84938 286 0.011 0.216358
Transparent (Experiment 1b & Genuine only) 93.6314 19.33218 369 Opaque (Experiment 1b & Genuine only) 87.29508 24.18095 366 0.021 0.291239
Transparent (Experiment 1a & Fictitious only) 86.643 23.67233 282 Opaque (Experiment 1a & Fictitious only) 63.51981 26.37642 286 0.176 0.924028
Transparent (Experiment 1b & Fictitious only) 85.9982 24.567 369 Opaque (Experiment 1b & Fictitious only) 60.47359 27.21839 366 0.196 0.985784
Trust (1-9)
Genuine (High Congruency only) 6.79525 1.586308 442 Fictitious (High Congruency only) 5.824284 1.887099 442 0.072 0.559085
Transparent (High Congruency only) 6.65432 1.706818 432 Opaque (High Congruency only) 5.980457 1.843448 452 0.035 0.379613
High Congruency (Academic working group) 6.30977 1.808667 884 Control (Academic working group) 6.149644 1.783622 842 0.002 0.089148
High Congruency (Genuine only) 6.79525 1.586308 442 Control (Genuine only) 6.406176 1.626085 421 0.014 0.242233
High Congruency (Fictitious only) 5.82428 1.887099 442 Control (Fictitious only) 5.893112 1.895812 421 0.000 -0.03639
Genuine (Low Congruency only) 5.65114 1.727243 440 Fictitious (Low Congruency only) 4.534091 1.846104 440 0.089 0.62521
Transparent (Low Congruency only) 5.41153 1.760791 454 Opaque (Low Congruency only) 4.752739 1.928432 426 0.031 0.357142
Low Congruency (Government working group) 5.09261 1.872005 880 Control (Government working group) 4.487134 1.930145 842 0.025 0.318493
Low Congruency (Genuine only) 5.65114 1.727243 440 Control (Genuine only) 5.024941 1.757967 421 0.031 0.359345
Low Congruency (Fictitious only) 4.53409 1.846104 440 Control (Fictitious only) 3.949327 1.946661 421 0.023 0.308358
US Sample (Low Congruency only) 5.15629 1.871646 466 UK Sample (Low Congruency only) 5.020934 1.872077 414 0.001 0.072313
High Congruency (Academic working group) 6.30977 1.808667 884 Low Congruency (Government working group) 5.092614 1.872005 880 0.099 0.661375
Genuine (Control Excluded) 6.22449 1.753236 882 Fictitious (Controls Excluded) 5.18065 1.974198 882 0.073 0.560085
Transparent (Controls Excluded) 6.01749 1.841756 886 Opaque (Controls Excluded) 5.384776 1.981587 878 0.027 0.330976
High Congruency & Fictitious 5.82428 1.887099 442 Low Congruency & Genuine 5.651136 1.727243 440 0.002 0.095811
Experiment 1a (Controls Excluded) 5.78519 1.931141 772 Experiment 1b (Controls Excluded) 5.638273 1.942036 992 0.001 0.075864
Group 1 Group 2
Analysis Groups
Cohen's d
Measure Intervention type M SD N Intervention type M SD N
Experiment 2
Identifiability (1-100)
Transparent 66.6466 21.96568 332 Opaque 61.13721 23.31835 396 0.014 0.243326
Genuine 65.4396 21.38775 364 Fictitious 61.85989 24.14284 364 0.006 0.157242
Plausibility (1-100)
Genuine 54.7376 21.08651 364 Fictitious 27.60806 19.58617 364 0.308 1.334044
Transparent 44.5909 24.88225 332 Opaque 38.30724 23.73649 396 0.016 0.258486
High Congruency (Academic working group) 43.4067 24.17308 200 Low Congruency (Government working group) 38.00318 24.42416 262 0.012 0.222378
High Congruency (Academic working group) 43.4067 24.17308 200 Control (Academic working group) 42.61529 24.45241 266 0.000 0.03255
Ethicality (Percentage)
Genuine 87.0879 24.57984 364 Fictitious 65.47619 32.38011 364 0.124 0.758839
Transparent 82.9317 27.93388 332 Opaque 70.70707 31.80823 396 0.039 0.409248
Transparent (Genuine only) 89.759 23.0402 166 Opaque (Genuine only) 84.84848 25.64354 198 0.010 0.201733
Transparent (Fictitious only) 76.1044 30.6707 166 Opaque (Fictitious only) 56.56566 31.13008 198 0.091 0.632314
Trust (1-9)
Genuine (High Congruency only) 6.25 1.559429 100 Fictitious (High Congruency only) 5.003333 1.579537 100 0.137 0.794317
Transparent (High Congruency only) 5.87121 1.351098 66 Opaque (High Congruency only) 5.506219 1.820748 134 0.010 0.230146
High Congruency (Academic working group) 5.62667 1.685674 200 Control (Academic working group) 6.004386 1.724373 266 0.012 -0.22153
High Congruency (Genuine only) 6.25 1.559429 100 Control (Genuine only) 6.515038 1.587045 133 0.007 -0.16847
High Congruency (Fictitious only) 5.00333 1.579537 100 Control (Fictitious only) 5.493734 1.710338 133 0.021 -0.29813
Genuine (Low Congruency only) 5.57634 1.601049 131 Fictitious (Low Congruency only) 4.452926 1.758043 131 0.101 0.668877
Transparent (Low Congruency only) 5.29872 1.767943 130 Opaque (Low Congruency only) 4.734848 1.733514 132 0.025 0.322077
Low Congruency (Government working group) 5.01463 1.770008 262 Control (Government working group) 4.960526 1.864208 266 0.000 0.029775
Low Congruency (Genuine only) 5.57634 1.601049 131 Control (Genuine only) 5.462406 1.709625 133 0.001 0.068826
Low Congruency (Fictitious only) 4.45293 1.758043 131 Control (Fictitious only) 4.458647 1.883207 133 0.000 -0.00314
High Congruency (Academic working group) 5.62667 1.685674 200 Low Congruency (Government working group) 5.014631 1.770008 262 0.030 0.35422
Genuine (Controls Excluded) 5.86797 1.614773 231 Fictitious (Controls Excluded) 4.691198 1.701626 231 0.112 0.709666
Transparent (Controls Excluded) 5.4915 1.658248 196 Opaque (Controls Excluded) 5.123434 1.816218 266 0.011 0.211867
High Congruency & Fictitious 5.00333 1.579537 100 Low Congruency & Genuine 5.576336 1.601049 131 0.031 -0.36031
Group 1 Group 2
Analysis Groups
Cohen's d

19
variable. The comparison statistics include a comprehensive list of key comparisons (𝜂𝑃2 effect
sizes and Cohen’s d).
Judgments of perceived transparency: For these and all remaining analyses presented, no
observations were excluded. To examine the impact of our manipulations on judgments
regarding perceived transparency we conducted a 2(Conflict of Interest: Absent [Experiment
1a], Present [Experiment 1b]) x 2 (Sample: US, UK) x 3 (Congruency of source and content:
High congruency (Scientists), Low congruency (Government working group), Control) x 2
(Transparency: Transparent, Opaque) x 2 (Plausibility: High [Genuine interventions], Low
[Fictitious interventions]) analysis of variance, along with a series of pairwise comparisons.
Overall, the analyses showed that there was a small effect such that for transparent
interventions participants found it easier to identify how their behavior would be changed (M
= 70.113, SD = 22.22, N = 1302) as compared to opaque interventions (M = 63.38, SD = 22.16,
N = 1304), (𝜂𝑃2 = .02 [small], d = .30 [medium]). In addition, there was a very small effect
suggesting that perceived transparency was judged higher for genuine (M = 68.59, SD =
20.80, N = 1303) compared to fictitious (M = 64.90, SD = 23.83, N = 1303) interventions, (𝜂𝑃2 =
.007 [very small], d = .17 [small]).
Judgments of plausibility: There was a large effect suggesting that genuine interventions (M =
58.72, SD = 22.39, N = 1303) were judged more plausible than fictitious interventions (M =
30.91, SD = 21.49, N = 1303), (𝜂𝑃2 = .29 [large], d = 1.27 [large]); this indicates that our
manipulation regarding the plausibility of the contexts was successful. There was a very small
effect on plausibility judgments suggesting that they were impacted by transparency, with
transparent interventions (M = 47.14, SD = 26.08, N = 1302) judged more plausible than
opaque interventions (M = 42.50, SD = 25.67, N = 1304), (𝜂𝑃2 = .008 [very small], d = .17
[small]). There was also a small effect suggesting that overall interventions were judged as
more plausible in the High Congruent conditions (M = 46.80, SD = 25.92, N = 884), as
compared to the Low Congruent conditions (M = 43.43, SD = 26.02, N = 880), (𝜂𝑃2 = .006 [very
small], d = .13 [small]). A very small effect indicated that interventions were also judged as
more plausible in the High Congruent Conditions compared to Control conditions (M = 44.19,
SD = 25.92, N = 842), (𝜂𝑃2 = .003 [very small], d = .10 [small]). In addition, there was a small
effect suggesting sample differences. The US sample gave higher overall plausibility

20
judgments (M = 47.64, SD = 25.92, N = 1378) compared to the UK sample (M = 41.65, SD =
25.69, N = 1228), (𝜂𝑃2 = .01 [small], d = .23 [small]).
Ethicality judgments: Ethicality judgments were based on a scoring of the percentage of
interventions judged as ethical for genuine interventions and separately for fictitious
interventions. Overall, a medium effect suggested that there was a higher percentage of
favourable ethical judgments for genuine (M = 91.33, SD = 20.96, N = 1303) compared to
fictitious (M = 74.03, SD = 28.33, N = 1303) interventions, (𝜂𝑃2 = .11 [small], d = .70 [large]),
and small effect suggest that transparent interventions (M = 90.143, SD = 21.67, N = 1302)
were judged as more ethical than opaque (M = 75.23, SD = 28.47, N = 1304), (𝜂𝑃2 = .08 [small],
d = .59 [large]). A very small effect indicated that interventions were generally considered
more ethical by participants in the US (M = 84.25, SD = 25.12, N = 1378) than those in the UK
(M = 80.92, SD = 27.61, N = 1228), (𝜂𝑃2 = .004 [very small], d = .13 [small]). A very small effect
indicated that ethicality judgments were impacted by manipulations regarding the details of
the incentives (absent in Experiment 1a, present in Experiment 1b) (𝜂𝑃2 = .001 [very small], d
= .07 [small]). There was also a very small Congruency x transparency x type of intervention
interaction, (𝜂𝑃2 = .001 [very small, d = .22 [small]). For genuine interventions, in the absence
of conflicts of interest [Experiment 1a], there was a small effect (𝜂𝑃2 = .01 [small], d = .22
[small]) when comparing ethicality judgments for transparent (M = 94.50, SD = 16.23, N =
282) and opaque versions (M = 90.38, SD = 21.85, N = 286). Similarly, in the presence of
conflicts of interest [Experiment 1b] there was also a small effect (𝜂𝑃2 = .02 [small], d = .30
[medium]), ethical judgments were higher for transparent (M = 93.63, SD = 19.33, N = 369)
compared to opaque versions (M = 87.30, SD = 24.18, N = 366). For fictitious interventions,
there was a medium effect (𝜂𝑃2 = .18 [medium], d = .92 [large]), in the absence of conflicts of
interest [Experiment 1a] ethicality judgments were higher for transparent (M = 86.64, SD =
23.67, N = 282) than opaque versions (M = 63.52, SD = 26.37, N = 286). There was a large
effect (𝜂𝑃2 = .20 [large] d = .99 [large]) suggesting that in the presence of conflicts of interest
[Experiment 1b] ethical judgments were higher for transparent (M = 86.00, SD = 24.57, N =
369) compared to opaque interventions (M = 60.47, SD = 27.22, N = 366).
Judgments of Trust: When it comes to judgments of trust, separate comparisons were
conducted between High Congruency conditions and Control conditions, and Low

21
Congruency and Control conditions. Recall that for the Control conditions all participants
were presented trust judgments for each type of expert (i.e. Scientists, Government working
group) that could have been involved in proposing the behavioral interventions.
For trust judgments there was a small effect indicated that in the High Congruency
conditions, trust was overall higher for genuine (M = 6.80, SD = 1.59, N = 442) compared to
fictitious (M = 5.82, SD = 1.89, N = 442) behavioral interventions (left-hand pair of bars, left-
hand facet, Fig. 1), (𝜂𝑃2 = .07 [small], d = .56 [large]). There was also a small effect suggesting
that there was greater trust for transparent (M = 6.65, SD = 1.71, N = 432) compared to
opaque (M = 5.98, SD = 1.84, N = 452) interventions, (𝜂𝑃2 = .04 [small], d = .38 [medium]).
Fig. 1. Judgments of trust in interventions, split by source (facet), congruency manipulation
(within-facet pairs) and genuine (white bars) vs fictitious (grey bars) nature. Error bars reflect
standard error.
There was a very small effect suggesting that the congruency manipulation affected
judgments of trust for genuine and fictitious interventions when comparing the High
Congruency Conditions with the Control Conditions (High Congruency, M = 6.31, SD = 1.81, N
= 884; Control Condition, M = 6.15, SD = 1.78, N = 842), (𝜂𝑃2 = .002 [very small], d = .09
[small]). A small effect revealed that for genuine interventions (white bars, left-hand facet,
Fig. 1), those in the High Congruency conditions judged scientists higher (M = 6.80, SD = 1.59,
22
N = 442) than in the Control conditions (M = 5.41, SD = 1.63, N = 421), (𝜂𝑃2 = .01 [small], d =
.24 [small]).
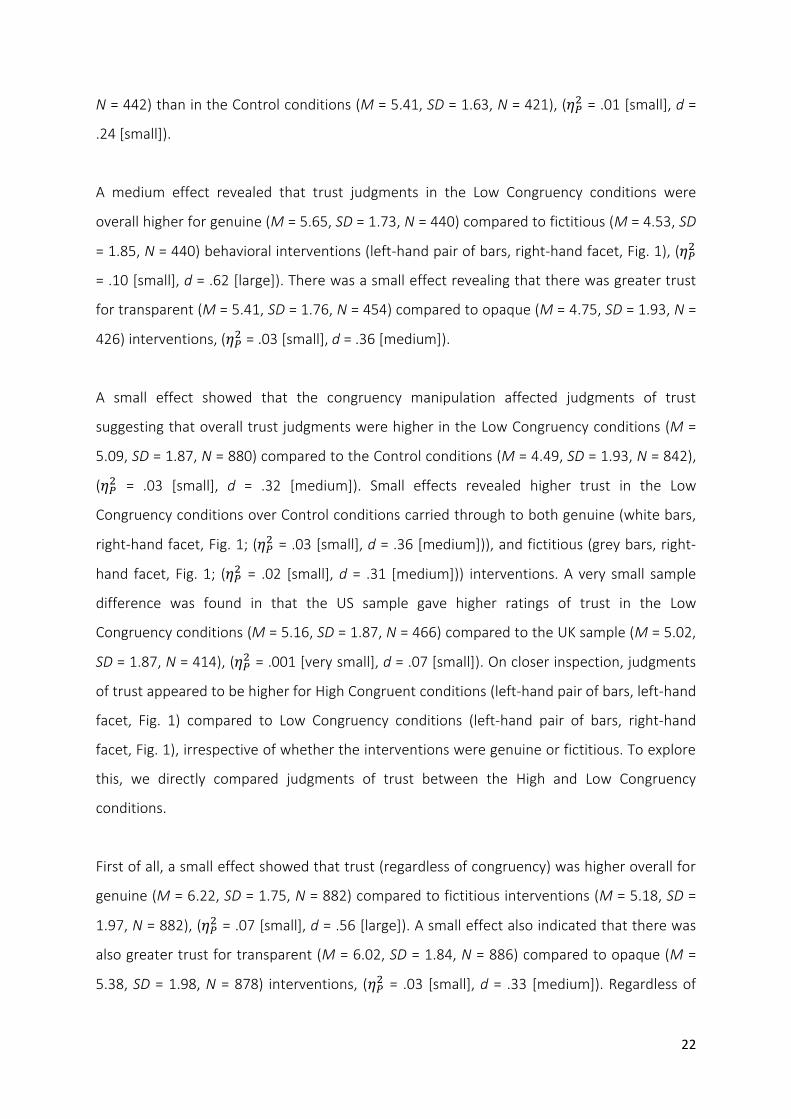
A medium effect revealed that trust judgments in the Low Congruency conditions were
overall higher for genuine (M = 5.65, SD = 1.73, N = 440) compared to fictitious (M = 4.53, SD
= 1.85, N = 440) behavioral interventions (left-hand pair of bars, right-hand facet, Fig. 1), (𝜂𝑃2
= .10 [small], d = .62 [large]). There was a small effect revealing that there was greater trust
for transparent (M = 5.41, SD = 1.76, N = 454) compared to opaque (M = 4.75, SD = 1.93, N =
426) interventions, (𝜂𝑃2 = .03 [small], d = .36 [medium]).
A small effect showed that the congruency manipulation affected judgments of trust
suggesting that overall trust judgments were higher in the Low Congruency conditions (M =
5.09, SD = 1.87, N = 880) compared to the Control conditions (M = 4.49, SD = 1.93, N = 842),
(𝜂𝑃2 = .03 [small], d = .32 [medium]). Small effects revealed higher trust in the Low
Congruency conditions over Control conditions carried through to both genuine (white bars,
right-hand facet, Fig. 1; (𝜂𝑃2 = .03 [small], d = .36 [medium])), and fictitious (grey bars, right-
hand facet, Fig. 1; (𝜂𝑃2 = .02 [small], d = .31 [medium])) interventions. A very small sample
difference was found in that the US sample gave higher ratings of trust in the Low
Congruency conditions (M = 5.16, SD = 1.87, N = 466) compared to the UK sample (M = 5.02,
SD = 1.87, N = 414), (𝜂𝑃2 = .001 [very small], d = .07 [small]). On closer inspection, judgments
of trust appeared to be higher for High Congruent conditions (left-hand pair of bars, left-hand
facet, Fig. 1) compared to Low Congruency conditions (left-hand pair of bars, right-hand
facet, Fig. 1), irrespective of whether the interventions were genuine or fictitious. To explore
this, we directly compared judgments of trust between the High and Low Congruency
conditions.
First of all, a small effect showed that trust (regardless of congruency) was higher overall for
genuine (M = 6.22, SD = 1.75, N = 882) compared to fictitious interventions (M = 5.18, SD =
1.97, N = 882), (𝜂𝑃2 = .07 [small], d = .56 [large]). A small effect also indicated that there was
also greater trust for transparent (M = 6.02, SD = 1.84, N = 886) compared to opaque (M =
5.38, SD = 1.98, N = 878) interventions, (𝜂𝑃2 = .03 [small], d = .33 [medium]). Regardless of

23
whether the intervention was genuine or fictitious, overall there was a medium effect
showed that there were higher judgments of trust in High Congruency conditions (M = 6.31,
SD = 1.81, N = 884) than Low Congruency conditions (M = 5.09, SD = 1.87, N = 880), (𝜂𝑃2 = .10
[small], d = .66 [large])). To explore just how much trust in High Congruency conditions was
greater than Low Congruency conditions, judgments for trust in High Congruency conditions
for fictitious interventions only (left-hand grey bar, left-hand facet, Fig. 1; M = 5.82, SD =
1.89, N = 442) were compared with judgments for trust in the Low Congruency conditions for
genuine interventions only (left-hand white bar, right-hand facet, Fig. 1; M = 5.65, SD = 1.73,
N = 440), showing a very small effect on trust judgments such that they were higher for High
Congruency conditions in this comparison, (𝜂𝑃2 = .002 [very small], d = .10 [small]). Lastly,
there was a very small effect showing that judgments of trust (collapsed across High and Low
Congruency conditions) were also impacted by manipulations regarding details of the
incentives (absent in Experiment 1a, present in Experiment 1b). More precisely, trust was
judged to be higher when incentive details were absent (Experiment 1a; M = 5.79, SD = 1.93,
N = 772) than present (Experiment 1b; M = 5.64, SD = 1.94, N = 992), (𝜂𝑃2 = .001 [very small],
d = .07 [small]). There were very small effects suggesting that when comparing the absence
(M = 5.19, SD = 1.60, N = 197) and presence (M = 5.02, SD = 1.60, N = 123) of conflicts of
interest on trust for High Congruency conditions, trust was lower in the presence of conflicts
of interest, (𝜂𝑃2 = .003 [very small], d = .11 [small]). The same pattern was found for Low
Congruency conditions, (𝜂𝑃2 = .002 [very small], d = .17 [small]).
Regression analyses conducted on the question probing trust in High and Low Congruency
conditions separately for genuine and fictitious behavioral interventions revealed an
association with Congruency, transparency, age and political affiliation, with an R2 ranging
between .07 to .13. For genuine interventions in the Low Congruency conditions, judgments
of trust decreased by .01 on the scale as age increased (decreased by .04 for fictitious
interventions) and decreased by .20 on the scale the more conservative leaning participants
were (decreased by .14 for fictitious interventions). A similar pattern was found for genuine
interventions for High Congruency conditions, judgments of trust decreased by .01 on the
scale as age increased (decreased by .03 for fictitious interventions) and decreased by .11 on
the scale the more conservative leaning participants were (decreased by .21 for fictitious
interventions).

24
Experiment 2
One of the critical manipulations introduced in Experiment 1a and 1b was the degree of
congruency between the domain of expertise (scientist, government working group) and the
behavioral interventions being proposed. In essence to ensure we found congruency effects,
which indeed we found in support of Hypothesis 4, 5 and 6, participants in the High
Congruency conditions were told that the agents were Top Scientists from prestigious
universities and those in the Low Congruency conditions were told that the agents were a
combination of special interest groups, members of the public and other stakeholders. Thus,
the High and Low congruency conditions varied not only in terms of the compatibility
between relevant expertise and the domain of science communication, but also the level of
prestige associated with the expert. This may have contributed to the effects reported in
Experiment 1a and 1b. To examine the robustness of the congruency effects, and to make
the High and Low congruency conditions more directly comparable, we replicated
Experiment 1b, but with minor changes to the instructions.
Methods
Design
To replicate the findings, and to address concerns regarding the potential confound of
prestige with congruency effects, some minor changes were made to the instructions, but
other than that the design of Experiment 2 was the same as Experiment 1b.
The critical difference was the change in instructions presented to the High and Low
Congruency conditions. The text presented in Experiment 1a and 1b for the High Congruency
conditions “In each case the work was based on studies over more than 8 years, involved at
least 3 Nobel prize winners and Professors working collaboratively from Universities including
Harvard, MIT, Oxford and Cambridge. Each study was based on at least 120 peer-reviewed
publications in the relevant leading academic journals.” was replaced with “In each case, the
Academic Working Group was made up of scientists with special knowledge and interest in
subjects related to the interventions”. The text presented in Experiment 1a and 1b for the
Low Congruency conditions “In each case the working groups were made up of politicians,

25
members of the relevant special interest groups and members of the public, and for each case
the recommendations were based on extended discussions with relevant stakeholders” was
replaced with “In each case, the Government working group was made up of politicians and
stakeholders with special knowledge and interest in subjects related to the interventions”.
Thus, the critical difference between the two conditions was the expertise, and prestige as
well as the relative fit between expertise and the domain of the science communication.
Experiment 2 was run in January 2018. In Experiment 2 participants (364 UK residents or
nationals, first language English (see Table 2)) and were randomly allocated to one of six
conditions based on two critical manipulations adopting the following design: 3 (Congruency
of source and content: High congruency (i.e. a scientific working group), Low congruency (a
government working group), Control) x 2 (Transparency: Transparent, Opaque) x 2
(Plausibility: High [Genuine interventions], Low [Fictitious interventions]). After they were
presented with 5 demographic questions, participants were then provided descriptions of 5
behavioral interventions, the presentation of which was randomized for each. For the 5
behavioral interventions (2 genuine, 3 fictitious) all participants were required to respond to
for judgment questions concerning: 1) the ease by which the way in which interventions
changed behavior could be identified, 2) plausibility of behavioral interventions, 3) the
ethicality of the interventions, and 4) trust in the agent that is proposing the interventions,
also presented in random order.
Results
For all analyses presented, as in the analysis of Experiments 1a and 1b, no observations were
excluded. To examine the impact of our manipulations on each DV, we conducted a 3
(Congruency of source and content: High congruency (Academic Working group), Low
congruency (Government working group), Control) x 2 (Transparency: Transparent, Opaque)
x 2 (Plausibility: High [Genuine interventions], Low [Fictitious interventions]) analysis of
variance, along with a series of pairwise comparisons.
Judgments of perceived transparency: Overall, the analyses showed a small effect suggesting
that perceived transparency was higher for transparent interventions (M = 66.647, SD =

26
21.97, N = 332) than opaque interventions (M = 61.14, SD = 23.32, N = 396), (𝜂𝑃2 = .01 [small],
d = .24 [small]), replicating Experiments 1a and 1b. There was a very small effect indicating
that the way in which behavior would change through the behavioural interventions was
perceived as higher for genuine (M = 65.44, SD = 21.39, N = 364) as compared to fictitious (M
= 61.86, SD = 24.14, N = 364) interventions, (𝜂𝑃2 = .006 [very small], d = .16 [small]).
Judgments of plausibility: In line with Experiments 1a and 1b, we found a large effect such
that genuine interventions (M = 54.74, SD = 21.09, N = 364) were judged more plausible than
fictitious interventions (M = 27.61, SD = 19.59, N = 364), (𝜂𝑃2 = .31 [large], d = 1.33 [large).
There was also a small effect showing that plausibility judgments were impacted by
transparency, with transparent interventions (M = 44.59, SD = 24.88, N = 332) judged more
plausible than opaque interventions (M = 38.31, SD = 23.74, N = 396), (𝜂𝑃2 = .02 [small], d =
.26 [small]). Also, there was a small effect revealing that interventions were judged as more
plausible in the High Congruent conditions (M = 43.41, SD = 24.17, N = 200), as compared to
the Low Congruent conditions (M = 38, SD = 24.42, N = 262), (𝜂𝑃2 = .01 [small], d = .22
[small]).
Ethicality judgments: Ethicality judgments were (as in Experiments 1a and 1b) based on a
scoring of the percentage of interventions judged as ethical for genuine interventions and
separately for fictitious interventions. Overall, there was a medium effect suggesting more
favourable ethical judgments for genuine (M = 87.09, SD = 24.58, N = 364) compared to
fictitious (M = 65.48, SD = 32.38, N = 364) interventions, (𝜂𝑃2 = .12 [medium], d = .76 [large]).
A small effect suggested that transparent interventions (M = 82.93, SD = 27.93, N = 332) were
judged more ethical than opaque (M = 70.71, SD = 31.81, N = 396), (𝜂𝑃2 = .04 [small], d = .41
[medium]). For genuine interventions, a small effect suggested that when comparing
ethicality judgments for transparent (M = 89.76, SD = 23.04, N = 166) and opaque versions
(M = 84.85, SD = 25.64, N = 198), the former was judged more ethical, (𝜂𝑃2 = .01 [small], d =
.20 [small]). Lastly, a small to medium effect for fictitious interventions, suggested that
ethicality judgments were also higher for transparent (M = 76.1, SD = 30.67, N = 166) than
opaque versions (M = 56.57, SD = 31.13, N = 198), (𝜂𝑃2 = .09 [small], d = .63 [large]).

27
Judgments of Trust: Following the protocol and rationale set out in the analysis of
Experiments 1a and 1b, separate analyses were conducted comparing those in the High
Congruency condition with the Control condition, and the Low Congruency Condition with
the Control condition. For the Control conditions, all participants were asked general trust
judgments of experts (i.e. Academic working group, Government working group) that could
have been involved in proposing the behavioral interventions. A medium effect for trust
judgments in High Congruency conditions suggested that trust was once again higher for
genuine (M = 6.25, SD = 1.56, N = 100) compared to fictitious (M = 5.00, SD = 1.58, N = 100)
interventions (left-hand pair of bars, left-hand facet, Fig. 2), (𝜂𝑃2 = .14 [medium], d = .79
[large]). In further replication of Experiments 1a and 1b, there was small effect showing that
there was greater trust in High Congruency conditions for transparent (M = 5.87, SD = 1.35, N
= 66) compared to opaque (M = 5.51, SD = 1.82, N = 134) interventions, (𝜂𝑃2 = .01 [small], d =
.23 [small]).
A small effect suggested that the congruency manipulation also impacted judgments of trust
for genuine and fictitious interventions when comparing High Congruency (M = 5.63, SD =
1.69, N = 200) to Control conditions (M = 6.00, SD = 1.72, N = 266), (𝜂𝑃2 = .01 [small], d = .22
[small]). Very small differences were found between High Congruency conditions and Control
conditions when conducing comparisons for genuine interventions only (white bars, left-hand
facet, Fig. 2), (𝜂𝑃2 = .007 [very small], d = .17 [small]), and again for fictitious interventions
only (grey bars, left-hand facet, Fig. 2), (𝜂𝑃2 = .02 [small], d = .30 [medium]).

28
Fig. 2. Judgments of trust in interventions, split by source (facet), congruency manipulation
(within-facet pairs) and genuine (white bars) vs fictitious (grey bars) nature. Error bars reflect
standard error.
As in Experiments 1a and 1b, the medium effect of trust in the Low Congruency conditions
suggested that trust was higher for genuine (M = 5.58, SD = 1.60, N = 131) compared to
fictitious (M = 4.45, SD = 1.76, N = 131) interventions (left-hand pair of bars, right-hand facet,
Fig. 2), (𝜂𝑃2 = .10 [medium], d = .67 [large]). There was also a small effect of trust in the Low
Congruency conditions indicating that trust was higher when proposing transparent (M =
5.30, SD = 1.77, N = 130) compared to opaque (M = 4.73, SD = 1.73, N = 132) interventions,
(𝜂𝑃2 = .03 [small], d = .32 [medium]).
Consistent with the pattern of findings in Experiment 1a and 1b, in Experiment 2 there was a
medium effect of Trust in the type of intervention, suggesting that trust was higher in
genuine (M = 5.87, SD = 1.61, N = 231) versus fictitious interventions (M = 4.69, SD = 1.70, N
= 231) regardless of congruency, (𝜂𝑃2 = .11 [medium], d = .71 [large]). Similarly, a small effect
indicated that trust was higher in experts when proposing transparent (M = 5.49, SD = 1.66, N
= 196) as compared to opaque (M = 5.12, SD = 1.82, N = 266) interventions, (𝜂𝑃2 = .01 [small],
d = .21 [small]). Also, in line with Experiments 1a and 1b, judgments of trust once again
appeared to be higher for High Congruent conditions (left-hand pair of bars, left-hand facet,
Fig. 2) compared to Low Congruency conditions (left-hand pair of bars, right-hand facet, Fig.
2). A small effect indicated that (irrespective of the genuine or fictitious nature of

29
interventions) High Congruency conditions (M = 5.62, SD = 1.69, N = 200) again showed
higher judgments of trust than the Low Congruency conditions (M = 5.01, SD = 1.77, N = 262),
(𝜂𝑃2 = .03 [small], d = .35 [medium]).
Adopting the same comparison as that conducted in Experiment 1, to examine just how
much trust is attributed in High Congruency conditions compared to Low Congruency
conditions, judgments for trust in High Congruency conditions for fictitious interventions only
(left-hand grey bar, left-hand facet, Fig. 2; M = 5.00, SD = 1.58, N = 100) were compared with
judgments for trust in the Low Congruency conditions for genuine interventions only (left-
hand white bar, right-hand facet, Fig. 2; M = 5.58, SD = 1.60, N = 131). This time the pattern
suggested that, unlike Experiment 1, in Experiment 2, a small effect on trust judgments
revealed that they were higher for Low Congruency conditions in this comparison, (𝜂𝑃2 = .03
[small], d = .36 [medium]).
General Discussion and Conclusions
The current set of experiments were designed to give a richer profile of public opinion
regarding nudge type behavioral interventions, and to extend the current work in this field.
We tested 7 hypotheses, 3 of which were generated from the Monitoring framework
(Botvinick, et al, 2001). In summary, we found evidence in line with Hypotheses 1-4. For all
four dependent measures (perceived transparency, plausibility, ethicality, trust) in all three
experiments the public consistently made more favourable judgments for transparent (small
effects), and genuine interventions (small to large effects) as compared with opaque and
fictitious interventions. The positive response to transparent behavioral interventions is
compatible with recent public survey studies examining the level of approval of different
types of nudges (Felsen, et al., 2013; Jung & Mellers, 2016; Reisch, & Sunstein, 2016; Reisch,
et al., 2016; Sunstein, 2016b). The evidence that genuine over fictitious interventions were
considered more favorably, is a novel finding. It indicates that the public clearly show
sensitivity to the plausibility of nudges when making their own evaluations of them,
especially when it comes to how much they trust them, and how ethical they consider them
to be.

30
Hypotheses 5-7 concerned the congruency manipulation and its impact on judgments of
trust. Recall, that this measure assessed the extent to which the public judged the extent to
which they trusted that the agent proposing the intervention had the public’s interest.
Experiments 1a, 1b and Experiment 2 provided support for Hypothesis 5, suggesting that in
High congruency conditions trust was higher compared to Low congruency conditions (small
to medium effects); also, judgments of trust were higher in High congruency conditions
relative to the Control conditions (very small to small effects). It is also worth highlighting
that in Experiment 2, the only difference between High and Low congruency was the
description of the expert (i.e. Academic working group, Government working group). The
description of the level of expertise was matched in both groups, so any differences between
High and Low congruency conditions regarding judgments of trust were entirely due to
attributions that the public made about the fit between expertise and the content of the
scientific communication.
In line with Hypothesis 6, in Experiment 1a, 1b, and 2, trust was higher in High congruency
compared the Low congruency conditions regardless of whether the behavioral interventions
were genuine or not (i.e. plausible vs. implausible) (small to medium effects). In Experiment
1a and 1b the impact of congruency was such that trust was higher in High Congruency
conditions for fictitious interventions when compared to trust in Low Congruency conditions
for genuine interventions (very small effect). Experiment 2 addressed possible confounds in
the details provided to participants by eliminating prestige as a possible factor. The notable
aforementioned comparison in Experiment 1a and 1b, was not replicated, instead trust was
higher in the Low Congruency conditions for genuine interventions, compared to the High
Congruency conditions for fictitious interventions (small effect).
Hypothesis 7 was tested in Experiment 1a and 1b, for which there was very limited evidential
support. There was some impact of conflict of interests on trust judgments overall (very small
effects), but the impact was even smaller on judgments of trust as a factor of congruency.
Conflicts of interest appeared to have some general impact on ethicality judgments (very
small effects). In particular, in the presence of conflicts of interest, fictitious interventions
that were opaque were judged highly ethically problematic compared to transparent versions
(large effects). In the absence of conflicts of interest, again for fictitious interventions that
31
were opaque, ethicality judgments were much harsher than transparent versions (medium
effects). By contrast any differences between transparent and opaque nudge for genuine
interventions in the presence or absence of conflicts of interest were less pronounced (small
effects).
Turning to individual differences, when examined in Experiment 1a and 1b, regression
analyses revealed that trust in High and Low congruent conditions were much lower in older
age groups. The same pattern was found for those that identified themselves as affiliated
with very conservative politics, consistent with previous evidence (Gauchat, 2012;
Lewandowsky & Oberauer, 2016). There were few noteworthy sample differences detected
in our findings. For plausibility judgments and ethicality judgments the evidence suggested
that overall (including both genuine and fictitious intervention) the US judged the behavioral
interventions as more plausible and more ethical than the UK sample (very small to small
effects). Previous studies that have examined public opinion in European countries have
shown that the UK show high approval ratings for a range of nudges and are at comparable
to the levels shown in US samples (Reisch, & Sunstein, 2016). However, Reisch and Sunstein’s
(2016) survey, and other similar surveys, have not examined judgments of plausibility or
ethicality along the lines of the current set of experiments. Therefore, it is hard to infer the
extent to which the present findings depart from those of previous surveys.
What is striking is that across both samples, in all three experiments, the basis on which the
four judgments reflect differentially sensitivity to three different factors (i.e. the behavioral
intervention itself, congruency, conflicts of interest). Perceived transparency judgments
tended to be driven by details of the intervention itself. Detailed of potential conflicts of
interest tended to impact, to a small degree, judgments regarding trust and ethicality. For
plausibility and trust congruency was a salient basis on which judgments were made. In the
latter case, although the effects were very small, in Experiment 1 High congruency was
enough to inflate judgments of trust to the extent that, even for fictitious nudges, judgments
were higher than for genuine nudges proposed in the Low congruency conditions. Does this
mean that the credibility of the expert overshadowed attention towards the content of the
scientific claims being made? It does appear that congruency effects, as predicted by the
Monitoring hypothesis account for the latter finding, but it appears that the public have a far

32
more nuanced way of using different cues to inform their attitudes of behavioral
interventions designed to target social policy issues.
There is much work in the social sciences suggesting that the public’s evaluation of the
credibility of scientific claims made by scientists themselves is strongly influenced by factors
other than the merit of the specific claims being made. So much so, that the claims can be
publicly devalued and easily undermined if attributes of the scientific authority making the
claims conflict with those of the individual (e.g. political, gender, social identity) (Hagman et
al., 2015; Jung & Mellers, 2016; Morton, et al., 2006; Nauroth, et al., 2014). In the present set
of experiments we show the phenomena operating in a different direction. When looking at
the critical differences between the two experimental conditions (High Congruency, Low
Congruency), we hypothesised that the likely external factor that influenced judgments
regarding the plausibility of the behavioral interventions was the match between the
expertise of the source and the topic of the science communication. Clearly the source of the
communication is a critical factor (along with the match with the domain of interest being
communicated) that boosted judgments directly concerning the expert themselves
(judgment of trust), but also judgments which specifically concerned the content of the
claims (plausibility judgments) the agents were making.
What is also unusual is that previous psychological research shows that public opinion
appears to be more negative with respect to social scientific recommendations that impinge
on lifestyle choices (Alemanno, 2012; Diepeveen et al, 2013; Lewandowsky & Oberauer,
2016). Given the set-up of the present study, public opinion ought to have reflected a similar
pattern of results. However, in contrast, the findings from the present set of experiments
suggest that, even when behavioral interventions are designed to curb behaviors, the public
have a strong positive disposition towards scientists making those proposals over the
government. Though one critical difference between previous findings reported here and the
present set of experiments is that in the present experiments congruency between source
credibility (i.e. expertise) and the topic of social science communication was manipulated.
While our finding presents a positive picture of the trust the public have in scientists in the
domain of social policy interventions, it also suggests that the public have a nuanced way of

33
assessing behavioral intervention, which involves recruitment of different sources of
information that gain relevance depending on the question probing public opinion in surveys.
This is certainly important when it comes to attempting to gauge public opinion on matters
concerning social scientific policy claims, as well as other scientific findings that inform social
policy claims and behavioral interventions such as nudges. In other words, the conclusions
that can be drawn regarding positive or negative public attitudes towards scientifically
informed social policy communication is going to depend largely on the way in which the
questions in the surveys are couched, and the kind of information that be used to assess the
credibility of the source of the communication.
Before summing up, we draw the reader’s attention to the fact that we used a large sample
size in our experiments. What implications does this have for the current research issues we
face in the social sciences? The large sample size should give some confidence to the research
community that the sample means presented in here are close, that is, they can be trusted as
better than usual estimates of corresponding population means (for a formal definition of
confidence and close see Trafimow & MacDonald, 2017, and for a discussion of confidence
also see Trafimow, 2017); though a further test of this would be through replication. On this
point, again the large sample size should also give the reader reasonable confidence that our
findings would also stand up to replication attempts. This is on condition that, as Trafimow (in
press) proposes, a successful replication requires that the original study includes a large
enough sample size that the sample means are close to the corresponding population means,
and the same goes for the replication study. What we hope to highlight here is that our
findings, along with our efforts to replicate them, provide the platform for further
investigation for other researchers interested in a topic area that is of growing interest to a
number of disciplines.
As we discussed at the start of this article, our set of experiments were motived to by a need
to better understand public opinion with respect to social policy interventions such as
nudges, and to investigate the impact of expertise on public perception of nudges. To this
end we show that source credibility is a highly influential factor, but in conjunction with the
level of compatibility with the specific domain of scientific research being communicated. So,
it is fair to say that our findings show that scientists are more trusted and that this may likely

34
influence the more favourable judgments that the public made about the nudges they were
presented. But this is largely driven by the fact that there was high compatibility between the
expertise and the scientific topic being proposed (actual and perceived). Further work is
needed to examine the extent to which the congruency effect is specific to a particular area
of science or generalizes to any type of expert and their mapping to the topic they are
communicating. Without evidence to the contrary, we would predict that congruency effects
of the kind we have shown ought to generalize to any domain of expertise.
In addition, the present experiments were also motivated to contribute to discussions
regarding how people navigate the science communication landscape (Strong, 2017). What
we show is that the public has a highly nuanced way of navigating science communication,
and they rely on different information for different levels of scrutiny and judgment about the
communication they are processing. When it comes to ethics, the public care about the
potential conflicts of interest of the communicator. When it comes to trust and plausibility of
the claims being made, the complement between the communicator and the topic of
communication is influential. Taken together these findings have implications for public
understanding of science. We show that the public will consider the source, the context that
the communication refers to and what is being asked of them as a way to determine their
receptiveness of the communication.
Acknowledgments This work was supported by the ERC (ERC-2013-AdG339182-BAYES_KNOWLEDGE) and
Leverhulme Trust under Grant RPG-2016-118 CAUSAL-DYNAMICS

35
References Agena (2017), ‘AgenaRisk Software’, http://www.agenarisk
Alemanno, A. (2012), ‘Nudging smokers - The behavioural turn of tobacco risk regulation’,
European Journal of Risk Regulation, 1, 32-42.
Amos, C., Holmes, G., & Strutton, D. (2008). Exploring the relationship between celebrity
endorser effects and advertising effectiveness: A quantitative synthesis of effect
size. International Journal of Advertising, 27(2), 209-234.
Arad, A., & Rubinstein, A. (2015), ‘The People’s Perspective on Libertarian-Paternalistic
Policies’, Unpublished Manuscript. http://arielrubinstein. tau. ac. il/papers/LP. pdf.
Åvitsland, A., Solbraa, A. K., & Riiser, A. (2017). Promoting workplace stair climbing:
sometimes, not interfering is the best. Archives of public health, 75(1), 2.
Bakeman, R. (2005) Recommended effect size statistics for repeated measure
designs. Behavior Research Methods, 37, 379-384. doi:10.3758/BF03192707;
Barlett, J. E., Kotrlik, J. W., & Higgins, C. C. (2001), ‘Organizational research: Determining appropriate sample size in survey research’, Information technology, learning, and performance Journal, 19, 43-50.
BAYES-KNOWLEDGE. (2017), ERC project ERC-2013-AdG339182 http://bayes-
knowledge.com/Models/scientific_plausibility.cmp.
Benartzi, S., Beshears, J., Milkman, K. L., Sunstein, C. R., Thaler, R. H., Shankar, M., Tucker-
Ray, W., Congdon, W., & Galing, S. (2017), ‘Should Governments Invest More in
Nudging?’. Psychological Science, 1-15.
Berman, E. R., & Johnson, R. K. (2015), ‘The unintended consequences of changes in beverage
options and the removal of bottled water on a university campus’, American journal of
public health, 105, 1404-1408.
Brossard, D. (2013). New media landscapes and the science information
consumer. Proceedings of the National Academy of Sciences, 110(Supplement 3),
14096-14101.
Botvinick, M. M., Braver, T. S., Barch, D. M., Carter, C. S., & Cohen, J. D. (2001). Conflict
monitoring and cognitive control. Psychological review, 108(3), 624-652.
Cho, M. K., Shohara, R., Schissel, A., & Rennie, D. (2000). Policies on faculty conflicts of
interest at US universities. Jama, 284(17), 2203-2208.

36
Critchley, C. R. (2008), ‘Public opinion and trust in scientists: The role of the research context,
and the perceived motivation of stem cell researchers’, Public Understanding of
Science, 17, 309-327.
Curchin, K. (2017), ‘Using Behavioural Insights to Argue for a Stronger Social Safety Net:
Beyond Libertarian Paternalism’, Journal of Social Policy, 46, 231-249.
Dana, J., & Loewenstein, G. (2003). A social science perspective on gifts to physicians from
industry. JAMA, 290, 252–255
Diepeveen, S., Ling, T., Suhrcke, M., Roland, M., & Marteau, T. M. (2013), ‘Public acceptability
of government intervention to change health-related behaviours: a systematic review
and narrative synthesis’, BMC Public Health, 13, 1-11.
Drescher, L. S., Roosen, J., & Marette, S. (2014). The effects of traffic light labels and
involvement on consumer choices for food and financial products. International journal
of consumer studies, 38(3), 217-227.
Elliott, K. C., & Resnik, D. B. (2014). Science, policy, and the transparency of
values. Environmental health perspectives, 122(7), 647-650.
Ericsson, K. A., & Lehmann, A. C. (1996). Expert and exceptional performance: Evidence of
maximal adaptation to task constraints. Annual review of psychology, 47(1), 273-305.
Felsen, G., Castelo, N., & Reiner, P. B. (2013), ‘Decisional enhancement and autonomy: public
attitudes towards overt and covert nudges’, Judgment and Decision Making, 8, 202-
213.
Fenton, N. E. & Neil, M. (2012), Risk Assessment and Decision Analysis with Bayesian
Networks, CRC Press: UK.
Fleck, N., Korchia, M., & Le Roy, I. (2012). Celebrities in advertising: looking for congruence or
likability?. Psychology & Marketing, 29(9), 651-662.
Gauchat, G. (2012), ‘Politicization of Science in the Public Sphere: A Study of Public Trust in
the United States, 1974 to 2010’, American Sociological Review, 77, 167-187.
Grüne-Yanoff, T., & Hertwig, R. (2016), ‘Nudge versus boost: how coherent are policy and
theory?’, Minds and Machines, 26, 149-183.
Hagman, W., Andersson, D., Västfjäll, D., Tinghög, G. (2015), ‘Public Views on Policies
Involving Nudges’, Review of Philosophy and Psychology, 6, 439–453.
Hedlin, S., & Sunstein, C. R. (2016), ‘Does Active Choosing Promote Green Energy Use:
Experimental Evidence’, Ecology Law Quarterly, 43, 107-142.
Hmielowski, J., Feldman, L., Myers, T., Leiserowitz, A., & Maibach, E. (2014), ‘An attack on
science? Media use, trust in scientists, and perceptions of global warming’, Public
Understanding of Science, 23, 866-883.

37
House of Lords. (2011). Science and Technology Select Committee. ‘2nd Report of Session
2010–12: Behaviour Change’ Authority of the House of Lords, London.
Hovland, C., Janis, I., & Kelley, H. (1953). Communication andpersuasion. New Haven, CT: Yale
University Press
Ipsos MORI (2016). ‘Politicians are still trusted less than estate agents, journalists and
bankers’, retrieved from https://www.ipsos-
mori.com/researchpublications/researcharchive/3685/Politicians-are-still-trusted-less-
than-estate-agents-journalists-and-bankers.aspx [accessed 11 July 2016].
Jarosz, A. F., & Wiley, J. (2014), ‘What are the odds? A practical guide to computing and
reporting Bayes factors’, The Journal of Problem Solving, 7, 2-9.
Jeffreys, H. (1961), Theory of probability. Oxford: Oxford University Press: UK.
Johnson, E. J., & Goldstein, D. (2003),‘Do defaults save lives?’, Science, 302, 1338-1339.
Jung, J. Y., & Mellers, B. A. M. (2016), ‘American attitudes toward nudges’, Judgment and
Decision Making, 11, 62-74.
Kamins, M. A., & Gupta, K. (1994). Congruence between spokesperson and product type: A
matchup hypothesis perspective. Psychology & Marketing, 11(6), 569-586.
Kerr, J., Eves, F., & Carroll, D. (2001). Can posters prompt stair use in a worksite
environment?. Journal of Occupational Health, 43(4), 205-207.
Lang, J. T., & Hallman, W. K. (2005),‘Who does the public trust? The case of genetically
modified food in the United States’, Risk Analysis, 25, 1241-1252.
Lewandowsky, S., Ecker, U. K., Seifert, C. M., Schwarz, N., & Cook, J. (2012). Misinformation
and its correction: Continued influence and successful debiasing. Psychological Science
in the Public Interest, 13(3), 106-131.
Lewandowsky, S., & Oberauer, K. (2016), ‘Motivated rejection of science’, Current Directions
in Psychological Science, 25, 217-222.
Löfstedt, R. E. (2003). Science communication and the Swedish acrylamide" alarm". Journal of
Health Communication, 8(5), 407-432.
Löfstedt, R. (2005). Risk management in post-trust societies. New York: Palgrave Macmillan.
Lupia, A. (2013). Communicating science in politicized environments. Proceedings of the
National Academy of Sciences, 110(Supplement 3), 14048-14054.
Marshall, A. L , Bauman, A. E., Patch, C., Wilson, J., & Chen, J. (2002). Can motivational signs
prompt increases in incidental physical activity in an Australian health-care facility?
Health Education Research.17, 743–9.
Marques, M. D., Critchley, C. R., & Walshe, J. (2015), ‘Attitudes to genetically modified food
over time: How trust in organizations and the media cycle predict support’, Public
Understanding of Science, 24, 601-618.

38
Marteau, T. M. (2017), ‘Towards environmentally sustainable human behaviour: targeting
non-conscious and conscious processes for effective and acceptable policies’,
Philosophical Transactions of the Royal Society A, 375, 20160371.
Marteau, T., M., Ogilvie, D., Roland, M., Suhrcke, M., & Kelly, M. (2011), ‘Judging nudging: can
nudging improve population health?’, British Medical Journal, 342, 263–265.
Mazzocchi, M, Cagnone, S.,Bech-Larsen, T., Niedźwiedzka, B.,Saba, A., Shankar, B., Verbeke,
W., & Traill, B. (2015), ‘What is the public appetite for healthy eating policies? Evidence
from a cross-European survey’, Health Economics, Policy and Law, 10, 3, 267-292.
McComas, K. A. (2008). Session 5: Nutrition communication The role of trust in health
communication and the effect of conflicts of interest among scientists: Symposium on
‘The challenge of translating nutrition research into public health
nutrition’. Proceedings of the Nutrition Society, 67(4), 428-436.
McGuire, W. J. (1978). An information-processing model of advertising effectiveness. In H. L.
Davis & A. J. Silk (Eds.), Behavioral and management sciences in marketing (pp. 156-
180). New York, NY Wiley.
McKnight, J., & Coronel, J. C. (2017). Evaluating Scientists as Sources of Science Information:
Evidence From Eye Movements. Journal of Communication, 67(4), 565-585.
Michie, S., van Stralen, M. M., & West, R. (2011), ‘The behaviour change wheel: A new
method for characterising and designing behaviour change interventions’,
Implementation Science, 6, 42.
Morton, T. A., Haslam, S. A., Postmes, T., & Ryan, M. K. (2006), ‘We Value What Values Us:
The Appeal of Identity‐Affirming Science’, Political Psychology, 27, 823-838.
Nauroth, P., Gollwitzer, M., Bender, J., & Rothmund, T. (2014), ‘Gamers against science: The
case of the violent video games debate’, European Journal of Social Psychology, 44,
104-116.
Nisbett, R. E., & Wilson, T. D. (1977). The halo effect: Evidence for unconscious alteration of
judgments. Journal of personality and social psychology, 35(4), 250-256.
Notebaert, W., Gevers, W., Verbruggen, F., & Liefooghe, B. (2006). Top-down and bottom-up
sequential modulations of congruency effects. Psychonomic bulletin & review, 13(1),
112-117.
Oliver, A. (2013), ‘From nudging to budging: using behavioural economics to inform public
sector policy’, Journal of Social Policy, 42, 685-700.
Oreskes, N., & Conway, E. M. (2011), Merchants of doubt: How a handful of scientists
obscured the truth on issues from tobacco smoke to global warming, Bloomsbury
Publishing: USA.
Osman, M. (2016), ‘Nudge: How Far Have We Come?’, Œconomia. History, Methodology,
Philosophy, 6–4, 557–570.

39
Petty, R. E., & Cacioppo, J. T. (1986). The elaboration likelihood model of
persuasion. Advances in experimental social psychology, 19, 123-205.
Pornpitakpan, C. (2004). The persuasiveness of source credibility: A critical review of five
decades' evidence. Journal of applied social psychology, 34(2), 243-281.
Reisch, L. A., & Sunstein, C. R. (2016), ‘Do Europeans like nudges?’, Judgment and Decision
Making, 11, 310-325.
Reisch, L., Sunstein, C. R., & Gwozdz, W. (2016), ‘Better Than A Whip? European Attitudes
Toward Health Nudges’, Food Policy, 69, 1-10.
Rosenstock, L., & Lee, L. J. (2002). Attacks on science: the risks to evidence-based
policy. American Journal of Public Health, 92(1), 14-18.
Sniezek, J. A., & Van Swol, L. M. (2001). Trust, confidence, and expertise in a judge-advisor
system. Organizational behavior and human decision processes, 84(2), 288-307.
Strong, S. I. (2017), ‘Alternative Facts and the Post-Truth Society: Meeting the Challenge’,
University of Pennsylvania Law Review Online, 165, 137-147.
Stroop, J. R. (1935). Studies of interference in serial verbal reactions. Journal of experimental
psychology, 18(6), 643-662.
Sturgis, P., & Allum, N. (2004), ‘Science in society: re-evaluating the deficit model of public
attitudes’,Public understanding of science, 13, 55-74.
Sunstein, C. R. (2014),Simpler: The future of government. Simon and Schuster: USA.
Sunstein, C. R. (2016a). The ethics of influence: Government in the age of behavioral science.
Cambridge University Press: USA.
Sunstein, C. R. (2016b), ‘People prefer system 2 nudges (kind of)’, Duke Law Journal, 66, 121-
168.
Sunstein, C. R., Reisch, L. A., & Rauber, J. (2017), ‘A World-Wide Consensus on Nudging? Not
Quite, But Almost’ SSRN https://ssrn.com/abstract=2955693.
http://dx.doi.org/10.2139/ssrn.2955693
Teeny, J., Briñol, P., & Petty, R. E. (2016). The elaboration likelihood model. Routledge
International Handbook of Consumer Psychology, 390.
Thorndike, E. L A constant error in psychological ratings. Journal of Applied Psychology, 1920,
4, 25-29.
Trafimow, D. (in press). An A Priori Solution to the Replication Crisis. Philosophical Psychology.
Trafimow, D. (2017). Using the coefficient of confidence to make the philosophical switch
from a posteriori to a priori inferential statistics. Educational and Psychological
Measurement, 77, 831-854.

40
Trafimow, D., & MacDonald, J. A. (2017). Performing inferential statistics prior to data
collection. Educational and Psychological Measurement, 77, 204-219.
Wagenmakers, E. J. (2007), ‘A practical solution to the pervasive problems of p values’,
Psychonomic Bulletin & Review, 14, 779-804.
Winter, S., & Krämer, N. C. (2012). Selecting science information in Web 2.0: How source
cues, message sidedness, and need for cognition influence users' exposure to blog
posts. Journal of Computer‐Mediated Communication, 18(1), 80-96.