who gets swindled in ponzi schemes? · pdf filewho gets swindled in ponzi schemes? by stephen...
TRANSCRIPT
Who Gets Swindled in Ponzi Schemes?
by
Stephen Deason
Shivaram Rajgopal*
Gregory Waymire
and
Roger White
Goizueta Business School Emory University
1300 Clifton Road NE, Atlanta, GA 30030
May 12, 2015 Comments welcome
*Corresponding author. Email: [email protected]. For helpful comments, we thank workshop participants at Chapman University, Tulane University, and the University of California at Irvine. We appreciate research assistance by Matsunao Masuda, Kelly Meric, Anton Ouzounov, Esha Chandra, Chenlin Ding, Xinyi Liu, Ting Luo, Patrick Ryan, Kyung Hwan Shin, Yang Song, Xi Wang, Ge Wu, Hua Xu, and Monica Yang. We also gratefully acknowledge expert legal assistance from Emory University Law Librarian Thomas Sneed, J.D. We acknowledge financial assistance from our respective schools. All errors are ours alone.
ABSTRACT
Extant knowledge of Ponzi schemes in the accounting and finance literature is mainly anecdotal. The consequence of this is that it is difficult to know what, if anything, can be done to deter these frauds. We seek to fill part of our knowledge gap about Ponzi schemes by providing large-scale evidence based on a sample of 376 Ponzi schemes prosecuted by the SEC between 1988 and 2012. Our evidence indicates that the majority of SEC-prosecuted schemes involve sums that are much lower than those in the highly visible frauds perpetrated by Bernard Madoff and Allen Stanford. The mean duration of Ponzi schemes in our sample is about four years and these schemes have a mean (median) average per-investor investment of around $431,700 ($87,800). Ponzi schemes are more likely to occur in U.S. states where the citizenry is inherently more trusting and where they have fewer alternate opportunities for local investment. The ex post success of a Ponzi scheme (as measured by duration, total amount invested, or the percentage cut to perpetrators) tends to be greater when an affinity link is present, the elderly are targeted, and whether the perpetrator provides financial incentives to third-parties to recruit victims into the scheme. JEL codes: D14, D19, G18 Keywords: Ponzi scheme, trust, descriptive, victims, SEC
1
INTRODUCTION
“The crucial puzzle of those early days – the one that would shape public reaction for months – was this: Who were Madoff’s victims? Aside from some worthy charitable and cultural institutions, were they just a few movie stars, plutocrats, and hedge funds, each mourning a $100 million loss? Or had tens of thousands of ordinary middle-class families also lost hundreds of thousands of dollars in retirement savings?” Diana Henriques, The Wizard of Lies (2012, 215) “When we think of the anguish of the sufferers, we take part with them more earnestly against their oppressors; we enter with more eagerness into all their schemes of vengeance, and feel ourselves every moment wreaking, in imagination, upon such violators of the laws of society, that punishment which our sympathetick indignation tells us is due to their crimes.” Adam Smith, The Theory of Moral Sentiments (1759, Vol. I, Pt. II, Section I)
Bernard Madoff was arrested on December 11, 2008 after confessing to his family that
his investment business was an “enormous lie… ‘a giant Ponzi scheme’” (Henriques 2012, 8).
The judge imposed a sentence of 150 years in prison in part because he was moved by a letter
that described “how Madoff conned an 86-year-old widow by putting his arm around her ‘and in
a kindly manner told her not to worry, that the money is safe with me’” (“Bye, Bye Bernie: Ponzi
King Madoff sentenced to 150 years,” New York Daily News, June 29, 2009). Madoff’s harsh
sentence suggests that a thief’s punishment depends on whether his theft evokes what Adam
Smith (1759) referred to as moral sentiments – embezzling a widow’s last penny is
fundamentally different than stealing from a wealthy man to feed a starving child.
More broadly, there is likely considerable social value in economic institutions that
effectively penalize and deter frauds like Madoff’s Ponzi scheme. However, building effective
mechanisms to deter Ponzi schemes requires that we understand how Ponzi schemers identify
their victims, secure their trust, and convince them to invest large amounts in the fraud.
Unfortunately, our knowledge of Ponzi schemes is based largely on anecdotes provided by a few
sensational cases like Madoff or the 1920 scheme for which the crime is named (Henriques
2
2012; Zuckoff 2006). Our contribution is to provide evidence on the “who” and “how” of Ponzi
schemes using a broader sample of such frauds.
A pure Ponzi scheme is an investment fund where the fund originator never makes a
legitimate investment in assets that produce income.1 Thus, “dividends” are paid to existing
investors out of the capital contributions of new investors. The survival of a Ponzi scheme
depends on the schemer’s ability to attract new investors who make sufficiently large
contributions to sustain high payouts to existing investors. These payouts then can serve as a
vehicle to market the fraudulent scheme as a desirable investment. The main constraint faced by
a would-be Ponzi schemer is that a legal authority like the SEC must remain unaware of the
scheme while investors are deceived as to the schemer’s true intentions.
A Ponzi schemer is a criminal entrepreneur who seeks to gain the trust of his victims
through deception. The trust of victims is based on a false belief that income is being earned as a
result of investment in legitimate assets that actually exist. This false belief is typically sustained
through a combination of large and/or stable returns to investors and information manipulation
by the schemer. We expect that a Ponzi scheme’s ex post success (as measured by its size,
duration, and amounts taken by the schemer) will be positively associated with whether the
perpetrator and his victim share an affinity link through religion or ethnicity, or whether the
victim is a person like a senior citizen who might more prone to believing a schemer’s “tall
tales.” Successful Ponzi schemers will build social connections with their victims using
marketing techniques that can entice victims while also concealing the scheme from legal
authorities.
1 Ponzi schemes have long existed; such frauds were referred to as “Rob Peter to Pay Paul” schemes before Charles Ponzi’s fraud (Zuckoff 2006).
3
Our sample includes 376 SEC-prosecuted Ponzi schemes during the period 1988-2012.
These cases represent material frauds –The mean total funds invested in our sample Ponzi
schemes is $208 million, the average Ponzi scheme in our sample lasts about 4.25 years, and the
average Ponzi perpetrator takes about 29% of the funds raised as personal compensation. Our
analysis also suggests the following about Ponzi schemes:
1. Size. Most Ponzi schemes are small in relation to widely known schemes such as those of Bernard Madoff and Allen Stanford, both of which totaled in the billions. In contrast, the median size of schemes in our sample is $14.7 million total invested and the first quartile was just over $5 million. The median number of investors in our sample schemes is 150, and investors in our sample Ponzi schemes are investing $431,200 ($87,800) at the mean (median). On all measures of size, the distribution is heavily right-skewed, which suggests that a small number of very large cases affect the distribution. 2. Perpetrators and victims. Males acting as solo operators perpetrate most of the Ponzi schemes in our sample. The most frequent type of victim mentioned by the SEC is the elderly. The most frequent type of affinity link cited by the SEC is family and friends with a common religion coming in a close second. 3. Marketing. Surprisingly, many Ponzi schemes are marketed in visible ways – e.g., through a website or mass media like newspapers. Ponzi schemers also frequently provide incentive payments (e.g., commissions) to third parties to obtain victims. The returns promised by Ponzi schemers to their victims are sizable. It is typical for these promises to be communicated as a range. The mean (median) of the minimum annual return promised was 111% (12%), and the mean (median) of the maximum annual return promised was 437% (24.5%).
4. Victim trust. Patterns in the location, duration, size, and amounts stolen in Ponzi schemes suggest that building false trust is a major focus of a Ponzi schemer. Ponzi schemes are significantly more frequent in U. S. states where citizens are known to place greater trust in strangers. Perhaps for the same reason, Ponzi schemes where an affinity link is present or the SEC cites the elderly as prominent in the victim class tend to last longer. Perhaps because social distance makes it harder to build trust, schemes marketed using mass media also have significantly shorter duration. The use of commissioned recruiters and referral rewards to identify victims is the most important variable in explaining the amount of funds raised in a Ponzi scheme. 5. Alternate investment opportunities. Both institutional and individual investors prefer to invest locally. We find that more Ponzi schemes emerge in states with fewer conventional, local investment opportunities. When few local companies are publically traded, and when local governments have little debt (few local government bonds available), investors examine alternate investment strategies, which likely leads to more Ponzi schemes.
4
Some caveats about the limitations of our data are warranted at the outset. The evidence
we provide is based on information in SEC court filings and press releases. As such, we are
examining variables that are measured with error due to incomplete or imperfect information.
For example, the total funds invested in a given Ponzi scheme may be unknowable because some
victims do not want to come forward for various reasons. Second, the information may be
incomplete or even biased if SEC officials’ strategic incentives influence what information they
seek out and present to the courts and public.
The rest of the paper is organized as follows. Sample selection and data collection are
described in section 2. The incidence and timing of the Ponzi schemes in our sample are
described in section 3. Our evidence on victim characteristics, marketing methods, and factors
correlated with Ponzi scheme frequency, duration, and size are reported in section 4. A final
section summarizes our findings and their implications.
SAMPLE SELECTION AND DATA
Our sample is comprised of 376 Ponzi or Pyramid schemes prosecuted by the Securities
and Exchange Commission (SEC) during the period from January 1988 to August 2012. We
date the end of each case as the first SEC litigation filing date, which typically is a complaint in a
federal court seeking an injunction to halt the scheme and freeze the fraudster’s assets (Phelps
and Rhodes 2012, 21-10 – 21-18). The SEC can initiate legal action in a Ponzi scheme case
under the Securities Act of 1933, the Securities and Exchange Act of 1934, and the Investment
Advisors Act of 1940.2
2 Ponzi cases can also involve government agencies beyond the SEC such as the Internal Revenue Service, Federal Trade Commission, Federal Bureau of Investigation, and State and Federal Attorneys General.
5
We use SEC-prosecuted cases for our sample because it is difficult in some cases to
identify a Ponzi scheme as distinct from other forms of financial fraud. Given that the SEC’s
actions in seeking an injunction to stop a Ponzi scheme perpetrator must be justified in court, it
seems likely they would develop a more precise definition of the behavior they were seeking to
curtail through legal action (SEC 2014a).3 We construct our sample using the SEC website’s
(http://www.sec.gov) advanced search function and corroborate the case data using LexisNexis
court filings. At the same time, we recognize that the selection of our sample based on SEC cases
can omit some cases that others believe to be Ponzi schemes.4
The first step in constructing our sample was to search the SEC website using the terms
“ponzi scheme” or “pyramid scheme.” This identified 1,425 separate litigation case filings as of
August 25, 2012, as noted in Table 1.5 Nine hundred sixty of the 1,425 initial observations
reference the same case and an additional 57 were subsumed into larger cases. We combine these
observations and treat each case as a single observation within our sample. From this revised
sample of 408 cases, we next removed an additional 25 cases because closer examination
indicated they were neither Ponzi nor Pyramid schemes.6 Finally, we deleted seven cases from
3 The SEC (2014a) defines a Ponzi scheme as: “(A)n investment fraud that involves the payment of purported returns to existing investors from funds contributed by new investors. Ponzi scheme organizers often solicit new investors by promising to invest funds in opportunities claimed to generate high returns with little or no risk. In many Ponzi schemes, the fraudsters focus on attracting new money to make promised payments to earlier-stage investors to create the false appearance that investors are profiting from a legitimate business.” (SEC 2014a) 4 To illustrate, Phelps and Rhodes (2012, 1-12 – 1-16) list 24 Ponzi scheme cases, seven of which are not in our sample because the SEC does not refer to it as a Ponzi scheme (at least in the documents that we examined) and another four are cases where we can locate no mention of the case on the SEC’s website. 5 The process of data collection relied on multiple research assistants. The inclusion of a case in the sample was confirmed only after multiple crosschecks of each assistant’s work and excluding cases that were duplicates of other cases (e.g., where the SEC had pursued multiple persons in the same case). 6 Although the names are often used synonymously in media and by the press, Ponzi schemes differ from pyramid schemes because Ponzi schemes have ambiguous strategies and offer promises of guaranteed returns significantly higher than the broader market rate (Benson 2009), while pyramid schemes typically have more well defined strategies and require an investor to recruit others in order to receive payments.
6
the sample because the total amount raised by the perpetrator was not stated in any of the
available SEC filings. The final sample includes 376 cases.
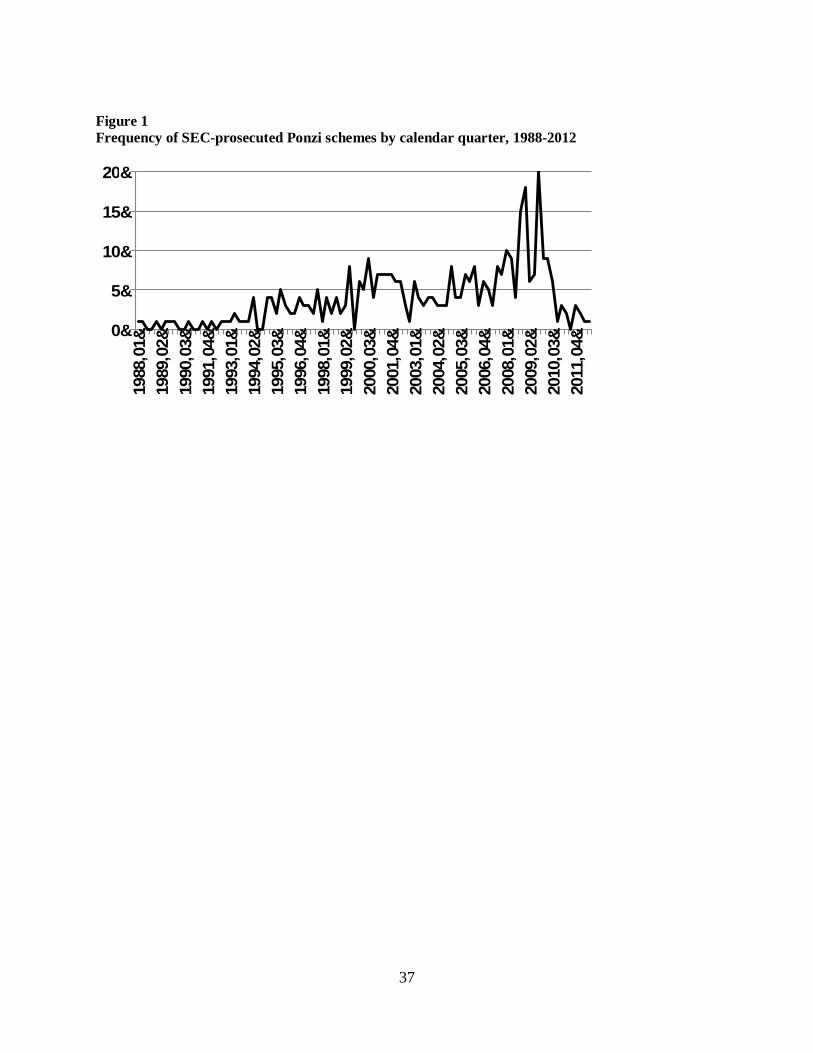
We define a given scheme’s end as occurring on the date of the first SEC litigation filing.
Figure 1 shows the frequency of sample Ponzi schemes by quarter starting in Q1-1988 through
Q3-2012. Only 11 cases in our sample occur before 1993. Four quarters have ten or more Ponzi
schemes in the sample, and all of these are in either 2008 or 2009. Q4-2009 is the quarter with
the maximum number (n=20). The high frequency of Ponzi schemes imploding in 2008 and 2009
suggests that the financial crisis played a role in the end of many schemes, perhaps because
investors sought to liquidate their positions, as was the case with the Madoff scheme (Henriques
2012).
The Pearson correlation between the number of SEC Ponzi schemes in a given quarter
and the return on the S&P 500 Index for that same quarter equals -.284 (untabulated). This
correlation suggests that Ponzi schemes are generally more likely to implode during periods of
poor stock market performance. It is likely that Ponzi schemes will be more likely to unravel in
bad economic times for two reasons. First, the Ponzi fraudster is more likely to skip a dividend
payment in bad economic times and such an omission might prompt a demand for withdrawals
by existing investors or a falloff in new investment in the fund. Second, enforcement budgets for
regulatory authorities such as the SEC tend to increase after the bursting of a stock market
bubble and such increased policing may also ferret out more frauds in a market downturn (e.g.,
Kedia and Rajgopal 2011).
In addition to the scheme’s ending date, we gathered data on several variables for each of
the Ponzi schemes in our sample from various court filings and press releases prepared by the
SEC. These data are imperfect in several ways. First, the measures are constructed from
7
incomplete or imperfect information – e.g., the number of victims and the amounts invested in a
given Ponzi scheme may not be knowable with 100% accuracy. Second, the SEC puts together
the information provided in these documents. As such, the information will be incomplete or
even biased to the extent that SEC officials’ incentives influence the information they gather and
present to the courts. For example, we cannot identify the primary legal violation for a given
fraud since the SEC likely cites multiple violations of laws to get the court to take the case more
seriously.
We collected additional data on our sample in three stages because the SEC can update
data about a given scheme as more is learned. As one example, the number of investors swindled
in a given scheme and the amounts they lost may not be known when the SEC initially goes to
court to shut the scheme down. We first had research assistants review each case and, when
available, record values for each variable we sought to measure. This was done before we
eliminated duplicate cases in order to have multiple court filings to resolve discrepancies.
Second, the data were “audited” by having ten percent of the cases coded by each research
assistant randomly selected and checked for accuracy. Research assistants with high accuracy
then checked the accuracy of data collected by those whose accuracy was lower and corrections
were made. Finally, two research assistants updated data files, and then exchanged files to check
the accuracy of the other’s work. In a small number of cases, the research assistants were unable
to resolve a disagreement and one of the co-authors resolved it. A list of the variables collected
for each case is provided in the Appendix.
Panel A of Table 2 provides summary statistics on the size, duration, and amounts taken
for our sample Ponzi schemes. In nominal dollars, the mean (median) amount invested by
victims equals $208 ($14.7) million. The mean (median) number of victims in the scheme is
8
3,127 (150) persons resulting in a mean (median) per-investor investment of $431.2 ($87.7)
thousand. The survival of a Ponzi scheme will require that investors be paid “dividends” out of
new investments, which means that a Ponzi scheme perpetrator can keep only a fraction of the
total investment in the scheme. For our sample, the mean (median) amount pocketed by the
Ponzi schemer is $13.4 ($1.0) million. The mean (median) duration of sample Ponzi schemes is
4.3 (3.1) years.
The typical Ponzi schemer is 45 years old at the time the scheme begins (see Panel B of
Table 2). A majority of our sample Ponzi schemes (57.2%) are carried out by a single
perpetrator. Female perpetrators are present in only 14.4% of the sample cases and 16.8%
involve a perpetrator that has a prior conviction for financial fraud.
Panel C of Table 2 provides information on the location of sample Ponzi schemes. SEC
documents do not usually report the area where the Ponzi schemer’s victims live and work, but
they do allow us to identify the location of the perpetrator’s residence. Thus, it is difficult to
pinpoint the exact location of the sample Ponzi schemes. We assume that the state in which the
SEC files a court action is the primary area where the fraudster operates. Slightly less than half
of the Ponzi schemers (48%) live in an urban location, where an urban location is defined as one
where the US Census Survey defines it as a area with 100,000 or more in population in the
immediate area or a population density of 1000 or more per square mile. About 74% of the Ponzi
schemes occur (i.e., are filed in court) in the same state where the perpetrator resides. Slightly
over 12% involve victims outside the U.S.
Panel D of Table 2 shows the frequency of different allegations made by the SEC when
seeking legal action to shut down a Ponzi scheme. The most frequent allegations concern
misrepresentation of investment strategy (93%), misappropriation of funds (89%), and fraudulent
9
high returns (87%). Falsified loan documents and asset values are present in a majority of cases
(57%), but relatively few involve falsely audited financial statements (only 13%).
EVIDENCE
We present evidence in sub-sections devoted to two issues that are of likely importance to
legal authorities and policymakers seeking to reduce the incidence of Ponzi schemes. Because
there is little systematic data in the extant accounting and the financial economics literatures on
Ponzi schemes, we first describe who is targeted in Ponzi schemes and how these schemes are
marketed to victims. Second, we present evidence on the characteristics of “successful” Ponzi
schemes as measured by duration, amounts raised, and amounts taken by the fraudster.
Ponzi scheme victim characteristics and marketing methods
It is likely that a Ponzi perpetrator will invest considerable effort in establishing and then
increasing the trust by his victims. Trust has been defined as “the willingness of a party to be
vulnerable to the actions of another party based on the expectation that the other will perform a
particular action important to the trustor, of the ability to monitor or control that other party”
(Schoorman, Mayer, & Davis, 1995, p. 712). Trust serves as an “alternative uncertainty
absorption mechanism to increased information” (Tomkins 2001, 165-166) that helps bridge a
gap between adequate information and “certain and complete” information (Stolowy et al. 2011).
All else equal, individuals who are inherently more trusting of others will also be more likely to
invest in a fraudulent scheme in the absence of reliable information on the fraudster’s past
behavior or the viability of his proposed scheme.

10
Zucker (1986) argues that trust is one of three types: (a) institutional-based trust that
stems from the functioning of formal and informal institutions, (b) process-based trust based on
an individual’s reputation derived from information about past inter-personal exchanges, and (c)
characteristics-based trust based on an affinity relation such as a common religion or ethnicity
(see also Stolowy et al. 2011). Ponzi schemes will more likely occur in unregulated, informal
settings that involve greater one-on-one interaction between the fraudster and his victim. Thus,
characteristics-based trust (e.g., ethnicity or religion) and process-based trust (e.g., fraudulent
attempts to build credibility and reputation) will be more important than institutional-based trust
in enabling a Ponzi scheme.
We expect that Ponzi schemers will try to exploit less-skeptical individuals who are more
likely to trust the perpetrator. These individuals would likely include those with a social tie to the
perpetrator – e.g., the perpetrator of an “affinity fraud” exploits the notion that “you can trust me
because I am like you” (Fairfax 2001). Affinity groups are more vulnerable to Ponzi schemes
because their members are in close and frequent contact with each other; news travels faster
within the group, members share values and tastes, and they trust each other (Frankel 2009).
Prominent sociologists suggest that social ties encourage false comfort by a victim wherein ex
ante information asymmetries and ex post opportunism are perceived to be lower than they
actually are (Granovetter 1983, 1985; Krackhardt 1992; Baker and Faulkner, 2004).7
To evaluate the reliance of the fraudster on social ties, we read the description of the
victims in SEC court flings and press releases and coded them as follows: (1) immediate social
7 Social ties have also been shown to have a “dark side” (Vaughan, 1999, 276), and the sociology literature provides numerous examples where reliance on social ties enables fraud. Granovetter (1985) notes that “the trust engendered by personal relations presents, by its very existence, enhanced opportunity for malfeasance” (p. 491), and this enhanced opportunity is supported empirically. For instance, Titus et al. (1995a, 1995b) find that attempts at fraud have a significantly greater likelihood of successful initiation when the victim knows or knows of the fraudster.
11
circle (e.g. family, friends, neighbors); (2) professional affinity (e.g. physicians, schoolteachers,
police, firemen); (3) religious ties (e.g. Protestant, Catholic, Mormon, Hindu, Jewish); and (4)
ethnic affinity (e.g. Greek, Jew, Italian). Given the prevalence of fraud involving the elderly
(Titus et al. 1995a, b), we also coded whether the scheme targeted the elderly.
Panel A of Table 3 indicates that about 17% of our sample Ponzi schemes involve elderly
victims, and 11% involve family or friends as victims. Another 10% involve affinity ties based
on religion, and in 7% of the cases the schemer and victim share a common ethnic background.
Only about one percent target individuals who were prior clients of a legitimate business
endeavor. Overall, 46% of the schemes in our sample involve an affinity link or have elderly
victims, and multiple such links are present in about 10% of our sample schemes.
While Ponzi schemers may rely on affinity links to bilk money from their victims, this
does not mean that they will eschew other, more formal, marketing methods to entice victims.
Ponzi scheme perpetrators often use mass media and websites, which do not involve face-to-face
interactions between the schemer and his victims (29% and 26% of all schemes, respectively) –
see Panel B of Table 3. While formal methods might help scale up the scheme, such methods are
risky since their use allows the scheme to be more readily observed by legal authorities that
might shut it down. Direct communication methods such as seminars and public speaking events
are used in 18% of the sample cases. Commissioned recruiters are employed in 27% of the cases,
client contacts from legitimate firms are used in 11% of the sample cases, and referral rewards
are employed in 8% of the cases.
Ponzi scheme perpetrators also frequently make promises of unsustainably high future
returns to those who invest in the scheme. An excessively large promised return is seen as a “red
flag” in Ponzi cases (Phelps and Rhodes 2012, 4-8). In an archetypical case, Charles Ponzi
12
promised clients a 100% profit within 90 days. Ponzi scheme perpetrators typically make
promises about an investment scheme’s future returns that are usually expressed as a range. We
take the minimum and maximum promised gains and convert them to implied annual promised
returns. The mean (median) promised return is 111% (12%) at the minimum and 437% (25%) at
the maximum (see Panel C of Table 3). The fact that the mean promised return is substantially
higher than the median indicates the distribution of promised returns is right-skewed. This
suggests that at least some Ponzi scheme perpetrators are making extraordinary claims about the
returns available from investing in their scheme, which is borne out by third-quartile values of
48% for the minimum and 100% for the maximum, respectively.
Ponzi schemers’ descriptions of their investment strategy range from simple strategies
involving investments in stocks and bonds to more complicated schemes involving real estate
transactions, international trade and so forth. To get a sense of how fraudsters describe their
schemes, we classified the scheme based on the SEC filings into one of twelve categories: (1)
investing in stocks and bonds (traditional securities), (2) real estate development & mortgage
lending, (3) investments in sophisticated financial instruments like derivatives, (4) oil and gas,
(5) banks, (6) international investments, (7) currency trading, (8) hedge funds (including private
equity and venture capital), (9) oil and gas investments, (10) intellectual property, and (11) trade.
Schemes that could not be categorized with specificity are labeled “miscellaneous.”
Most of the schemes are self-explanatory – e.g., an “oil and gas” scheme entices investors
to participate in the investment of oil and gas stocks, leasing oil wells, or a limited partnership
for oil wells. The category “investments in stock and bond markets” covers promises of
investing in relatively simpler securities such as the overall market index of securities or bonds,
CDs or mutual funds. The category “sophisticated strategies” involves promises to invest in
13
what an average investor might find to be relatively exotic investments such as buying and
selling stock options via a proprietary software, “diversified long and short selling,” “sale of
notes to invest in call options,” “foreign currency trading,” and “NYSE arbitrage.”
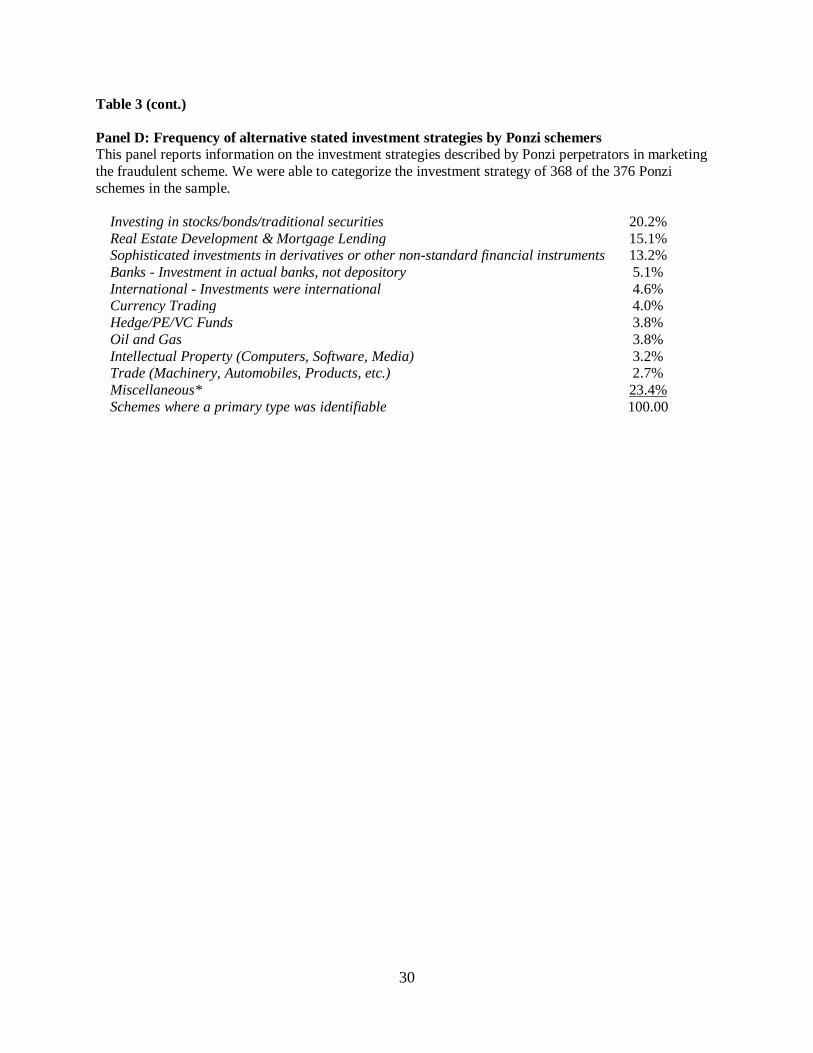
The frequencies of differing stated investment strategies are shown in Panel D of Table 3.
Of the observations for which we can classify the stated strategy with specificity, the most
frequent is investing in traditional stocks and bonds (20.2%), followed by real estate
development and mortgage lending (15.1%) and sophisticated investments (13.2%).
Incidence, duration, and size of Ponzi schemes
A successful Ponzi schemer is a criminal entrepreneur who pursues economic gains while
trying to evade detection by authorities who could impose penalties for violations of the law
(Becker 1968). In this sense, the fraudster is an optimizing agent who ex ante will undertake a
fraudulent scheme if victims can be identified and the risk of detection is low. Ex post this
suggests that measures of “success” such as scheme duration, amounts raised in the scheme, and
the percentage taken by the schemer will be associated with factors that vary by scheme location,
victim identity, and the methods used to market the scheme. To investigate these issues, we first
estimate a state-level count regression to see whether detected Ponzi schemes cluster in U.S.
states whose citizens are more likely to trust strangers. We then estimate further count models
using proxies for alternate investment opportunities for a state’s residents (public firms and
government debt), as well as cross-sectional models with dependent variables representing
various measures of ex post scheme success and independent variables reflecting the economic
forces that influence features of the Ponzi scheme.
14
The extent to which an individual inherently trusts others is likely a function of cultural
factors that vary by geographical location. As a proxy, we use a specific measure of the extent to
which citizens of a given U.S. state are likely to place trust in other persons. This measure is
based on answers to the two following survey questions: (1) “do you believe that most people
will try to take advantage of you, given a chance or would they try to be fair?” and (2) “generally
speaking, would you say that most people can be trusted or that you can’t be too careful in
dealing with people?” Data to measure these state-level trust variables were downloaded from
the University of Chicago’s NORC General Social Survey (GSS) website
(http://www3.norc.org/gss+website/). This nationally representative survey polls English-
speaking people who are 18 years or older that live in the United States.
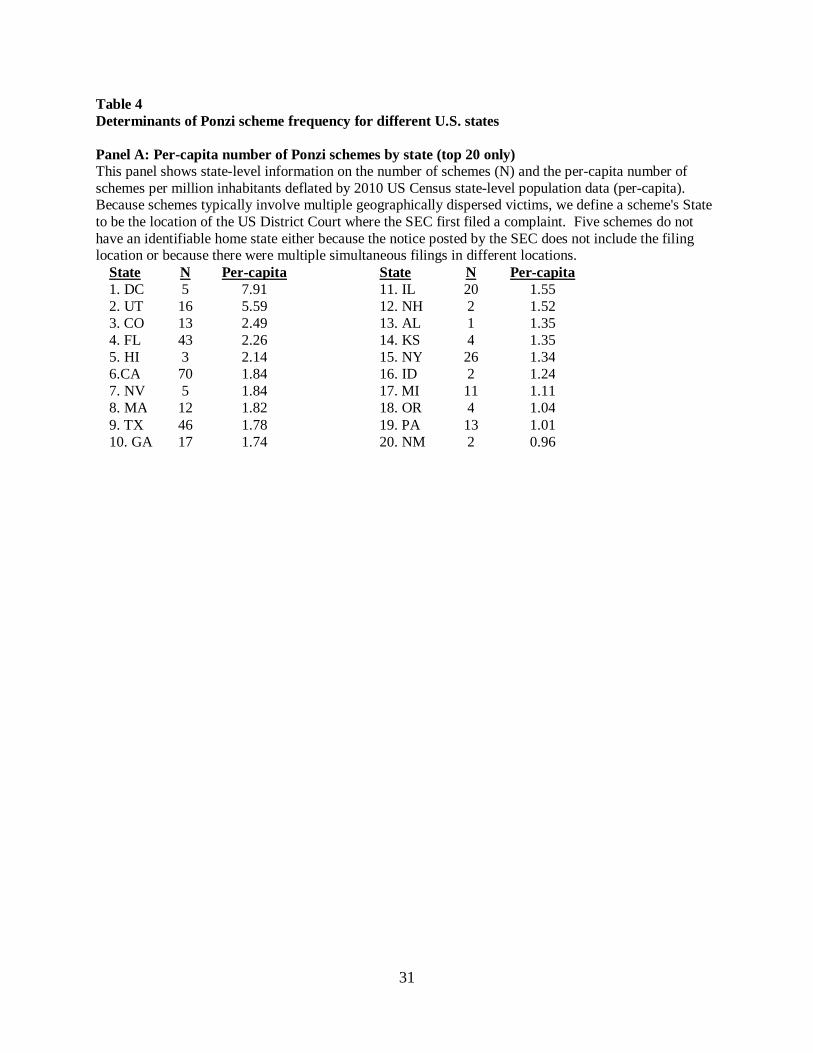
Panel A of Table 4 shows the frequency of Ponzi schemes for the twenty states with the
highest per-capita rate. Ponzi scheme location corresponds to where the SEC initially files a
court action. Per-capita Ponzi scheme frequency is based on a state’s population as measured in
the 2010 census. Based on this measure, the largest per-capita number of Ponzi schemes occur in
Washington DC (7.9), Utah (5.6), Colorado (2.5) and Florida (2.3). The high rate for Utah is
broadly consistent with the conjecture that Ponzi schemes often prey on affinity ties, given that
many citizens in Utah share a common religion (LDS). Similarly, the high frequency for Florida
is consistent with the notion that senior citizens are likely targets of Ponzi schemers.
Factors beyond a citizenry’s inherent propensity to trust will also influence cross-state
variation in Ponzi scheme frequency. These include differences across states in (a) income
levels, (b) the proportion of the population that are senior citizens (defined as 65 years and
above), and (c) the extent of law enforcement. Data for these variables are drawn from several
sources. The state’s per capita income for the year 2000 is obtained from
15
http://bber.unm.edu/econ/us-pci.htm. The proportion of senior citizens is the percentage of a
state’s population that is over 65 years old per the 2010 census. Law enforcement equals the
number of sworn law enforcement officials in the state in September 2004 (at
http://www.bjs.gov/index.cfm?ty=pbdetail&iid=539). We also control for the presence of an
SEC office in the state with an indicator variable that equals one for states with SEC offices. This
variable accounts for the possibility that the SEC provides additional law enforcement for
financial crime that reduces the incidence of fraud near where they operate (Kedia and Rajgopal
2011; Nagin 2013). To adjust for possible affinity frauds, we include the number of religious
adherents in the state as of year 2000.8 Also, we adjust for state size and education (the percent
of state residents with a college degree in year 2000).
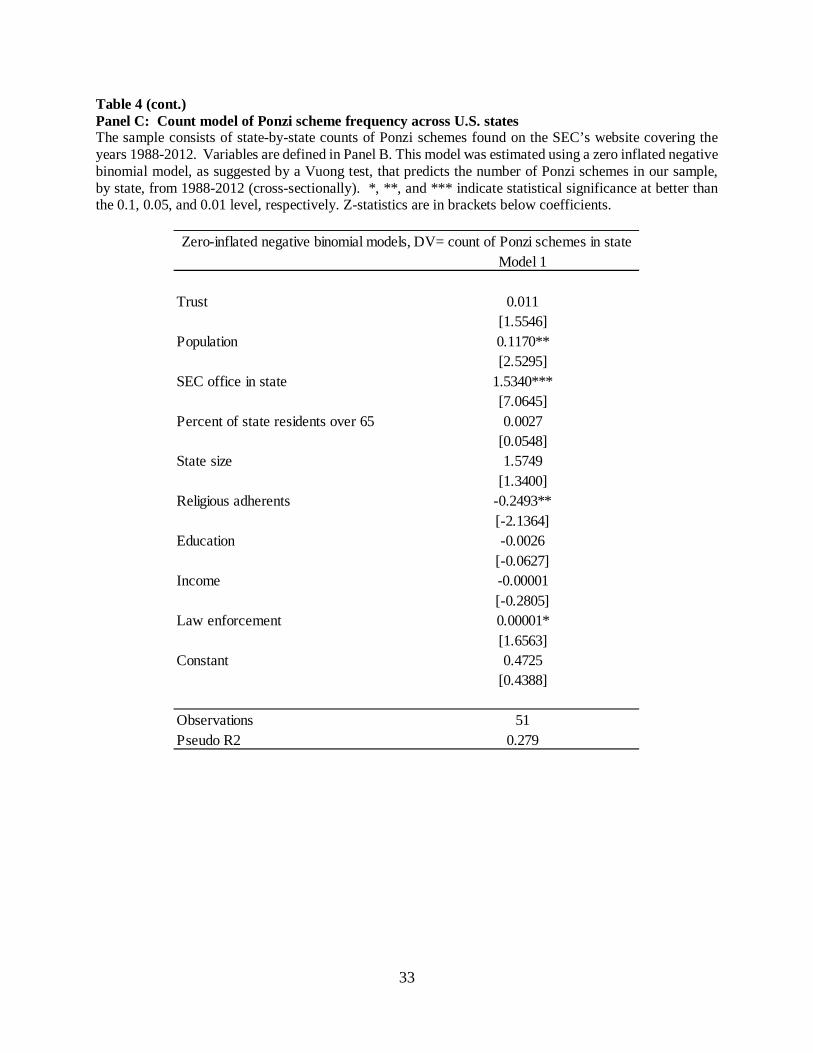
We predict the effect of these covariates on the number of Ponzi schemes using zero
inflated negative binomial count models. We estimate these cross-sectional models at the state
level (50+D.C.). Thirteen states have zero Ponzi schemes, and a Vuong test suggests that the
zero inflated negative binomial specification offers a better fit than the standard negative
binomial model (Greene 1994).9 Model 1 of Panel C of Table 4 presents the main result.
Notably, trust loads with a positive coefficient (p=0.13). This offers some support for our
prediction that more Ponzi schemes occur in states with higher trust.
In addition to trust, we believe that the Ponzi schemes are also likely a function of the
investment opportunities available in each state. Research in behavioral finance suggests that
individual investors prefer to invest in local firms (defined as headquartered in their own state or
within a few hundred miles of their home). There is debate over whether this is due to
8 We collect these data from the Association for Religion Data archives, similar to Hilary and Hui (2009). 9 The first stage of these zero inflated models uses a state’s population and number of journalists as independent variables.

16
information advantages (Coval and Moskowitz 1999; Bodnaruk 2009; Ivković and Weisbenner
2005) or just familiarity (Seasholes and Zhu 2010; García and Norli 2012), but evidence of a tilt
towards local firms is firmly established. This effect drives down rates of return in areas like the
Deep South, which has few public companies, and competition for a slice of the public float
among individuals serves to increase prices. Hong et al. (2008) refer to this as the “only game in
town” effect.
We expect that this “only game in town” effect impacts the appeal of Ponzi schemes. If
an area has a multitude of publically traded firms, then individual investors will be less likely to
consider alternate, unconventional investment strategies (that could lead to Ponzi schemes), as
local, familiar firms are available for trading at reasonable prices.
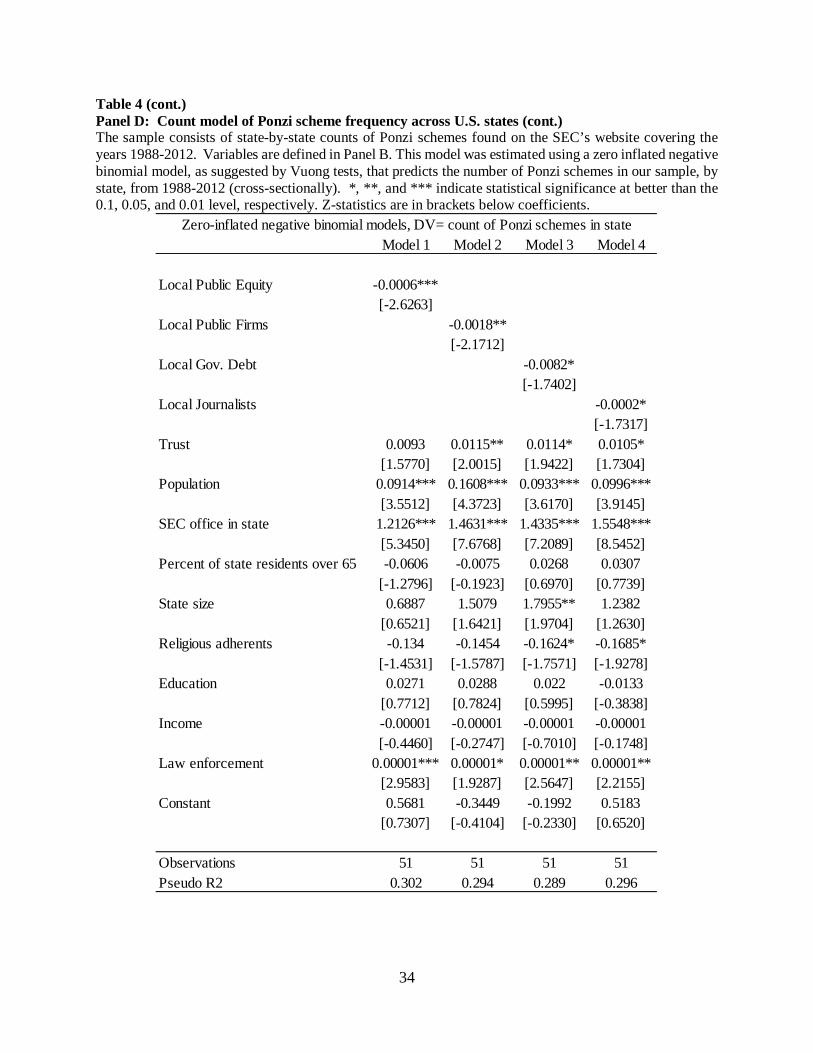
We investigate this prediction in Panel D of Table 4. Model 1 includes an independent
variable of interest called Local Public Equity, which is a sum of the market capitalization of all
companies headquartered in the given state as of the end of year 2000. This variable loads as
negative, suggesting that Ponzi schemes are less likely to emerge in states with lots of public
equity available to local investors. We confirm this result in Model 2, which uses Local Public
Firms as the independent variable of interest. This variable is just a count of the publically listed
firms in a state as of year 2000, and it also loads as negative, suggesting that when more firms
are available to local investors, fewer Ponzi schemes emerge.
Likewise, we suspect that local government debt could serve as an alternate investment
for individual investors, given the tax benefits (Poterba 1989; Atwood 2003). We examine this
proposition in Model 3, where the independent variable of interest, Local Gov. Debt, is the sum
of state and municipal debt outstanding in a given state at the end of year 2000. The negative
17
coefficient we observe in Model 3 indicates that fewer Ponzi schemes are emerge in areas where
more government debt is available to individual investors.
Finally, we examine the role of media in monitoring Ponzi schemes. Miller (2006) and
Dyck et al. (2010) find that the media plays an important role in constraining accounting fraud.
Intuitively, more snooping reporters makes maintaining a fraud more difficult and costly. While
these studies focus on fraud within publically traded companies, we suspect that the result holds
for other accounting frauds as well, especially Ponzi schemes, which are likely to attract wide
readership if detected by the press. We proxy for this level of monitoring by using the number of
journalists in each state, as of year 2000, as recorded by the U.S. Census. This variable loads as
negative in Model 4, and suggests that fewer Ponzi schemes emerge in states with more
journalists.
From the perspective of a Ponzi scheme perpetrator, a successful scheme is one where the
scheme remains undetected by the legal authorities, which allows the fraudster to continue
bilking money from his victims. Because we cannot observe schemes that are not detected by the
legal authorities, we use three ex post measures of success for the schemes that the SEC
prosecutes. The dependent variables based on scheme duration in years and size are labeled
duration and $invested, respectively. Because both of these variables are right skewed and fat
tailed, we use natural logs of these variables in our regression models. To measure the
perpetrator’s gains more directly, we also run a model with a dependent variable equal to the
percent of the amount raised that the perpetrator takes as personal compensation (%taken).
The forces that influence the success of a Ponzi scheme affect either the likelihood of a
scheme’s detection or a schemer’s ability to identify potential wealthy victims and secure their
trust, both of which influence the perceived gains from perpetrating a financial fraud. We expect
18
that an affinity link between the victim and the perpetrator will be one factor influencing a
scheme’s success. Consequently, schemes where the perpetrator and victims share one or more
affinity links based on a common race, ethnicity, or religion will last longer, generate more
investment, and result in greater benefits to the perpetrator, all else equal. Our first independent
variable in the model is affinitysum, which equals the sum of values for four 0-1 indicators that
assume a value of one if the scheme has victims either from family or friends, common religion,
common ethnicity, or professional clients in a legitimate business, respectively.
We also expect that Ponzi schemes targeting the elderly will also be more successful if
the schemer targets senior citizens and these persons are inherently more trusting. Our second
independent variable, elderly, equals one when the elderly are mentioned by the SEC as a target
in a Ponzi scheme, and zero otherwise.
We also expect that the marketing methods used by a Ponzi schemer can influence the
scheme’s duration and size. Specifically, successful schemers will more likely use methods that
increase social ties between the schemer and his victims while also allowing the scheme to
escape attention from the legal authorities as was the case with the Madoff scheme (Henriques
2012). We therefore predict that Ponzi schemes marketed through informal marketing methods
will last longer and generate greater investment by victims. We include a 0-1 variable (informal)
that equals one if the scheme is marketed through seminars, lunches, or public speeches.
Conversely, schemes relying on more formal methods may be easier for the authorities to detect
and will thus be of shorter duration and generate less investment. We thus include a second 0-1
variable (formal), which equals one if the schemer uses media like newspaper ads or a website to
market the scheme.
19
Financial incentives also likely play an important role in attracting victims into a Ponzi
scheme. We include a variable capturing the presence of payments by the perpetrator to third
parties in the form of commissions and referral rewards paid to those who directly recruit
victims. A 0-1 variable labeled incent equals one if the schemer either uses commissioned
recruiters or provides reward payments to those who recruit new victims to the scheme.
We also expect that collusive schemes involving multiple perpetrators will also likely
have different success rates. However, this association could be either positive or negative. A
multi-perpetrator scheme can increase victim contributions if significant economies of scale exist
in victim recruitment. Alternatively, collusive arrangements become increasingly unstable as the
number of collaborators in the perpetrator class increases (e.g., Huck et al. 2004). We include a
0-1 variable, multperps, to the model that takes on a value of one if the SEC names multiple
persons as perpetrators in legal actions to shut down the scheme.
We include three additional control variables in each model. The first is a 0-1 variable
that assumes a value of 1 for schemes located in a rural area to a greater degree (rural). If
location picks up differences in potential victim skepticism or trusting behavior as documented
in Table 4, then including rural in the model will help control for such effects. A second 0-1
variable assumes a value of 1 if the perpetrator has a prior conviction for a financial crime. The
effect of this variable will depend on both whether a perpetrator “learns” from prior mistakes to
improve their success rate or whether a prior conviction indicates lower inherent talent for
successful fraud perpetration. A third 0-1 variable controls for effects that vary across time. For
example, the use of mass media in marketing a Ponzi scheme presumably would be less likely
during early years of our sample since the Internet was not as well developed in that period. This
20
indicator variable labeled post1999 equals 1 for any scheme terminating in calendar 2000 or
later.
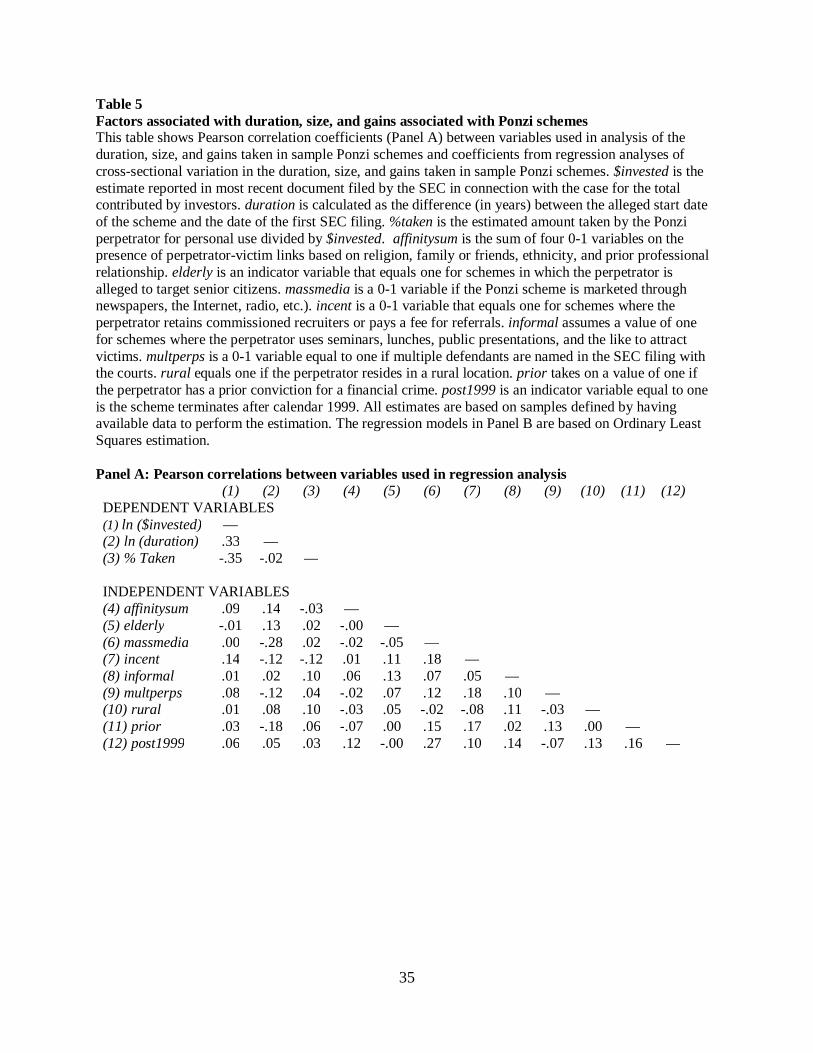
Panel A of Table 5 shows Pearson correlations between the variables. Not surprisingly,
the correlations between the dependent variables (duration, $invested, and %Taken) are larger in
absolute magnitude than the pairwise correlations between independent variables. None of the
correlations between independent variables exceed .2 in absolute value, which suggests that
multicollinearity is unlikely to be a major concern in estimating the models.
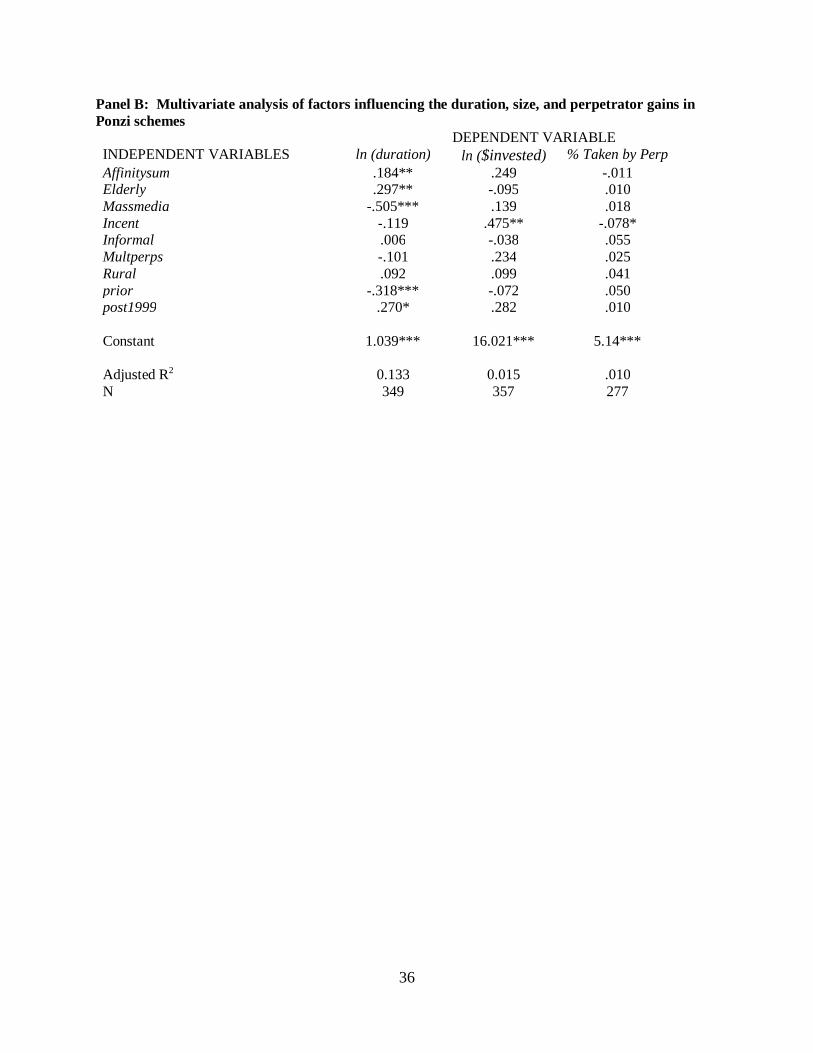
Panel B of Table 5 shows coefficient estimates from linear models estimated using OLS.
The model with duration as the dependent variable has greater explanatory power than the
models based on $invested and %taken (adjusted R2 of 0.133 versus 0.015 and 0.010). In the
duration model, the coefficient estimates indicate that schemes with affinity ties and ones that
target the elderly tend to last longer (both coefficients are positive and are significantly different
from zero at better than the 0.05 level). Schemes using mass media to market the scheme are
significantly shorter in duration (coefficient on massmedia equals -0.505, significant at better
than 0.01). Interestingly, the coefficient on prior is significantly negative, which suggests that
Ponzi schemers with a prior conviction are less successful when success is measured by duration.
The models with $invested and %taken as dependent variables show that only incent has
a significant coefficient in these models. For the $invested model, the coefficient on incent
equals 0.475, which is significant at better than the 0.05 level. This indicates that Ponzi
perpetrators who pay referral fees and commissions raise significantly more money from their
victims than those who provide no such incentives. Accordingly, the model with %taken as the
dependent variable indicates that incent significantly explains cross-sectional variation in %taken
(coefficient = -0.078; significant at p ≤ 0.10).
21
CONCLUSIONS AND IMPLICATIONS
Our objective in this paper has been to provide large-scale evidence on the characteristics
of Ponzi schemes. Our main focus has been on describing several aspects of Ponzi schemes and
documenting factors associated with their incidence and economic costs. We use a sample of 376
Ponzi schemes prosecuted by the SEC from 1988-Q1 through 2012-Q4.
While our sample includes some frauds that are of massive scale, most SEC-prosecuted
Ponzi schemes are much smaller. The mean (median) total amount invested in our sample Ponzi
schemes is $208 ($14.7) million. In comparison, the schemes perpetrated by Bernard Madoff and
Allen Stanford involved investments by victims that exceeded $8 billion in both cases. Ponzi
schemes in our sample last 4.3 (3.1) years at the mean (median), and the mean (median) number
of investors in these schemes is over 3,000 (about 150).
Many of the Ponzi schemes in our sample involved an affinity link between the
perpetrator and victims based on religion or ethnicity, or were targeted at persons more likely to
inherently place trust in others (e.g., senior citizens). Consistent with this, the frequency of Ponzi
schemes is greater in U.S. states whose citizens place greater trust in strangers. Furthermore,
more Ponzi schemes emerge where conventional local investment opportunities, like stocks and
bonds, are lacking, and where monitoring by the press is weak. Additional analysis indicates that
Ponzi schemes where an affinity link is present or senior citizens are targeted tend to have longer
durations, perhaps because victims in these schemes continue to trust their Ponzi scheme
perpetrator longer. The primary factor explaining the amount swindled in a Ponzi scheme is
whether the perpetrator provides financial incentives to third parties who obtain new victims.
22
It is evident that substantial social costs are associated with financial frauds like Ponzi
schemes. These costs include direct investor losses as well as the costs arising from the complex
legal processes used ex post when a Ponzi scheme is unraveled to see what actually happened
(Phelps and Rhodes 2012). Thus, there is likely a demand for institutions that can reduce the
social costs of financial fraud.
While it seems self-evident that a demand for such institutions exists, it is far from clear
which institutions will most effectively meet this demand. Investor education is one likely
means, and the SEC is providing guidance on its website to potential investors on how to avoid
being a victim of financial fraud (see SEC 2014b). In terms of monitoring by the authorities, it is
possible that resources could be devoted to tracking prior offenders to make sure they do not
return to their prior ways. In addition, because Ponzi schemes cluster geographically according
to local norms of trusting, effective enforcement will likely require a great investment in locales
where Ponzi perpetrators are more likely to prey in their search for victims. Additional research
that investigates these issues is clearly warranted. Such research should investigate legal
enforcement and investor behavior in both naturally occurring and experimental settings (Kedia
and Rajgopal 2014; Waymire et al. 2015).
23
References Atwood, T. J. 2003. Implicit Taxes: Evidence from Taxable, AMT, and Tax‐Exempt State and
Local Government Bond Yields. The Journal of the American Taxation Association 25 (1): 1–20.
Baker, W. and R. Faulkner, 2004. Social networks and loss of capital. Social Networks 26: 91-111.
Becker, G., 1968. Crime and punishment: an economic approach. Journal of Political Economy 76 (2): 169-217.
Benson, S., 2009. Recognizing the red flags of a Ponzi scheme, CPA Journal 79 (6): 18-25.
Bodnaruk, A. 2009. Proximity Always Matters: Local Bias When the Set of Local Companies Changes. Review of Finance: rfp014.
Coval, J. D., and T. J. Moskowitz. 1999. Home Bias at Home: Local Equity Preference in Domestic Portfolios. Journal of Finance 54 (6): 2045–2073.
Dyck, A., A. Morse, and L. Zingales. 2010. Who Blows the Whistle on Corporate Fraud? The Journal of Finance 65 (6): 2213–2253.
Fairfax, L. 2001. 'With friends like these...': toward a more efficacious response to affinity-based securities and investment fraud. Georgia Law Review 64: 63-119.
Frankel, T. 2009. Statement of Tamar Frankel, Professor of Law, Boston University, Before the Subcommittee of Economic Growth And Credit Formation of the U.S. House of Representatives, January 5.
García, D., and Ø. Norli. 2012. Geographic dispersion and stock returns. Journal of Financial Economics 106 (3): 547–565.
Granovetter, M., 1983. The strength of weak ties: a network theory revisited." Sociological Theory 1: 201-233.
Granovetter, M., 1985. Economic action and social structure: the problem of embeddedness. American Journal of Sociology 91 (3): 481-510.
Greene, W. 1994. Accounting for Excess Zeros and Sample Selection in Poisson and Negative Binomial Regression Models. Working Paper. New York University, Leonard N. Stern School of Business, Department of Economics.
Henriques, D., 2012. The Wizard of Lies. New York, NY: St. Martin’s Griffin.
Hilary, G., and K. W. Hui. 2009. Does religion matter in corporate decision making in America? Journal of Financial Economics 93 (3): 455–473.
24
Hong, H., J. D. Kubik, and J. C. Stein. 2008. The only game in town: Stock-price consequences of local bias. Journal of Financial Economics 90 (1): 20–37.
Huck, S., H.-T. Normann, and J. Oechssler. 2004. Two are few and four are many: number effects in experimental oligopolies. Journal of Economic Behavior & Organization 53 (4): 435–446.
Ivković, Z., and S. Weisbenner. 2005. Local does as local is: information content of the
geography of individual investors’ common stock investments. The Journal of Finance 60 (1): 267–306.
Kedia, S. and S. Rajgopal. 2011. Do the SEC’s enforcement preferences affect corporate misconduct? Journal of Accounting & Economics 51: 259-278.
Krackhardt, D., 1992. The strength of strong ties: the importance of philos in organizations. Networks and Organizations: Structure, Form, and Action 216: 239.
Miller, G. S. 2006. The press as a watchdog for accounting fraud. Journal of Accounting Research 44 (5): 1001–1033.
Nagin, D., 2013. Deterrence: a review of the evidence by a criminologist for economists. Annual Review of Economics 5: 83-105.
Phelps, K. and S. Rhodes, 2012. The Ponzi Book: A Legal Resource for Unraveling Ponzi Schemes. New Providence, NJ: LexisNexis.
Poterba, J. M. 1989. Tax reform and the market for tax-exempt debt. Regional Science and Urban Economics 19 (3): 537–562.
Schoorman, F. D., R. C. Mayer, and J. H. Davis, 1995. An integrative model of organizational trust. Academy of Management Review 32 (2): 709-734.
Seasholes, M. S., and N. Zhu. 2010. Individual Investors and Local Bias. The Journal of Finance 65 (5): 1987–2010.
Securities and Exchange Commission (SEC), 2009. Putting investors first 2009 Performance and Accountability Report. Available at http://www.sec.gov/about/secpar/secpar2009.pdf.
Securities and Exchange Commission (SEC), 2014a. Ponzi schemes. Available online at http://www.sec.gov/answers/ponzi.htm.
Securities and Exchange Commission (SEC), 2014b. Affinity fraud: how to avoid investment scams that target groups. Available online at www.sec.gov/investor/pubs/affinity.
Smith, A., 1759. The Theory of Moral Sentiments. Re-issued 1997, Washington, DC: Regnery Publishing Inc.
25
Stolowy, H., M. Messner, T. Jeanjean, and C. R. Baker, 2014. The construction of a trustworthy investment opportunity: insights from the Madoff fraud. Contemporary Accounting Research 31 (2): 354-397.
Titus, R., F. Heinzelmann, and J. Boyle, 1995a. Victimization of persons by fraud. Crime and Delinquency 41 (1): 54-72.
Titus, R., Heinzelmann, F., Boyle, J.M., 1995b. The anatomy of fraud: report of a nationwide survey. National Institute of Justice Journal 229: 28–34.
Tomkins, C., 2001. Interdependencies, trust and information in relationships, alliances and networks. Accounting, Organizations and Society 26 (2): 161-191.
Vaughan, D., 1999. The dark side of organizations: mistake, misconduct, and disaster. Annual Review of Sociology 25: 271-305.
Waymire, G., R. Lunawat, and B. Xin, 2015. The impact of hard information on self-dealing: experimental evidence, Unpublished working paper.
Zucker, L., 1986. Production of trust: institutional sources of economic structure, 1840–1920. Research in Organizational Behavior 8: 53-111.
Zuckoff, M., 2006. Ponzi’s Scheme: The True Story of a Financial Legend. New York, NY: Random House.
26
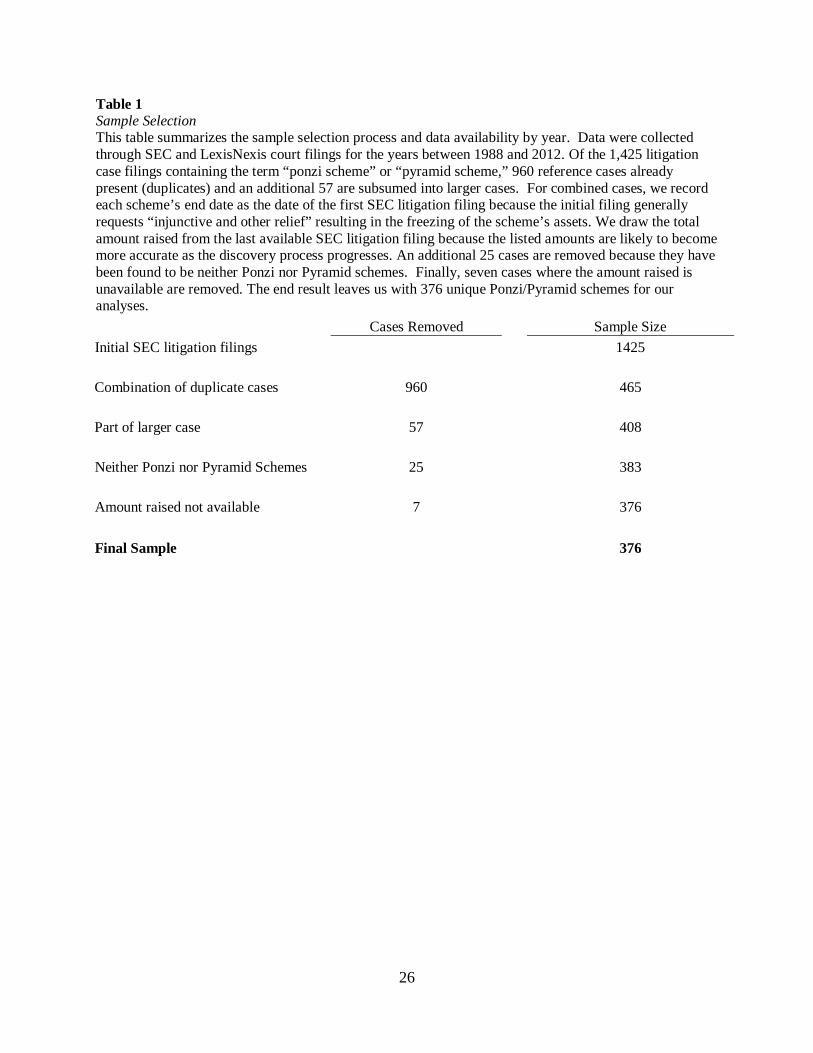
Table 1 Sample Selection This table summarizes the sample selection process and data availability by year. Data were collected through SEC and LexisNexis court filings for the years between 1988 and 2012. Of the 1,425 litigation case filings containing the term “ponzi scheme” or “pyramid scheme,” 960 reference cases already present (duplicates) and an additional 57 are subsumed into larger cases. For combined cases, we record each scheme’s end date as the date of the first SEC litigation filing because the initial filing generally requests “injunctive and other relief” resulting in the freezing of the scheme’s assets. We draw the total amount raised from the last available SEC litigation filing because the listed amounts are likely to become more accurate as the discovery process progresses. An additional 25 cases are removed because they have been found to be neither Ponzi nor Pyramid schemes. Finally, seven cases where the amount raised is unavailable are removed. The end result leaves us with 376 unique Ponzi/Pyramid schemes for our analyses.
Cases Removed Sample Size Initial SEC litigation filings 1425 Combination of duplicate cases 960 465 Part of larger case 57 408 Neither Ponzi nor Pyramid Schemes 25 383 Amount raised not available 7 376 Final Sample 376
27
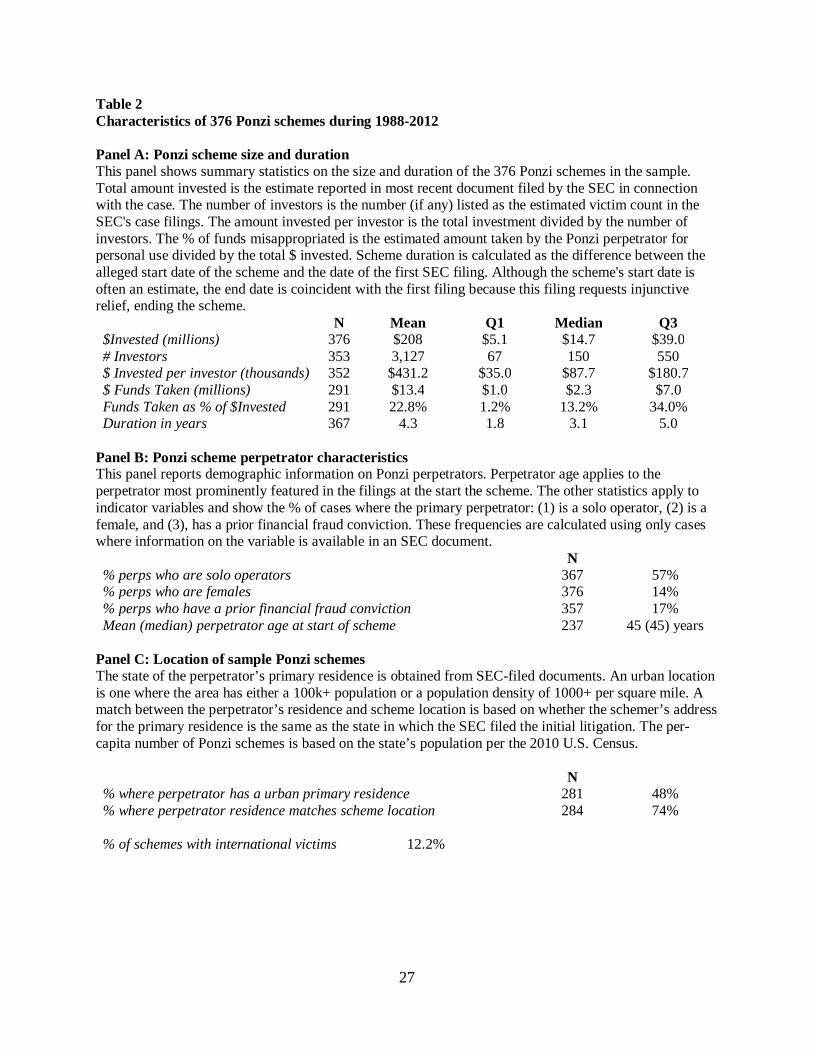
Table 2 Characteristics of 376 Ponzi schemes during 1988-2012 Panel A: Ponzi scheme size and duration This panel shows summary statistics on the size and duration of the 376 Ponzi schemes in the sample. Total amount invested is the estimate reported in most recent document filed by the SEC in connection with the case. The number of investors is the number (if any) listed as the estimated victim count in the SEC's case filings. The amount invested per investor is the total investment divided by the number of investors. The % of funds misappropriated is the estimated amount taken by the Ponzi perpetrator for personal use divided by the total $ invested. Scheme duration is calculated as the difference between the alleged start date of the scheme and the date of the first SEC filing. Although the scheme's start date is often an estimate, the end date is coincident with the first filing because this filing requests injunctive relief, ending the scheme. N Mean Q1 Median Q3 $Invested (millions) 376 $208 $5.1 $14.7 $39.0 # Investors 353 3,127 67 150 550 $ Invested per investor (thousands) 352 $431.2 $35.0 $87.7 $180.7 $ Funds Taken (millions) 291 $13.4 $1.0 $2.3 $7.0 Funds Taken as % of $Invested 291 22.8% 1.2% 13.2% 34.0% Duration in years 367 4.3 1.8 3.1 5.0
Panel B: Ponzi scheme perpetrator characteristics This panel reports demographic information on Ponzi perpetrators. Perpetrator age applies to the perpetrator most prominently featured in the filings at the start the scheme. The other statistics apply to indicator variables and show the % of cases where the primary perpetrator: (1) is a solo operator, (2) is a female, and (3), has a prior financial fraud conviction. These frequencies are calculated using only cases where information on the variable is available in an SEC document. N % perps who are solo operators 367 57% % perps who are females 376 14% % perps who have a prior financial fraud conviction 357 17% Mean (median) perpetrator age at start of scheme 237 45 (45) years
Panel C: Location of sample Ponzi schemes The state of the perpetrator’s primary residence is obtained from SEC-filed documents. An urban location is one where the area has either a 100k+ population or a population density of 1000+ per square mile. A match between the perpetrator’s residence and scheme location is based on whether the schemer’s address for the primary residence is the same as the state in which the SEC filed the initial litigation. The per-capita number of Ponzi schemes is based on the state’s population per the 2010 U.S. Census. N % where perpetrator has a urban primary residence 281 48% % where perpetrator residence matches scheme location 284 74%
% of schemes with international victims 12.2%

28
Panel D: Specific allegations made by the SEC in court filings This set of numbers is based on 0-1 indicator variables that pertain to specific SEC allegations of deceptive practices used in the Ponzi scheme. For each of these variables, 1 refers to a case where the deceptive practice is mentioned in at least one SEC document and 0 means that no allegation of the deceptive practice appears in any of the SEC documents examined. Of course, a value of 0 for a variable could be either because such behavior did not occur or because the SEC saw it as insufficiently important to mention. 1. Misrepresenting investment strategy 93% 5. Falsified documents or asset values 57% 2. Misappropriation 89% 6. Failing to disclose criminal history 15% 3. Fraudulent high returns 87% 7. Falsely "audited" statements 13% 4. Misrepresenting investment risk 80%
29
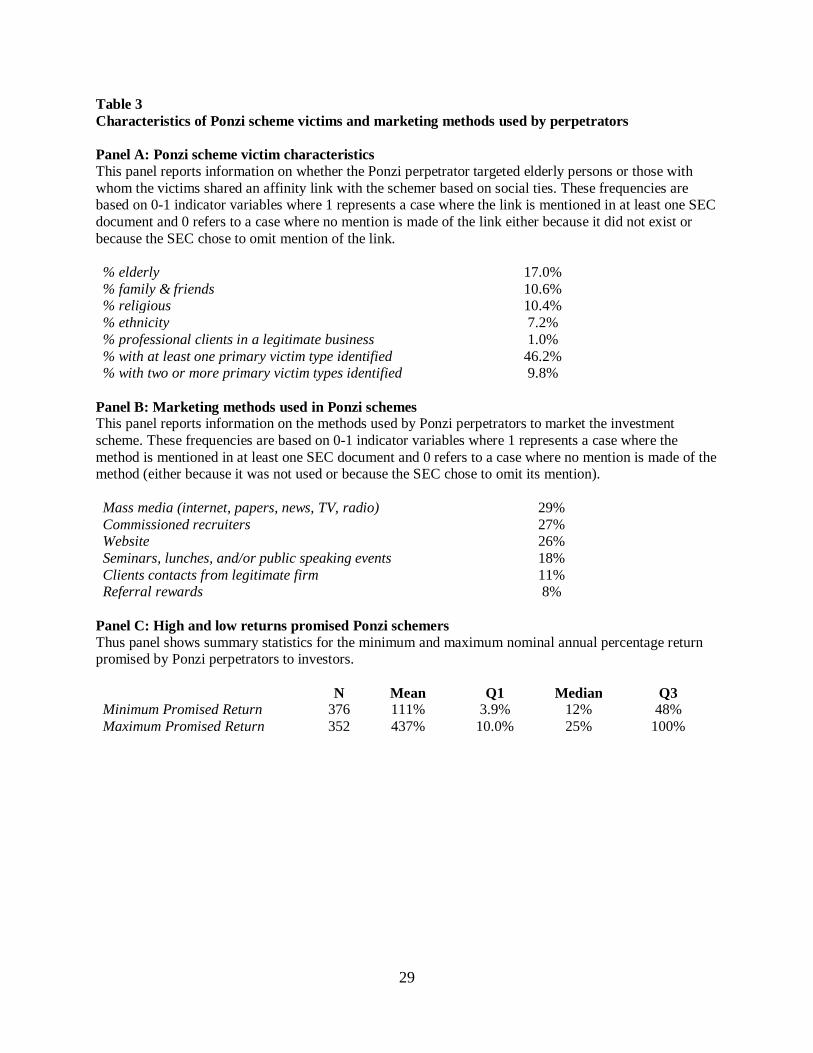
Table 3 Characteristics of Ponzi scheme victims and marketing methods used by perpetrators Panel A: Ponzi scheme victim characteristics This panel reports information on whether the Ponzi perpetrator targeted elderly persons or those with whom the victims shared an affinity link with the schemer based on social ties. These frequencies are based on 0-1 indicator variables where 1 represents a case where the link is mentioned in at least one SEC document and 0 refers to a case where no mention is made of the link either because it did not exist or because the SEC chose to omit mention of the link. % elderly 17.0% % family & friends 10.6% % religious 10.4% % ethnicity 7.2% % professional clients in a legitimate business 1.0% % with at least one primary victim type identified 46.2% % with two or more primary victim types identified 9.8%
Panel B: Marketing methods used in Ponzi schemes This panel reports information on the methods used by Ponzi perpetrators to market the investment scheme. These frequencies are based on 0-1 indicator variables where 1 represents a case where the method is mentioned in at least one SEC document and 0 refers to a case where no mention is made of the method (either because it was not used or because the SEC chose to omit its mention). Mass media (internet, papers, news, TV, radio) 29% Commissioned recruiters 27% Website 26% Seminars, lunches, and/or public speaking events 18% Clients contacts from legitimate firm 11% Referral rewards 8%
Panel C: High and low returns promised Ponzi schemers Thus panel shows summary statistics for the minimum and maximum nominal annual percentage return promised by Ponzi perpetrators to investors. N Mean Q1 Median Q3 Minimum Promised Return 376 111% 3.9% 12% 48% Maximum Promised Return 352 437% 10.0% 25% 100%
30
Table 3 (cont.) Panel D: Frequency of alternative stated investment strategies by Ponzi schemers This panel reports information on the investment strategies described by Ponzi perpetrators in marketing the fraudulent scheme. We were able to categorize the investment strategy of 368 of the 376 Ponzi schemes in the sample.
Investing in stocks/bonds/traditional securities 20.2% Real Estate Development & Mortgage Lending 15.1% Sophisticated investments in derivatives or other non-standard financial instruments 13.2% Banks - Investment in actual banks, not depository 5.1% International - Investments were international 4.6% Currency Trading 4.0% Hedge/PE/VC Funds 3.8% Oil and Gas 3.8% Intellectual Property (Computers, Software, Media) 3.2% Trade (Machinery, Automobiles, Products, etc.) 2.7% Miscellaneous* 23.4% Schemes where a primary type was identifiable 100.00
31
Table 4 Determinants of Ponzi scheme frequency for different U.S. states Panel A: Per-capita number of Ponzi schemes by state (top 20 only) This panel shows state-level information on the number of schemes (N) and the per-capita number of schemes per million inhabitants deflated by 2010 US Census state-level population data (per-capita). Because schemes typically involve multiple geographically dispersed victims, we define a scheme's State to be the location of the US District Court where the SEC first filed a complaint. Five schemes do not have an identifiable home state either because the notice posted by the SEC does not include the filing location or because there were multiple simultaneous filings in different locations.
State N Per-capita State N Per-capita 1. DC 5 7.91 11. IL 20 1.55 2. UT 16 5.59 12. NH 2 1.52 3. CO 13 2.49 13. AL 1 1.35 4. FL 43 2.26 14. KS 4 1.35 5. HI 3 2.14 15. NY 26 1.34 6.CA 70 1.84 16. ID 2 1.24 7. NV 5 1.84 17. MI 11 1.11 8. MA 12 1.82 18. OR 4 1.04 9. TX 46 1.78 19. PA 13 1.01 10. GA 17 1.74 20. NM 2 0.96
32
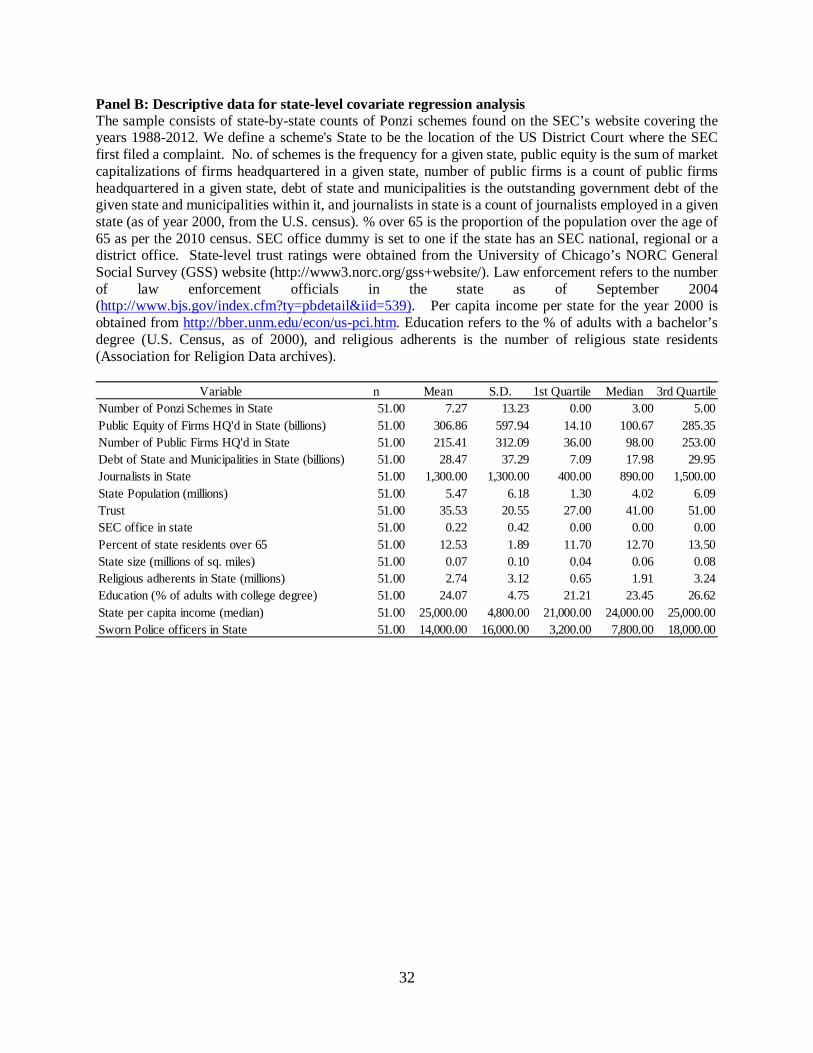
Panel B: Descriptive data for state-level covariate regression analysis The sample consists of state-by-state counts of Ponzi schemes found on the SEC’s website covering the years 1988-2012. We define a scheme's State to be the location of the US District Court where the SEC first filed a complaint. No. of schemes is the frequency for a given state, public equity is the sum of market capitalizations of firms headquartered in a given state, number of public firms is a count of public firms headquartered in a given state, debt of state and municipalities is the outstanding government debt of the given state and municipalities within it, and journalists in state is a count of journalists employed in a given state (as of year 2000, from the U.S. census). % over 65 is the proportion of the population over the age of 65 as per the 2010 census. SEC office dummy is set to one if the state has an SEC national, regional or a district office. State-level trust ratings were obtained from the University of Chicago’s NORC General Social Survey (GSS) website (http://www3.norc.org/gss+website/). Law enforcement refers to the number of law enforcement officials in the state as of September 2004 (http://www.bjs.gov/index.cfm?ty=pbdetail&iid=539). Per capita income per state for the year 2000 is obtained from http://bber.unm.edu/econ/us-pci.htm. Education refers to the % of adults with a bachelor’s degree (U.S. Census, as of 2000), and religious adherents is the number of religious state residents (Association for Religion Data archives).
Variable n Mean S.D. 1st Quartile Median 3rd QuartileNumber of Ponzi Schemes in State 51.00 7.27 13.23 0.00 3.00 5.00Public Equity of Firms HQ'd in State (billions) 51.00 306.86 597.94 14.10 100.67 285.35Number of Public Firms HQ'd in State 51.00 215.41 312.09 36.00 98.00 253.00Debt of State and Municipalities in State (billions) 51.00 28.47 37.29 7.09 17.98 29.95Journalists in State 51.00 1,300.00 1,300.00 400.00 890.00 1,500.00State Population (millions) 51.00 5.47 6.18 1.30 4.02 6.09Trust 51.00 35.53 20.55 27.00 41.00 51.00SEC office in state 51.00 0.22 0.42 0.00 0.00 0.00Percent of state residents over 65 51.00 12.53 1.89 11.70 12.70 13.50State size (millions of sq. miles) 51.00 0.07 0.10 0.04 0.06 0.08Religious adherents in State (millions) 51.00 2.74 3.12 0.65 1.91 3.24Education (% of adults with college degree) 51.00 24.07 4.75 21.21 23.45 26.62State per capita income (median) 51.00 25,000.00 4,800.00 21,000.00 24,000.00 25,000.00Sworn Police officers in State 51.00 14,000.00 16,000.00 3,200.00 7,800.00 18,000.00
33
Table 4 (cont.) Panel C: Count model of Ponzi scheme frequency across U.S. states The sample consists of state-by-state counts of Ponzi schemes found on the SEC’s website covering the years 1988-2012. Variables are defined in Panel B. This model was estimated using a zero inflated negative binomial model, as suggested by a Vuong test, that predicts the number of Ponzi schemes in our sample, by state, from 1988-2012 (cross-sectionally). *, **, and *** indicate statistical significance at better than the 0.1, 0.05, and 0.01 level, respectively. Z-statistics are in brackets below coefficients.
Model 1
Trust 0.011[1.5546]
Population 0.1170**[2.5295]
SEC office in state 1.5340***[7.0645]
Percent of state residents over 65 0.0027[0.0548]
State size 1.5749[1.3400]
Religious adherents -0.2493**[-2.1364]
Education -0.0026[-0.0627]
Income -0.00001[-0.2805]
Law enforcement 0.00001*[1.6563]
Constant 0.4725[0.4388]
Observations 51Pseudo R2 0.279
Zero-inflated negative binomial models, DV= count of Ponzi schemes in state
34
Table 4 (cont.) Panel D: Count model of Ponzi scheme frequency across U.S. states (cont.) The sample consists of state-by-state counts of Ponzi schemes found on the SEC’s website covering the years 1988-2012. Variables are defined in Panel B. This model was estimated using a zero inflated negative binomial model, as suggested by Vuong tests, that predicts the number of Ponzi schemes in our sample, by state, from 1988-2012 (cross-sectionally). *, **, and *** indicate statistical significance at better than the 0.1, 0.05, and 0.01 level, respectively. Z-statistics are in brackets below coefficients.
Model 1 Model 2 Model 3 Model 4
Local Public Equity -0.0006***[-2.6263]
Local Public Firms -0.0018**[-2.1712]
Local Gov. Debt -0.0082*[-1.7402]
Local Journalists -0.0002*[-1.7317]
Trust 0.0093 0.0115** 0.0114* 0.0105*[1.5770] [2.0015] [1.9422] [1.7304]
Population 0.0914*** 0.1608*** 0.0933*** 0.0996***[3.5512] [4.3723] [3.6170] [3.9145]
SEC office in state 1.2126*** 1.4631*** 1.4335*** 1.5548***[5.3450] [7.6768] [7.2089] [8.5452]
Percent of state residents over 65 -0.0606 -0.0075 0.0268 0.0307[-1.2796] [-0.1923] [0.6970] [0.7739]
State size 0.6887 1.5079 1.7955** 1.2382[0.6521] [1.6421] [1.9704] [1.2630]
Religious adherents -0.134 -0.1454 -0.1624* -0.1685*[-1.4531] [-1.5787] [-1.7571] [-1.9278]
Education 0.0271 0.0288 0.022 -0.0133[0.7712] [0.7824] [0.5995] [-0.3838]
Income -0.00001 -0.00001 -0.00001 -0.00001[-0.4460] [-0.2747] [-0.7010] [-0.1748]
Law enforcement 0.00001*** 0.00001* 0.00001** 0.00001**[2.9583] [1.9287] [2.5647] [2.2155]
Constant 0.5681 -0.3449 -0.1992 0.5183[0.7307] [-0.4104] [-0.2330] [0.6520]
Observations 51 51 51 51Pseudo R2 0.302 0.294 0.289 0.296
Zero-inflated negative binomial models, DV= count of Ponzi schemes in state
35
Table 5 Factors associated with duration, size, and gains associated with Ponzi schemes This table shows Pearson correlation coefficients (Panel A) between variables used in analysis of the duration, size, and gains taken in sample Ponzi schemes and coefficients from regression analyses of cross-sectional variation in the duration, size, and gains taken in sample Ponzi schemes. $invested is the estimate reported in most recent document filed by the SEC in connection with the case for the total contributed by investors. duration is calculated as the difference (in years) between the alleged start date of the scheme and the date of the first SEC filing. %taken is the estimated amount taken by the Ponzi perpetrator for personal use divided by $invested. affinitysum is the sum of four 0-1 variables on the presence of perpetrator-victim links based on religion, family or friends, ethnicity, and prior professional relationship. elderly is an indicator variable that equals one for schemes in which the perpetrator is alleged to target senior citizens. massmedia is a 0-1 variable if the Ponzi scheme is marketed through newspapers, the Internet, radio, etc.). incent is a 0-1 variable that equals one for schemes where the perpetrator retains commissioned recruiters or pays a fee for referrals. informal assumes a value of one for schemes where the perpetrator uses seminars, lunches, public presentations, and the like to attract victims. multperps is a 0-1 variable equal to one if multiple defendants are named in the SEC filing with the courts. rural equals one if the perpetrator resides in a rural location. prior takes on a value of one if the perpetrator has a prior conviction for a financial crime. post1999 is an indicator variable equal to one is the scheme terminates after calendar 1999. All estimates are based on samples defined by having available data to perform the estimation. The regression models in Panel B are based on Ordinary Least Squares estimation. Panel A: Pearson correlations between variables used in regression analysis (1) (2) (3) (4) (5) (6) (7) (8) (9) (10) (11) (12) DEPENDENT VARIABLES (1) ln ($invested) — (2) ln (duration) .33 — (3) % Taken
-.35 -.02 —
INDEPENDENT VARIABLES (4) affinitysum .09 .14 -.03 — (5) elderly -.01 .13 .02 -.00 — (6) massmedia .00 -.28 .02 -.02 -.05 — (7) incent .14 -.12 -.12 .01 .11 .18 — (8) informal .01 .02 .10 .06 .13 .07 .05 — (9) multperps .08 -.12 .04 -.02 .07 .12 .18 .10 — (10) rural .01 .08 .10 -.03 .05 -.02 -.08 .11 -.03 — (11) prior .03 -.18 .06 -.07 .00 .15 .17 .02 .13 .00 — (12) post1999 .06 .05 .03 .12 -.00 .27 .10 .14 -.07 .13 .16 —
36
Panel B: Multivariate analysis of factors influencing the duration, size, and perpetrator gains in Ponzi schemes DEPENDENT VARIABLE INDEPENDENT VARIABLES ln (duration) ln ($invested) % Taken by Perp Affinitysum .184** .249 -.011 Elderly .297** -.095 .010 Massmedia -.505*** .139 .018 Incent -.119 .475** -.078* Informal .006 -.038 .055 Multperps -.101 .234 .025 Rural .092 .099 .041 prior -.318*** -.072 .050 post1999 .270* .282 .010 Constant 1.039*** 16.021*** 5.14*** Adjusted R2 0.133 0.015 .010 N 349 357 277
37
Figure 1 Frequency of SEC-prosecuted Ponzi schemes by calendar quarter, 1988-2012
0&
5&
10&
15&
20&
1988
,01&
1989
,02&
1990
,03&
1991
,04&
1993
,01&
1994
,02&
1995
,03&
1996
,04&
1998
,01&
1999
,02&
2000
,03&
2001
,04&
2003
,01&
2004
,02&
2005
,03&
2006
,04&
2008
,01&
2009
,02&
2010
,03&
2011
,04&

38
APPENDIX Descriptions of Variables Collected for 376 Ponzi Scheme Cases
A. SCHEME SIZE, DURATION, & LOCATION AmtRais Total amount the scheme raised InvNum Total number of investors FundsTaken Amount of money purported to have been misappropriated by defendants VStartDt Violation begin date VEndDt Violation end date Metro Is the primarily location of the scheme in a large metropolitan area (cities
with a total population >100,000 OR >1,000 people per square mile) Area Was the scheme national (N), regional (R), or local (L) in scope? CrossBorder Was the scheme recognized as international in scope by the SEC?
B. DEFENDANT CHARACTERISTICS Prior Prior convictions, if any: (0, 1): (False, True) AgeAtStart Schemer's Age at initial perpetration Ethnicity Schemer's ethnicity Immigrant(Y/N) Is the schemer an immigrant (1, if yes) PrimaryResidence Location of the schemer's primary residence (text variable)
C. VICTIM CHARACTERISTICS (1 if yes) FamilyFriends Scheme targeted family or friends Professional Scheme targeted professional networks (i.e. fireman, physicians, etc.) Religion Scheme targeted victims based on religion Ethnic Scheme targeted victims based on ethnicity or country of origin Elderly Scheme targeted victims who were elderly Clients Schemer targeted clients from an alternative legitimate business
D. MARKETING METHODS (1 if yes) Website Was a website used as a promotion tool? Referral Reward Did the schemer pay for referrals of additional victims? Public Events Did the schemer use public events (e.g., seminars) to attract victims? MassMedia Did the schemer use mass media (e.g., the internet, newspapers, radio)? Recruiters Did the schemer employ commissioned recruiters? Investment Type Type of investment that was proposed (text variable)
E. NATURE OF SEC ALLEGATIONS (1 if yes; 0 otherwise) PTrailStat Is there a paper trail of statements to use as evidence? MisRepStrat Is there an accusation of misrepresentation of investment strategy? FailDisc Is there an accusation of failure to disclose criminal history? MisRepSafe Is there an accusation of misrepresentation of investment (risk) safety? FalseStat Is there an accusation of falsely "audited" statements? FalseDocs Is there an accusation of falsification of loan documents, assets, etc? Misapp Is there an accusation of misappropriation? Fraud Return Is there an accusation of fraudulent high returns?
F. PROMISED RETURNS & REQUIRED HOLDING PERIODS LowNomil% Low nominal % return promised HighNomil% High nominal % return promised MonthsHoldingLength Length of minimum holding period, if applicable