who is byd?
TRANSCRIPT
www.TransformingTransportation.org
Who is BYD?
Adalberto Maluf, Director of Marketing and Governmental Affairs, BYDPresented at Transforming Transportation 2017

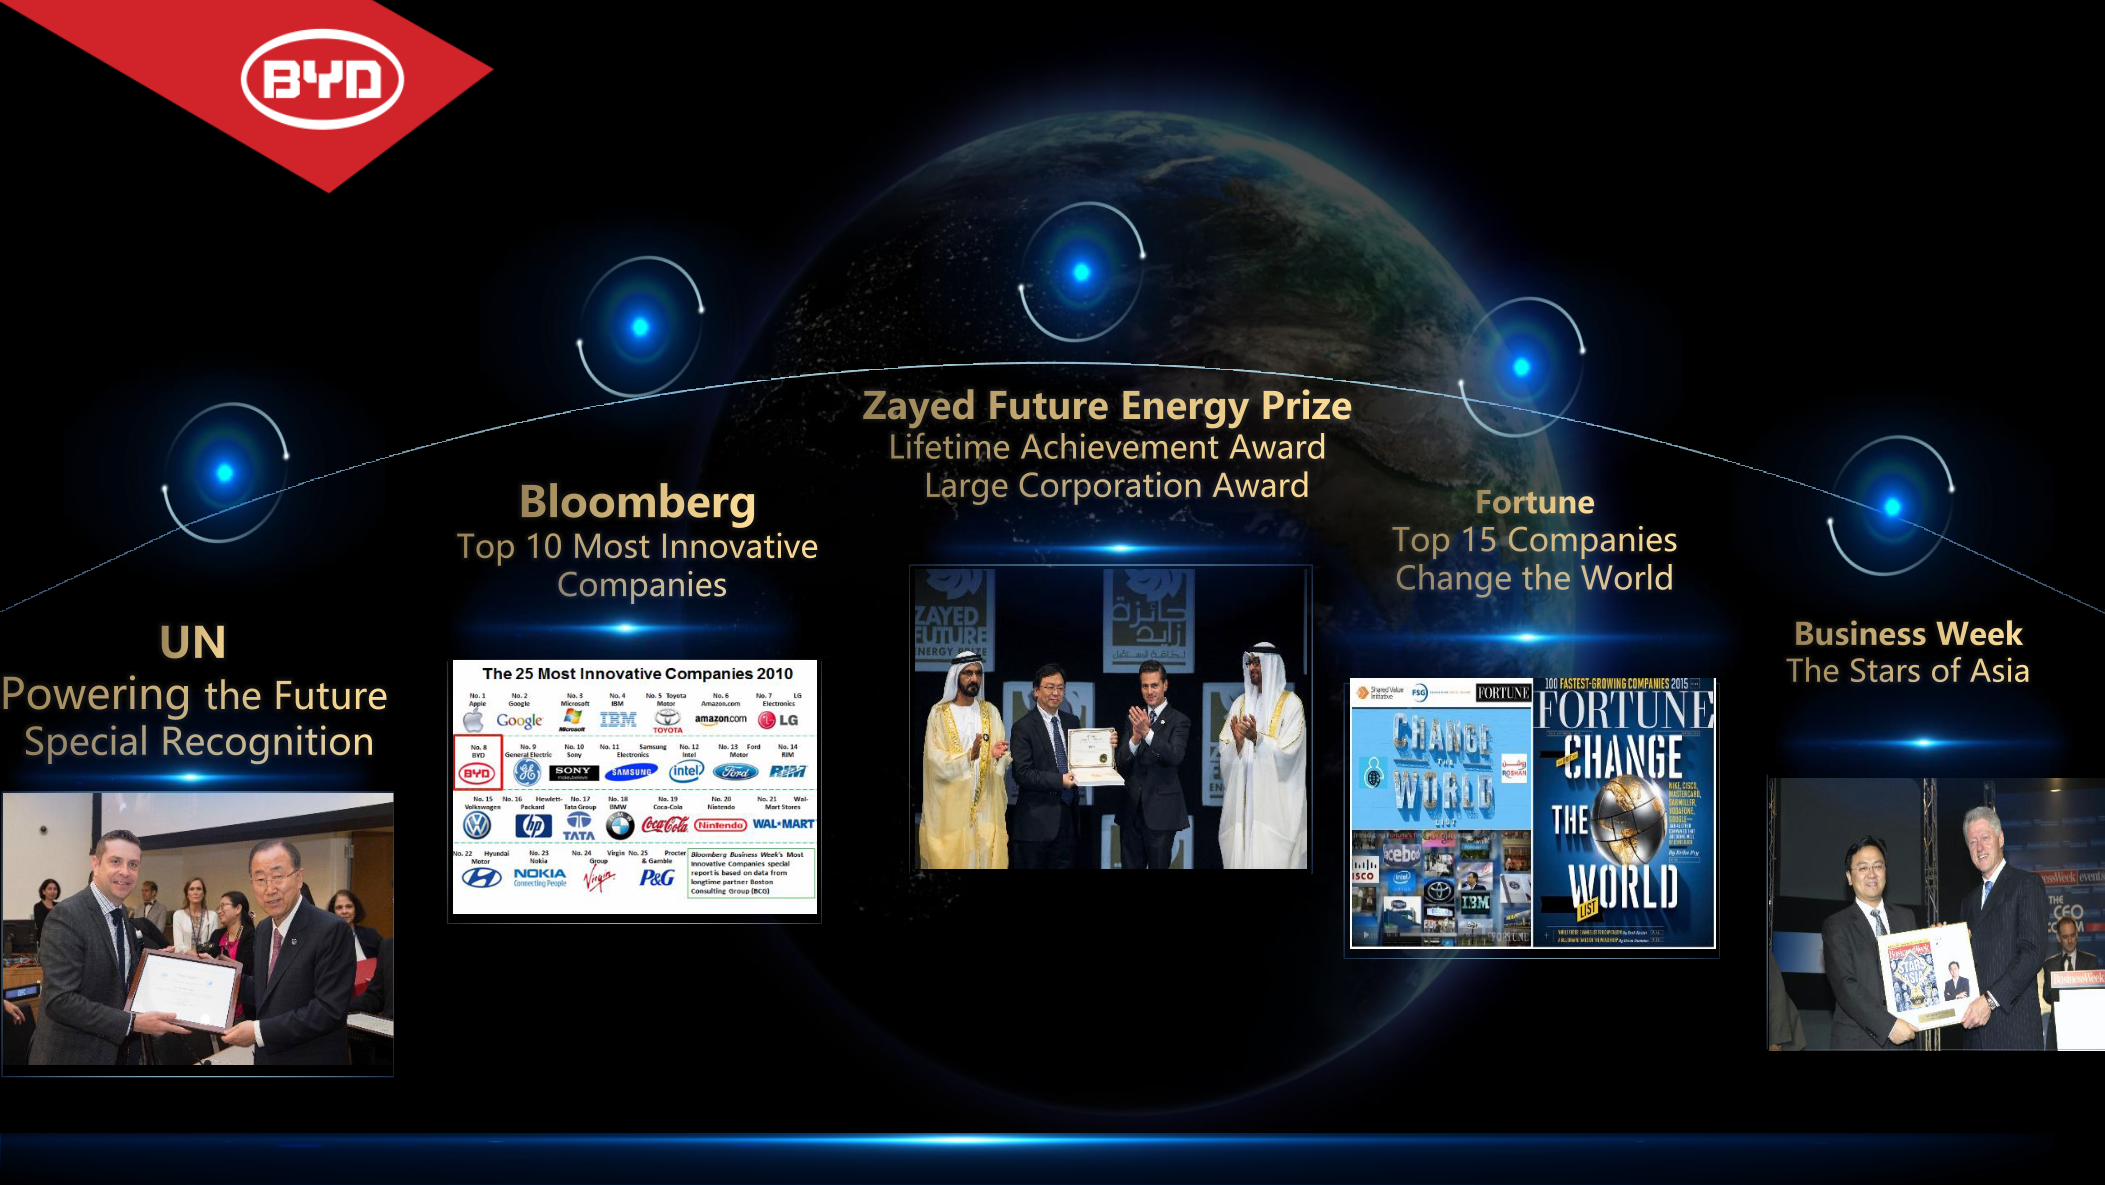
WHO IS BYD?Build Your Dream
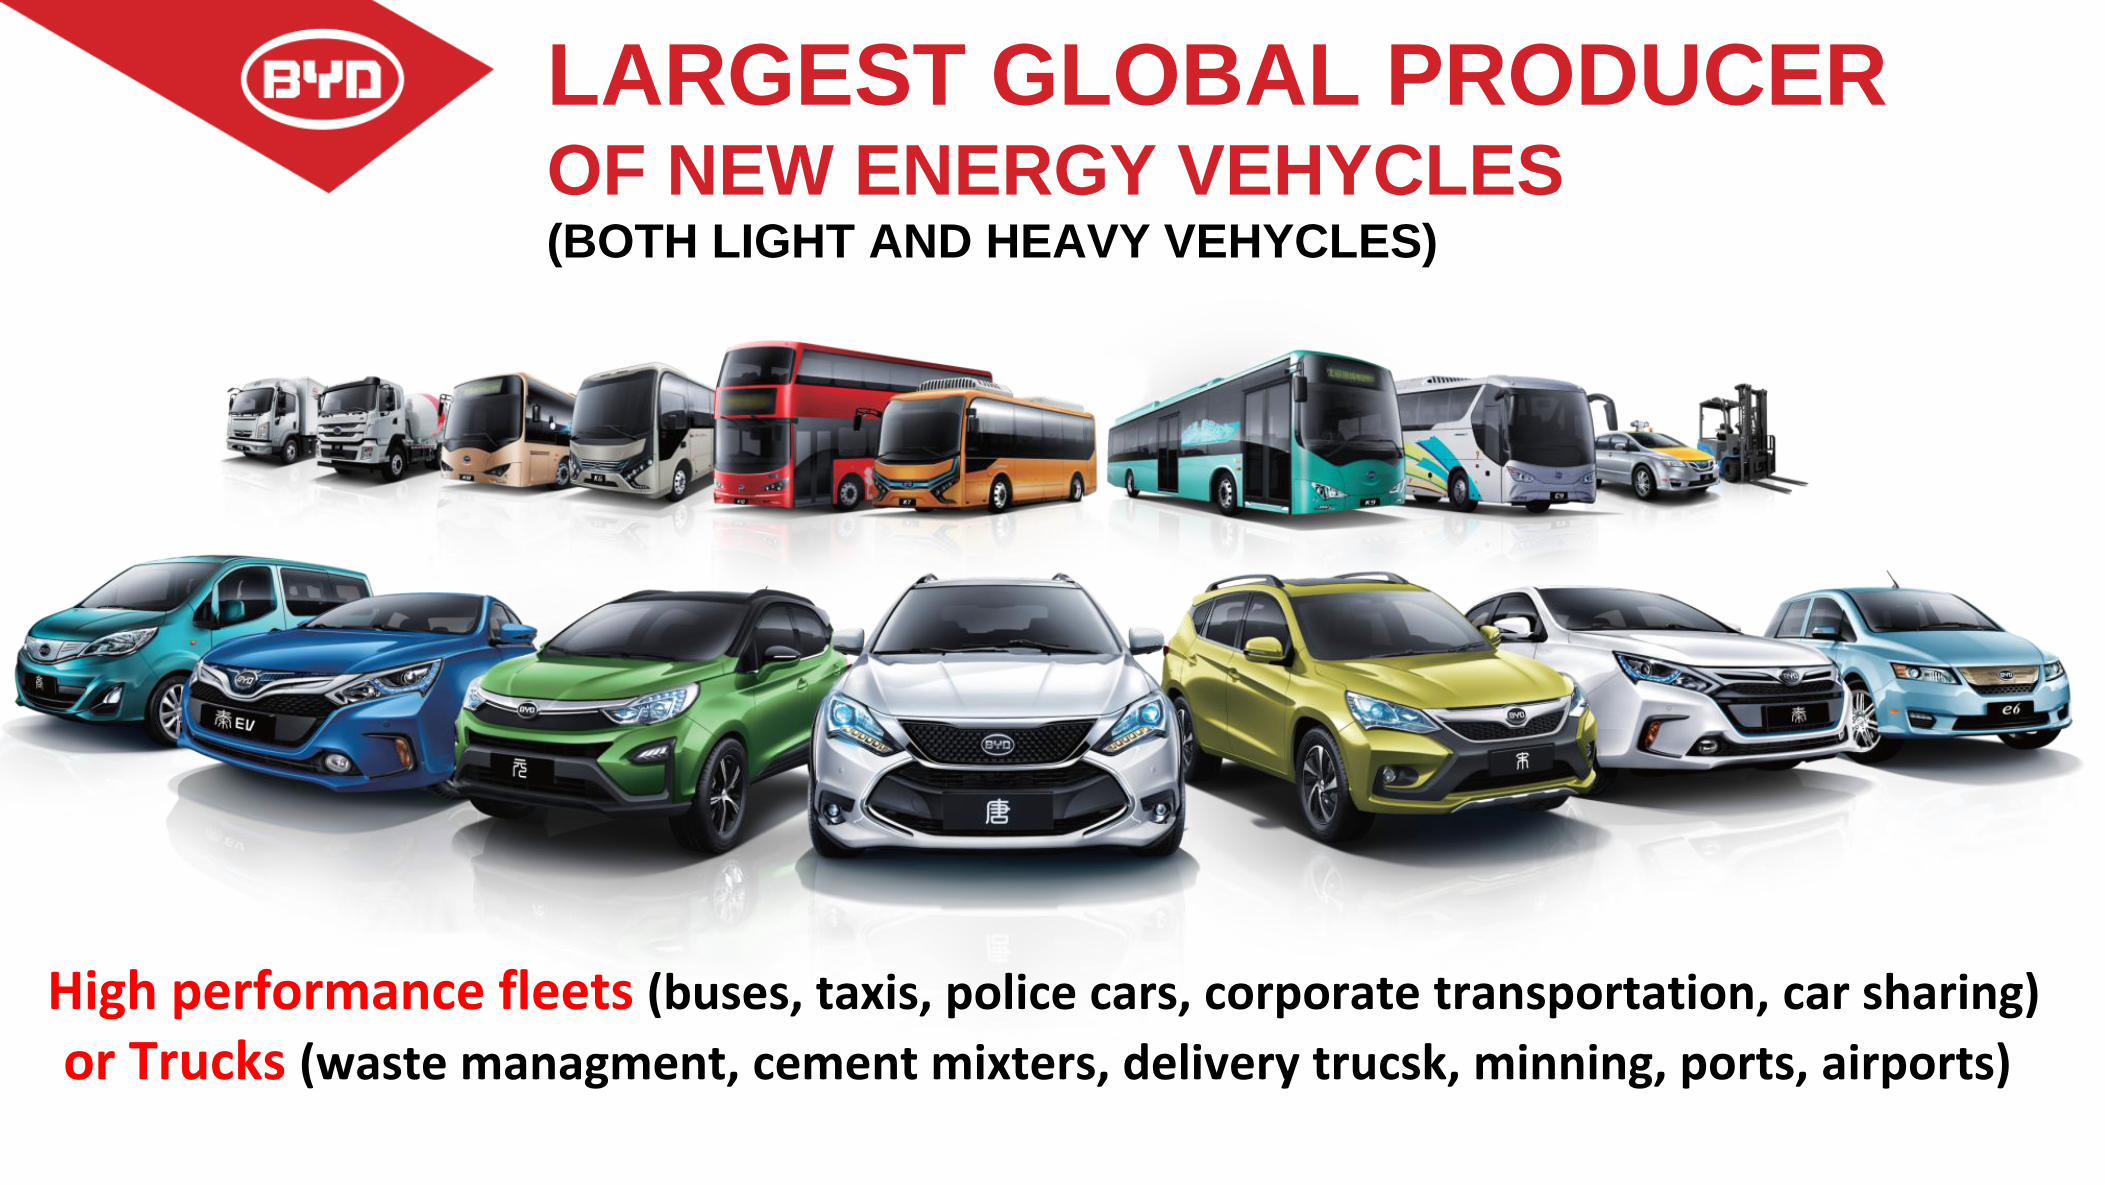
LARGEST GLOBAL PRODUCEROF NEW ENERGY VEHYCLES(BOTH LIGHT AND HEAVY VEHYCLES)
High performance fleets (buses, taxis, police cars, corporate transportation, car sharing)
or Trucks (waste managment, cement mixters, delivery trucsk, minning, ports, airports)

WHERE TO START?
Cars7%
Taxis1%
Buses43%
Motorbikes25%
Small Trucks8%
Large Trucks16%
PM2.5
EMISSION OF PARTICULATE MATTERS (PM2.5)
Source: Instituto do Ar Limpo – América Latina (Clean Air Institute for Latin America)
Taxis and buses are less than 0,01% of
vehycles butrepresent 44% of
PM emissions
Huge Impact onPublic Health and Quality of living
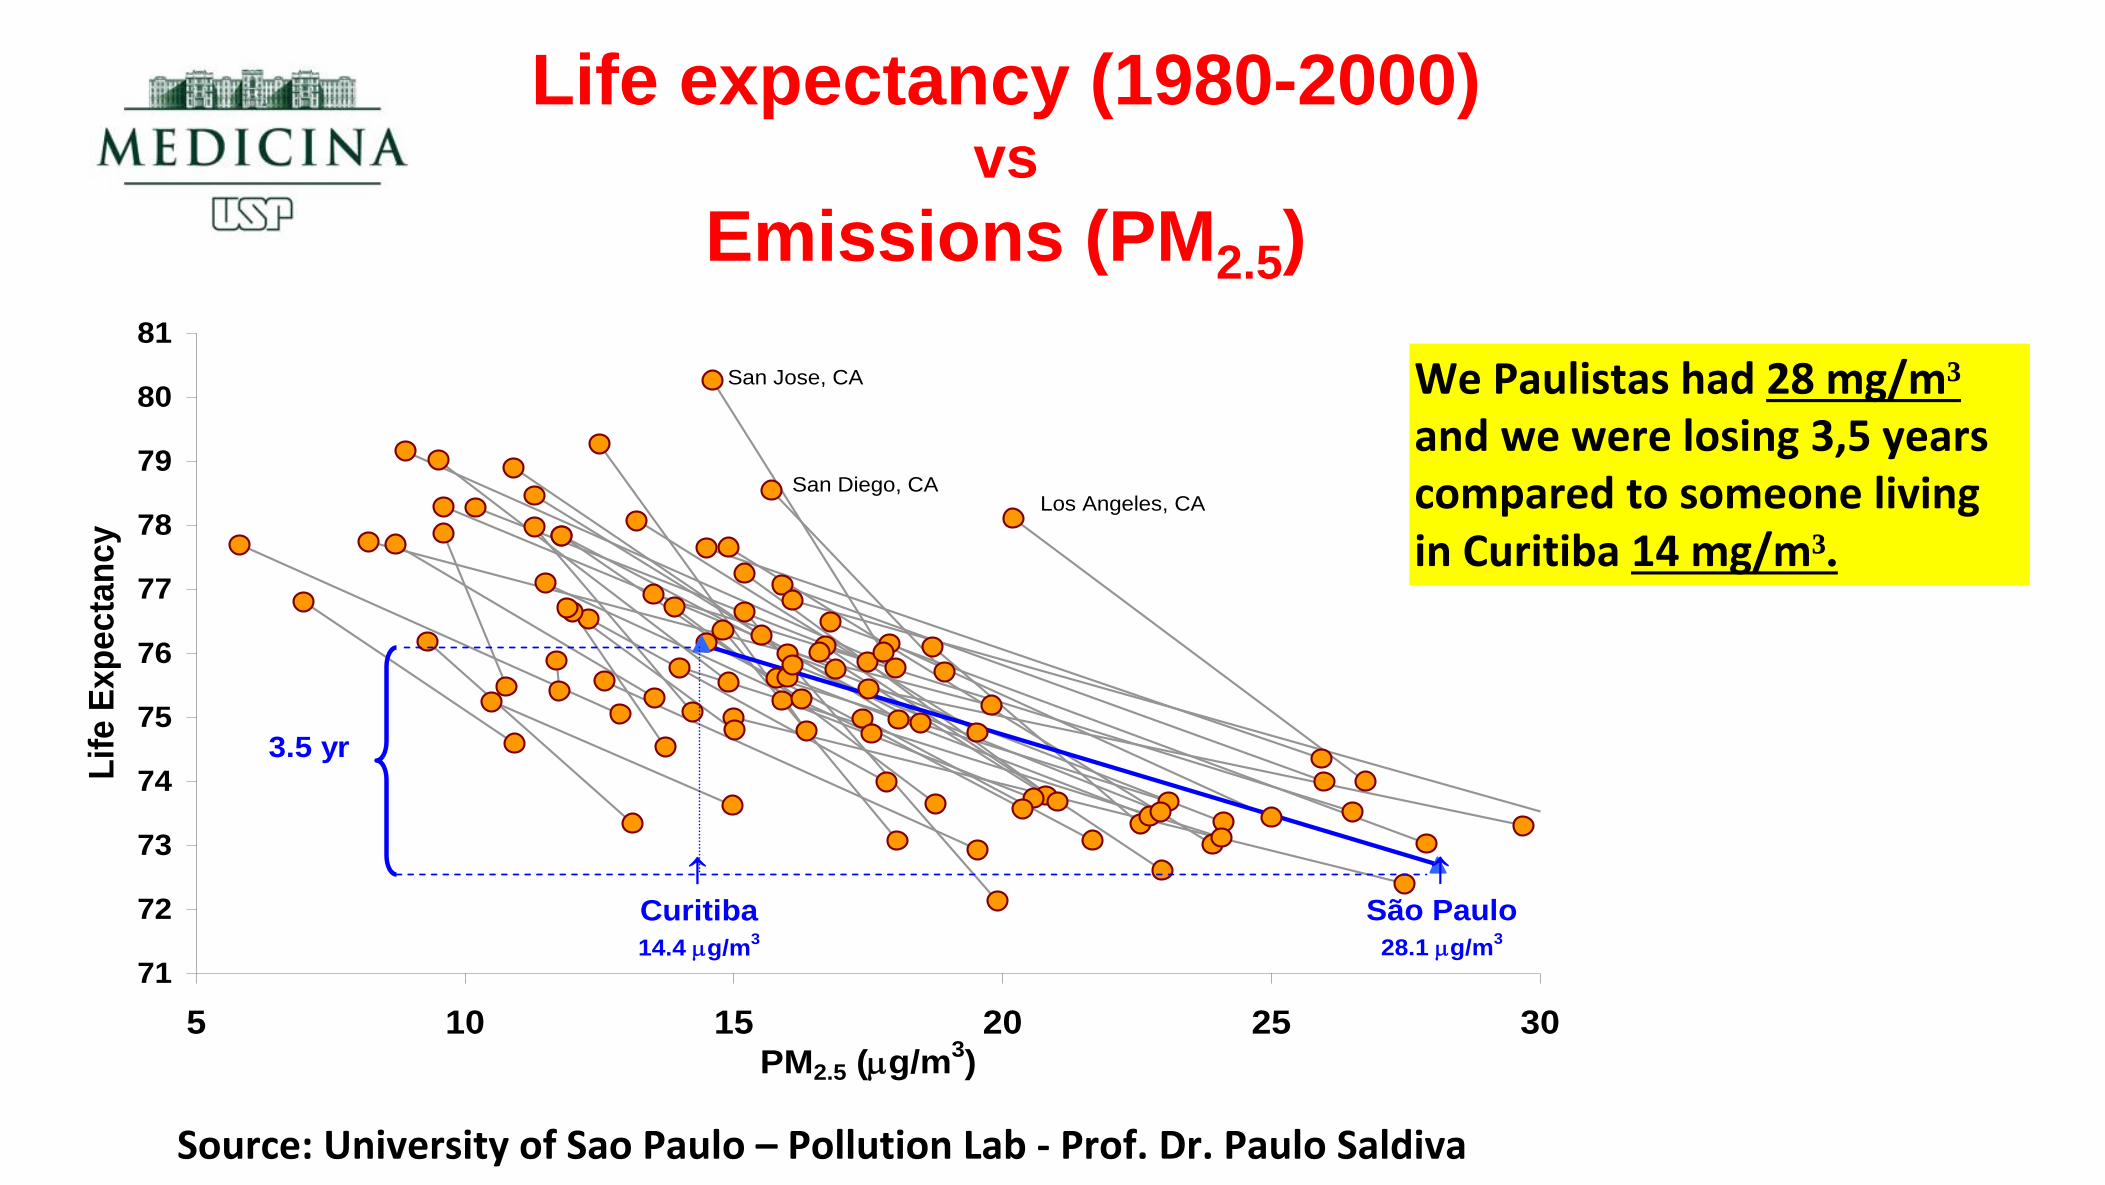
Source: University of Sao Paulo – Pollution Lab - Prof. Dr. Paulo Saldiva
71
72
73
74
75
76
77
78
79
80
81
5 10 15 20 25 30
PM2.5 (mg/m3)
Lif
e E
xp
ecta
ncy
Los Angeles, CA
San Jose, CA
San Diego, CA
São Paulo
28.1 mg/m3
Curitiba
14.4 mg/m3
3.5 yr
Life expectancy (1980-2000) vs
Emissions (PM2.5)
We Paulistas had 28 mg/m³
and we were losing 3,5 yearscompared to someone living in Curitiba 14 mg/m³.
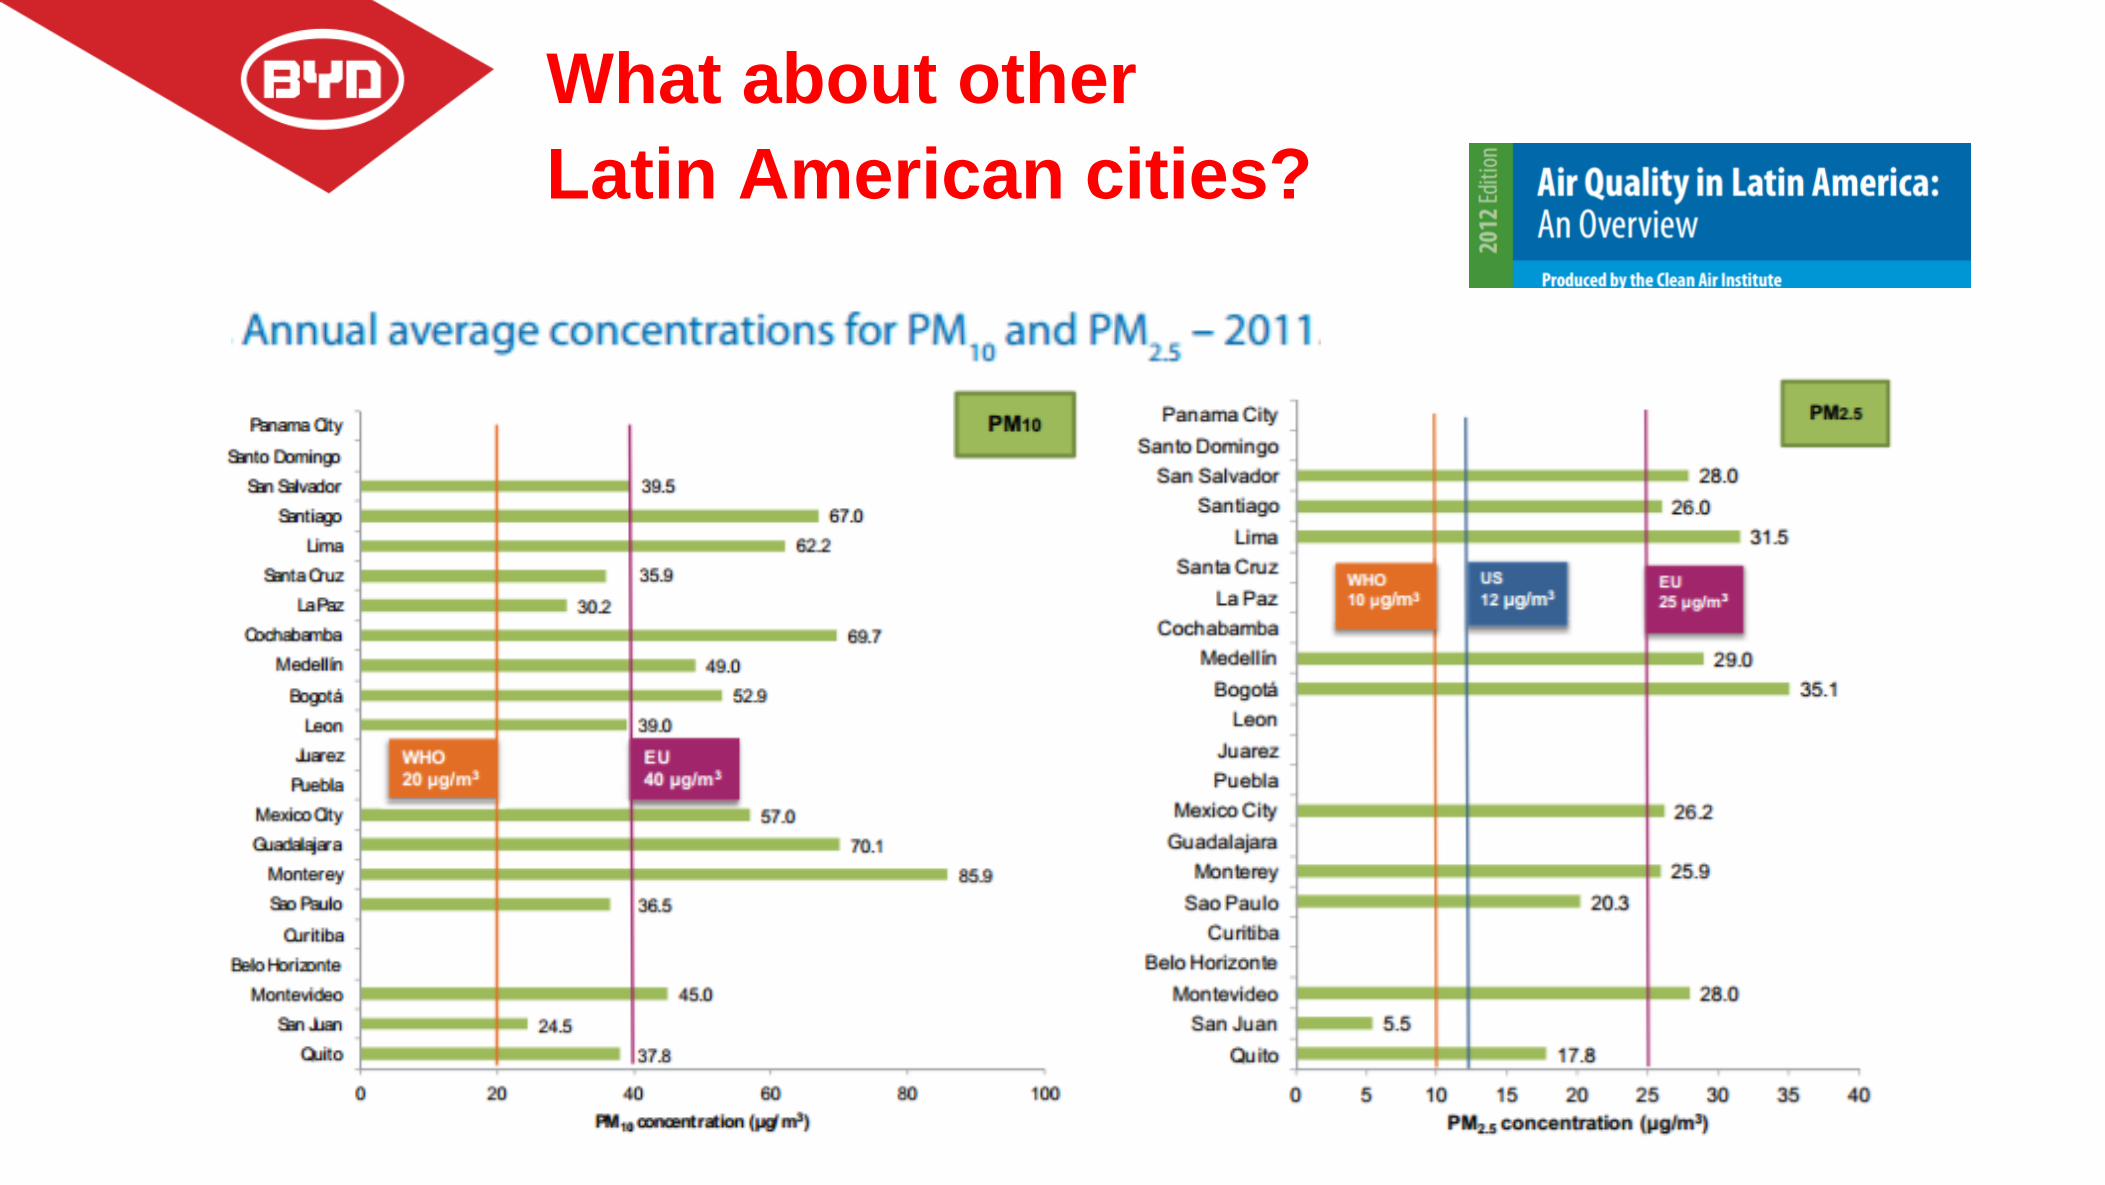
What about other
Latin American cities?
Canada
Malaysia
Australia
Singapore
USA
Cuba
Mexico
Colombia
Brazil
Chile
Uruguay
China
India
Sri Lanka
England
Spain
GermanyNetherlands
Belgium
Italy
Poland
Slovakia
Hungary
Austria
Romania
Turkey
Serbia
Israel
Japan
ThailandAruba
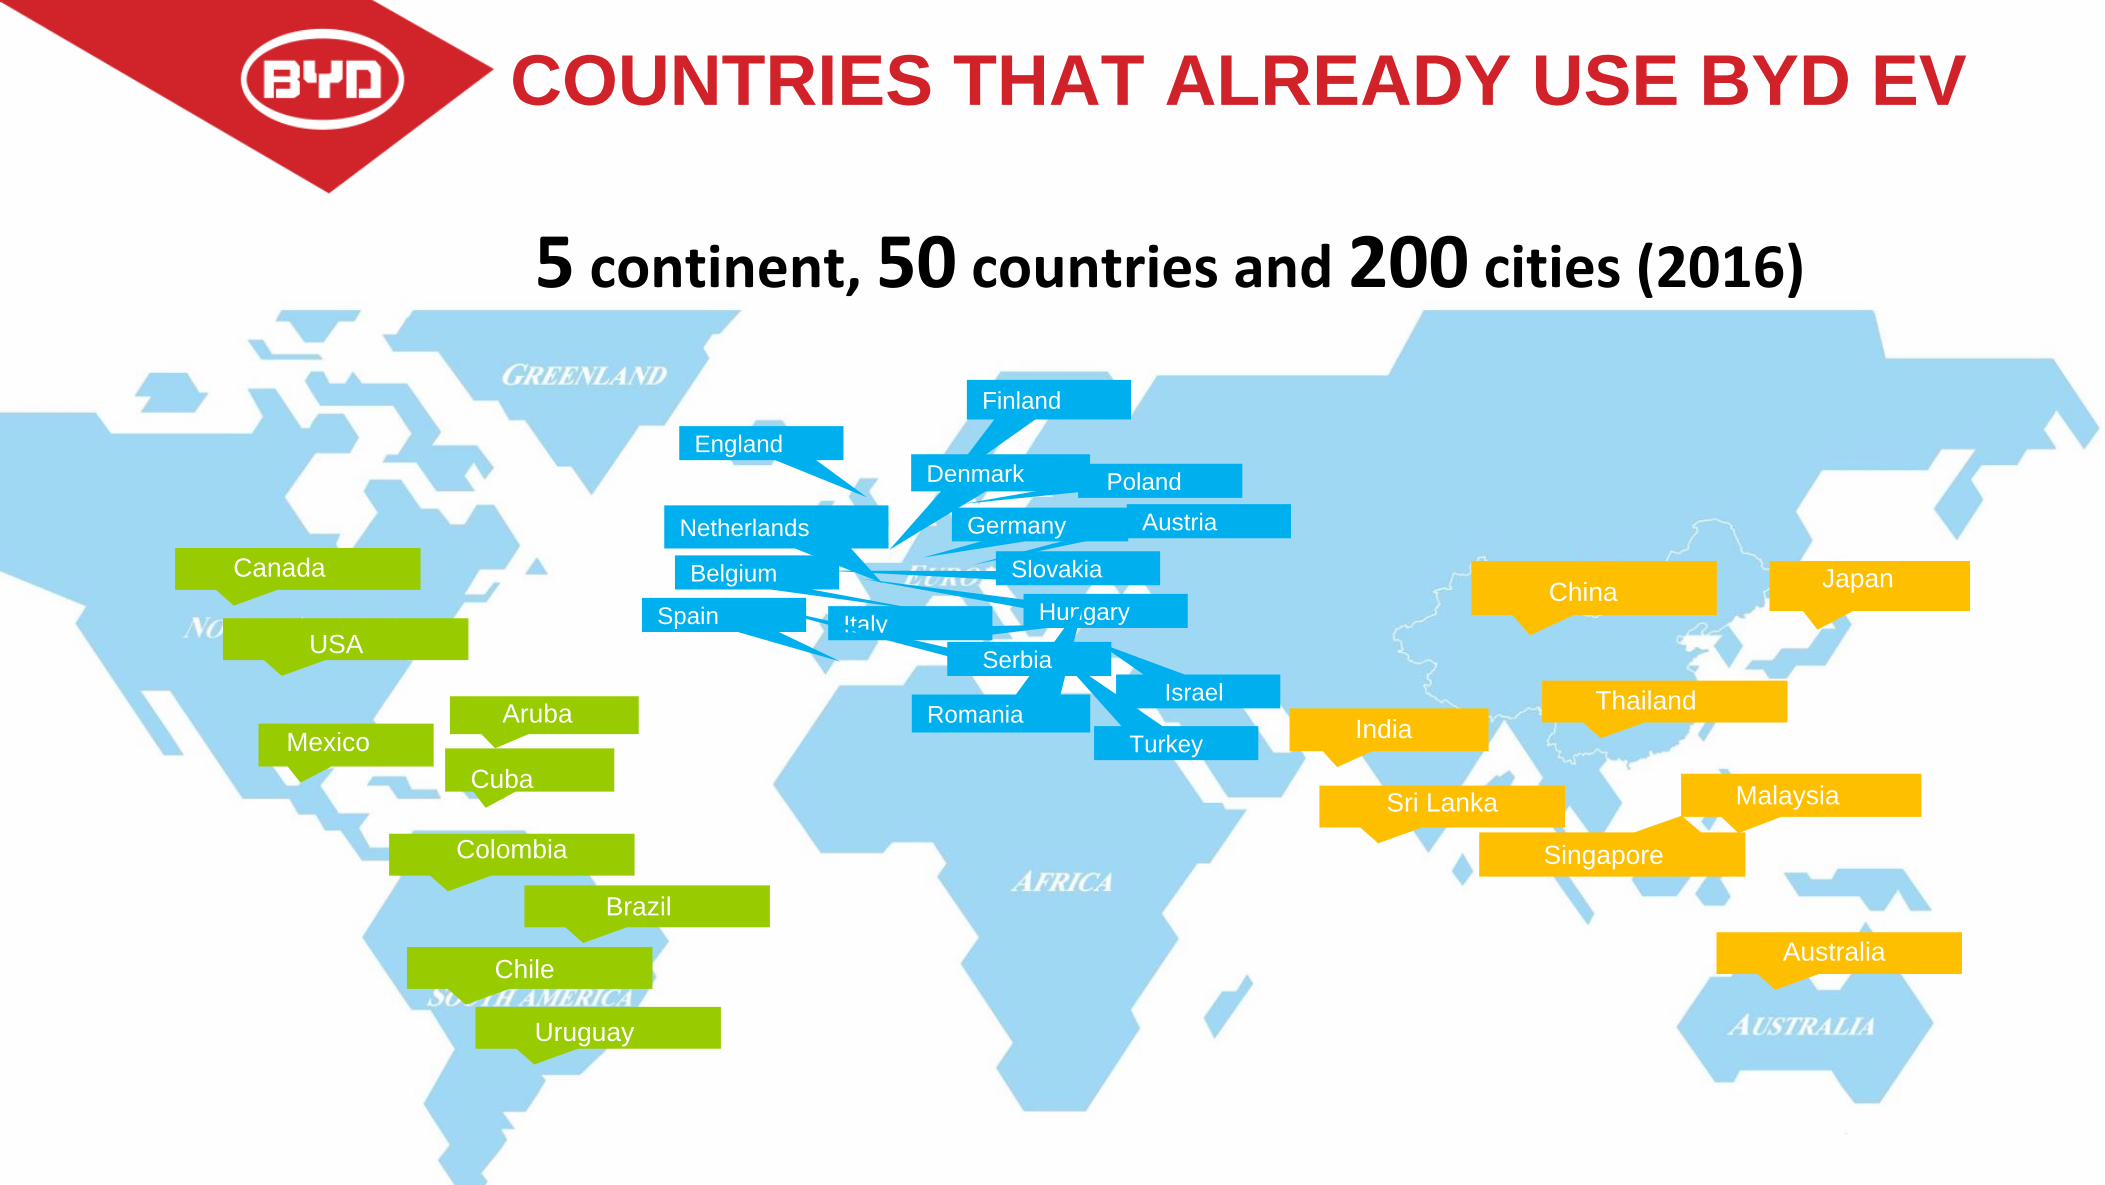
COUNTRIES THAT ALREADY USE BYD EV
5 continent, 50 countries and 200 cities (2016)
Finland
Denmark
Hong KongNanjing
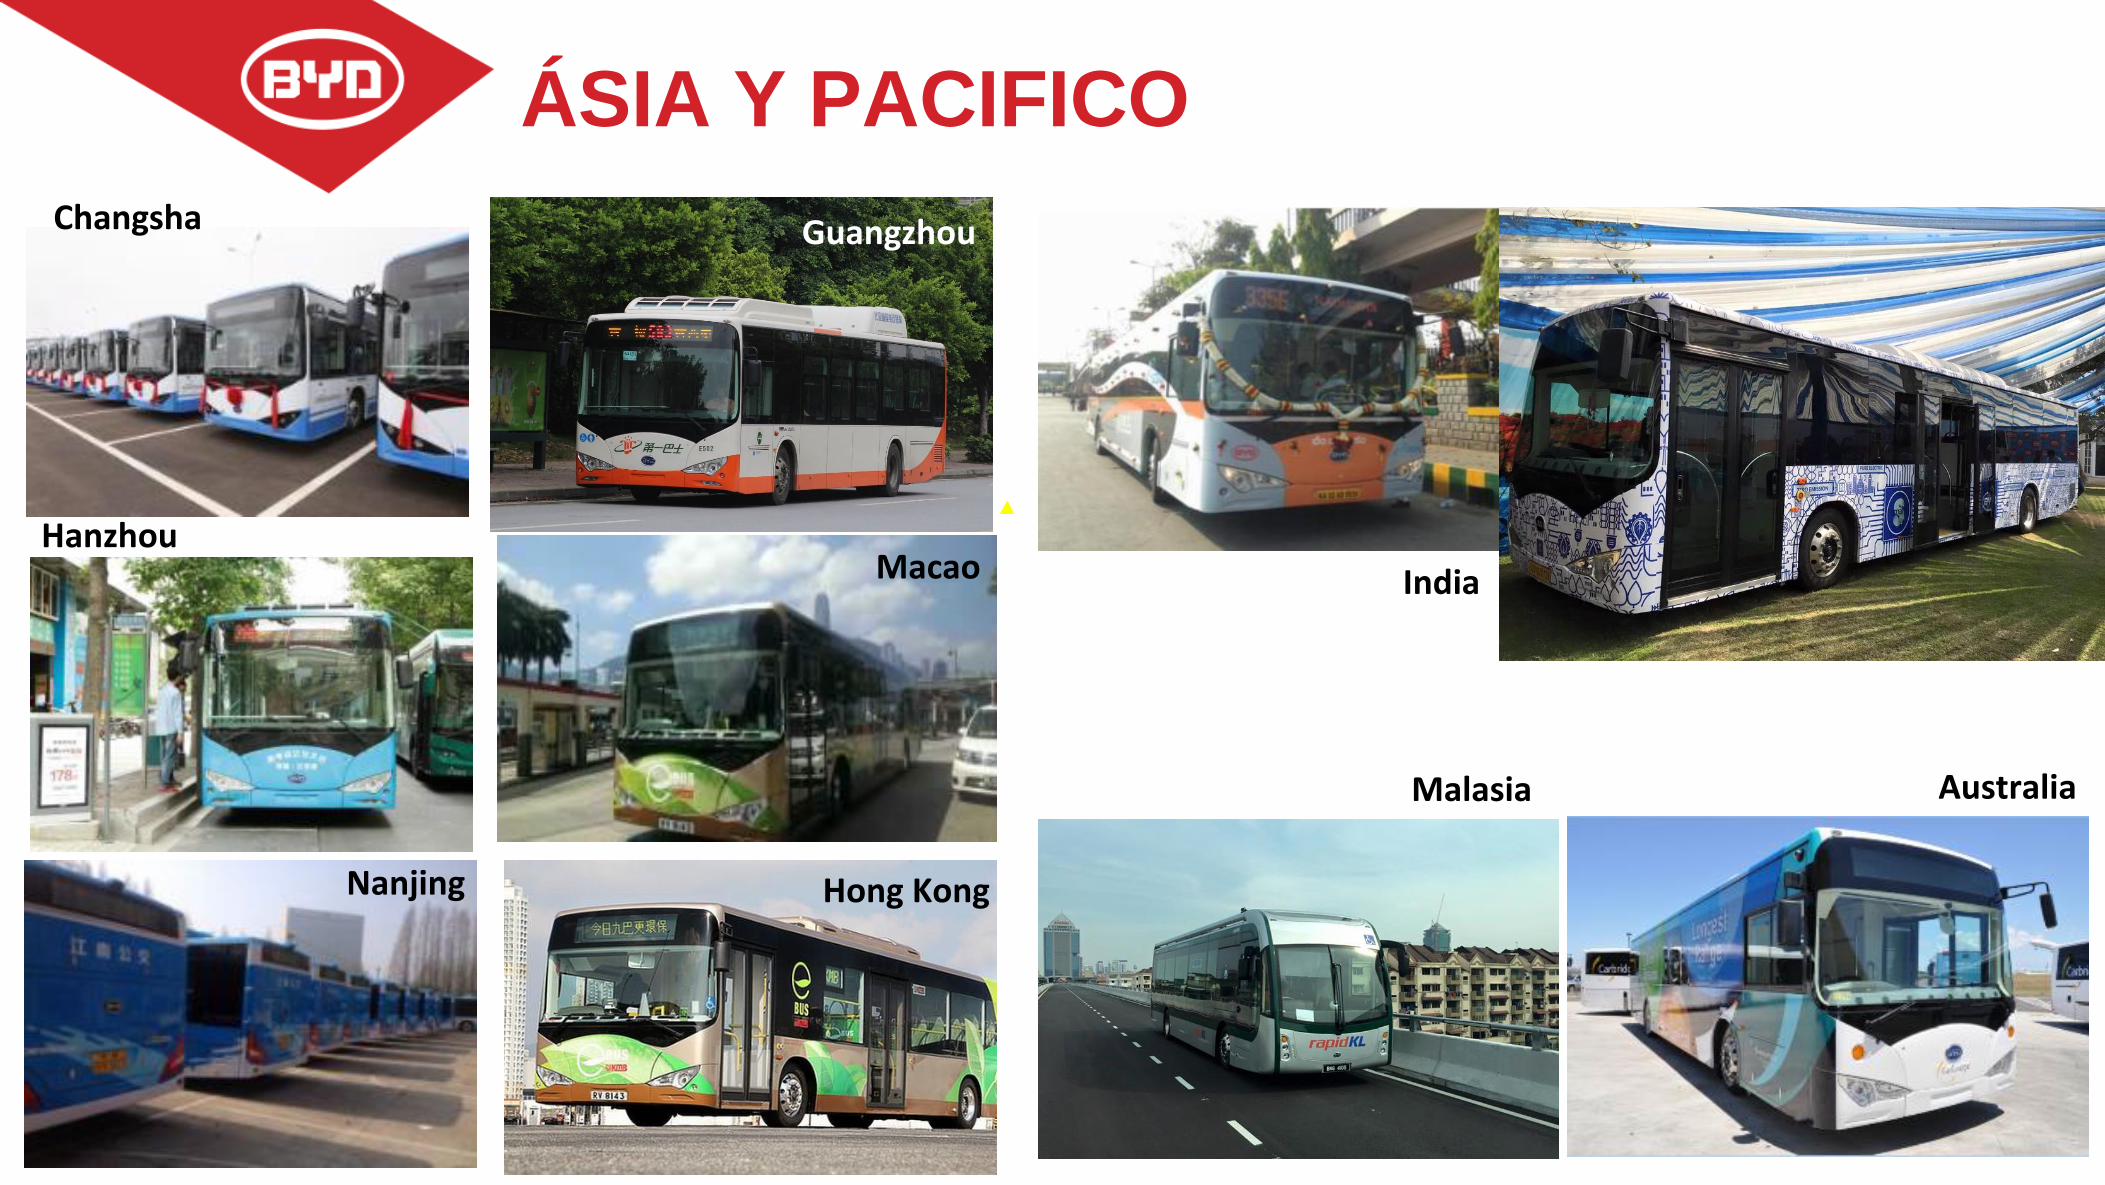
India
Malasia Australia
ÁSIA Y PACIFICO
TaiwanChangsha
HanzhouMacao
Guangzhou
Hong Kong
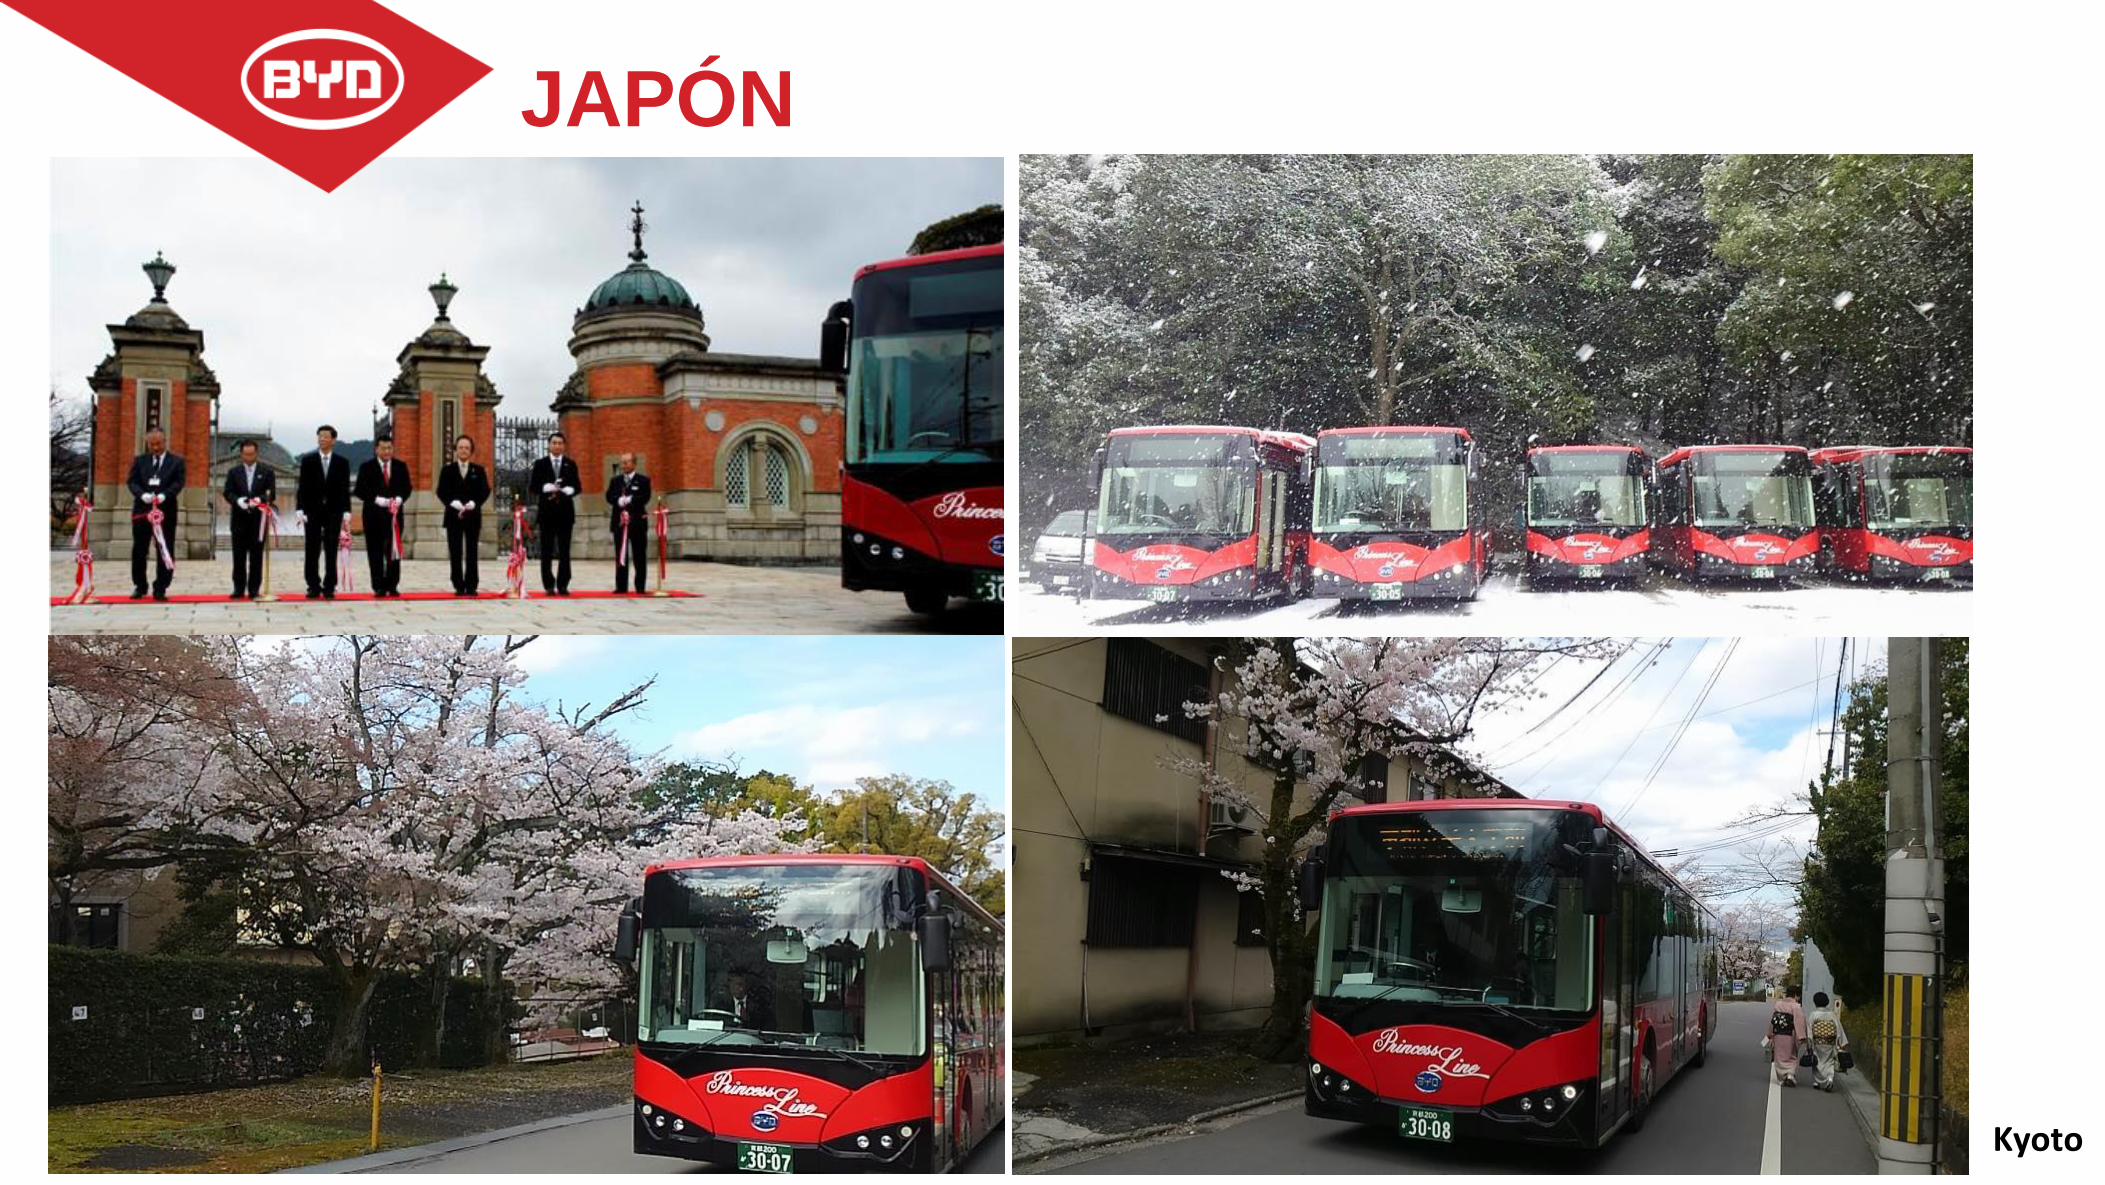
Kyoto
JAPÓN
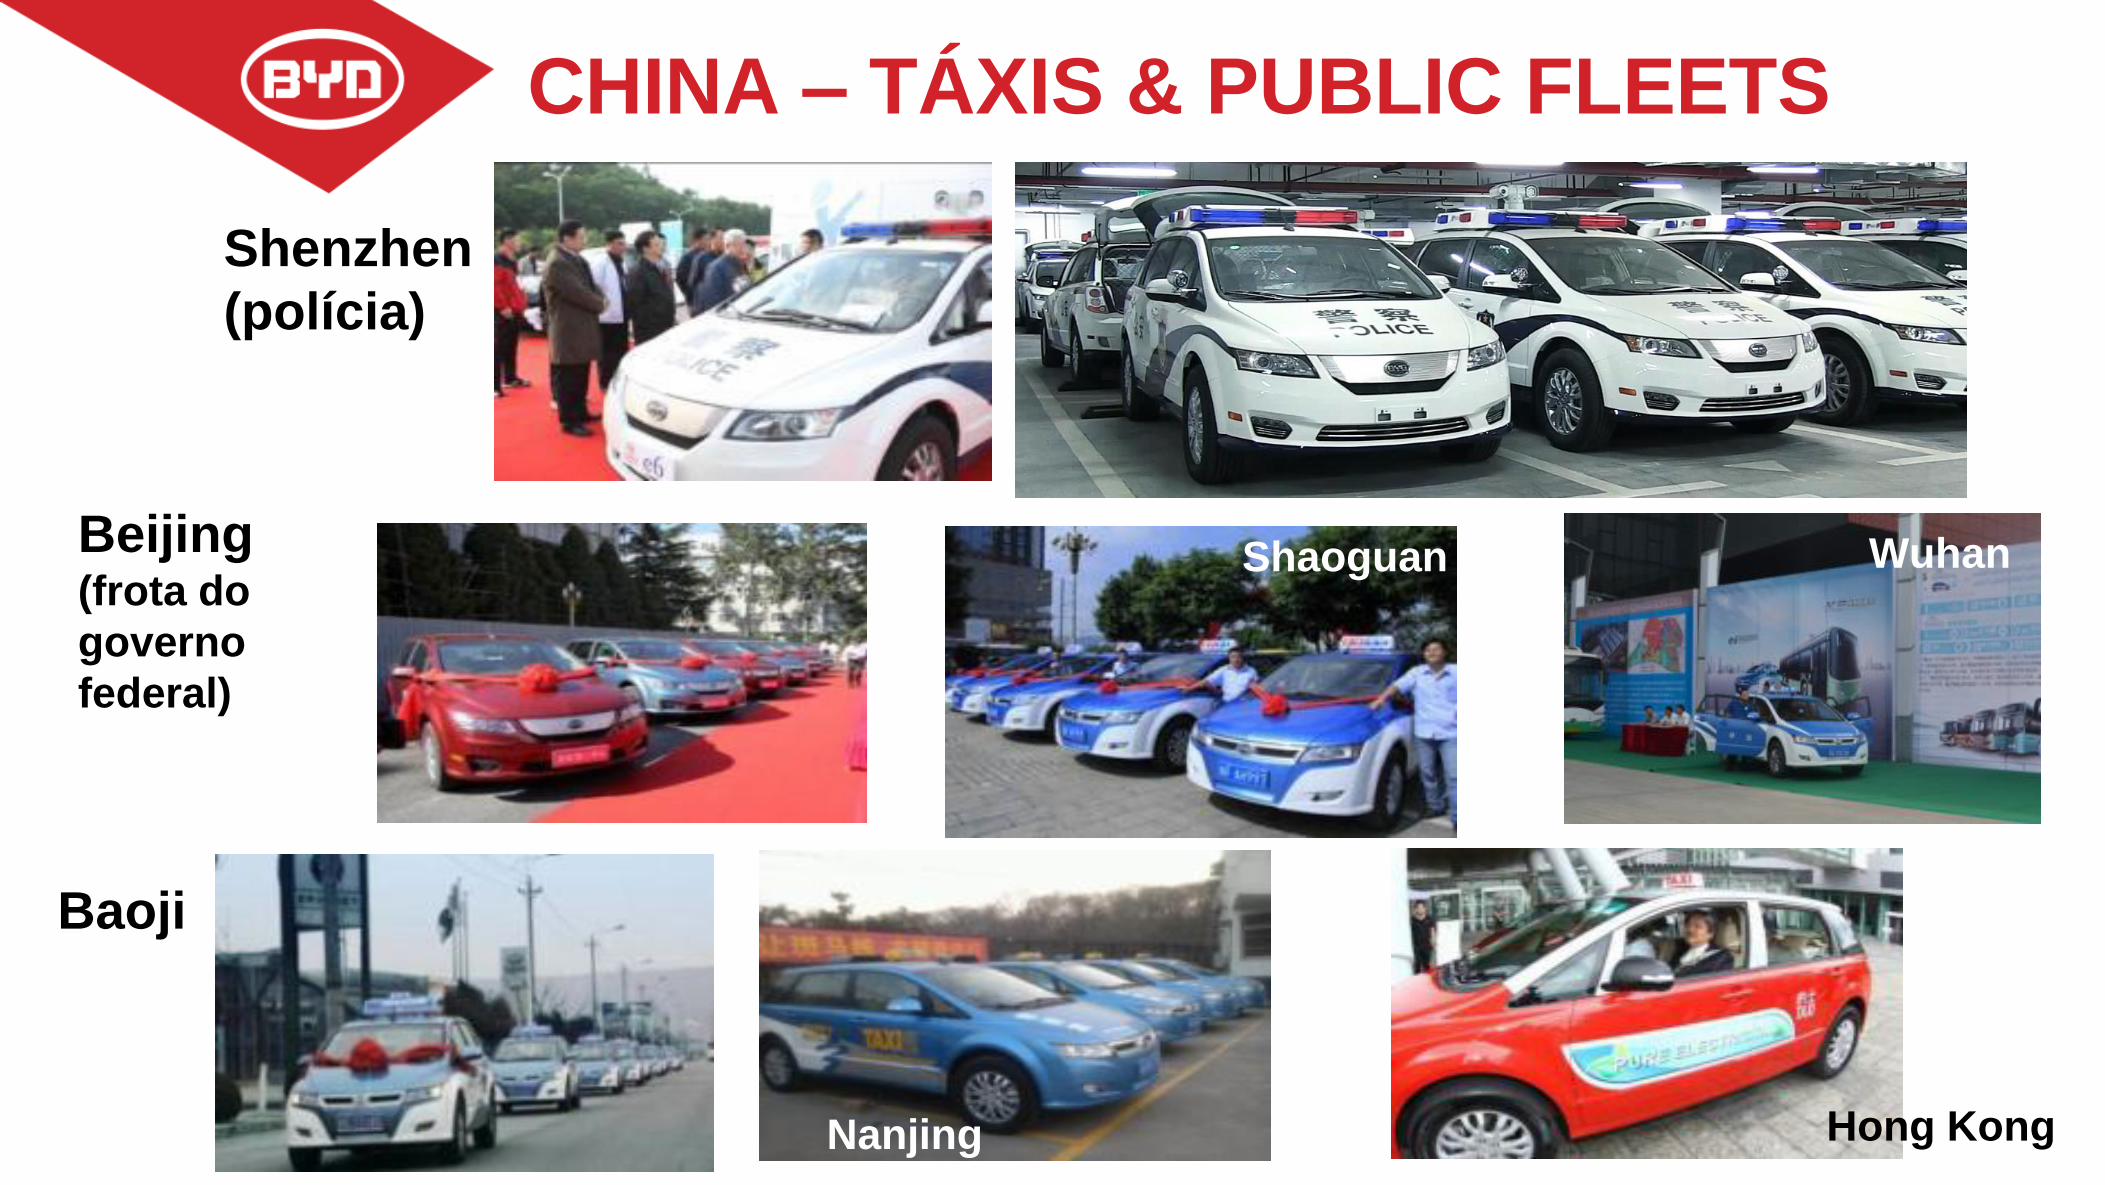
Shenzhen
(polícia)
Beijing(frota do
governo
federal)
Baoji
Hong Kong
Shaoguan
Nanjing
CHINA – TÁXIS & PUBLIC FLEETS
Wuhan

London
EUROPE
Roterdã
Bruxelas - BYD won tender for European Union
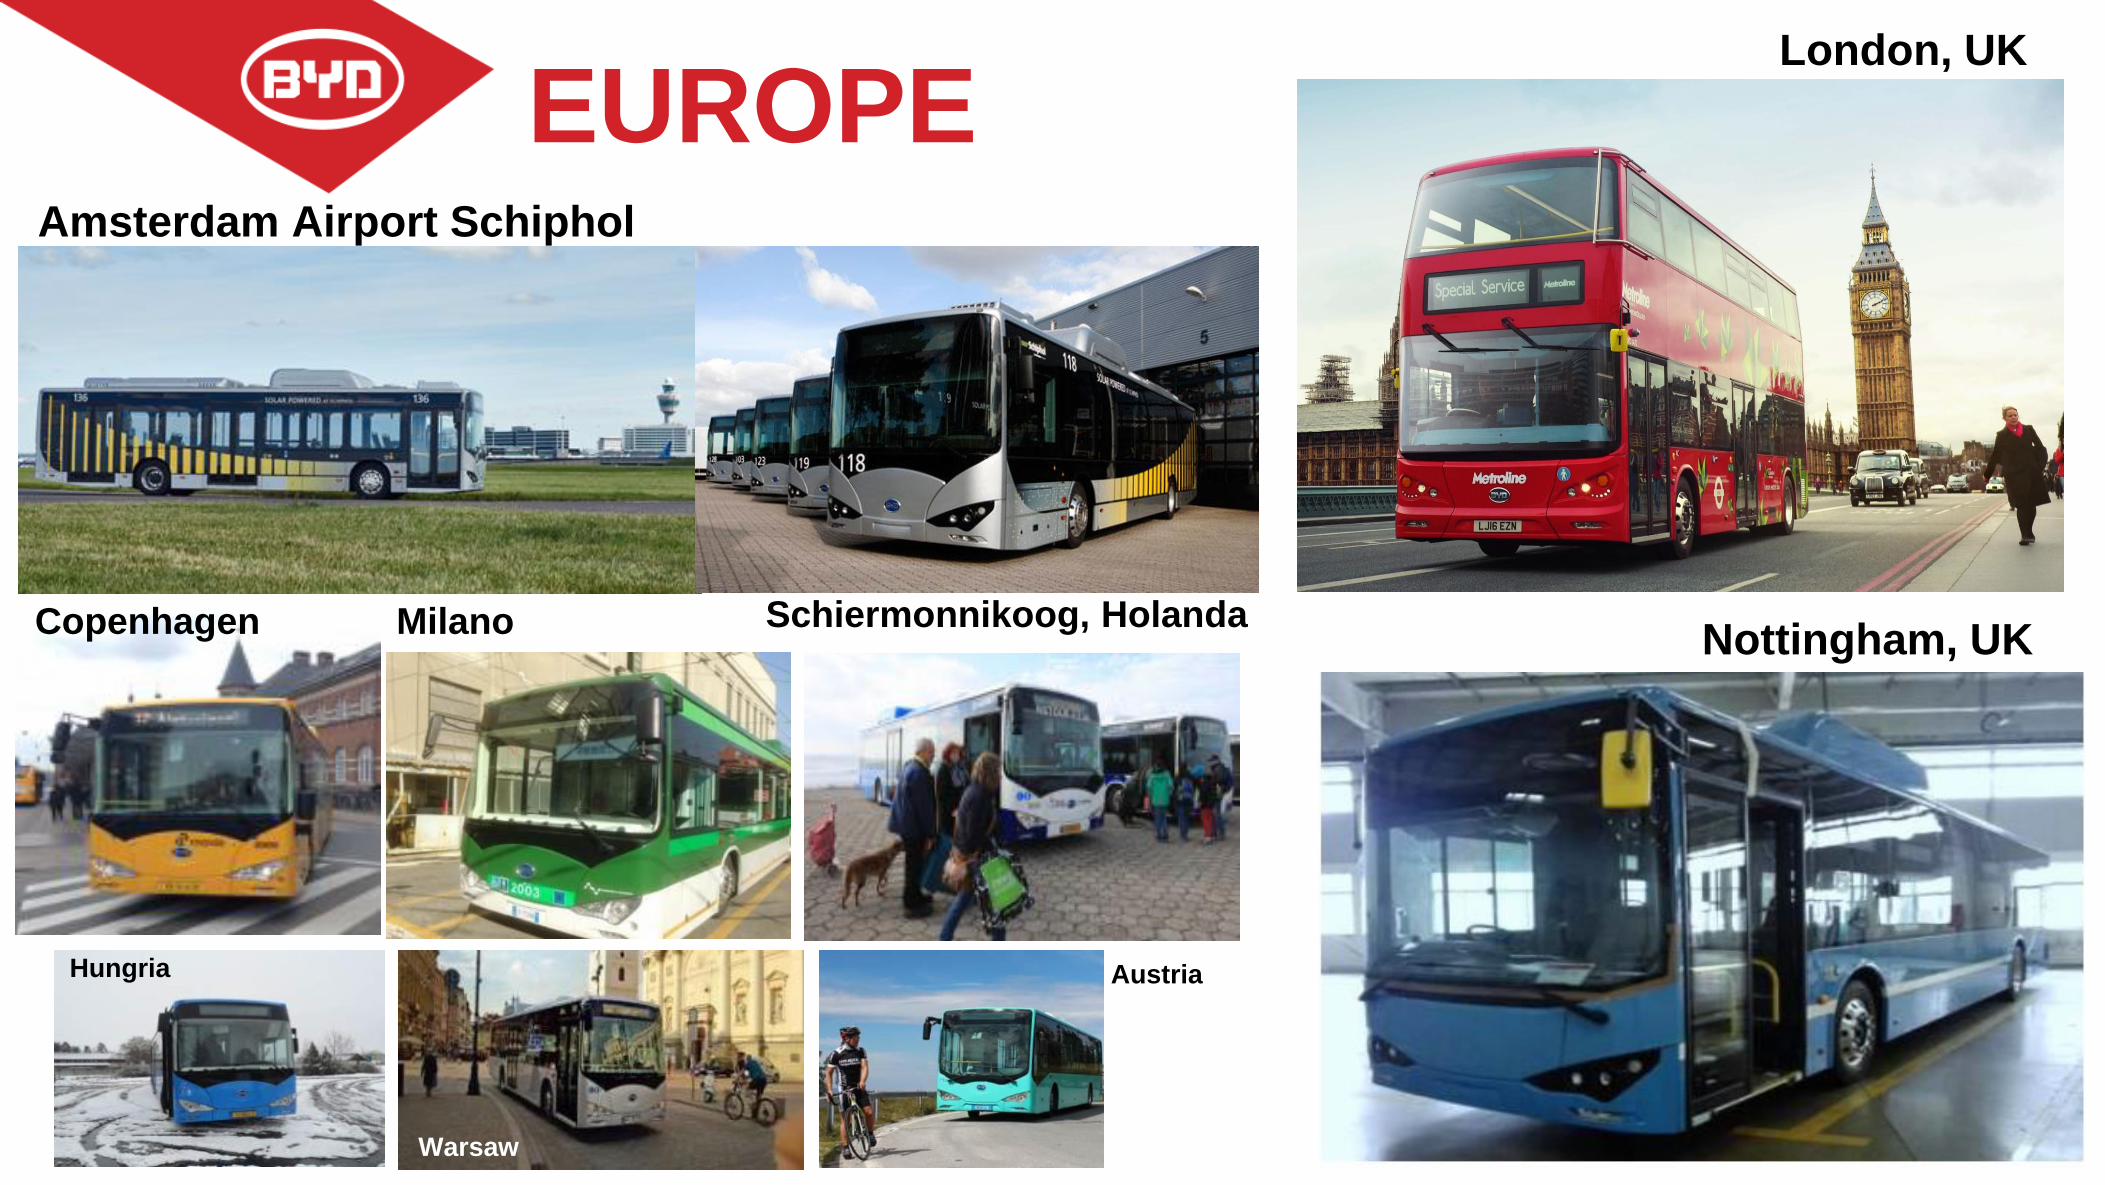
Schiermonnikoog, Holanda
Amsterdam Airport Schiphol
London, UK
EUROPE
MilanoCopenhagen
Hungria
Warsaw
Austria
Nottingham, UK
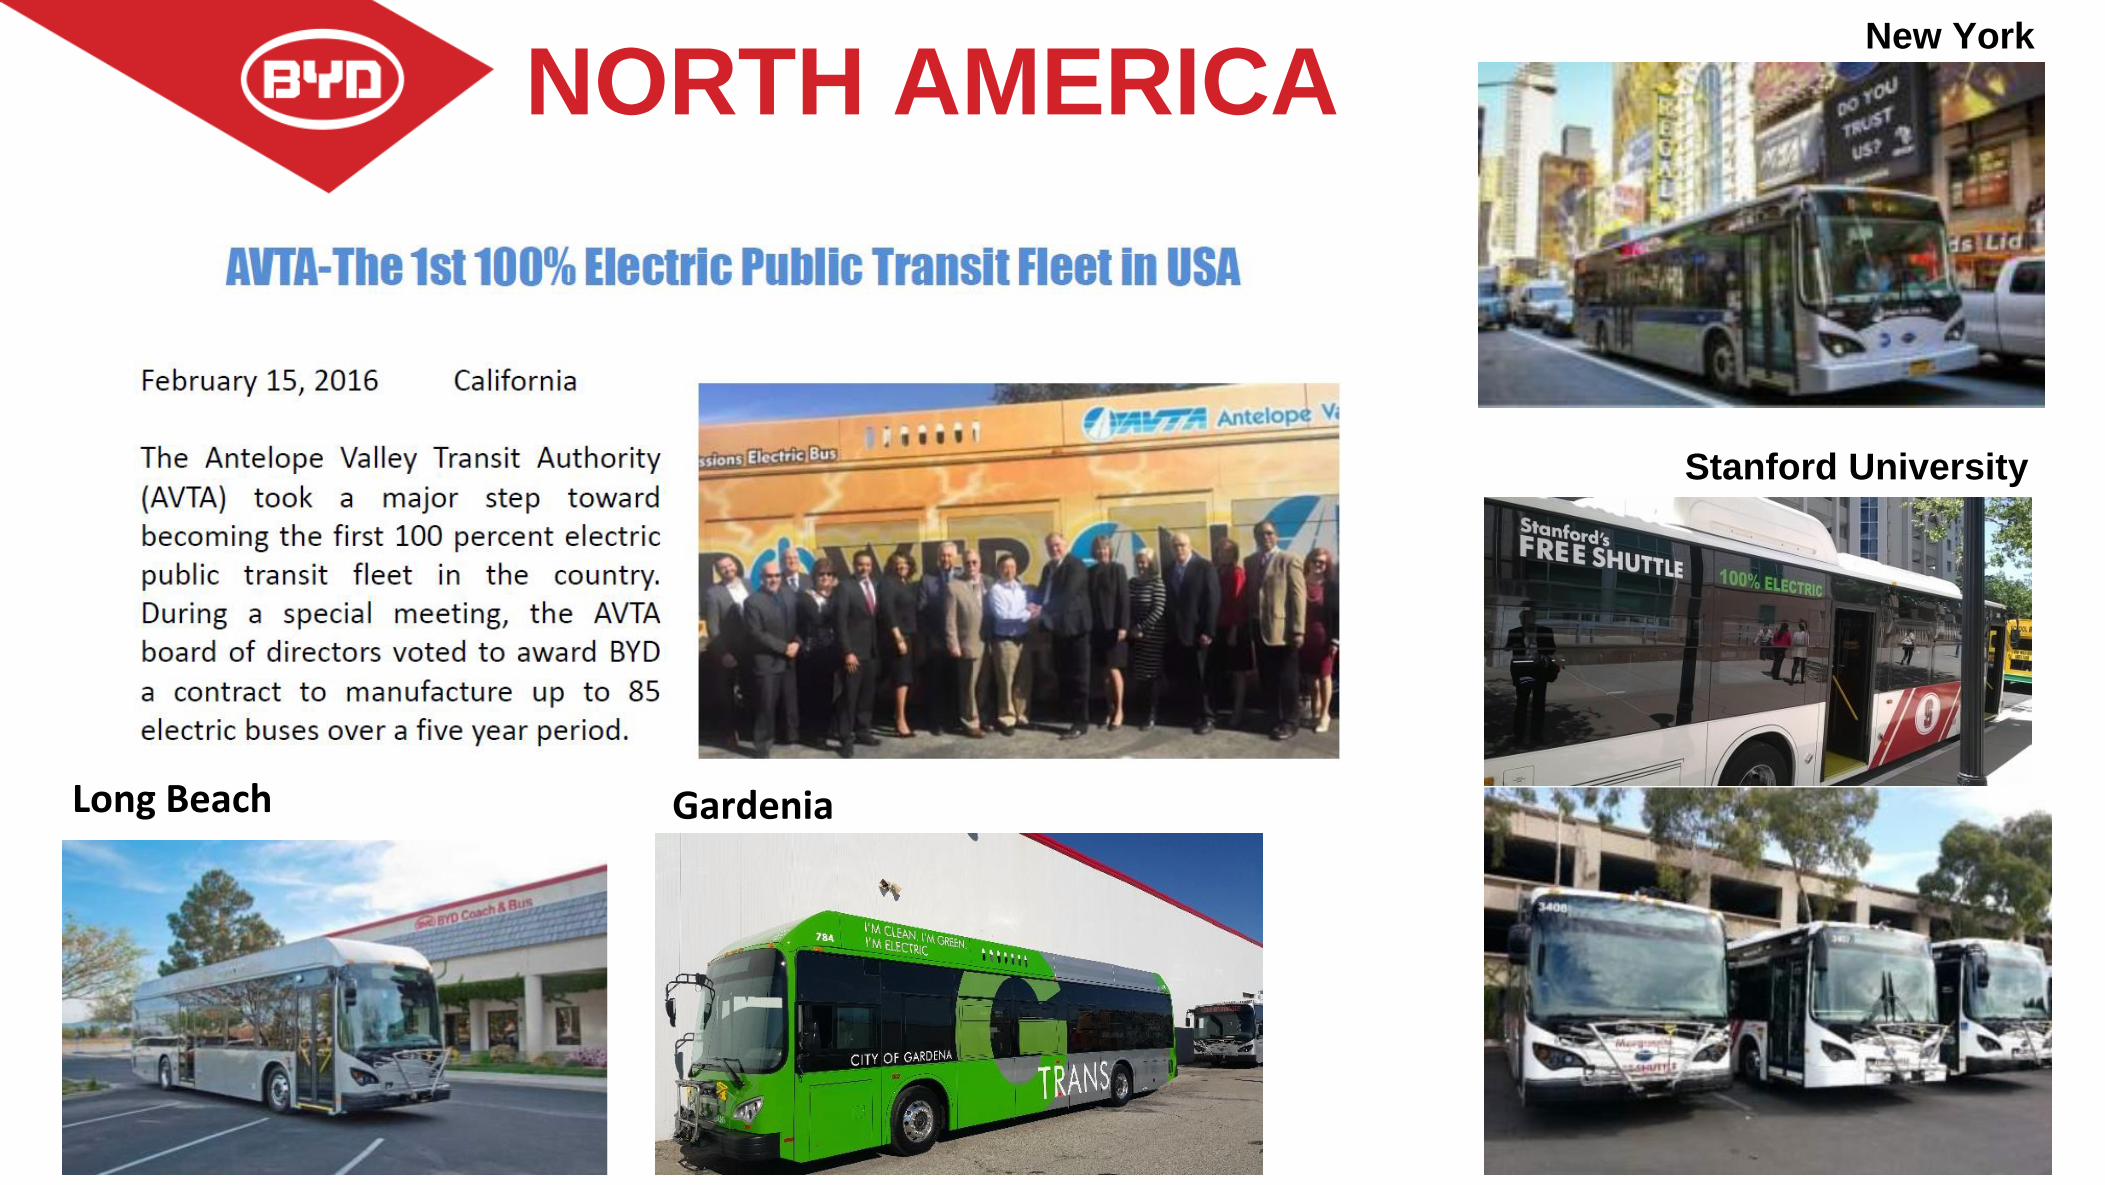
Stanford University
New York
NORTH AMERICA
GardeniaLong Beach

LA was the first city to move to CNG, now they
plan to replace all the fleet to electrics.
LA Metro
The Los Angeles Metropolitan
Transportation Authority
LOS ANGELES
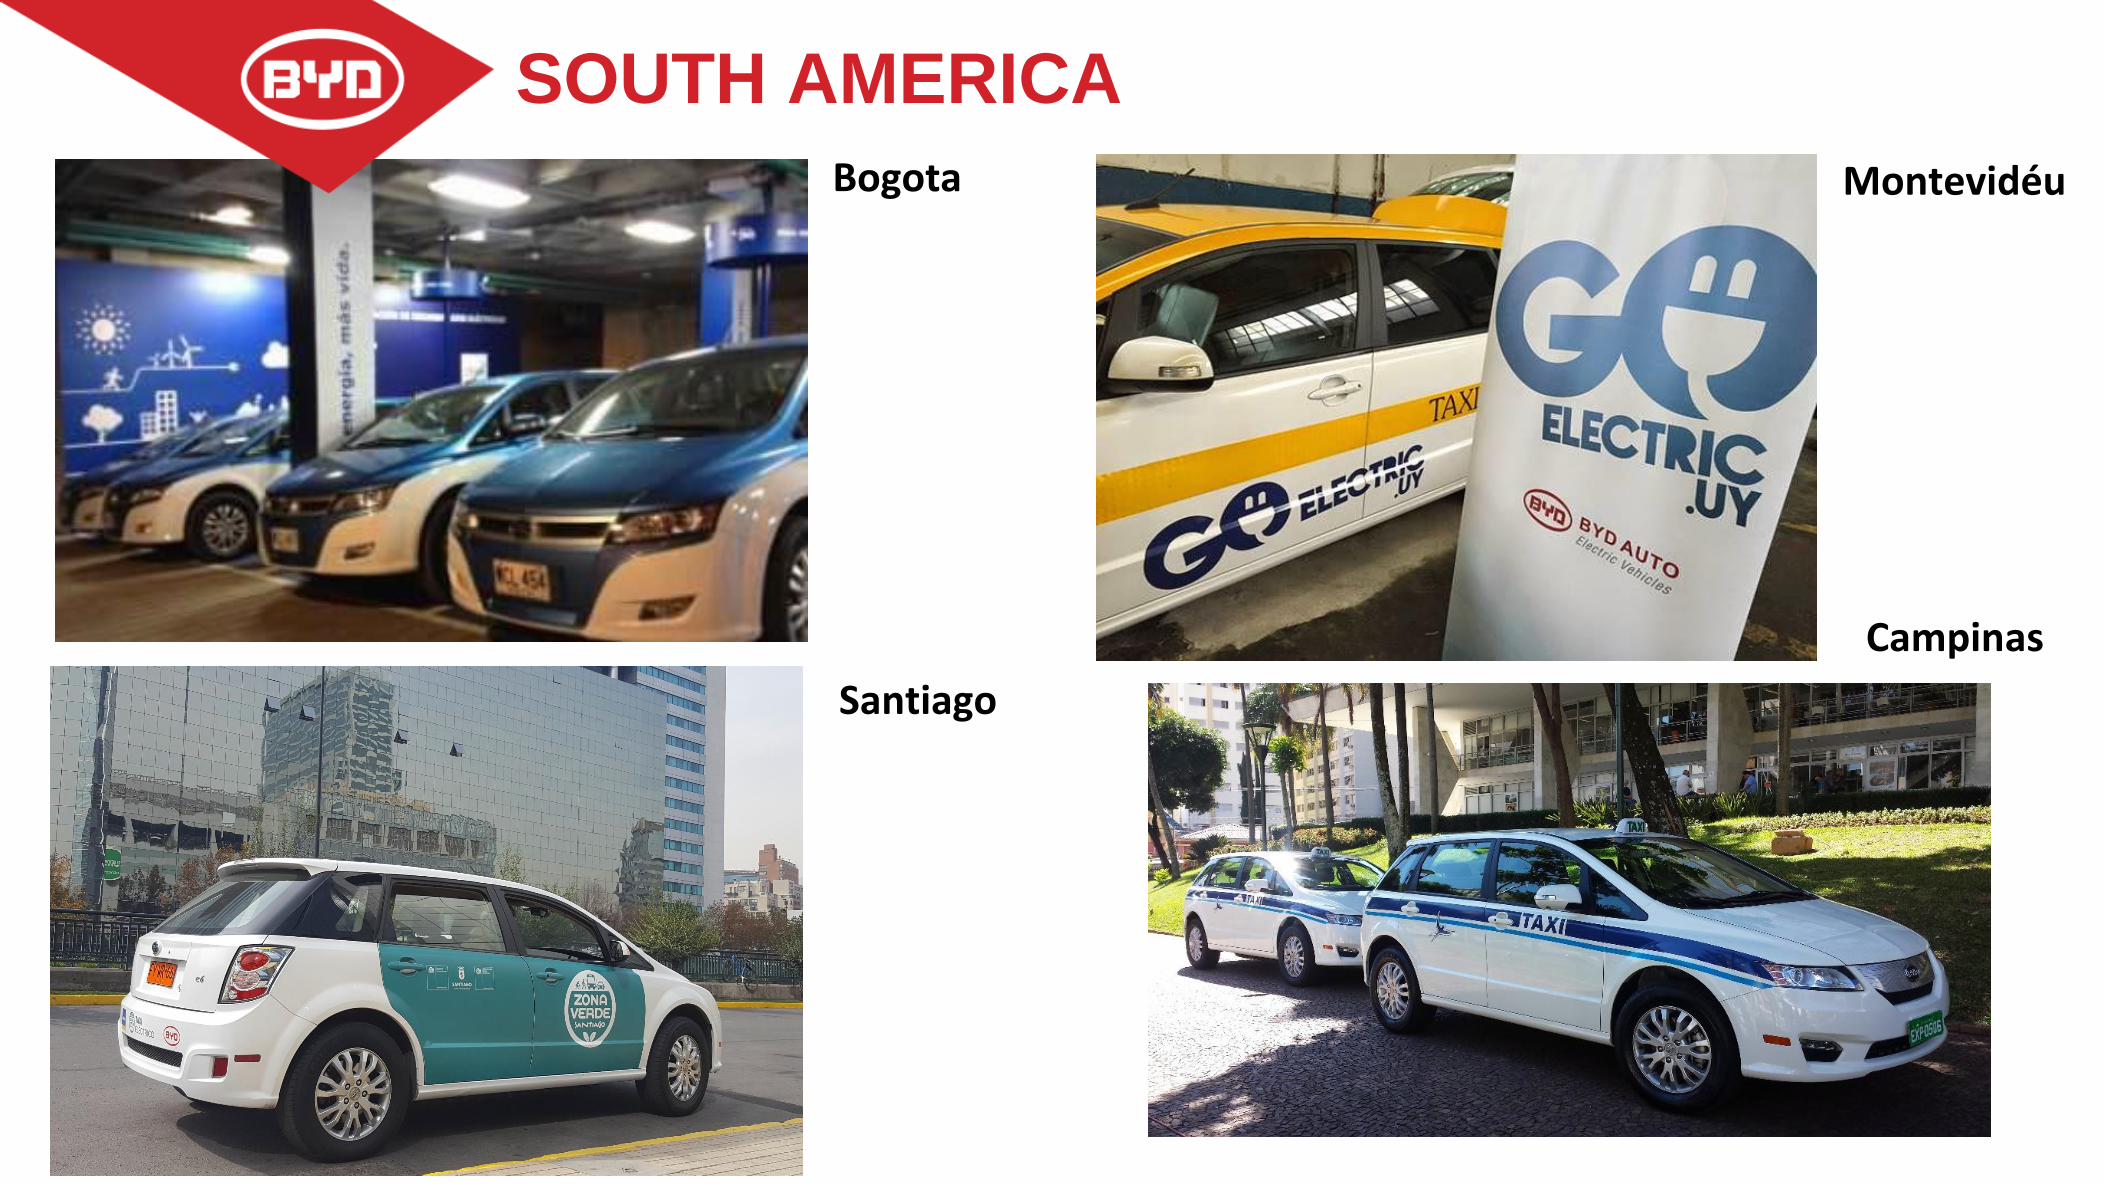
Bogota Montevidéu
SOUTH AMERICA
Campinas
Santiago

SÃO PAULO – BLACK TAXIS
20 CHARGING POOINTS IN THE CITY
• INCREASED FROM 5 – 10 YEARS LIFETIME AS E-TAXI.
• EXCEPTION FROM RODIZIO• 50% IPVA REDUCTION.
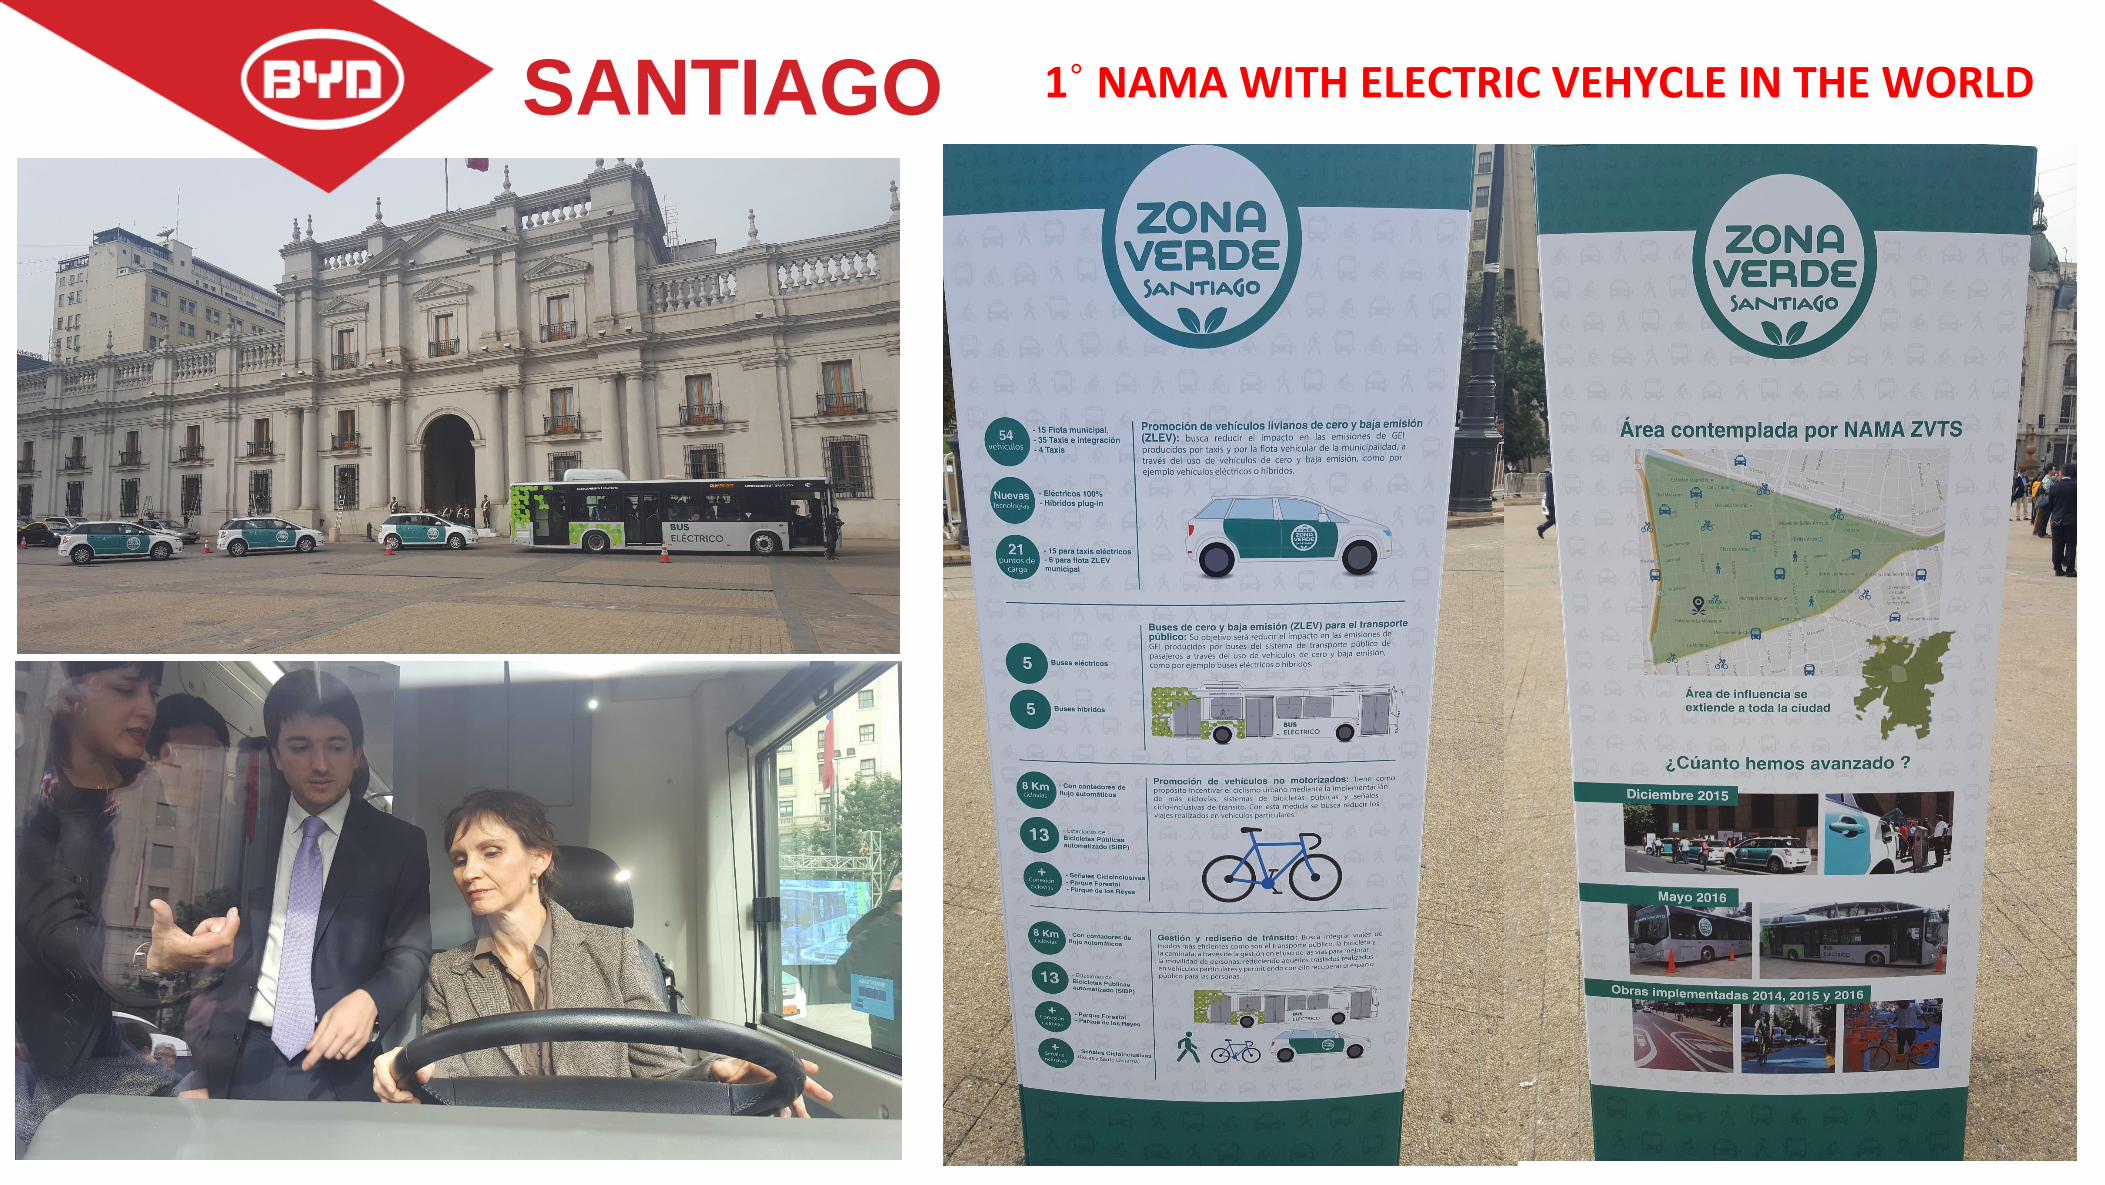
SANTIAGO 1˚ NAMA WITH ELECTRIC VEHYCLE IN THE WORLD
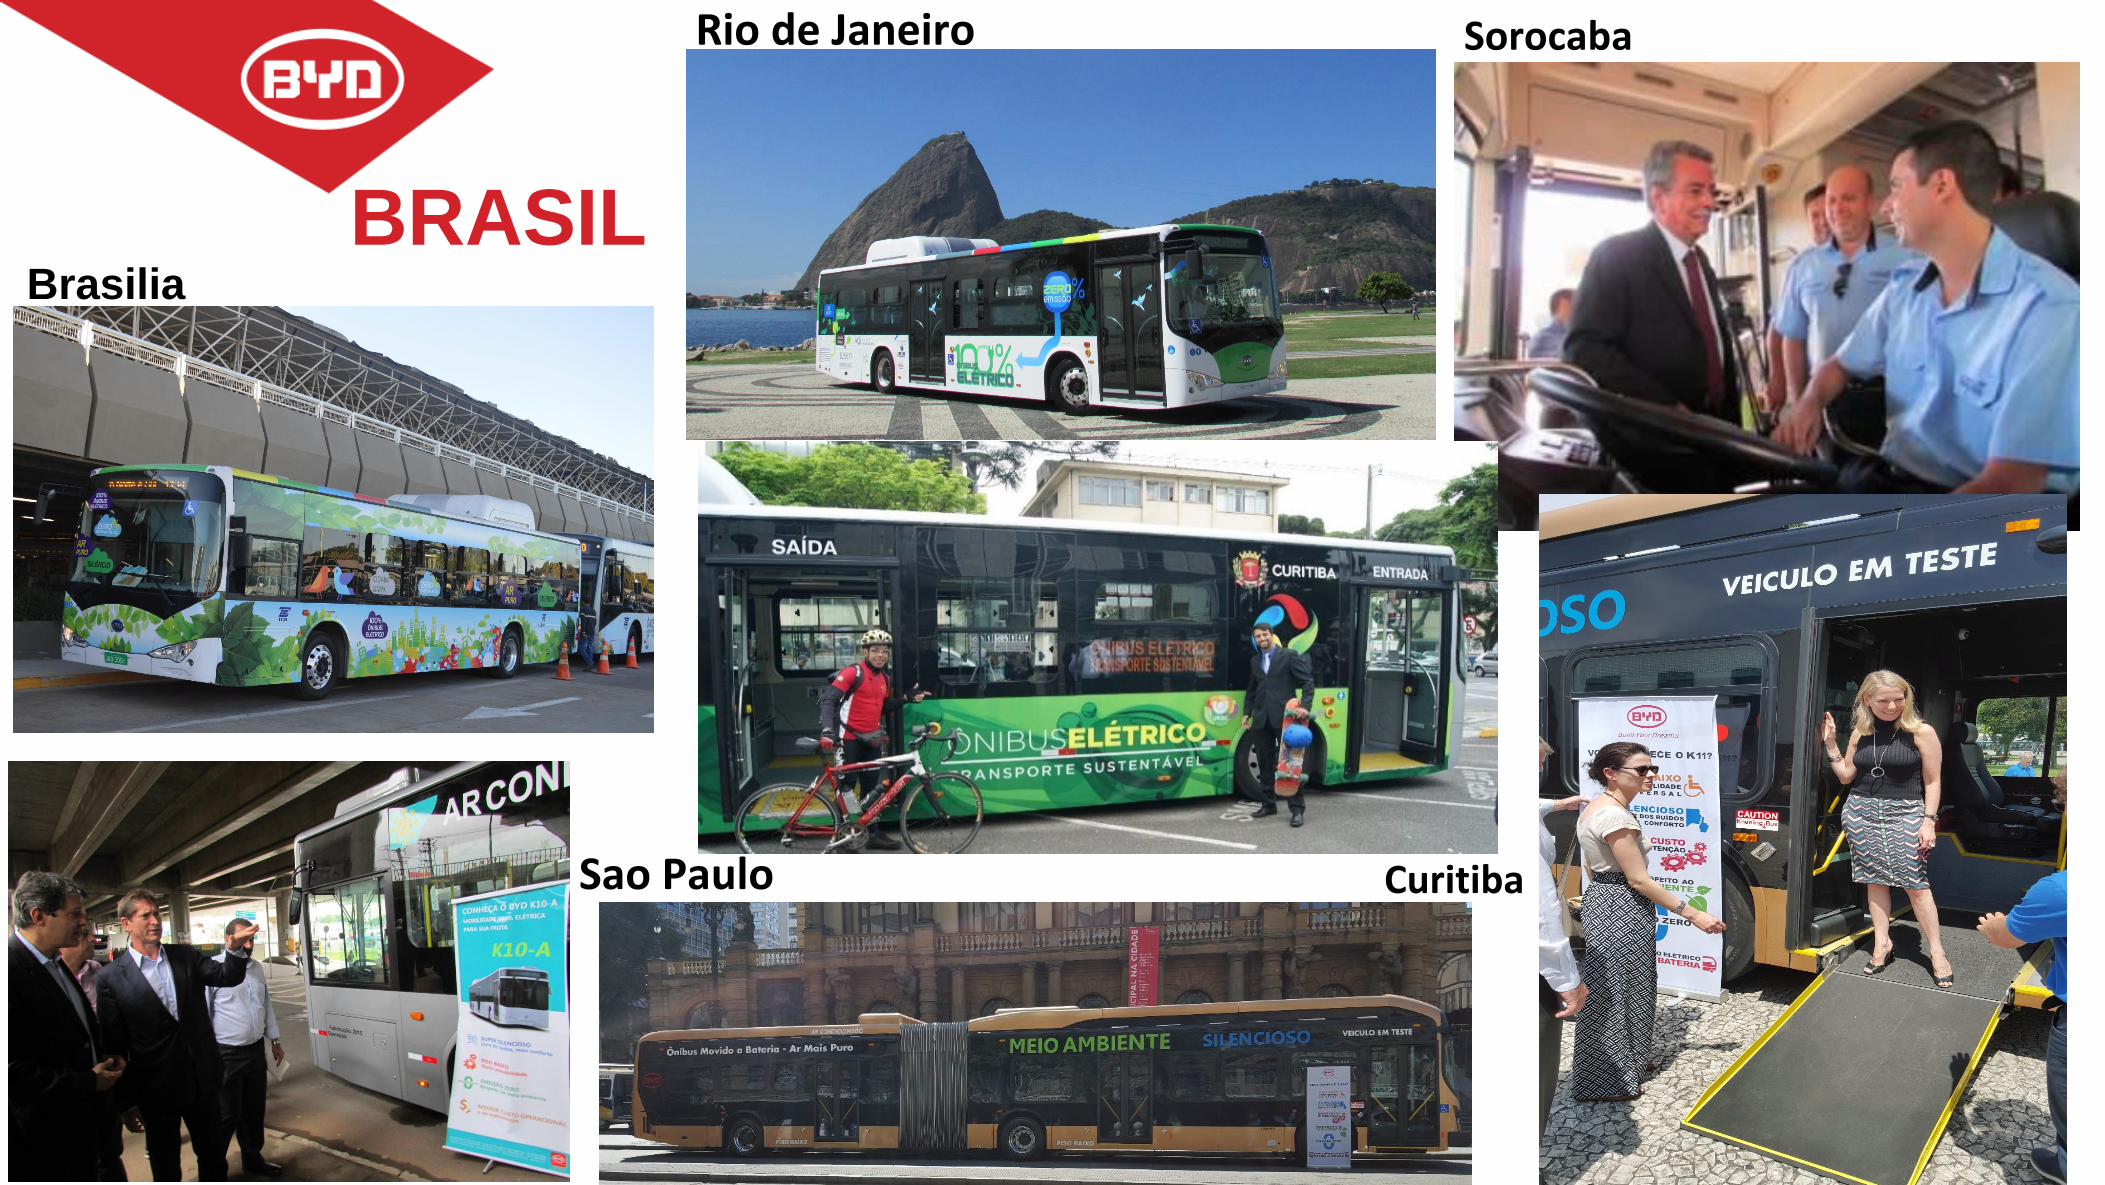
Sorocaba
Curit
Brasilia
Sao Paulo
Rio de Janeiro
Curitiba
BRASIL
Performance tests
in Latin America

HYBRID AND ELETRIC BUS TEST PROGRAM
16 buses tested in Bogotá, Rio de Janeiro, Santiago e São Paulo
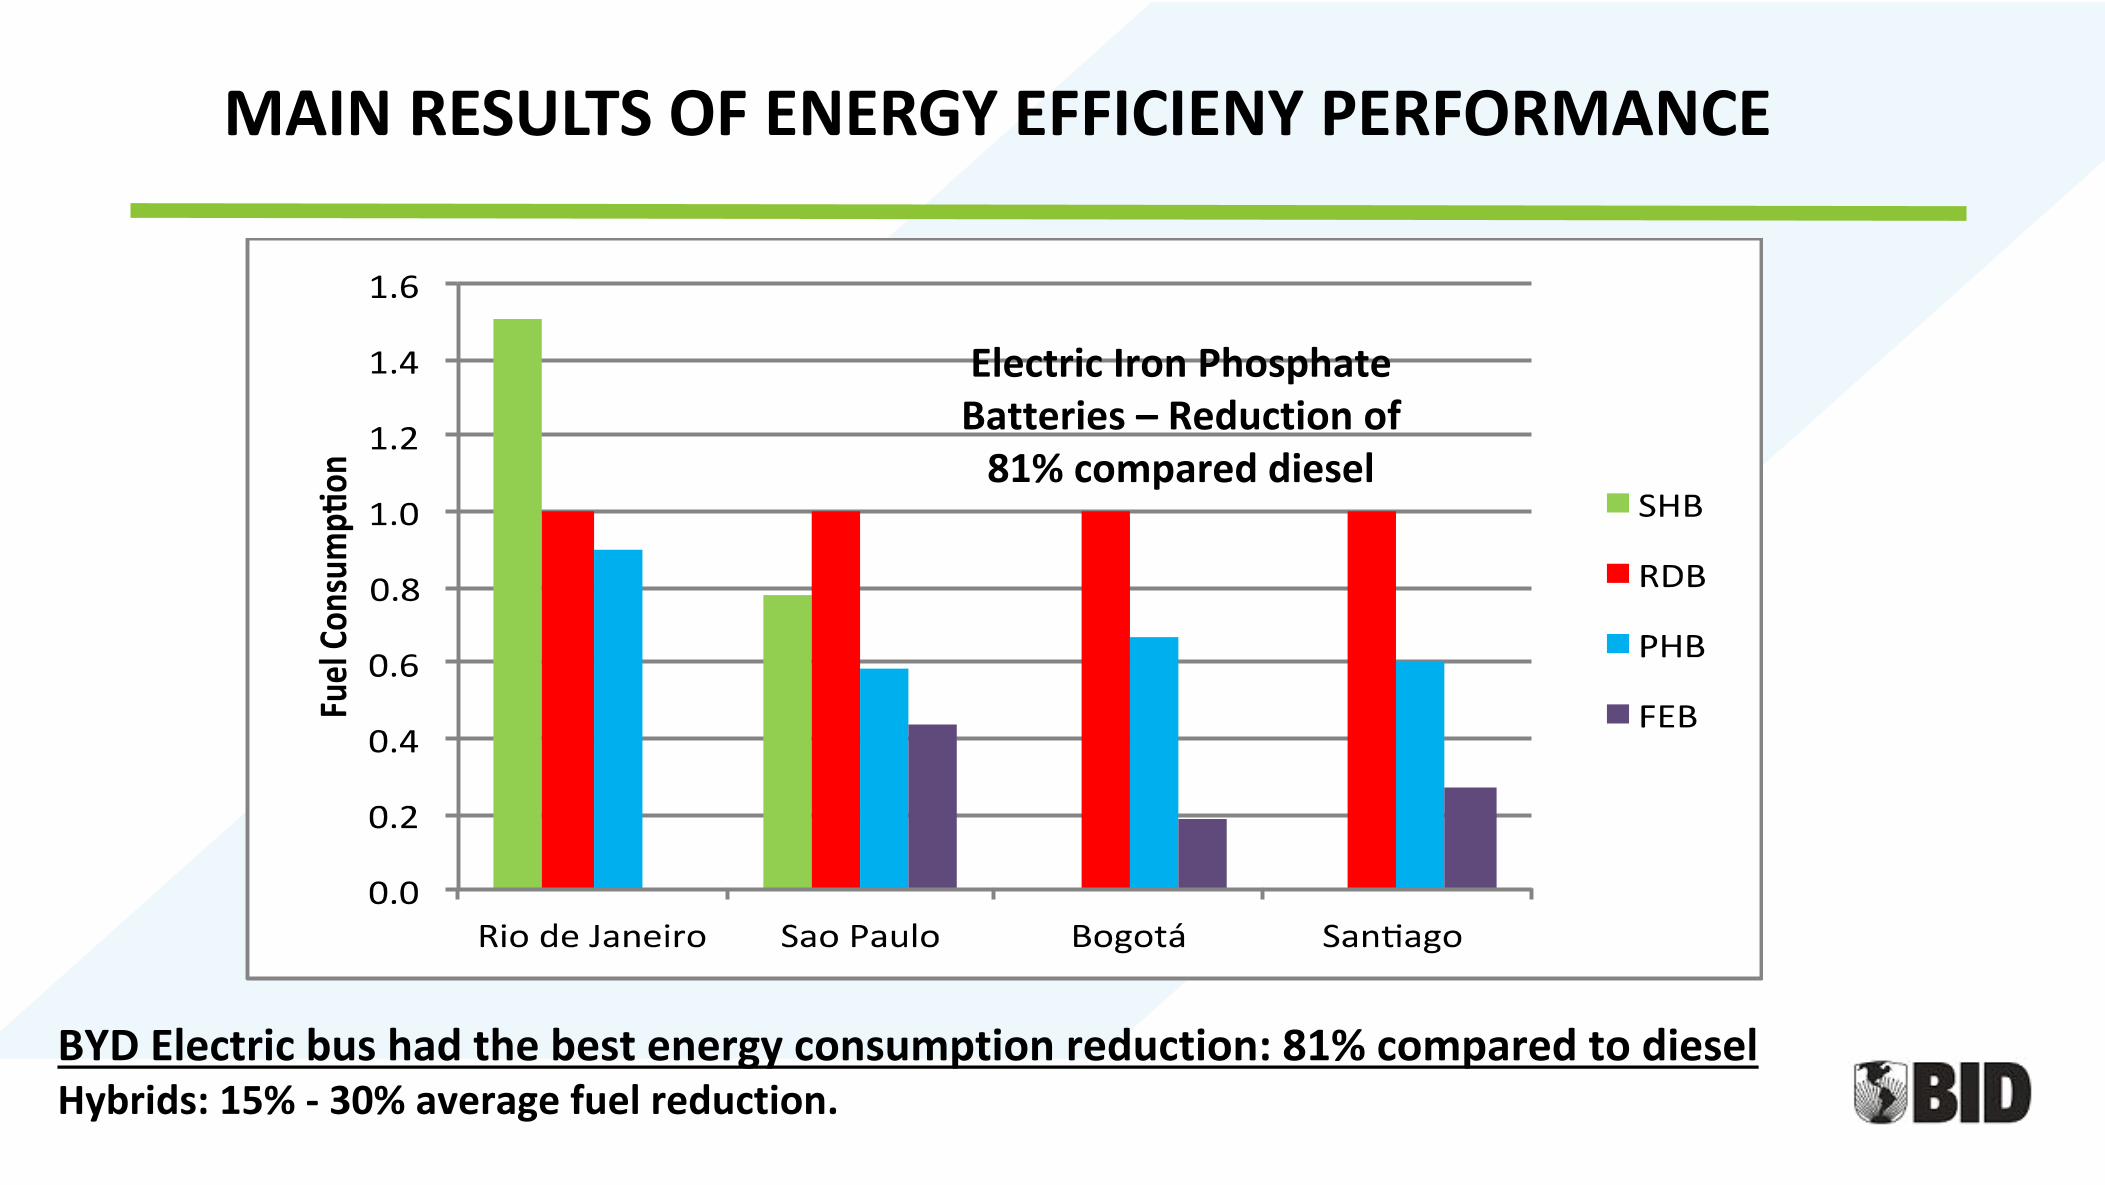
MAIN RESULTS OF ENERGY EFFICIENY PERFORMANCE
Electric Iron PhosphateBatteries – Reduction of
81% compared diesel
BYD Electric bus had the best energy consumption reduction: 81% compared to diesel Hybrids: 15% - 30% average fuel reduction.
HYBRID ELECTRIC BUS TEST PROGRAM IN LATIN AMERICA:
Economic Analysis of the Program
Prepared by:
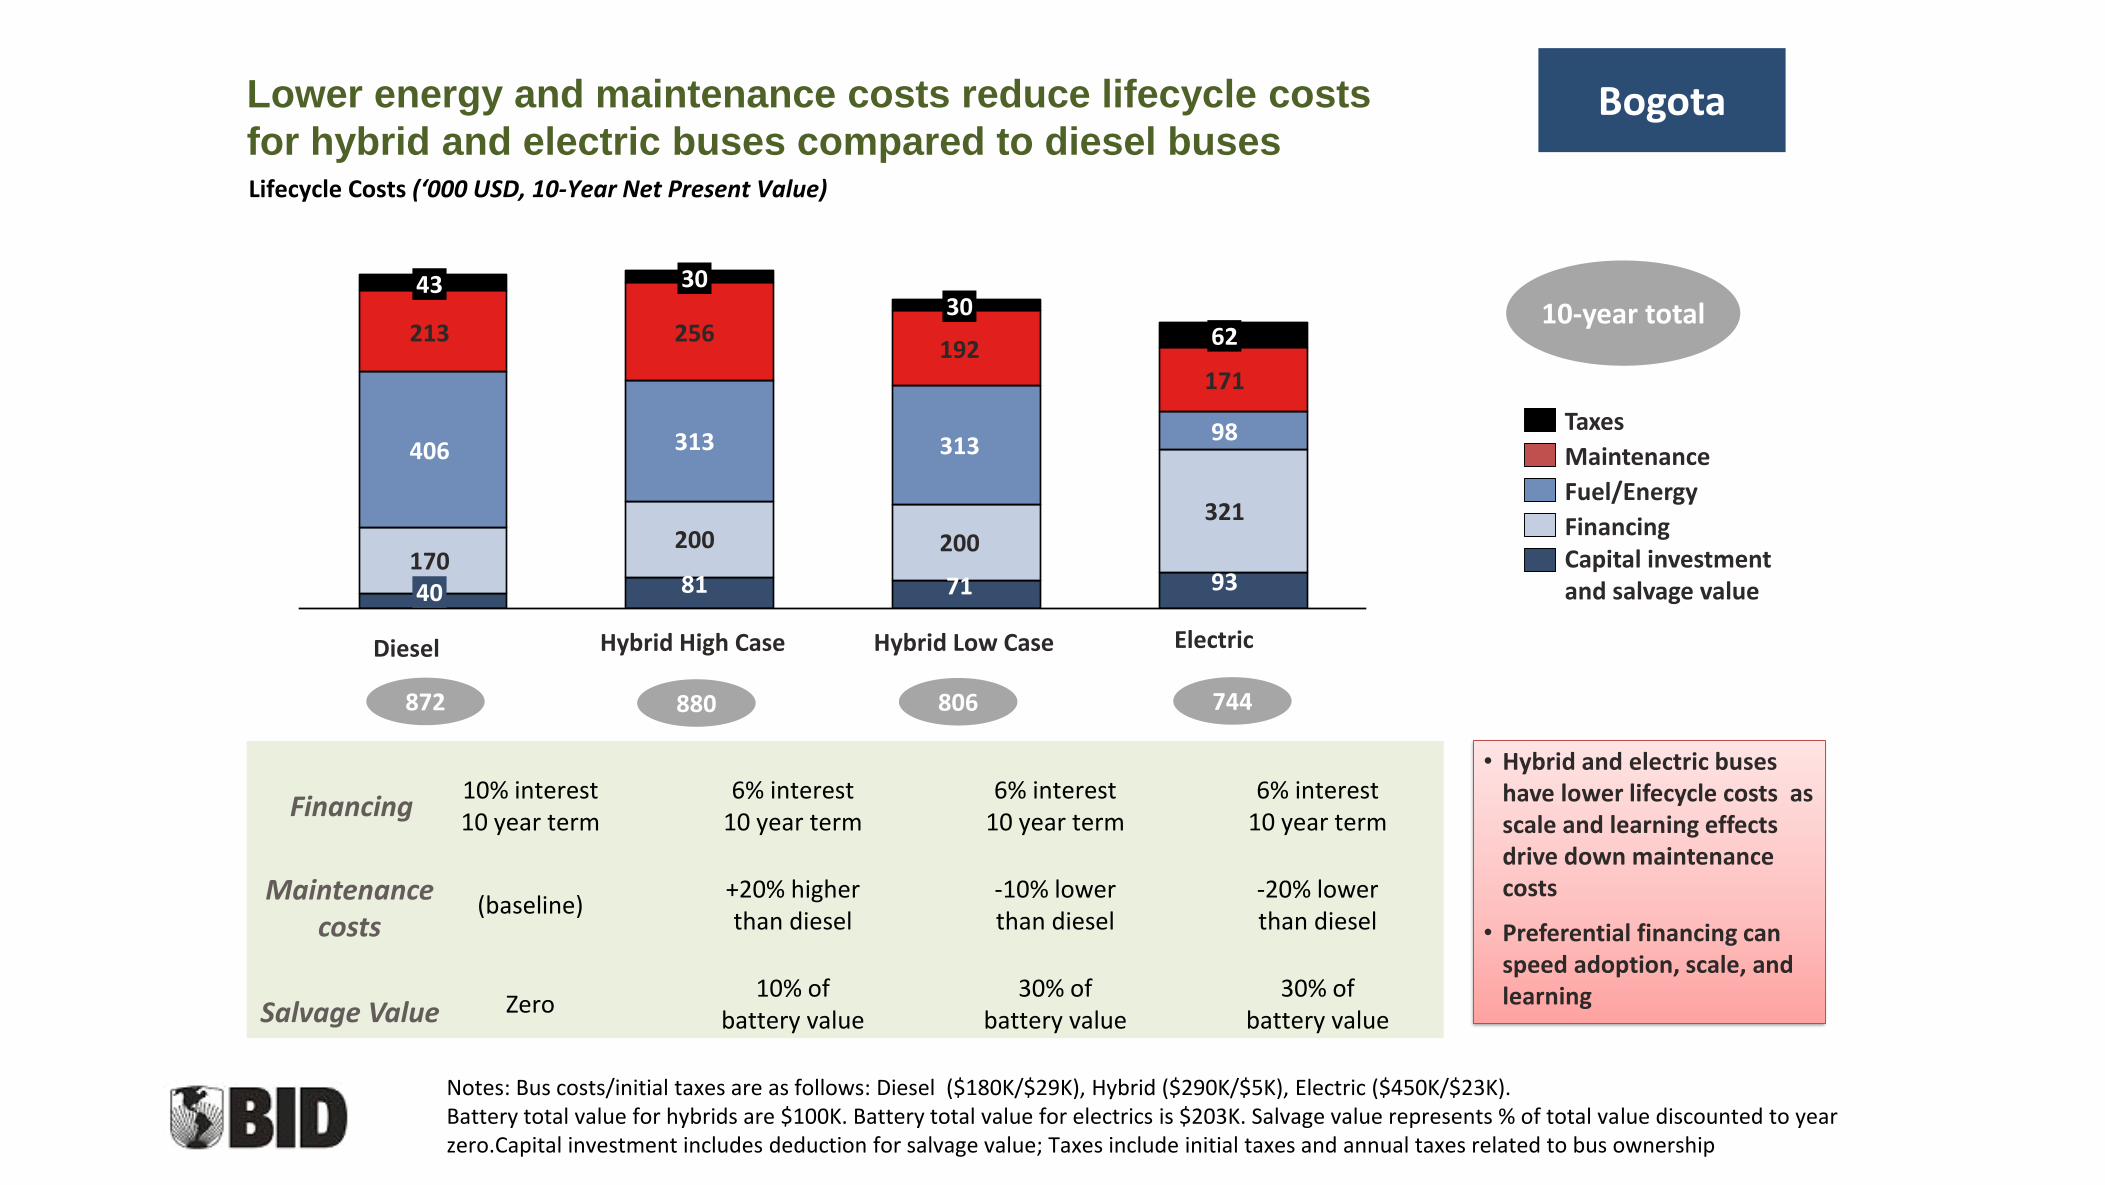
Lower energy and maintenance costs reduce lifecycle costs
for hybrid and electric buses compared to diesel buses
Notes: Bus costs/initial taxes are as follows: Diesel ($180K/$29K), Hybrid ($290K/$5K), Electric ($450K/$23K). Battery total value for hybrids are $100K. Battery total value for electrics is $203K. Salvage value represents % of total value discounted to year zero.Capital investment includes deduction for salvage value; Taxes include initial taxes and annual taxes related to bus ownership
30
192
313
71
200
Hybrid High Case
17093
213
313
256
Diesel Hybrid Low Case
43
200
30
171
98
62
Electric
40
406
81
321
Maintenance
Taxes
Fuel/Energy
FinancingCapital investmentand salvage value
10% interest10 year term
6% interest10 year term
6% interest10 year term
6% interest10 year term
(baseline)+20% higher than diesel
-10% lower than diesel
-20% lower than diesel
Zero10% of
battery value30% of
battery value30% of
battery value
Lifecycle Costs (‘000 USD, 10-Year Net Present Value)
Financing
Maintenance costs
Salvage Value
10-year total
872 880 806 744
• Hybrid and electric buses have lower lifecycle costs as scale and learning effects drive down maintenance costs
• Preferential financing can speed adoption, scale, and learning
Bogota
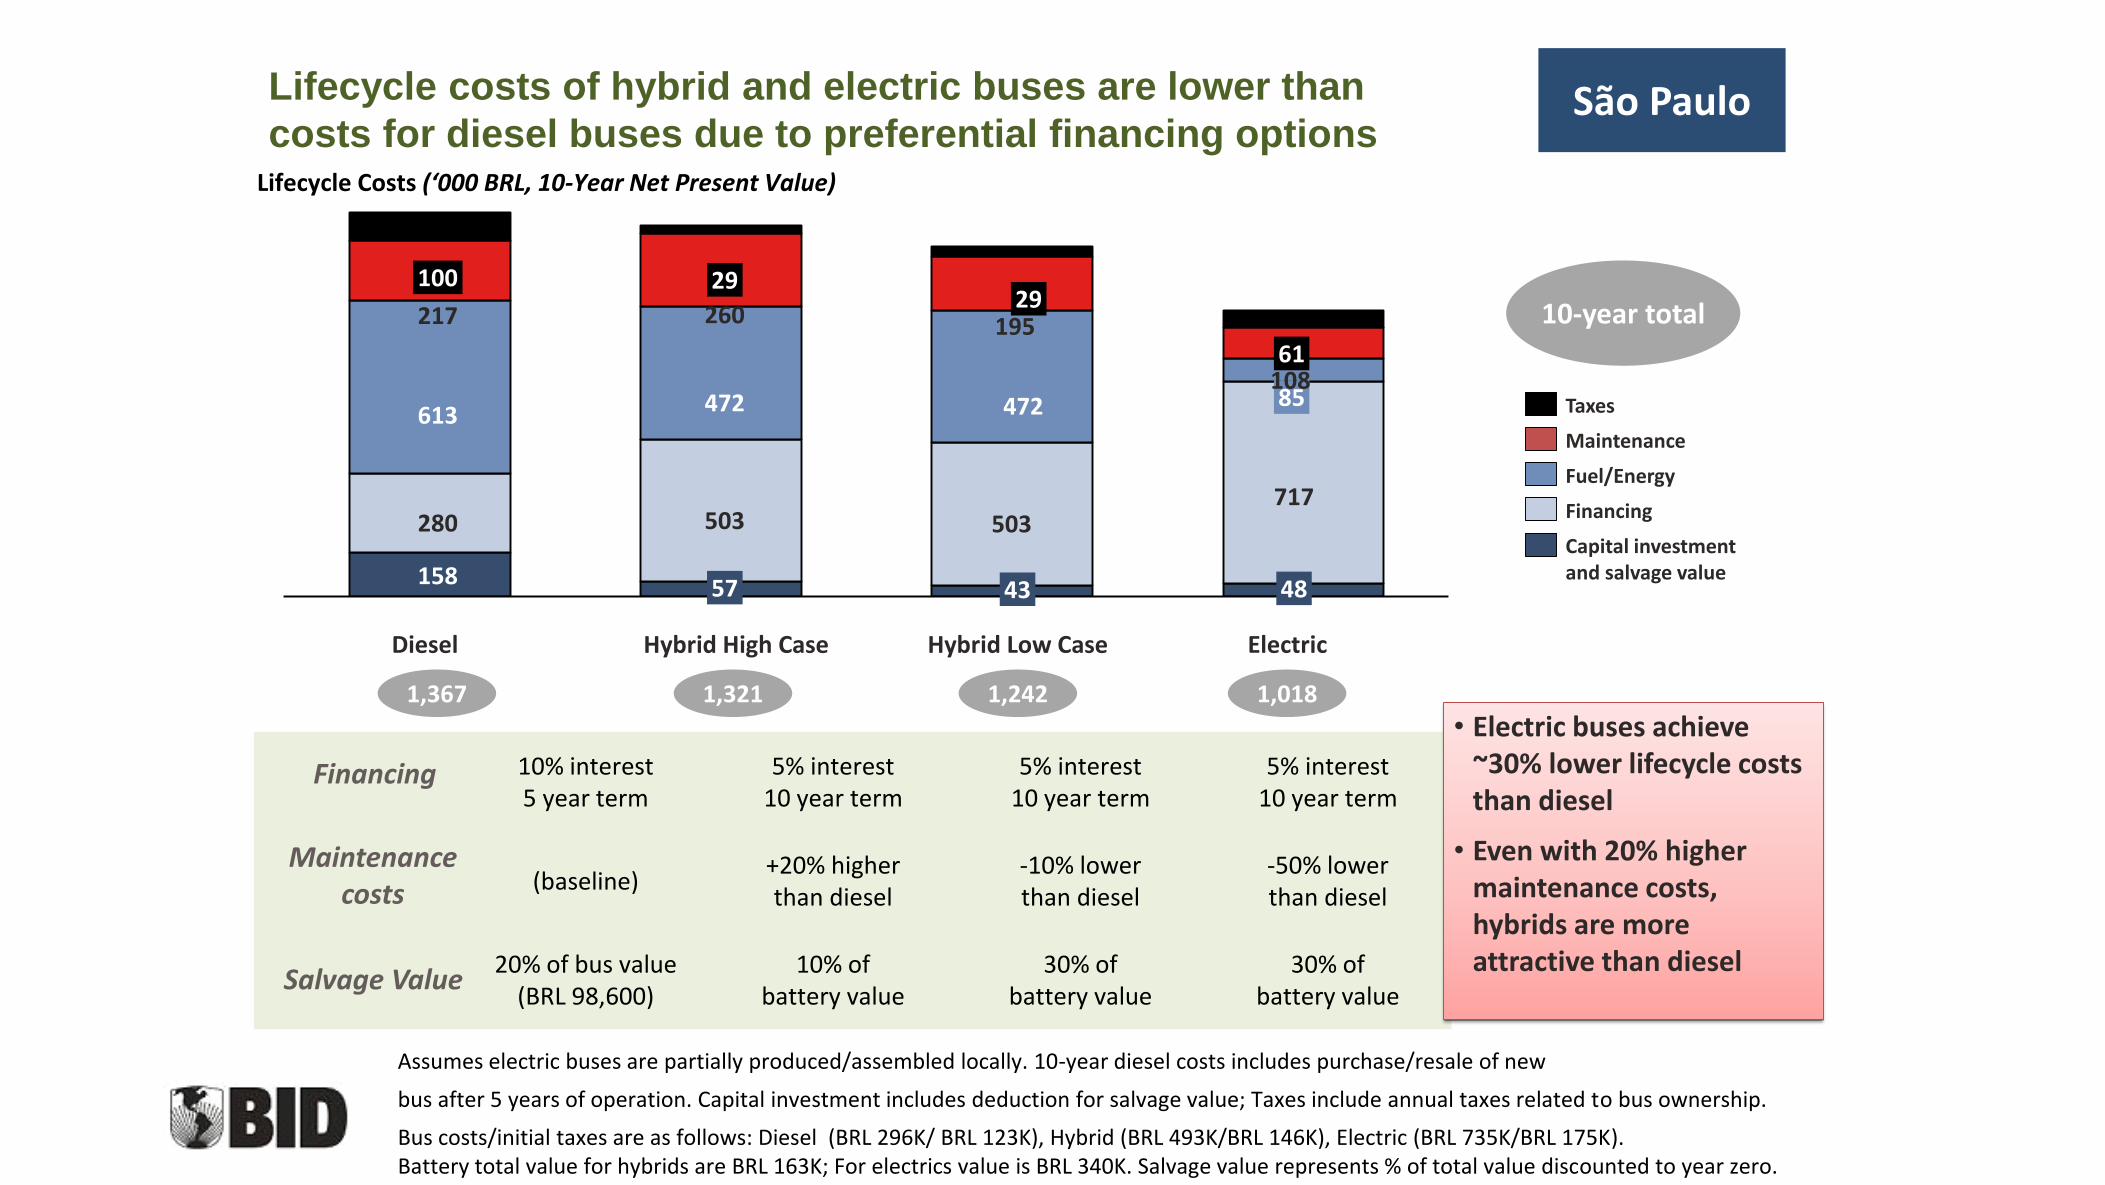
Lifecycle costs of hybrid and electric buses are lower than
costs for diesel buses due to preferential financing options
Assumes electric buses are partially produced/assembled locally. 10-year diesel costs includes purchase/resale of new
bus after 5 years of operation. Capital investment includes deduction for salvage value; Taxes include annual taxes related to bus ownership.
Bus costs/initial taxes are as follows: Diesel (BRL 296K/ BRL 123K), Hybrid (BRL 493K/BRL 146K), Electric (BRL 735K/BRL 175K). Battery total value for hybrids are BRL 163K; For electrics value is BRL 340K. Salvage value represents % of total value discounted to year zero.
Electric
48
717
8510861
43
503
Hybrid Low Case
29195
472
57
503
472
260
29
Diesel Hybrid High Case
158
280
613
217
100
Fuel/Energy
Maintenance
Taxes
Financing
Capital investmentand salvage value
10% interest5 year term
5% interest10 year term
5% interest10 year term
5% interest10 year term
(baseline)+20% higher than diesel
-10% lower than diesel
-50% lower than diesel
20% of bus value(BRL 98,600)
10% of battery value
30% of battery value
30% of battery value
Financing
Maintenance costs
Salvage Value
1,367 1,321 1,242 1,018
• Electric buses achieve ~30% lower lifecycle costs than diesel
• Even with 20% higher maintenance costs, hybrids are more attractive than diesel
Lifecycle Costs (‘000 BRL, 10-Year Net Present Value)
10-year total
São Paulo
Real tests and pilot comercial
operations in Brasil
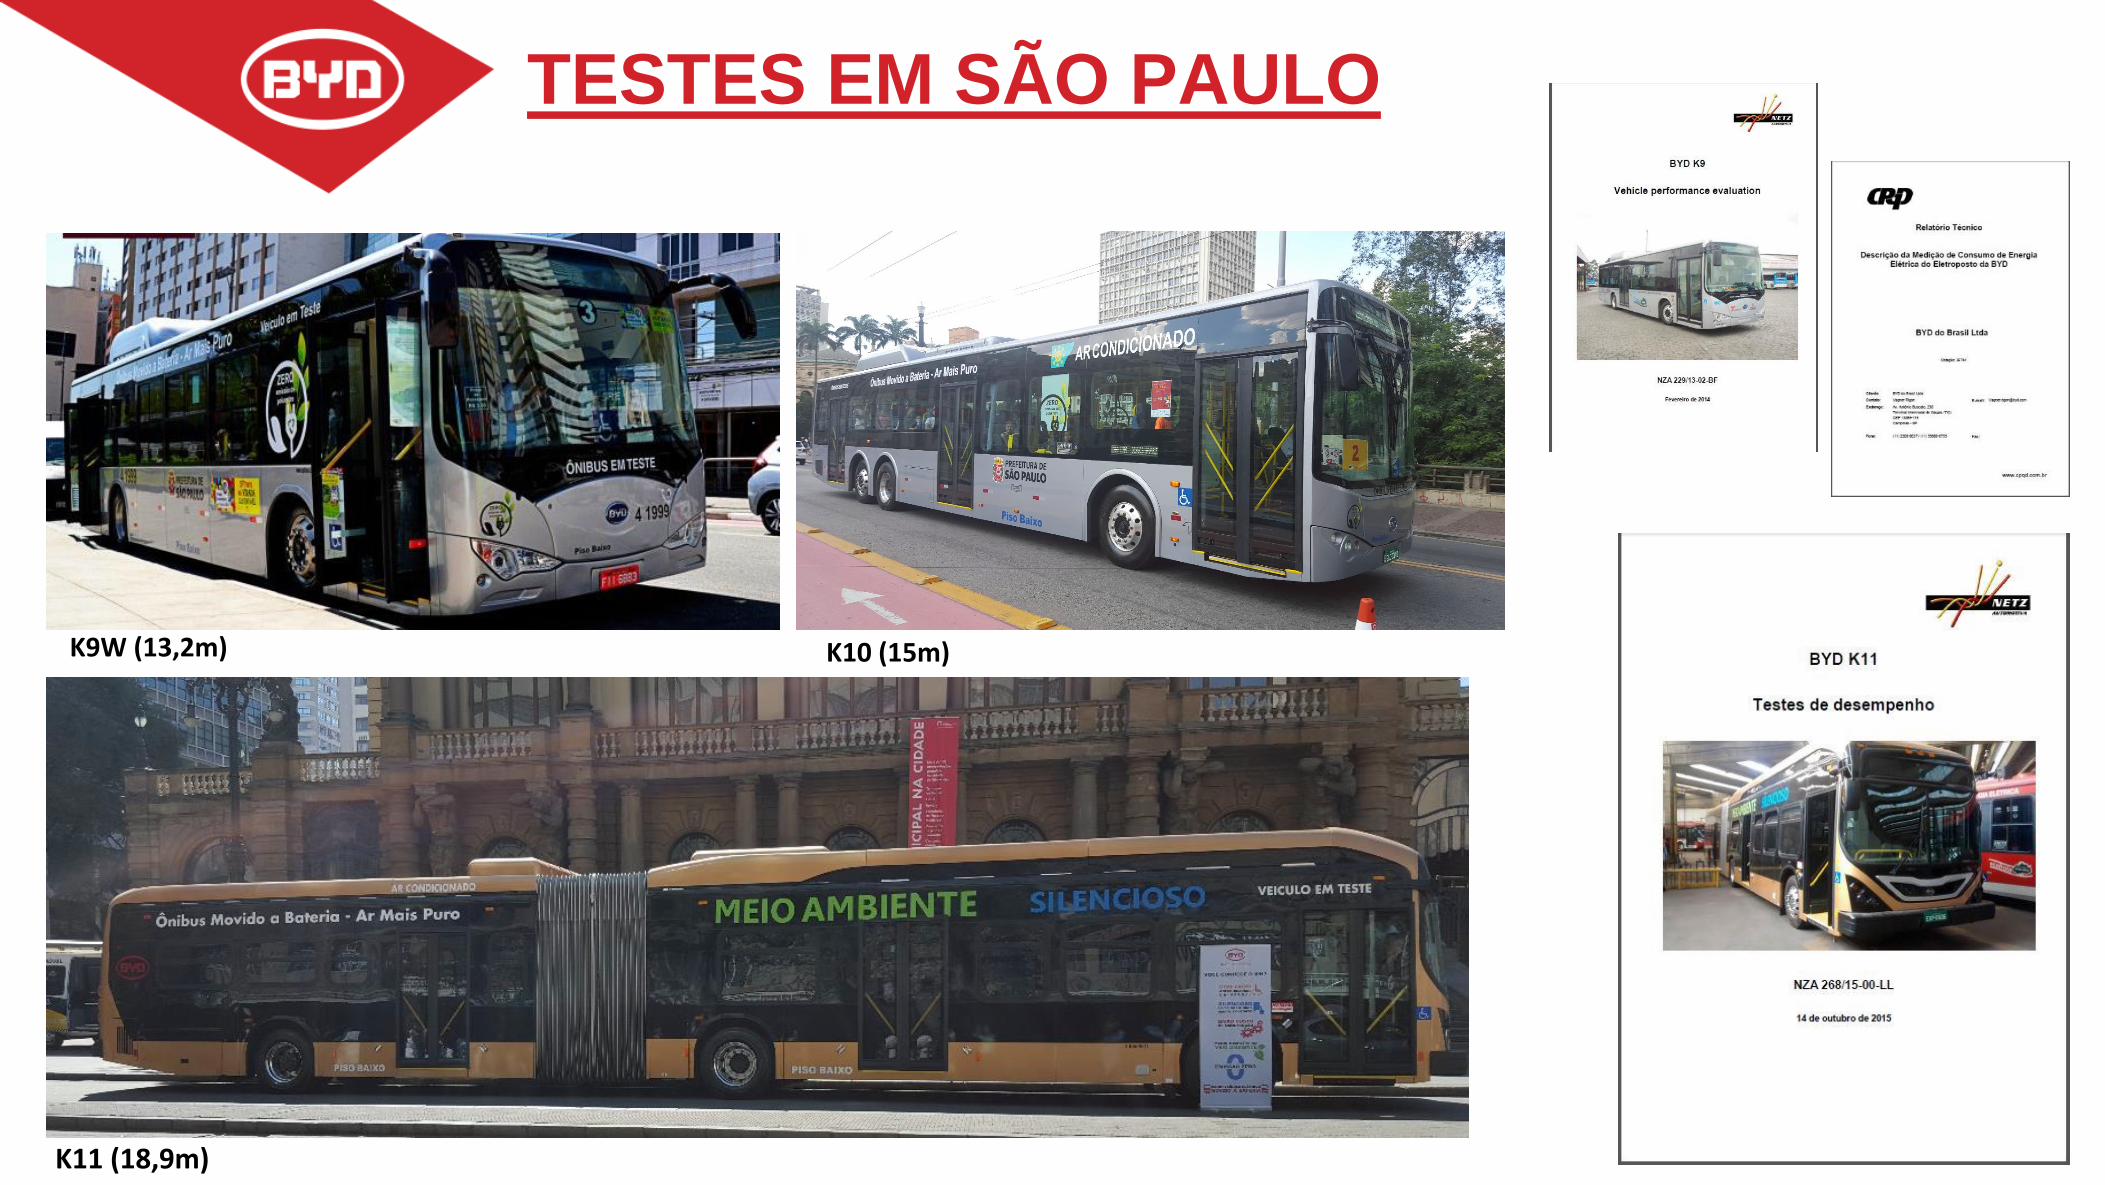
K9W (13,2m)
TESTES EM SÃO PAULO
K10 (15m)
K11 (18,9m)
0.00
0.50
1.00
1.50
2.00
2.50
3.00
3.50
4.00
4.50
5.00
03/09/15 04/09/15 05/09/15 08/09/15 09/09/15 10/09/15 11/09/15 12/09/15 15/09/15 16/09/15 17/09/15 18/09/15 19/09/15 21/09/15 22/09/15 23/09/15 26/09/15 05/10/15 06/10/15 07/10/15 08/10/15 09/10/15 13/10/15 14/10/15 17/10/15 19/10/15 20/10/15
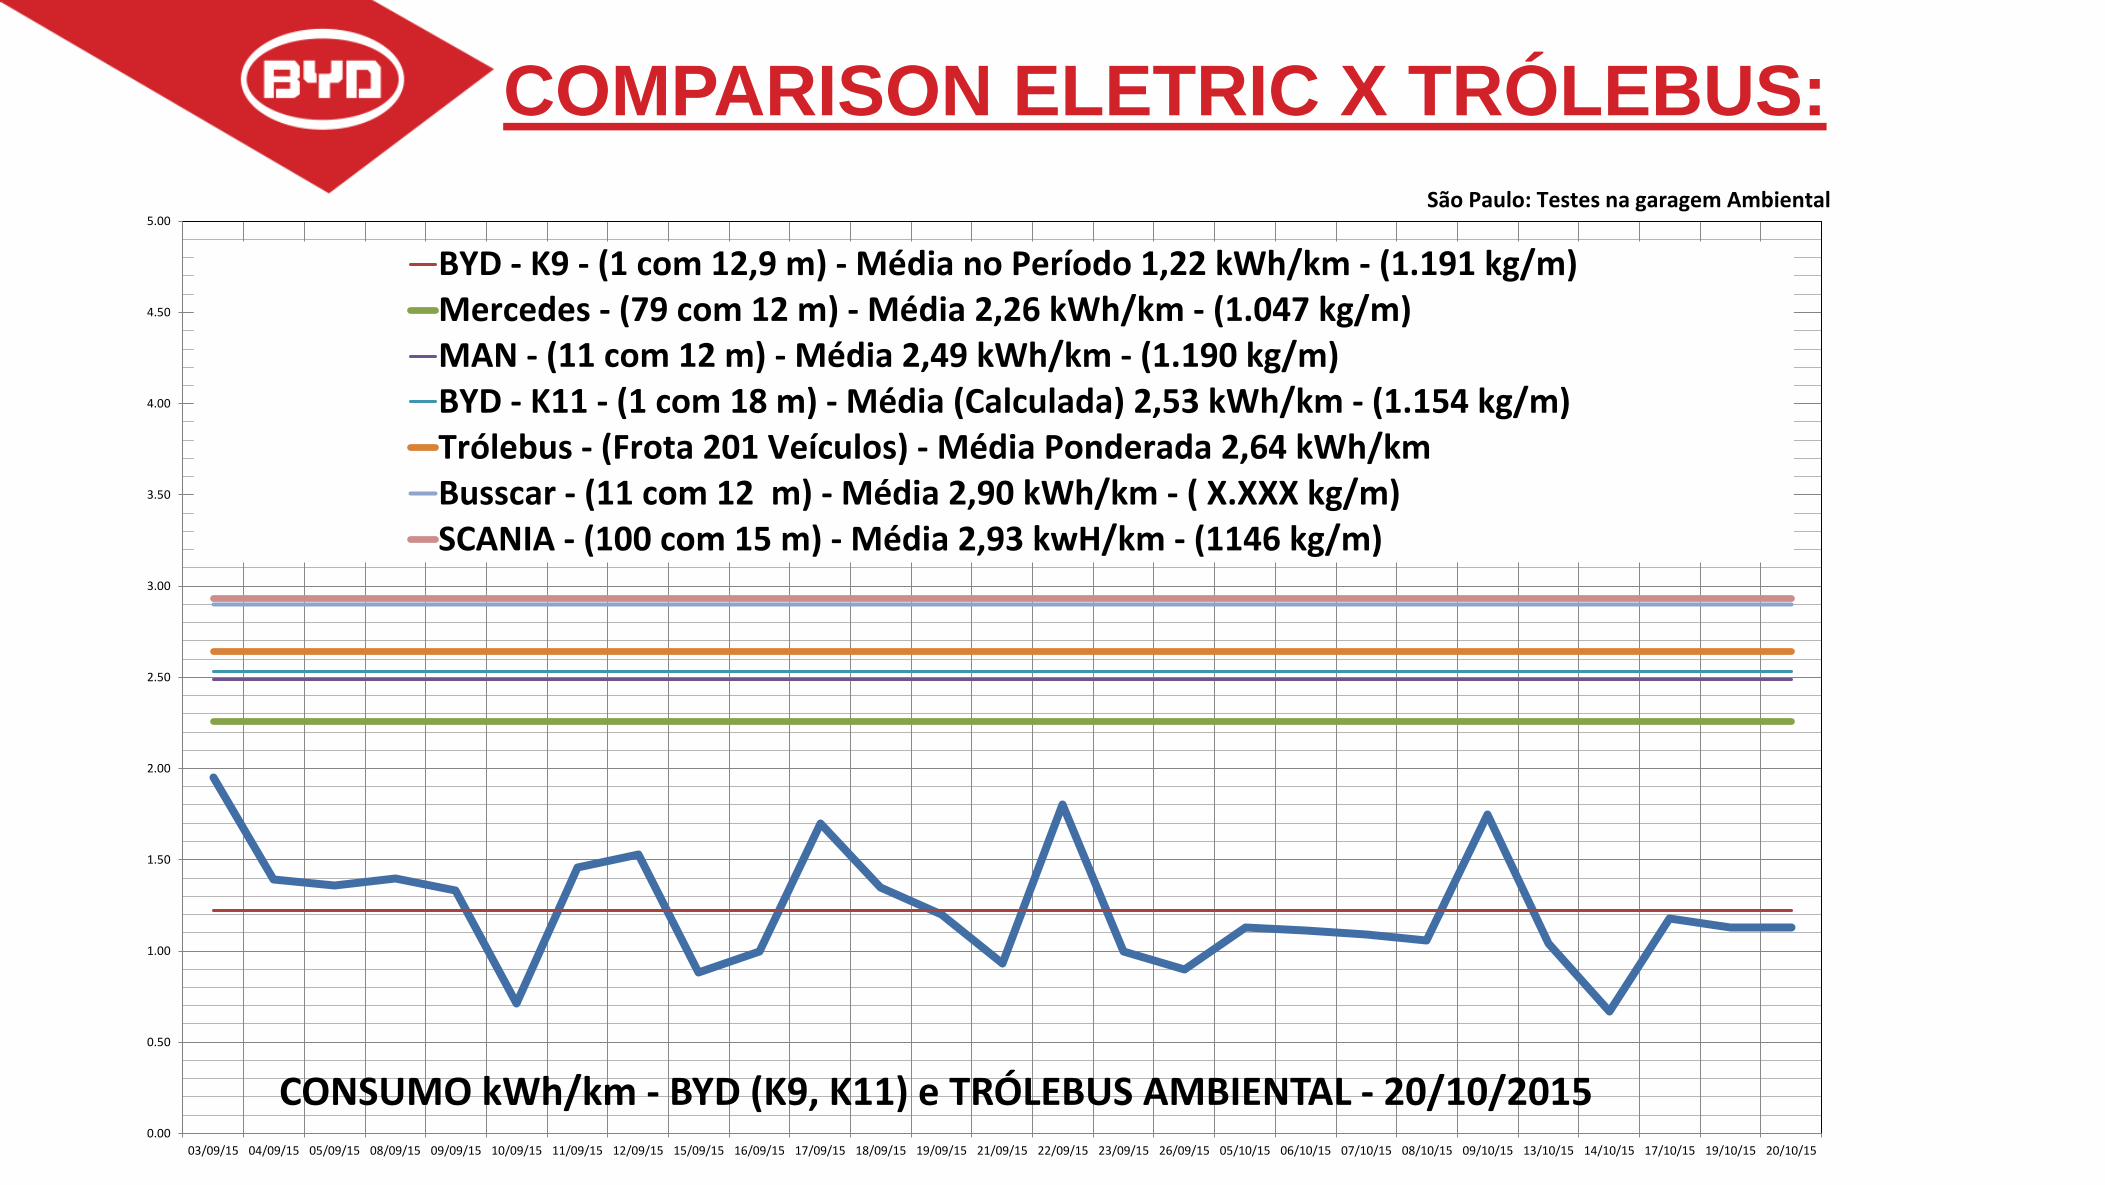
CONSUMO kWh/km - BYD (K9, K11) e TRÓLEBUS AMBIENTAL - 20/10/2015
BYD - K9 - (1 com 12,9 m) - Média no Período 1,22 kWh/km - (1.191 kg/m)Mercedes - (79 com 12 m) - Média 2,26 kWh/km - (1.047 kg/m)MAN - (11 com 12 m) - Média 2,49 kWh/km - (1.190 kg/m)BYD - K11 - (1 com 18 m) - Média (Calculada) 2,53 kWh/km - (1.154 kg/m)Trólebus - (Frota 201 Veículos) - Média Ponderada 2,64 kWh/kmBusscar - (11 com 12 m) - Média 2,90 kWh/km - ( X.XXX kg/m)SCANIA - (100 com 15 m) - Média 2,93 kwH/km - (1146 kg/m)
São Paulo: Testes na garagem Ambiental
COMPARISON ELETRIC X TRÓLEBUS:
0.00000
0.20000
0.40000
0.60000
0.80000
1.00000
1.20000
1 2 3 4 5 6 7 8 9 10 11 12 13 14 15 16 17 18 19 20 21 22 23 24 25 26 27 28 29 30 31 32 33 34 35 36 37 38 39 40 41 42 43 44 45 46 47 48 49 50 51 52 53 54 55 56 57 58 59
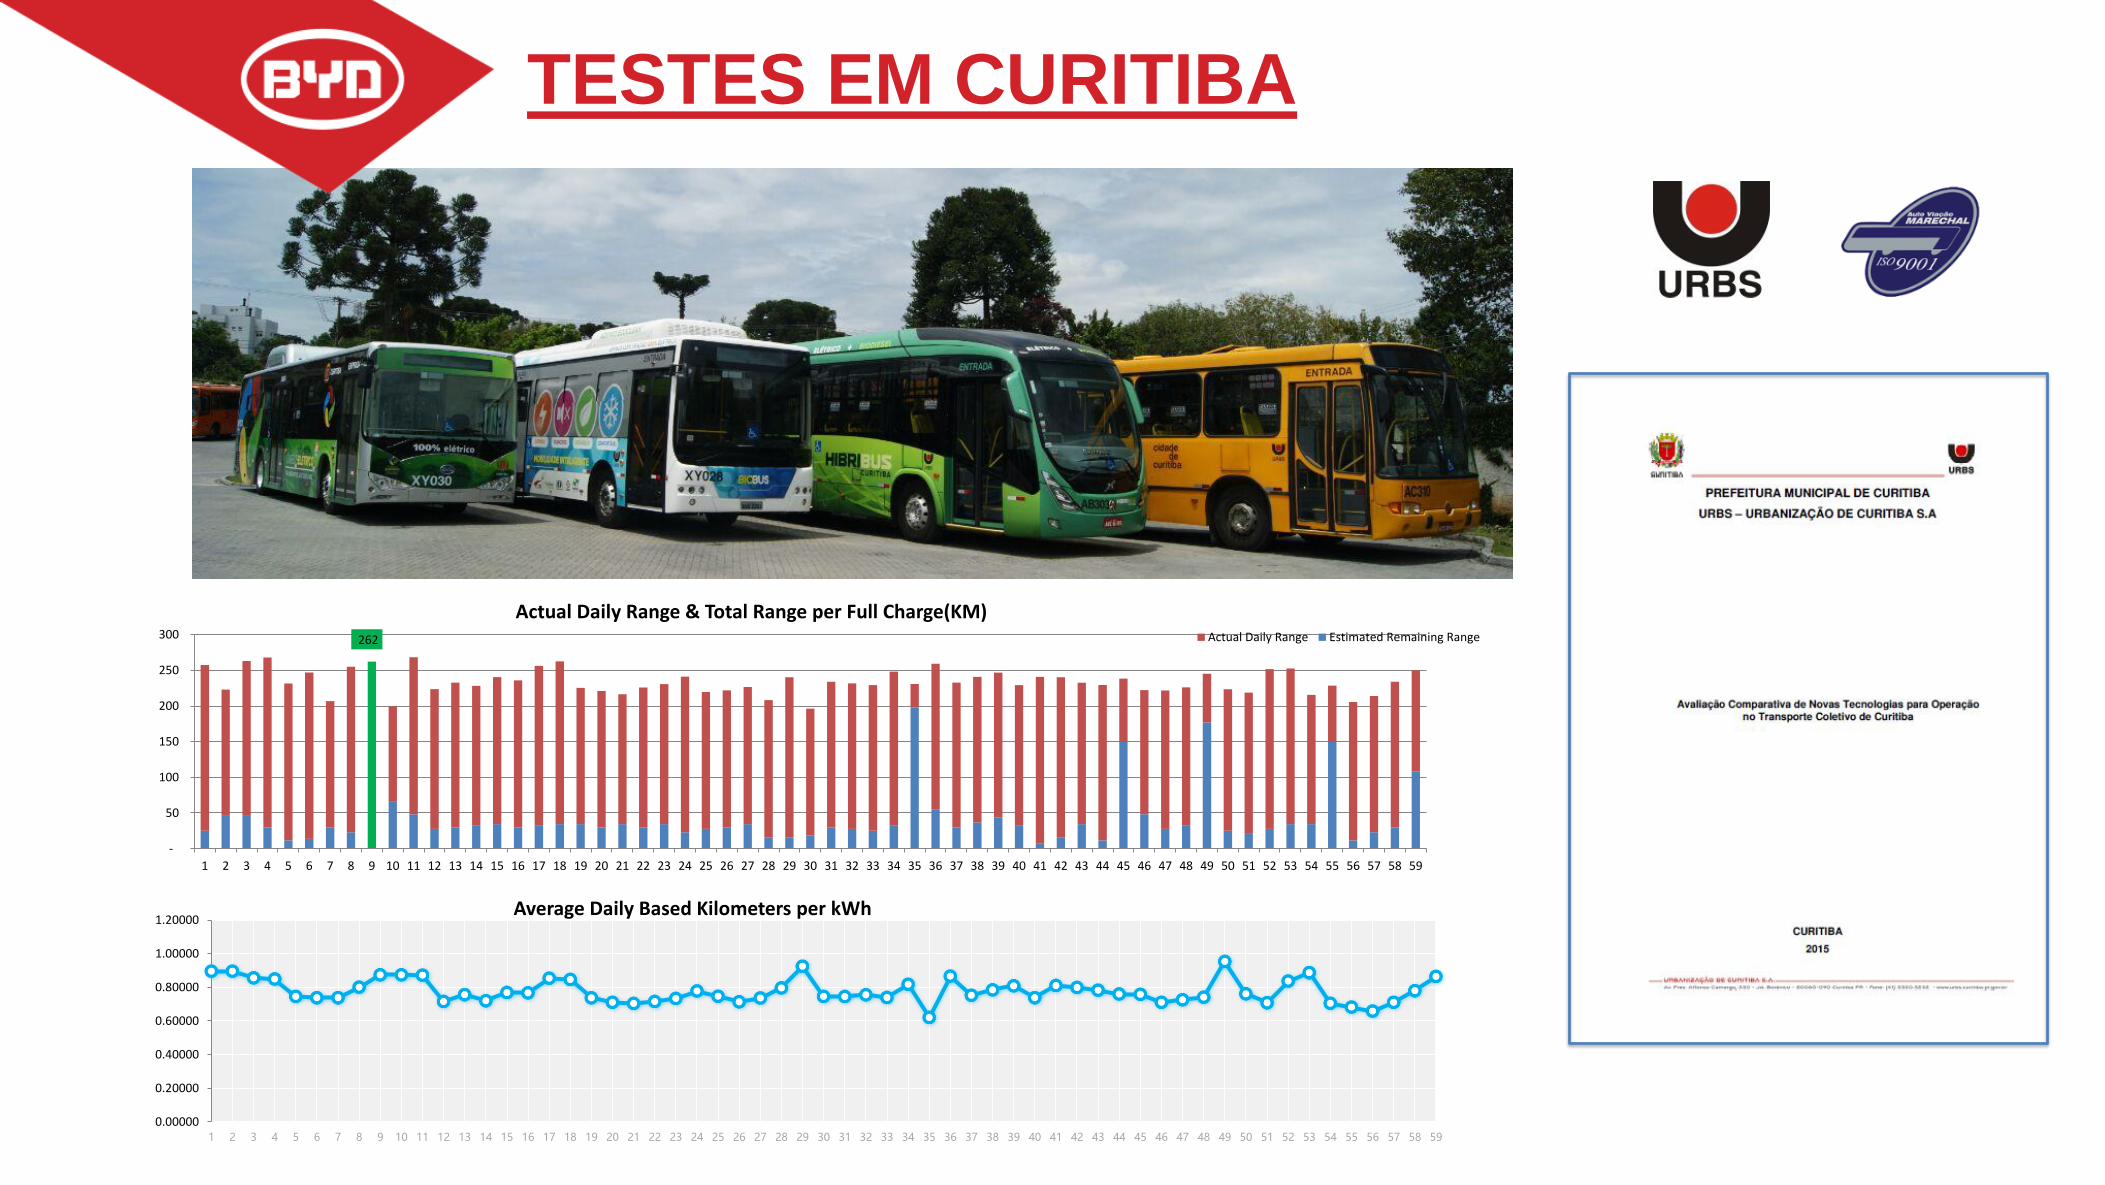
Average Daily Based Kilometers per kWh
262
-
50
100
150
200
250
300
1 2 3 4 5 6 7 8 9 10 11 12 13 14 15 16 17 18 19 20 21 22 23 24 25 26 27 28 29 30 31 32 33 34 35 36 37 38 39 40 41 42 43 44 45 46 47 48 49 50 51 52 53 54 55 56 57 58 59
Actual Daily Range & Total Range per Full Charge(KM)Actual Daily Range Estimated Remaining Range
SALES ACTIONS – CURITIBASALES ACTIONS – DEMOS
TESTES EM CURITIBA
SALES ACTIONS – CURITIBASALES ACTIONS – DEMOS
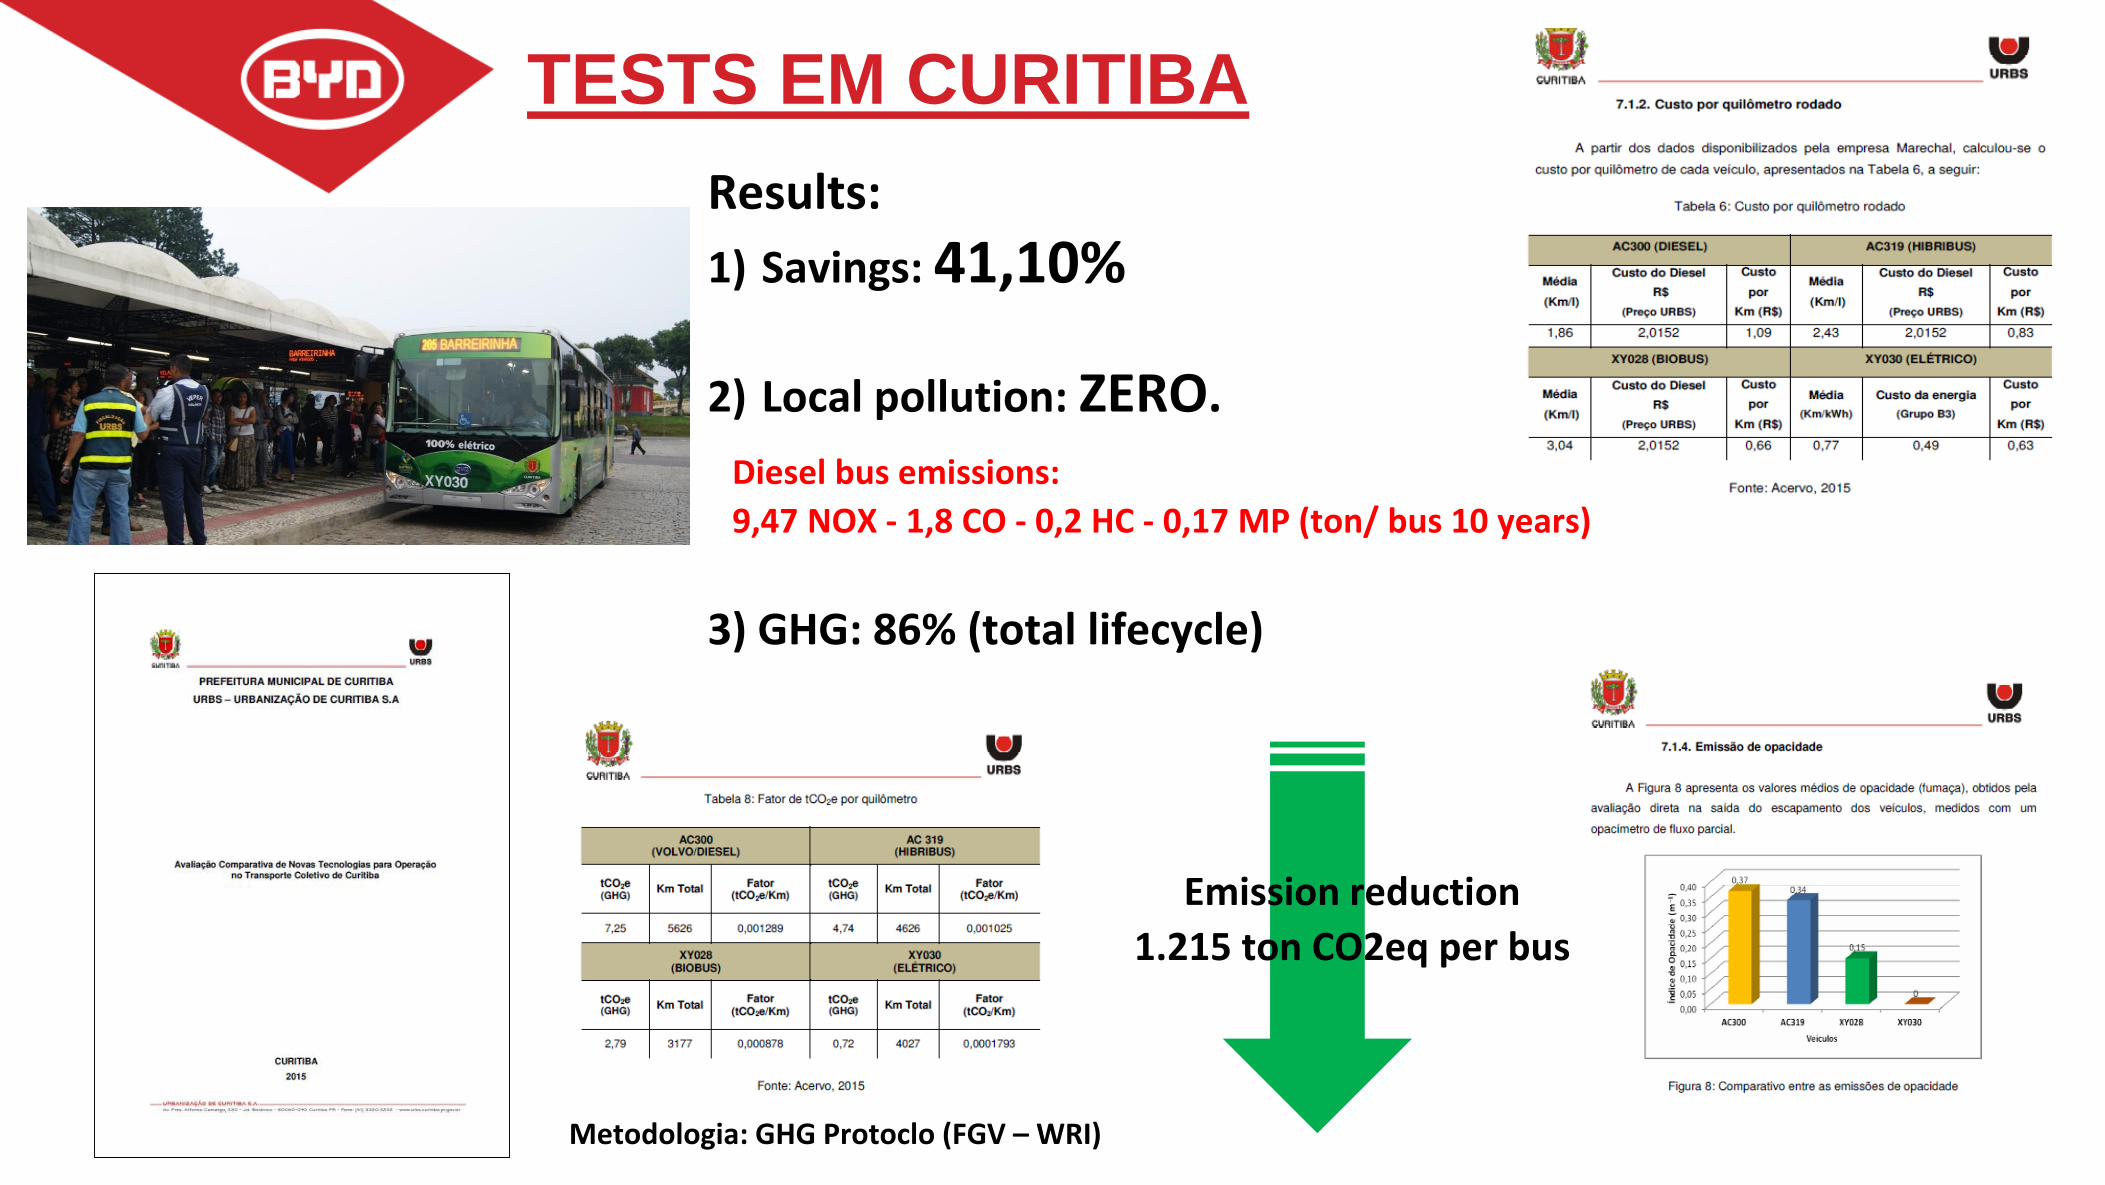
Results:
1) Savings: 41,10%
2) Local pollution: ZERO.
3) GHG: 86% (total lifecycle)
Diesel bus emissions:
9,47 NOX - 1,8 CO - 0,2 HC - 0,17 MP (ton/ bus 10 years)
Emission reduction
1.215 ton CO2eq per bus
Metodologia: GHG Protoclo (FGV – WRI)
TESTS EM CURITIBA
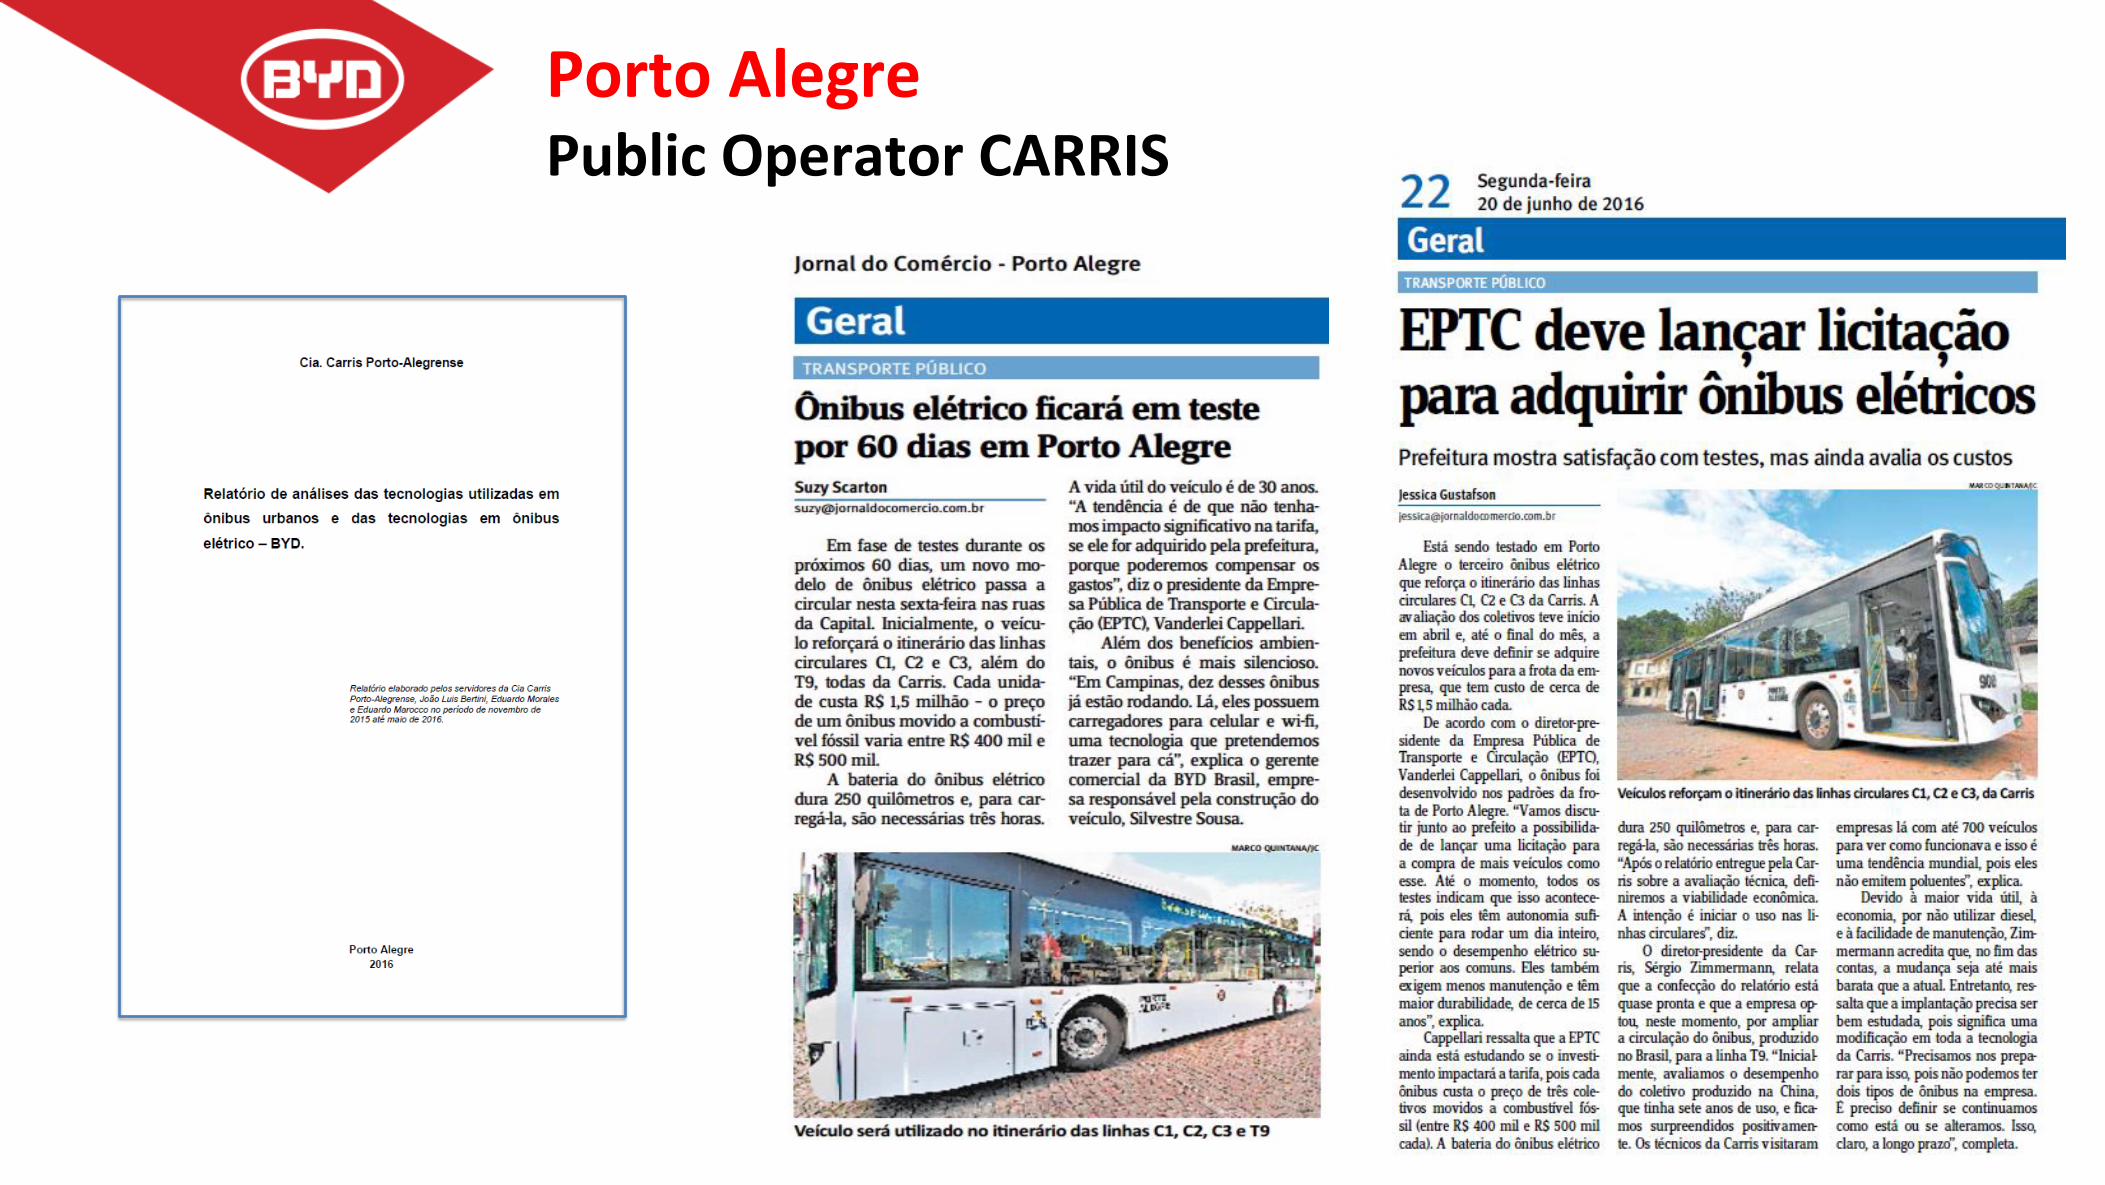
Porto AlegrePublic Operator CARRIS
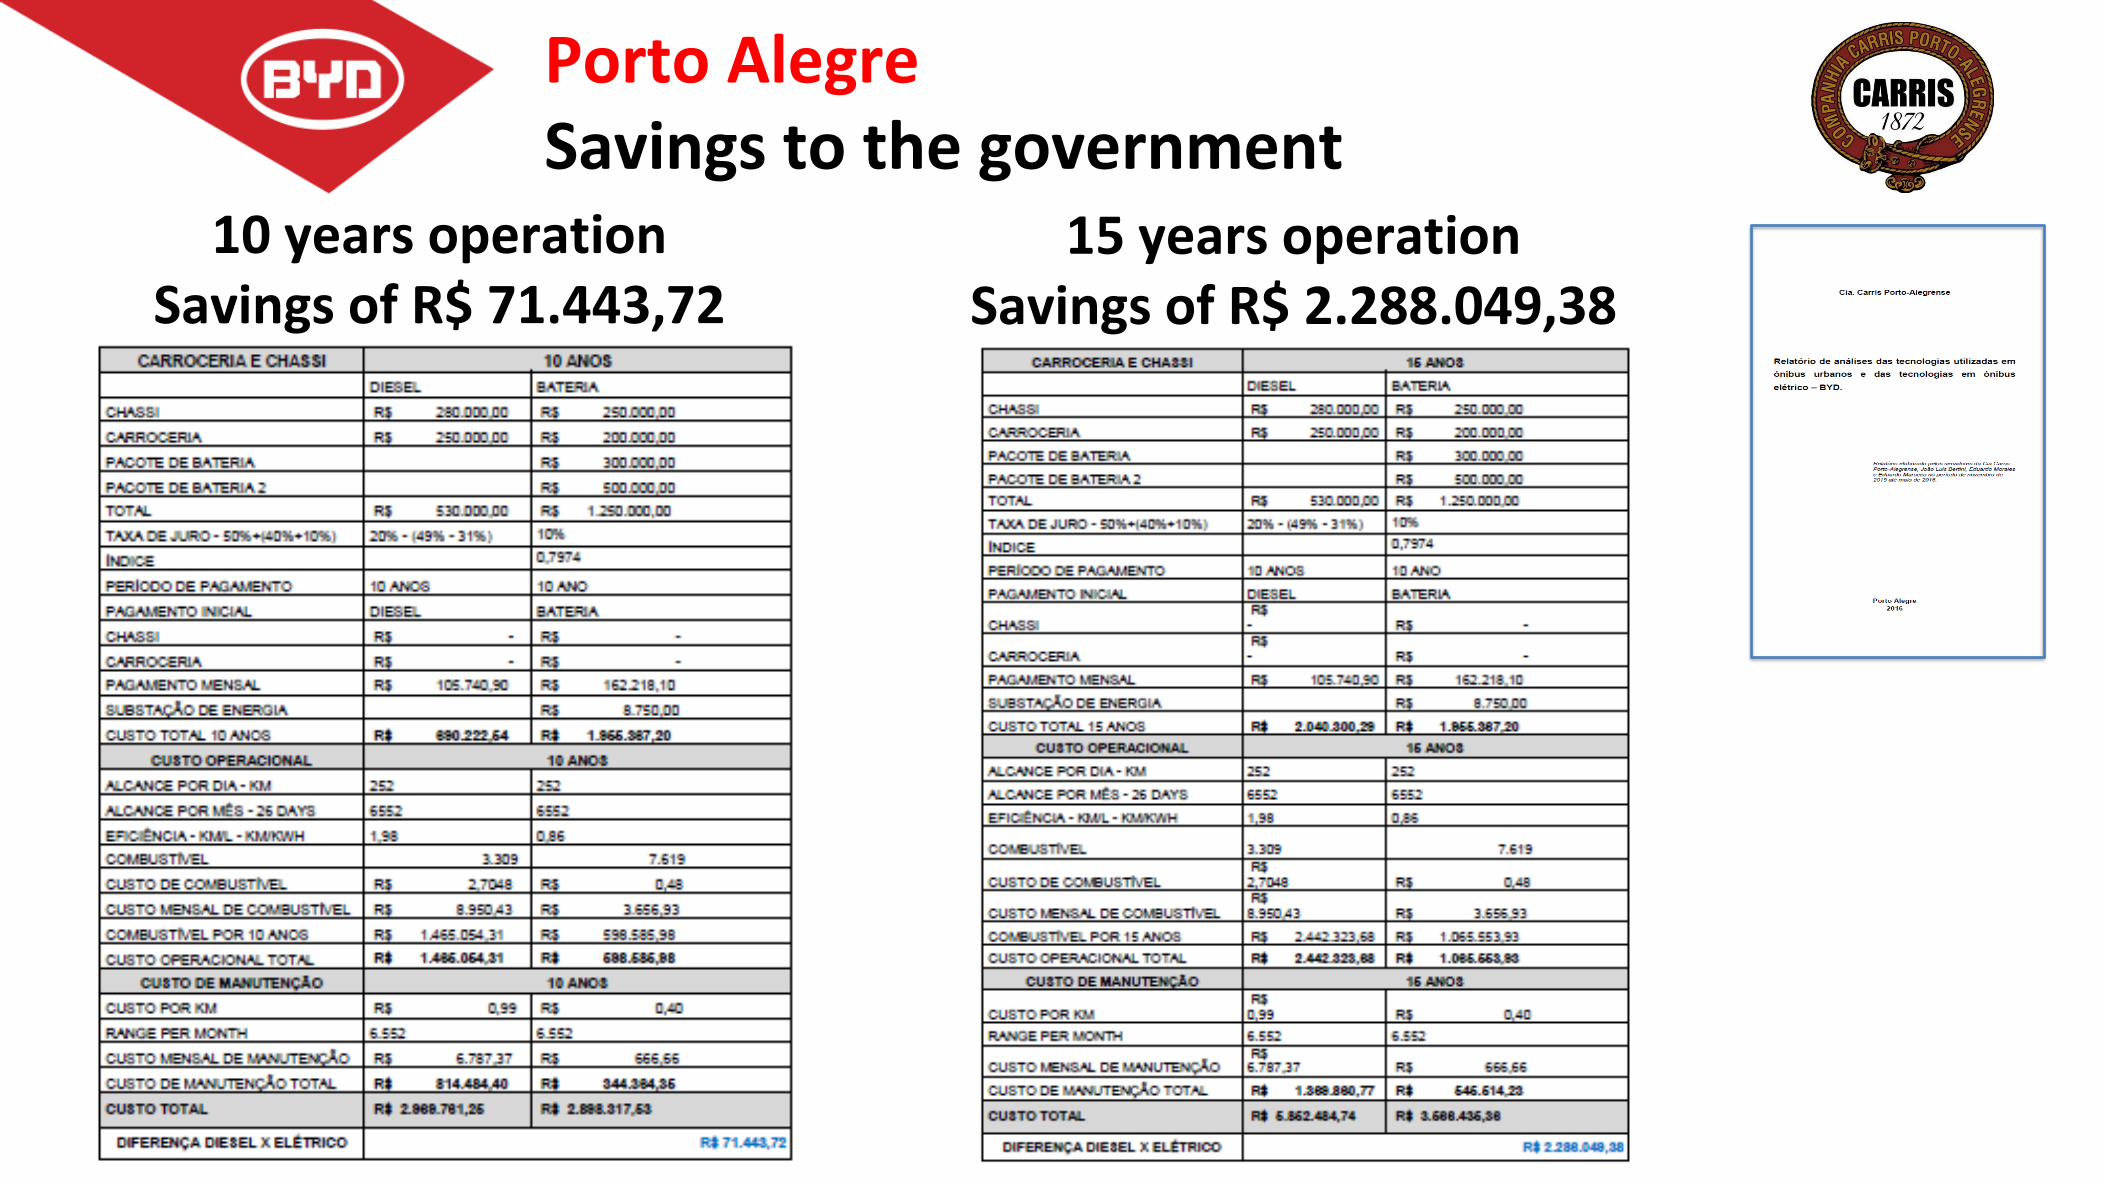
Porto Alegre Savings to the government
10 years operationSavings of R$ 71.443,72
15 years operationSavings of R$ 2.288.049,38
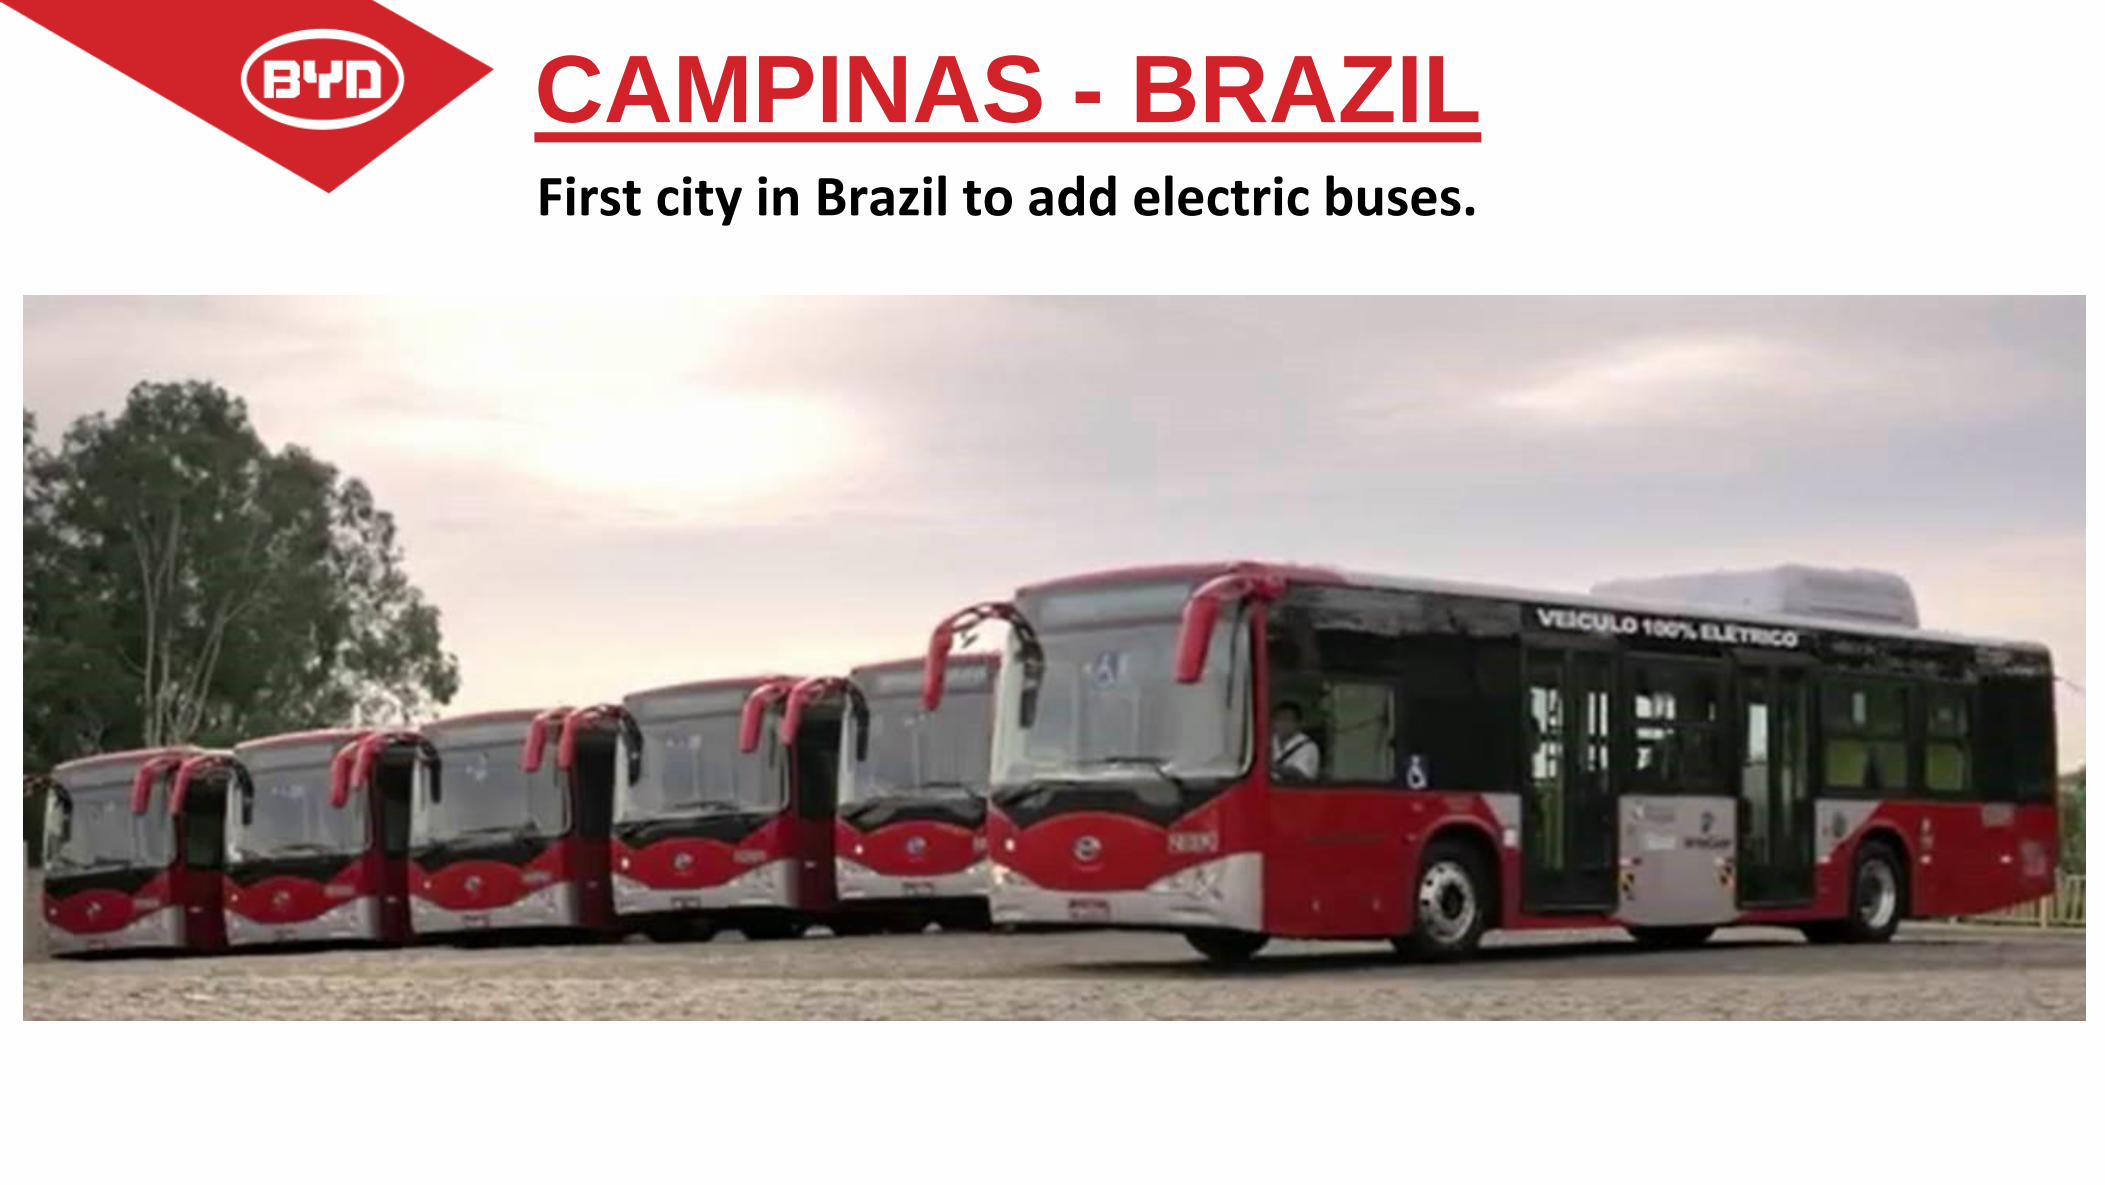
CAMPINAS - BRAZILFirst city in Brazil to add electric buses.

ELECTRIC BUSES ARE ALREADY A REALITY IN
MANY COUNTRIES AROUND THE WORLD
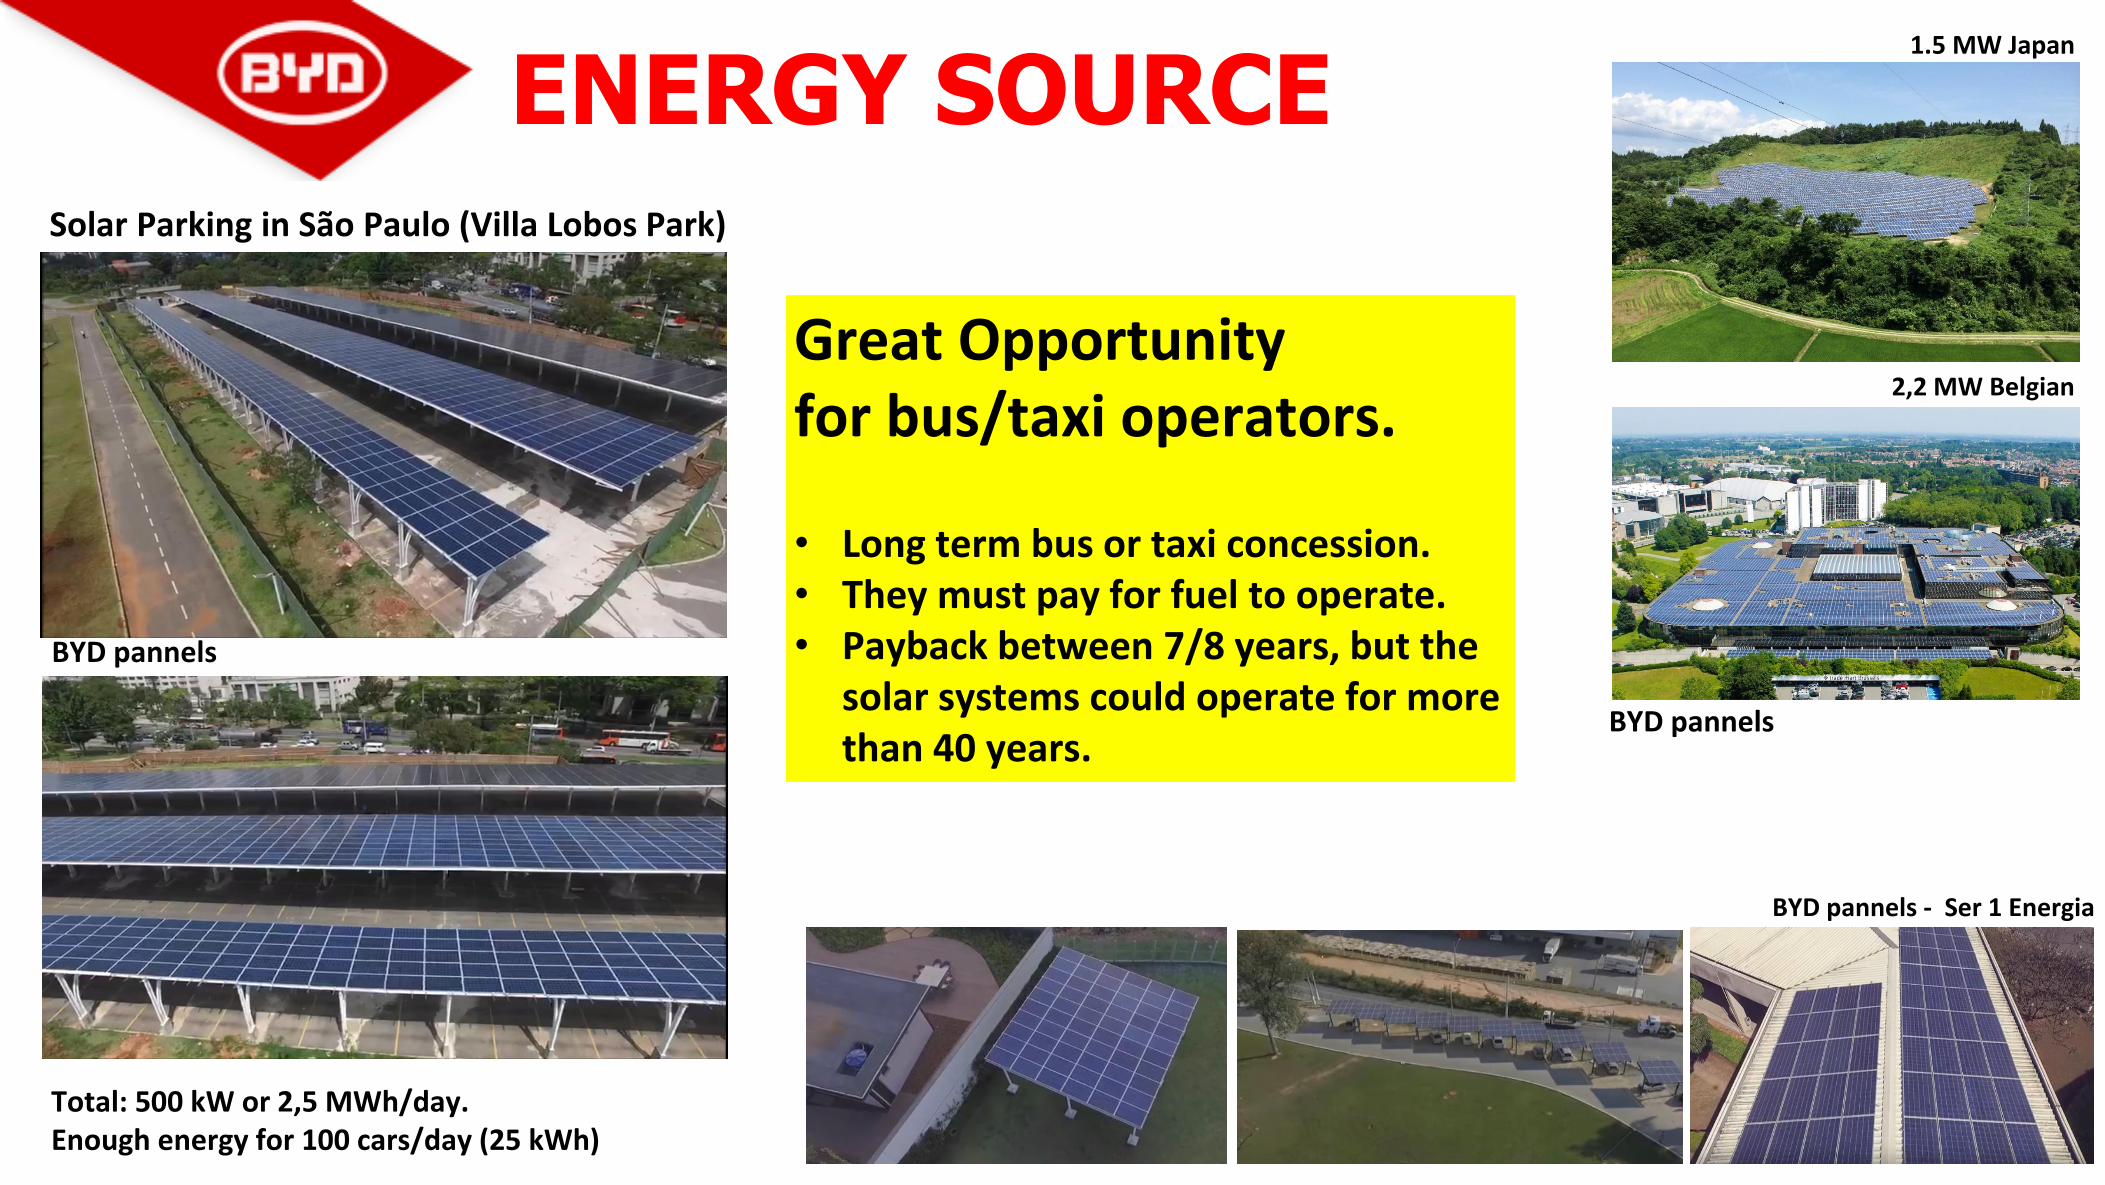
ENERGY SOURCE
Great Opportunityfor bus/taxi operators.
• Long term bus or taxi concession.• They must pay for fuel to operate.• Payback between 7/8 years, but the
solar systems could operate for more than 40 years.
Solar Parking in São Paulo (Villa Lobos Park)
Total: 500 kW or 2,5 MWh/day. Enough energy for 100 cars/day (25 kWh)
BYD pannels
1.5 MW Japan
2,2 MW Belgian
BYD pannels - Ser 1 Energia
BYD pannels
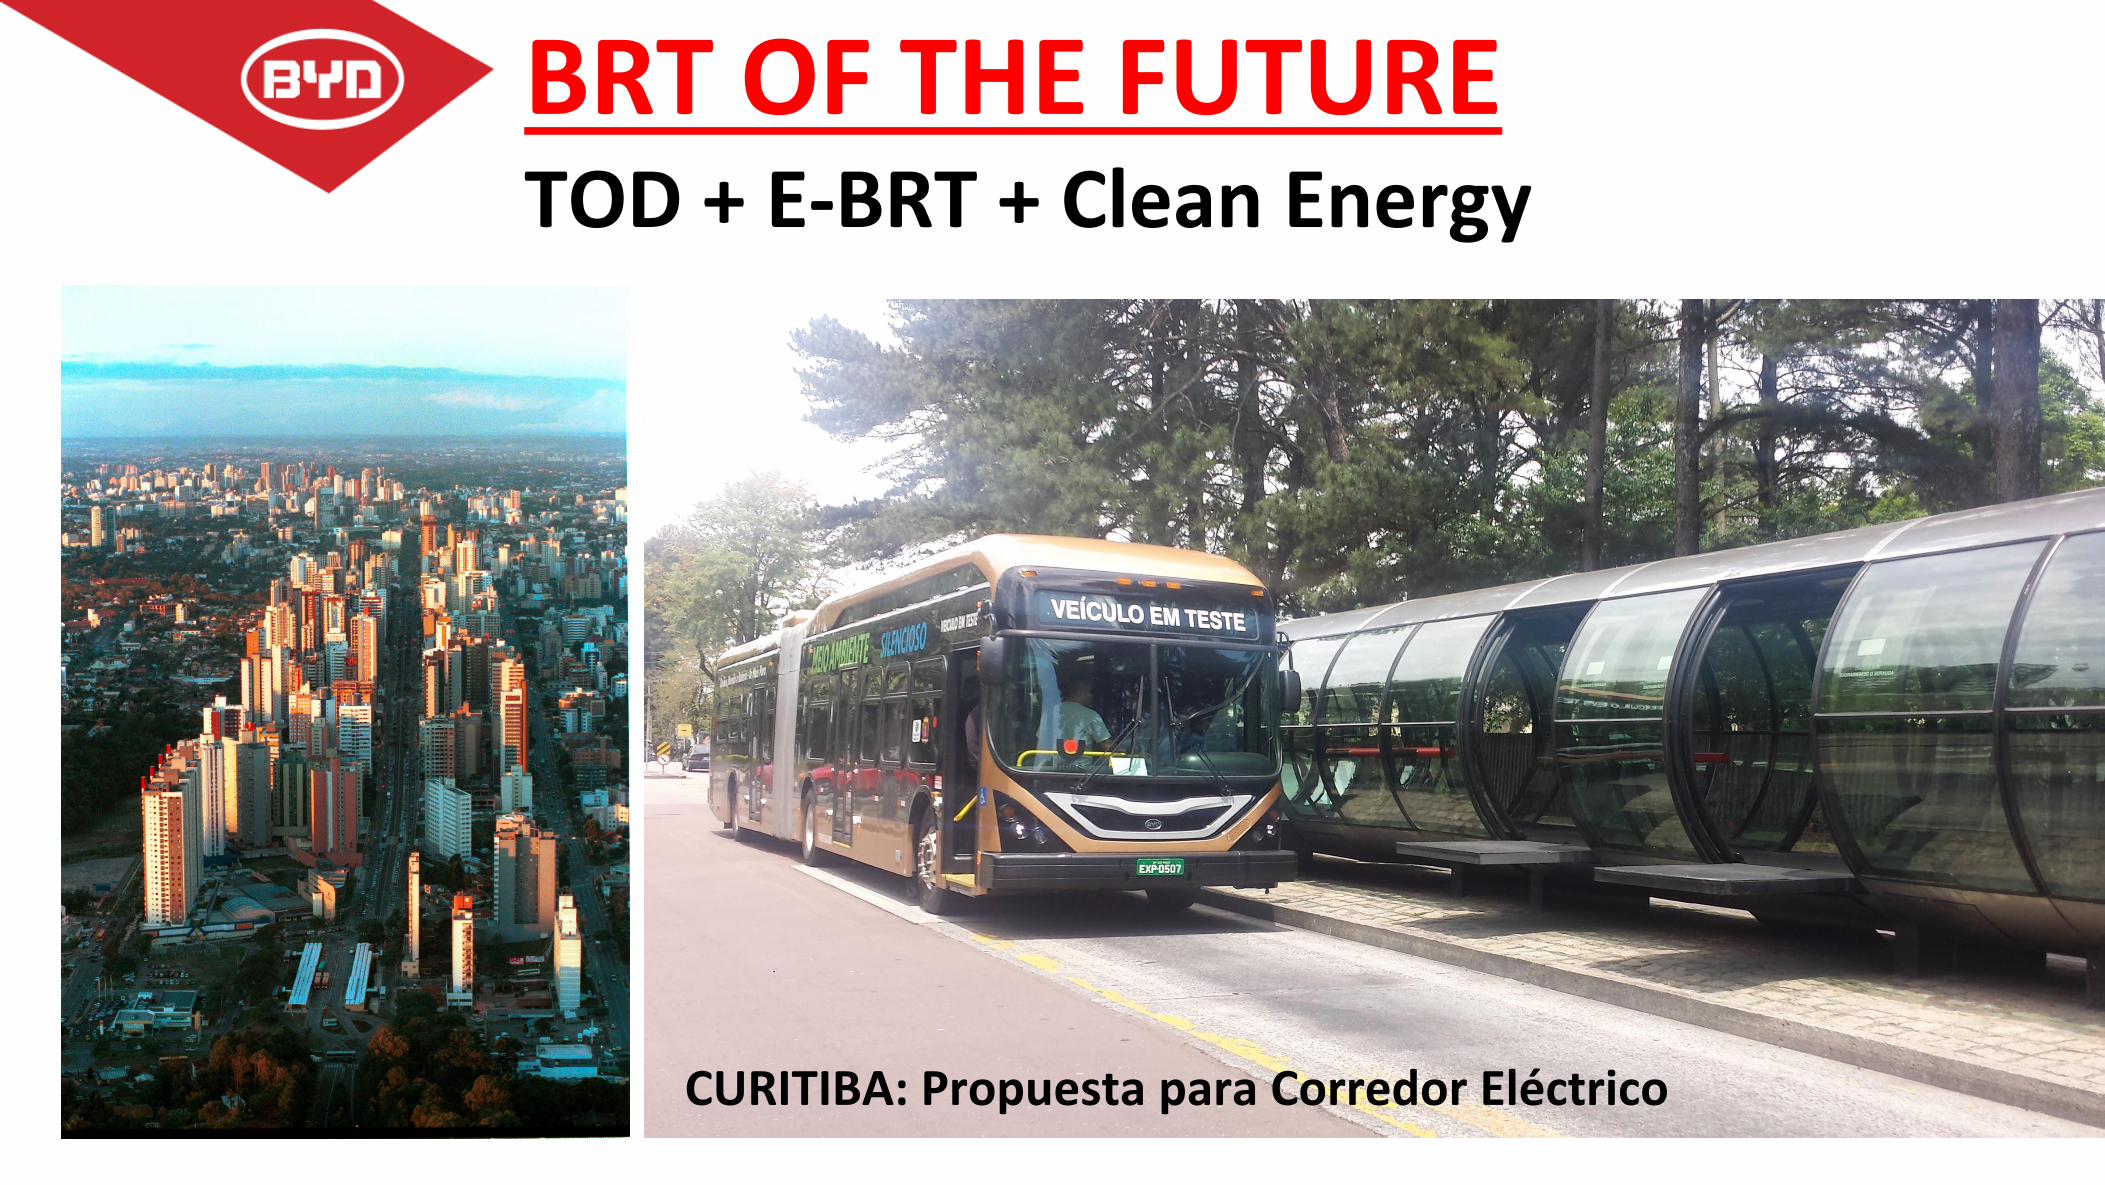
BRT OF THE FUTURETOD + E-BRT + Clean Energy
CURITIBA: Propuesta para Corredor Eléctrico
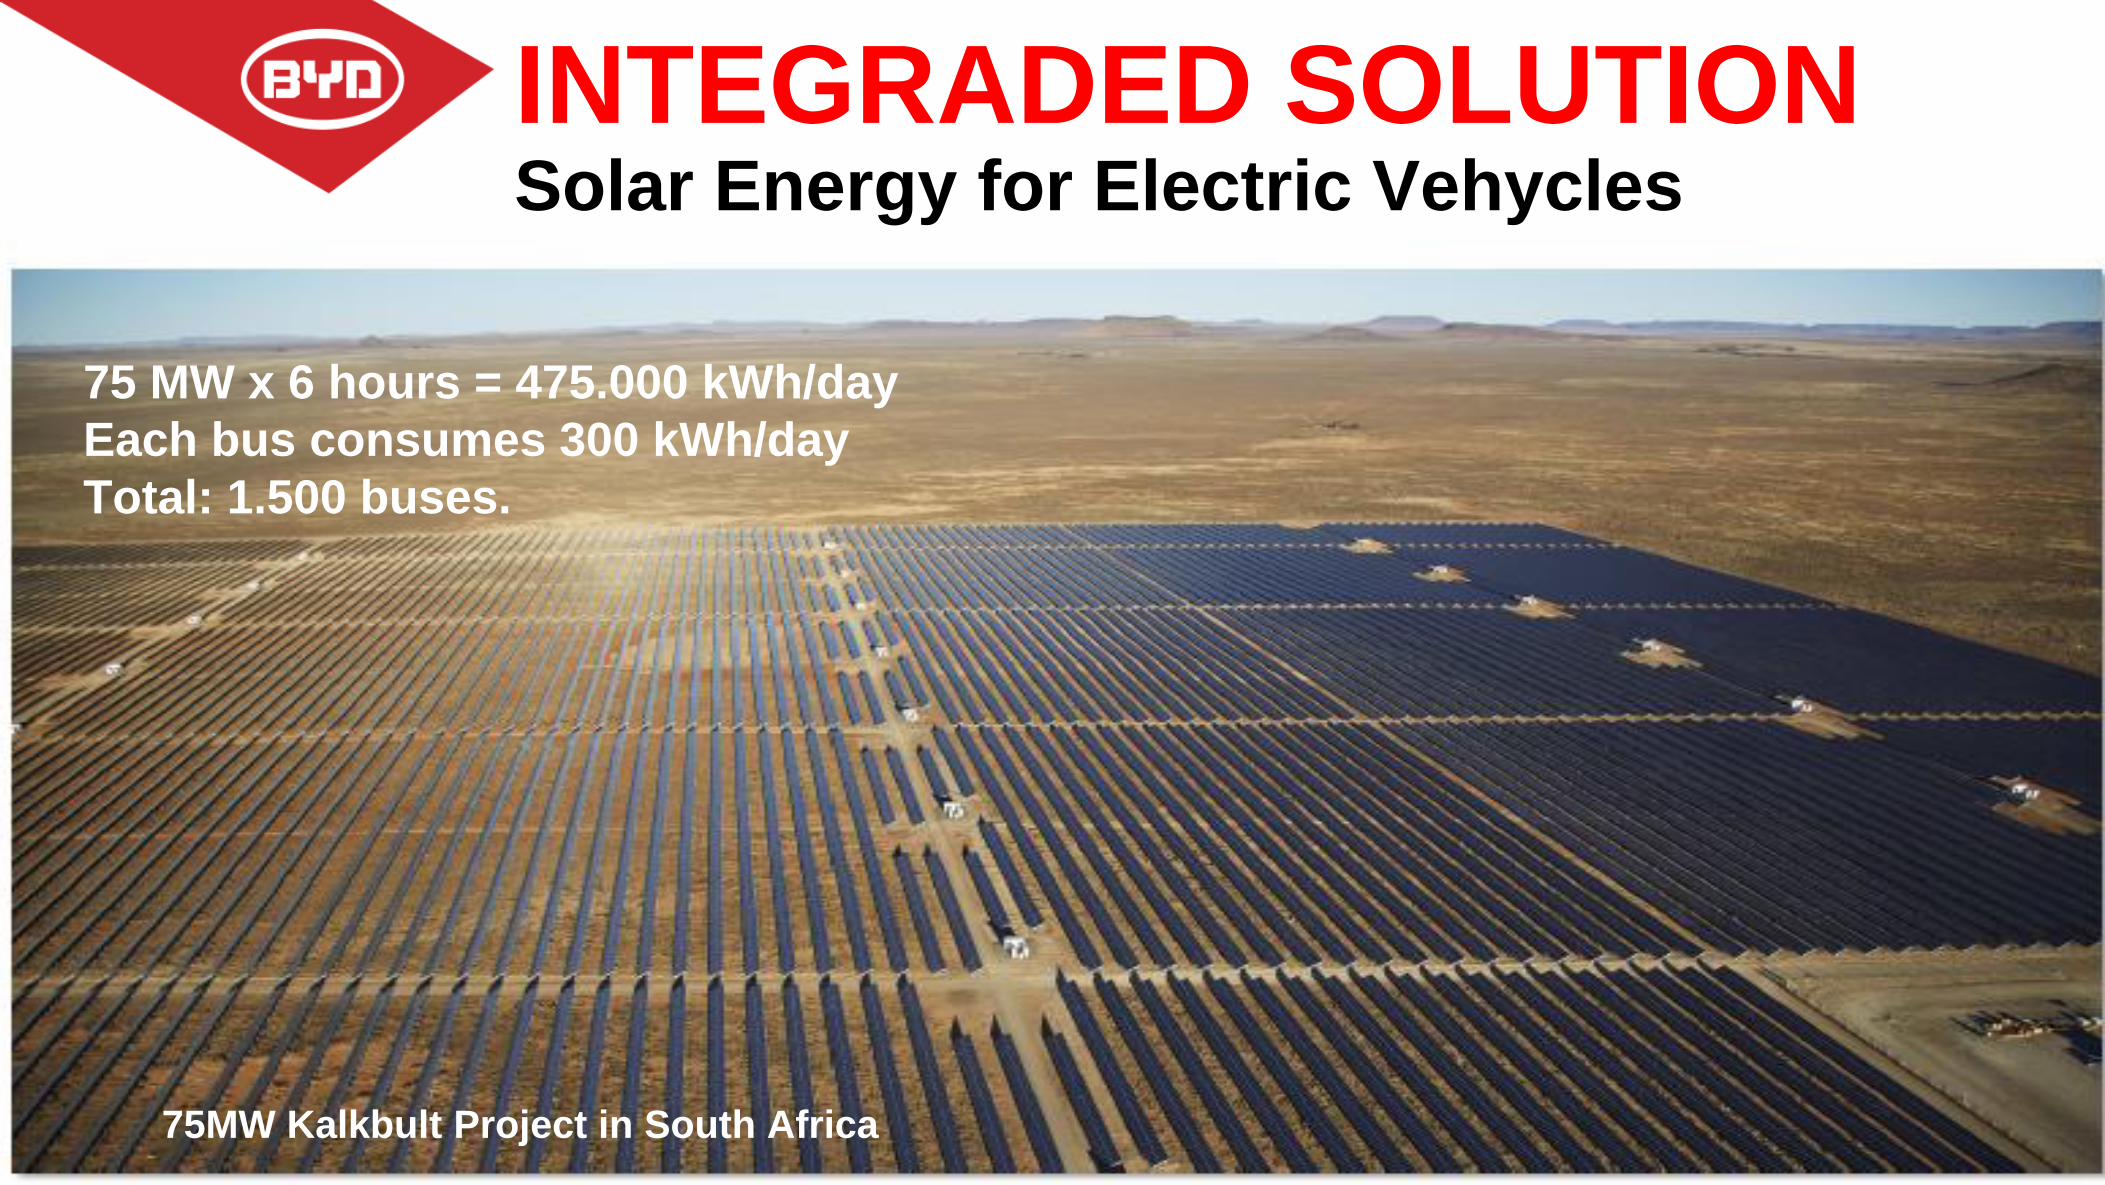
75MW Kalkbult Project in South Africa
INTEGRADED SOLUTIONSolar Energy for Electric Vehycles
75 MW x 6 hours = 475.000 kWh/day
Each bus consumes 300 kWh/day
Total: 1.500 buses.
Adalberto MalufDirector of Marketing, Sustainability
and New BussinessBYD Brasil
THANK YOU