who plays, who pays? - rand
TRANSCRIPT

Who Plays, Who Pays?Funding for and Access to Youth Sports: Appendix
Anamarie A. Whitaker, Garrett Baker, Luke J. Matthews,
Jennifer Sloan McCombs, Mark Barrett
Sponsored by Dick’s Sporting Goods Foundation
C O R P O R A T I O N

Limited Print and Electronic Distribution Rights
This document and trademark(s) contained herein are protected by law. This representation of RAND intellectual property is provided for noncommercial use only. Unauthorized posting of this publication online is prohibited. Permission is given to duplicate this document for personal use only, as long as it is unaltered and complete. Permission is required from RAND to reproduce, or reuse in another form, any of its research documents for commercial use. For information on reprint and linking permissions, please visit www.rand.org/pubs/permissions.
The RAND Corporation is a research organization that develops solutions to public policy challenges to help make communities throughout the world safer and more secure, healthier and more prosperous. RAND is nonprofit, nonpartisan, and committed to the public interest.
RAND’s publications do not necessarily reflect the opinions of its research clients and sponsors.
Support RANDMake a tax-deductible charitable contribution at
www.rand.org/giving/contribute
www.rand.org
For more information on this publication, visit www.rand.org/t/RR2581
Published by the RAND Corporation, Santa Monica, Calif.
© 2019 RAND Corporation
R® is a registered trademark.

iii
Preface
RAND researchers, in collaboration with the Dick’s Sporting Goods Foundation, developed and launched three large-scale online surveys of parents of middle and high school–age youths (grades 6–12); school administrators serving middle and/or high school grades; and community sports leaders from city and park leagues, nonprofits, or specialized/travel leagues or teams. Surveys include diverse populations but are not nationally representative; therefore, the results may not be generalizable to the whole population. This appendix supplements information presented in the main report. It contains detailed descriptions of survey and analysis methods, additional survey results, and survey protocols.
This research was commissioned and funded by the Dick’s Sporting Goods Foundation. The report should be of interest to youth sports policy leaders and decisionmakers, youth sports and extracurricular program leaders, school administrators, researchers, funders, and the general public.
This study was undertaken by RAND Education and Labor, a division of the RAND Corporation that conducts research on early childhood through postsecondary education programs, workforce development, and programs and policies affecting workers, entrepreneurship, and financial literacy and decisionmaking.
More information about RAND can be found at www.rand.org. Questions about this report should be directed to [email protected], and questions about RAND Education and Labor should be directed to [email protected].

iv
Contents
Preface ........................................................................................................................................... iii
Tables .............................................................................................................................................. v Survey and Analysis Methods ......................................................................................................... 1 Parent Survey Tables ....................................................................................................................... 6
School Administrator Tables ......................................................................................................... 26 Community Sports Leader Tables ................................................................................................. 59 Parent Survey Protocol .................................................................................................................. 84
School Administrator Survey Protocol .......................................................................................... 95 Local Out-of-School Organizations Survey Protocol .................................................................. 121
References ................................................................................................................................... 134

v
Tables
Parent Survey Table A.1. Parent Survey Demographics ................................................................. 6Parent Survey Table A.2. Family and Focal Child Demographics ................................................. 8Parent Survey Table A.3. Focal Child Participation in Extracurricular Activities .......................... 9Parent Survey Table A.4. Focal Child Sports and Extracurricular Activity Participation ............ 10Parent Survey Table A.5. Focal Child Sports Participation by School Level and Gender ........... 11Parent Survey Table A.6. Focal Child Reasons for Not Participating in Sports by School
Level and Gender .................................................................................................................. 13Parent Survey Table A.7. Focal Child Reasons for Not Participating in Sports by Income and
Region .................................................................................................................................... 14Parent Survey Table A.8. Where Children Are Accessing Sports by Grade Level and
Income ................................................................................................................................... 15Parent Survey Table A.9. Parent Time Commitment Expectations for Sports ............................. 16Parent Survey Table A.10. Travel Distance for School, Community/Recreational, and
Specialized/Travel Sports Leagues ........................................................................................ 17Parent Survey Table A.11. Focal Child Time Commitment ......................................................... 18Parent Survey Table A.12. Sports Fees for Overall Sample, Middle School, and High School,
and Lower-Income Youth ...................................................................................................... 19Parent Survey Table A.13. Focal Child Intends to Play Sport Beyond High School for Overall
Sample, Middle School, High School, Lower-Income Youth and by Gender ...................... 20Parent Survey Table A.14. Parental Beliefs About Sports ............................................................ 21Parent Survey Table A.15. Parental Beliefs About Sports for Lower-Income Parents ................. 22Parent Survey Table A.16. Parental Beliefs About Sports, for Middle School Parents ................ 23Parent Survey Table A.17. Parental Beliefs About Sports, for High School Parents ................... 24Parent Survey Table A.18. Parental Thoughts About Sports, for All Parents ............................... 25School Administrator Survey Table B.1. School Administrator Survey Demographic and
Background Information ....................................................................................................... 26School Administrator Survey Table B.2. School Demographics .................................................. 28School Administrator Survey Table B.3. Fitness Standards and Competitive Sports ................... 29School Administrator Survey Table B.4. School Year 2017–2018 Budget .................................. 30School Administrator Survey Table B.5. Changes in School Enrollment and Funding Since
the 2012–2013 School Year .................................................................................................. 33School Administrator Survey Table B.6. Summary of Extracurricular Activity Offerings .......... 34School Administrator Survey Table B.7. Extracurricular Activity Participation for Boys ........... 35School Administrator Survey Table B.8. Extracurricular Activity Participation for Girls ........... 37School Administrator Survey Table B.9. General Sports Funding Information ........................... 39School Administrator Survey Table B.10. General Sports Information ....................................... 41

vi
School Administrator Survey Table B.11. Extracurricular Arts and Academic Programs Funding Information .............................................................................................................. 43
School Administrator Survey Table B.12. Sports Offered in Schools .......................................... 45School Administrator Survey Table B.13. Extracurricular Arts and Academic Programs
Offered in Schools ................................................................................................................. 47School Administrator Survey Table B.14. Barriers to Extracurricular Participation, Overall ...... 48School Administrator Survey Table B.15. Barriers to Extracurricular Participation, Public
Schools .................................................................................................................................. 49School Administrator Survey Table B.16. Barriers to Extracurricular Participation, Private
Schools .................................................................................................................................. 50School Administrator Survey Table B.17. Order of Program to Cut Due to Hypothetical
Future Budget Cuts ................................................................................................................ 51School Administrator Survey Table B.18. Prediction of Sports Changes in Next Five Years
by School Type ...................................................................................................................... 52School Administrator Survey Table B.19. Prediction of Changes in Next Five Years by
Majority Low-Income and Not Majority Low-Income Schools ........................................... 53School Administrator Survey Table B.20. Community Support by School Type ........................ 54School Administrator Survey Table B.21. Community Support by Majority Low-Income
and Not Majority Low-Income Schools ................................................................................ 55School Administrator Survey Table B.22. Sports as Personal Skill Development, Overall ......... 56School Administrator Survey Table B.23. Sports as Personal Skill Development, Public
Schools .................................................................................................................................. 57School Administrator Survey Table B.24. Sports as Personal Skill Development, Private
Schools .................................................................................................................................. 58Community Sports Leader Survey Table C.1. Community Sports Leader Survey Background
Information ............................................................................................................................ 59Community Sports Leader Survey Table C.2. Community Sports Leader Survey Youth
Served .................................................................................................................................... 60Community Sports Leader Survey Table C.3. Community Sports Information ........................... 62Community Sports Leader Survey Table C.4. Sports Offered in Community Programs ............. 63Community Sports Leader Survey Table C.5. Community Programs Offered ............................. 65Community Sports Leader Survey Table C.6. Sports Participation over the Past Five Years,
Girls ....................................................................................................................................... 66Community Sports Leader Survey Table C.7. Sports Participation over the Past Five Years,
Boys ....................................................................................................................................... 67Community Sports Leader Survey Table C.8. Sports Fees ........................................................... 68Community Sports Leader Survey Table C.9. Parent Expectations for Time Commitment ........ 69Community Sports Leader Survey Table C.10. Who Pays for Costs of Sports ............................ 70Community Sports Leader Survey Table C.11. Barriers to Participation, All Programs .............. 71

vii
Community Sports Leader Survey Table C.12. Barriers to Participation, Community/Recreational Programs ...................................................................................... 72
Community Sports Leader Survey Table C.13. Barriers to Participation, Travel/Competitive Programs ................................................................................................................................ 73
Community Sports Leader Survey Table C.14. Current Sports Funding ...................................... 74Community Sports Leader Survey Table C.15. Changes in Sports Funding over Past Five
Years ...................................................................................................................................... 75Community Sports Leader Survey Table C.16. Challenges and Future Sports Program
Funding .................................................................................................................................. 76Community Sports Leader Survey Table C.17. Opinions About Sports Programming ................ 78Community Sports Leader Survey Table C.18. Community Perception of Sports
Programming ......................................................................................................................... 80Community Sports Leader Survey Table C.19. Beliefs About Sports, All Programs ................... 81Community Sports Leader Survey Table C.20. Beliefs About Sports,
Community/Recreational Programs ...................................................................................... 82Community Sports Leader Survey Table C.21. Beliefs About Sports, Competitive/Travel
Programs ................................................................................................................................ 83

viii

1
Survey and Analysis Methods
This appendix supplements information presented in the main report. It contains detailed descriptions of survey and analysis methods, additional survey results, and survey protocols.
The results presented here are full results that were presented in the main report or are closely related to the primary research questions:
• How do youths access sports? What are the barriers to participation? • What is the current state of funding and anticipated future funding for youth sports?
How has school and out-of-school funding for sports changed in the past five years? • What are the perceived benefits of sports participation? What are parents’, school
administrators’, and community sports program leaders’ beliefs in regard to enablers and challenges of youth sports participation?
Survey Methods and Administration In our study, we administered three surveys to the following samples: (1) parents of middle
and high school–age youths (grades 6–12); (2) school administrators (e.g., principals, provosts, vice or assistant principals) serving middle and high school–age youths (grades 6–12); and (3) community sports leaders from city or park departments, local nonprofits or community-based organizations, and specialized travel and competitive sports leagues. Prior to taking the survey, all participants consented to participate and were told that the survey was completely voluntary and that they could discontinue participation at any time. All surveys and consent protocols were approved by RAND’s Institutional Review Board prior to administration. All three survey instruments are provided in this appendix.
Surveys were developed by RAND researchers with input from Dick’s Sporting Goods Foundation staff. Large-scale national surveys, such as those from the Institute of Education Sciences, were used in forming questions for the school administrator or community sports leader surveys. All of the surveys were administered through Qualtrics, an online survey platform.
Parent Survey
RAND researchers requested that Qualtrics test and field a multi-question survey to a panel of 2,000 parents with children in middle and high school grades. Qualtrics and the company’s partners used panels that they established to recruit for the study. Initially, quotas were placed on the survey to generate a nationally representative sample based on race/ethnicity and household income. However, that quota was ultimately removed from the survey to allow for more panel participants to take part in the survey. Panel members were compensated for their time with an incentive provided through the panel that they were recruited from. RAND researchers did not

2
directly provide the incentive to panel participants; that was handled by Qualtrics. The survey was administered in late 2017.
After the pilot testing of the survey, a few demographic questions (zip code, highest education level, and gender of respondent) were added to better understand the characteristics of the survey participants. Participants were screened out of the survey if they did not have a child in the grade range specified (grades 6–12). The survey randomly selected one child (referred to as the focal child) in the middle or high school grade range for each participant; the participant would then answer questions about that child throughout the survey. The final analysis sample included 2,048 participants after omitting ten respondents who selected “yes” for extracurricular activities but provided no follow-up information about these activities.
School Administrator Survey
As with the parent survey, RAND researchers worked with Qualtrics to administer and recruit participants for the school administrator survey. RAND researchers specified that school administrators serving middle and high school grades (grades 6–12)—such as principals, vice principals, provosts, athletic directors, or other school leaders—be recruited to participate in the survey through Qualtrics’ various panels and panel partners. A total of 1,000 school administrators were to be surveyed, including 750 public school administrators and 250 private school administrators. Additionally, because a goal was to learn about schools with sports and those that may have cut or did not offer sports, a quota of 50 private schools and 75 public schools without sports was also added to survey recruitment; however, this was an optional quota, and it was never met, meaning that no one was dropped from the survey because their school did not have a sports program. No other restrictions or quotas were placed on survey recruitment. Again, Qualtrics panels and panel partners provided the survey respondents with an incentive for participating in the survey. Participants were screened out of the survey if (1) their school did not serve middle or high school grades; or (2) the participant indicated that their school was not public, private, or a charter (by answering “other”). The survey was administered in late 2017.
During the pilot survey administration, RAND researchers realized that school personnel who were not administrators and, potentially, non-school personnel had been screened into the survey. Thus, the question about school role was slightly changed so that when participants indicated that they had an “other” role in the school, they were screened out of the survey. The option to select “other school administrator role” remained, and participants were not screened out when they selected this option. Additionally, two open-ended questions on school budget and enrollment were changed to multiple choice after reviewing initial data and deeming the quality of those responses to be low.
A total of 1,034 respondents participated in the school administrator survey. During data cleaning, 213 participants were dropped after it was decided that these participants were not school administrators (e.g., teachers, counselors, teacher aides). Thus, our final sample consisted of 821 school administrators.

3
Community Sports Leaders Survey
Unlike the parent and school administrator surveys, RAND researchers identified the sample for the community sports leaders survey. RAND researchers and staff conducted a thorough web search of community organizations, including city governments, parks and recreation departments, and nonprofit organizations that provide youth sports, as well as competitive or specialized sports leagues and teams. The goal of the search was to generate a sample of community sports leaders’ (e.g., program providers, coaches, directors, volunteers, booster club presidents or members) email addresses so that potential participants could be invited to participate in the survey. A scan was conducted to include rural and urban programs and geographically diverse programs. Initial response rates were quite low, so multiple web searches were conducted in late 2017 and early 2018 to generate enough of a sample for the survey. Only publicly available email addresses were collected from web searches, and no phone calls or recruitment emails were sent to organizations to establish a list of potential survey recruits. To supplement the web search, the Dick’s Sporting Goods Foundation provided a list of sports leagues and organizations with which it partners who had agreed to participate in the survey.
Email addresses of community sports leaders were provided to Qualtrics, and Qualtrics staff sent invitations to participants to participate in the survey. Three reminders were sent inviting potential participants to take the survey. A total of 2,457 people were invited to participate, and 195 participated in the survey, resulting in a response rate of 8 percent. Participants were provided with a $10 gift card for completing the survey. The survey was administered in late 2017 and early 2018.
Seven participants were dropped from the survey after administration because someone from their organization had already participated in the survey. When multiple persons responded from a single organization, the most senior member who participated in the survey was retained, or, if the participants had the same or similar positions, the responses of the person who completed the survey first were retained. Our final analytic sample consisted of 188 community sports leaders.
Limitations
Two surveys relied on panels provided by Qualtrics: the survey of parents and the survey of school administrators. Qualtrics uses a set of partners who previously have enrolled individuals into survey panels, and so Qualtrics’ role in the system is as a deployer of surveys and an aggregator of panels. The panels themselves enroll individuals largely through online advertisements or other online communications. Thus, panelists are drawn from the population of individuals who are active online in some manner.
Notably, this recruitment strategy introduces at least one known bias (individuals who are completely offline are not sampled) and potentially introduces unknown biases arising from the non–probability-based recruitment procedure. That being said, all final panels are proportionate in their main demographic attributes to the general American population. Qualtrics then draws completely at random from these panels when deploying a survey. This ensures that the survey is deployed to a random set of a panel, which itself is proportionate to the U.S. population for

4
commonly measured demographics. In the main report, we provided weighted statistics for the parent and school administrator survey in order to make our results more representative of the national population. Even with the weights applied, our results are not nationally representative and should not be viewed as such.
Qualtrics will, however, randomly select from among panelists with particular attributes when the client requests this feature. This was the process followed in the current RAND study. The parent survey sampled randomly from among panelists who had children in school grades 6–12, while the school administrator panel sampled randomly from panelists who worked in school administrative roles. Many such attributes are known about the panelists because the empanelment process includes a base survey.
Substantial efforts are undertaken by Qualtrics and its partners to ensure that duplicate panelists are never used. Qualtrics uses industry-standard third parties who aggregate public records, such as birth certificates, marriages, and financial transactions, to ensure that the same individuals with slightly different data entries are not included multiple times within or across panels.
Data Analysis Survey data were analyzed by RAND researchers using R. Each survey data set was analyzed
separately, and results are presented by survey. The majority of analyses were conducted without survey weights. We present these results for select survey questions in the following sections.
Weighted results for the parent and school administrator survey are presented in the main report for highlighted findings. Results in the parent survey were weighted to the U.S. population on race, ethnicity, and income. In the school administrator survey, results were weighted to school type, school race majority-minority status, and majority of students in poverty.
Survey Weights for Parent and School Administrator Surveys
In this section, we describe how the survey weights were calculated for the parent and school administrator surveys. Weights were not calculated for the community sports leader survey because we did not have sufficient information for the population as a whole.
Parent Survey Weights Parent survey poststratification weights have been calibrated to race, gender, and income of
U.S. population based on U.S. census data, which are the key demographic variables we had available in our parent survey. We used a procedure called raking, which uses iterative proportional fitting to match the weighted marginal distributions of the survey to the population distributions.
The American Community Survey (U.S. Census Bureau, undated-a, undated-b, undated-c) was used to provide population margins for these variables. Males are slightly undersampled in the parent survey, as are low-income households and individuals who identify as Hispanic. Middle-income households are overrepresented.

5
Raked weights may exhibit large variability when the cross-classification of raking variables yields a large number of cells, many of which may be empty or contain few cases. Additionally, the algorithm can be unstable and unable to converge if some cell probabilities are near zero (Lohr, 2010). The number of cells is a function of the number of variables and the number of categories within each variable. The variables should therefore be chosen carefully, and they should not contain too many sparse categories. A general guideline is that categories containing less than 5 percent of the sample should be examined and perhaps collapsed with another category (Battaglia et al., 2013). We therefore chose to use only a few variables when constructing weights and examined the variability of the weights carefully.
School Administrator Weights School administrator weights were computed using two data sets maintained by the National
Center for Educational Statistics. The first one is the school universe survey (U.S. Department of Education, undated-b), which provides the total number of public and charter secondary and combined schools. The second data set is the digest of education statistics (U.S. Department of Education, undated-a), which provides the proportion of private schools that are religious (75.9 percent) and nonsectarian (24.1 percent).
Based on this information, we estimate that of all the secondary or combined schools in the United States, 68.5 percent are public, 19.1 percent are private and religious, 6.1 percent are private and nonreligious, and 6.3 percent are charter. Comparing these statistics with our school administrator sample suggests that we oversampled private nonreligious schools and undersampled private religious schools.
Whether a school requires physical education could be associated with survey responses about sports. However, we found that the proportion of schools in the survey that require physical education is consistent with national data suggesting that approximately 90 percent of middle schools and 93 percent of high schools require physical education (Centers for Disease Control and Prevention, 2016). Thus, we did not need to weight on this variable because the survey represents the population in this regard.
We also looked into weighting some variable that measures the racial/ethnic composition of a school. According to the National Center for Education and Statistics Schools and Staffing Survey (U.S. Department of Education, undated-c) , 35.6 percent of secondary/combined schools have a majority of students that are ethnic/racial minority. In the school administrator survey, 43 percent of administrators said that less than half of their students were white—i.e., the majority is of minority status. In the survey, 43 percent of administrators said that the majority (50 percent or more) of students were in poverty, whereas 50.2 percent of schools have the majority of students enrolled in the National School Lunch Program (NSLP).
Considering this information, poststratification weights were computed and calibrated via raking to school type (private religious, nonreligious, public, charter), majority-minority status, and majority of students in poverty (or enrolled in NSLP).
6
Parent Survey Tables
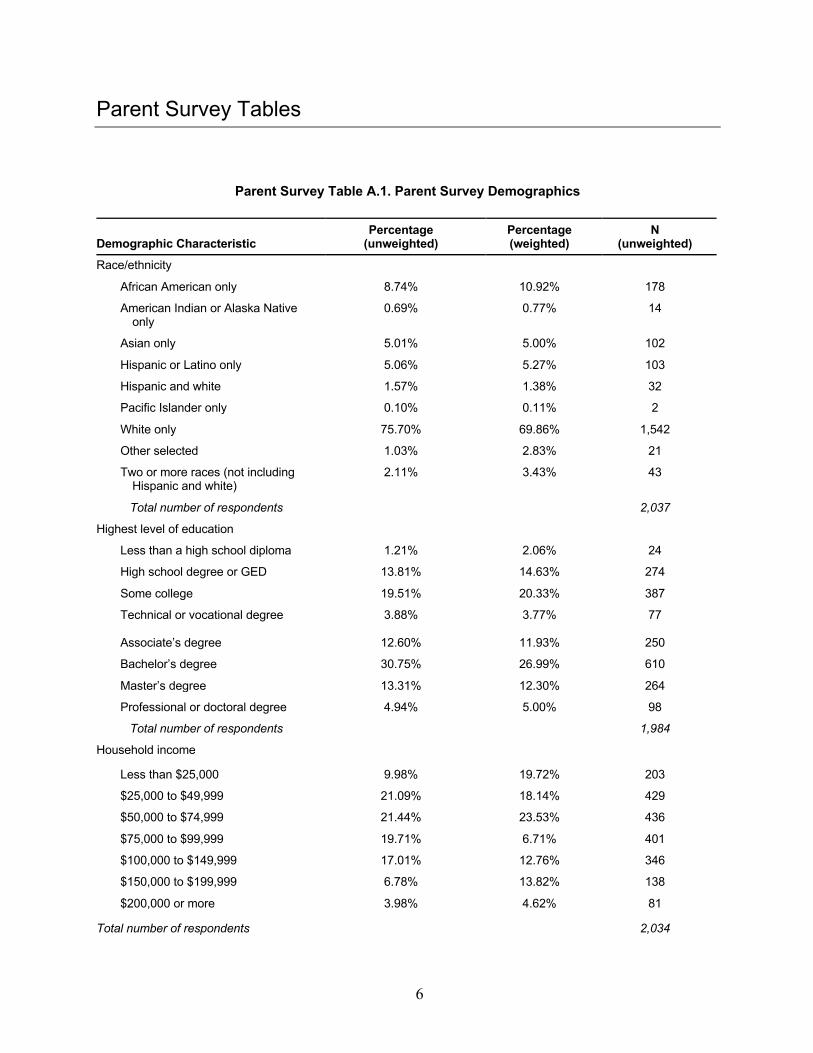
Parent Survey Table A.1. Parent Survey Demographics
Demographic Characteristic Percentage
(unweighted) Percentage (weighted)
N (unweighted)
Race/ethnicity
African American only 8.74% 10.92% 178
American Indian or Alaska Native only
0.69% 0.77% 14
Asian only 5.01% 5.00% 102
Hispanic or Latino only 5.06% 5.27% 103
Hispanic and white 1.57% 1.38% 32
Pacific Islander only 0.10% 0.11% 2
White only 75.70% 69.86% 1,542
Other selected 1.03% 2.83% 21
Two or more races (not including Hispanic and white)
2.11% 3.43% 43
Total number of respondents 2,037
Highest level of education
Less than a high school diploma 1.21% 2.06% 24
High school degree or GED 13.81% 14.63% 274
Some college 19.51% 20.33% 387
Technical or vocational degree 3.88% 3.77% 77
Associate’s degree 12.60% 11.93% 250
Bachelor’s degree 30.75% 26.99% 610
Master’s degree 13.31% 12.30% 264
Professional or doctoral degree 4.94% 5.00% 98
Total number of respondents 1,984
Household income
Less than $25,000 9.98% 19.72% 203
$25,000 to $49,999 21.09% 18.14% 429
$50,000 to $74,999 21.44% 23.53% 436
$75,000 to $99,999 19.71% 6.71% 401
$100,000 to $149,999 17.01% 12.76% 346
$150,000 to $199,999 6.78% 13.82% 138
$200,000 or more 3.98% 4.62% 81
Total number of respondents 2,034
7
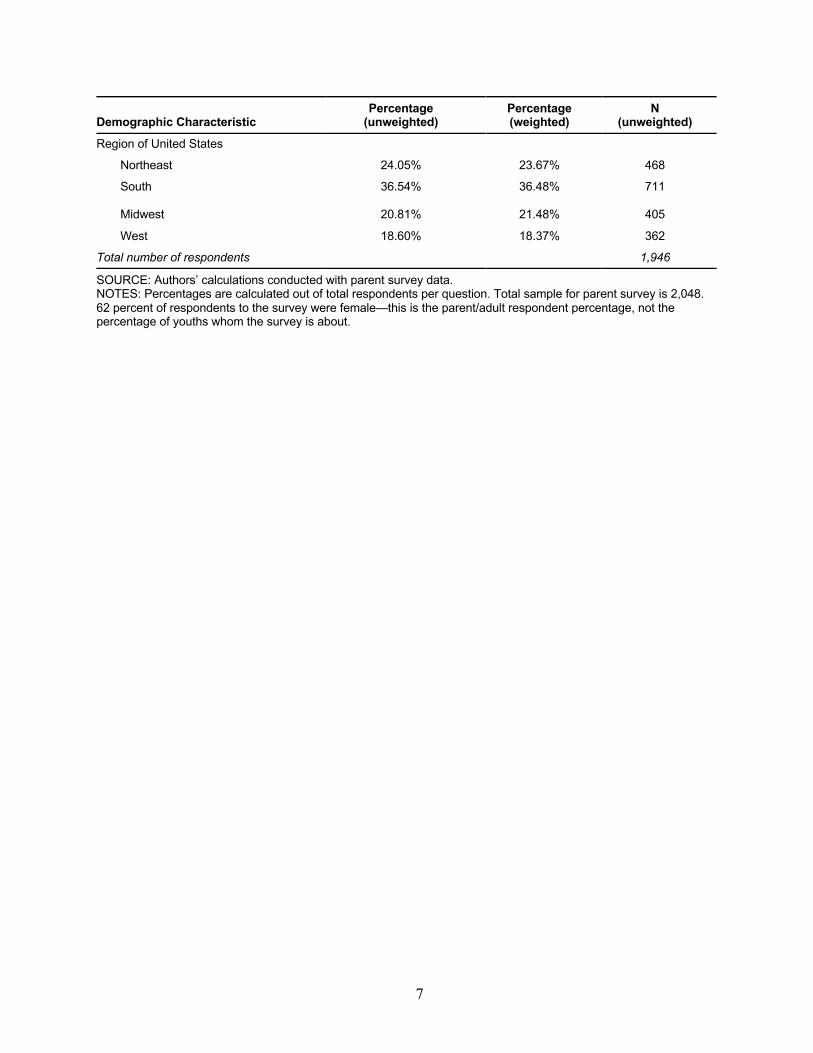
Demographic Characteristic Percentage
(unweighted) Percentage (weighted)
N (unweighted)
Region of United States
Northeast 24.05% 23.67% 468
South 36.54% 36.48% 711
Midwest 20.81% 21.48% 405
West 18.60% 18.37% 362
Total number of respondents 1,946
SOURCE: Authors’ calculations conducted with parent survey data. NOTES: Percentages are calculated out of total respondents per question. Total sample for parent survey is 2,048. 62 percent of respondents to the survey were female—this is the parent/adult respondent percentage, not the percentage of youths whom the survey is about.

8
Parent Survey Table A.2. Family and Focal Child Demographics
Average Minimum Maximum Total Number of
Respondents
Number of people in household 3.95 1 23 2,048
Number of children in the household 1.84 0 8 2,048
Number of children in grades 6–12 1.43 1 10 2,047
Grade level
Middle school (grades 6–8) 1.18 1 6 1,127
High school (grades 9–12) 1.20 1 6 1,343
Gender - - - 1,319 female 1,617 male
Focal child selection
Grade level - - -
Middle school (grades 6–8) - - - 915
High school (grades 9–12) - - - 1,133
Gender: Female - - - 909
Gender: Male - - - 1,139
SOURCE: Authors’ calculations conducted with parent survey data. NOTES: Averages are calculated out of total respondents per question. Total sample for parent survey is 2,048. Results are unweighted.

9
Parent Survey Table A.3. Focal Child Participation in Extracurricular Activities
Overall Sample
Percentage N
Child participates in extracurricular activities
Yes 87.01% 1,782
No 12.99% 266
Number of respondents 2,048
Reasons child doesn’t participate 266
No/lost interest 60.61% 160
Too expensive 26.14% 69
Time commitment too high 20.45% 54
Sport-related injury 0.76% 2
Safety concerns 5.68% 15
Not enough playing time 3.79% 10
Didn’t make team 2.65% 7
Coaching issues 1.52% 4
Sport no longer offered in the community 2.65% 7
Unable to find transportation to practice or games 9.09% 24
Too competitive 4.55% 12
Other 9.85% 26
Number of respondents 264
SOURCE: Authors’ calculations conducted with parent survey data. NOTES: Respondents answered whether their focal child participated in any extracurricular activities. If no, then they were prompted to answer why the child does not participate in any extracurricular activity. Respondents could select multiple options for why the child does not participate. Percentages are calculated out of total respondents per question. Total sample for parent survey is 2,048. Results are unweighted.

10
Parent Survey Table A.4. Focal Child Sports and Extracurricular Activity Participation
Participate in Activity Average Number of
Activities Participate in 2+ Activities
Percentage N Percentage N
Any activity 87.01% 1,782 2.88 78.79% 1,404
Sport 75.59% 1,347 1.59 39.00% 695
Arts programs 54.99% 980 1.31 18.74% 334
Academic clubs 34.06% 607 1.26 8.92% 159
Career (e.g., 4-H) 17.34% 309 1.27 4.55% 81
Character/civic development 24.75% 441 1.24 5.72% 102
Publications 17.34% 309 1.26 4.77% 85
Non-sport physical activities 28.68% 511 1.34 10.10% 180
Other 12.74% 227 1.28 4.15% 74
SOURCE: Authors’ calculations conducted with parent survey data. NOTES: Percentages for each individual activity taken out of “Any activity” total (n = 1,782), with the exception of whether youths participated in any activity, which is taken out of total participants (n = 2,048). Average number of activities does not include participants who indicated that their child did not participate in that activity. Results are unweighted.

11
Parent Survey Table A.5. Focal Child Sports Participation by School Level and Gender
Overall Sample Middle School High School Female Male
Percentage N Percentage N Percentage N Percentage N Percentage N
Badminton 4.08% 55 5.53% 35 2.80% 20 2.85% 16 4.97% 39
Baseball 25.61% 345 29.86% 189 21.85% 156 6.76% 38 39.11% 307
Basketball 38.23% 515 42.50% 269 34.45% 246 26.87% 151 46.37% 364
Cheerleading/drill team 9.21% 124 10.90% 69 7.70% 55 19.22% 108 2.04% 16
Cross-country 9.95% 134 8.85% 56 10.92% 78 10.85% 61 9.30% 73
Dance team 7.13% 96 9.16% 58 5.32% 38 12.46% 70 3.31% 26
Fencing 0.67% 9 0.95% 6 0.42% 3 0.71% 4 0.64% 5
Field hockey 2.75% 37 2.84% 18 2.66% 19 3.38% 19 2.39% 18
Football 22.35% 301 22.12% 140 22.55% 161 3.02% 17 36.18% 284
Golf 4.53% 61 5.69% 36 3.50% 25 3.02% 17 5.61% 44
Gymnastics 6.38% 86 7.42% 47 5.46% 39 12.46% 70 2.04% 16
Ice hockey 3.71% 50 3.16% 20 4.20% 30 1.78% 10 5.10% 40
Lacrosse 3.64% 49 2.37% 15 4.76% 34 4.27% 24 3.18% 25
Other (please specify) 5.64% 76 5.53% 35 5.74% 41 6.23% 35 5.22% 41
Rowing 0.67% 9 0.32% 2 0.98% 7 0.71% 4 0.64% 5
Rugby 1.41% 19 1.11% 7 1.68% 12 0.36% 2 2.17% 17
Skiing/snowboarding 2.30% 31 2.05% 13 2.52% 18 2.14% 12 2.42% 19
Soccer 24.57% 331 27.49% 174 21.99% 157 27.76% 156 22.29% 175
Softball 10.62% 143 11.37% 72 9.94% 71 20.46% 115 3.57% 28
Swimming 10.99% 148 11.37% 72 10.64% 76 12.10% 68 10.19% 80
Tennis 7.72% 104 8.53% 54 7.00% 50 7.30% 41 8.03% 63
Track and field 14.63% 197 10.11% 64 18.63% 133 16.19% 91 13.50% 106
Ultimate frisbee 0.82% 11 0.47% 3 1.12% 8 0.89% 5 0.76% 6
Volleyball 12.18% 164 11.69% 74 12.61% 90 21.89% 123 5.22% 41

12
Overall Sample Middle School High School Female Male
Percentage N Percentage N Percentage N Percentage N Percentage N
Water polo 0.82% 11 0.63% 4 0.98% 7 0.53% 3 1.02% 8
Wrestling 4.38% 59 4.27% 27 4.48% 32 0.89% 5 6.88% 54
SOURCE: Authors’ calculations conducted with parent survey data. NOTES: Respondents answered the question “What sport(s) did your child participate in within the last 12 months?” Percentages are calculated from the total number who played sports (overall N = 1,347; middle school N = 633; high school N = 714; female N = 562; male N = 785). Participants could select multiple sports. Results are unweighted.

13
Parent Survey Table A.6. Focal Child Reasons for Not Participating in Sports by School Level and Gender
Overall Sample Middle School High School Females Males
Percentage N Percentage N Percentage N Percentage N Percentage N
Child participates in sports
Yes 75.59% 1,347 77.29% 633 74.14% 714 70.34% 562 79.86% 785
No 24.41% 435 22.71% 186 25.86% 249 29.66% 237 20.14% 198
Number of respondents 1,782 819 963 799 983
Reasons child doesn’t participate
No/lost interest 57.01% 248 53.76% 100 59.44% 148 57.81% 137 56.06% 111
Too expensive 15.40% 67 19.35% 36 12.45% 31 16.03% 38 14.65% 29
Time commitment too high 18.16% 79 17.74% 33 18.47% 46 16.46% 39 20.20% 40
Sport-related injury 7.36% 32 8.06% 15 6.83% 17 6.75% 16 8.08% 16
Safety concerns 8.74% 38 9.68% 18 8.03% 20 6.33% 15 11.62% 23
Not enough playing time 3.68% 16 5.38% 10 2.41% 6 3.38% 8 4.04% 8
Coaching issues 1.84% 8 1.61% 3 2.01% 5 1.27% 3 2.53% 5
Sport no longer offered in the community 2.76% 12 5.38% 10 0.80% 2 3.38% 8 2.02% 4
Unable to find transportation to practice or games
5.52% 24 5.38% 10 5.62% 14 4.22% 10 7.07% 14
Too competitive 4.37% 19 3.76% 7 4.82% 12 4.22% 10 4.55% 9
Other 9.20% 40 9.68% 18 8.84% 22 8.44% 20 10.10% 20
Number of respondents 435 186 249 237 198
SOURCE: Authors’ calculations conducted with parent survey data. NOTES: Percentages of child participating in sport taken out of “number of respondents” N for each subgroup. Respondents answered the question “Why did your child NOT participate in any team sports in the last 12 months?” Only respondents who indicated that their child participated in extracurricular activities were asked the question. No respondent answered that their child did not make the team, so that reason is not displayed in the table. Percentages of reasons for not participating are taken out of “No” responses for participating in the sport for each subgroup. All respondents who indicated “No” for sports participation reported one or more reasons for not participating. Results are unweighted.

14
Parent Survey Table A.7. Focal Child Reasons for Not Participating in Sports by Income and Region
Low Income Northeast South Midwest West
Percentage N Percentage N Percentage N Percentage N Percentage N
Child participates in sports
Yes 66.19% 321 80.54% 331 70.02% 418 75.21% 264 77.48% 258
No 33.81% 164 19.46% 80 29.98% 179 24.79% 87 22.52% 75
Number of respondents 485 411 597 351 333
Reasons child doesn’t participate
No/lost interest 59.15% 97 60.00% 48 56.42% 101 57.47% 50 53.33% 40
Too expensive 21.95% 36 10.00% 8 19.55% 35 17.24% 15 10.67% 8
Time commitment too high 15.24% 25 17.50% 14 20.11% 36 13.79% 12 22.67% 17
Sport-related injury 7.32% 12 7.50% 6 7.26% 13 4.60% 4 12.00% 9
Safety concerns 12.80% 21 10.00% 8 8.94% 16 5.75% 5 10.67% 8
Not enough playing time 1.22% 2 2.50% 2 3.91% 7 4.60% 4 2.67% 2
Coaching issues 1.83% 3 1.25% 1 2.23% 4 1.15% 1 2.67% 2
Sport no longer offered in the community 3.66% 6 0.00% 0 3.35% 6 2.30% 2 4.00% 3
Unable to find transportation to practice or games
6.71% 11 6.25% 5 5.03% 9 3.45% 3 9.33% 7
Too competitive 4.27% 7 6.25% 5 4.47% 8 3.45% 3 4.00% 3
Other 10.98% 18 7.50% 6 10.06% 18 9.20% 8 9.33% 7
Number of respondents 164 80 179 87 75
SOURCE: Authors’ calculations conducted with parent survey data. NOTE: Percentages of child participating in sport were taken out of “Number of respondents” N for each subgroup. Respondents answered the question “Why did your child NOT participate in any team sports in the last 12 months?” Only respondents who indicated that their child participated in extracurricular activities were asked the question. No respondent indicated that their child did not make the team, so that reason is not displayed in the table. Percentages of reasons for not participating were taken out of “No” responses for participating in the sport for each subgroup. All respondents who indicated “No” for sports participation reported one or more reasons for not participating. Lower income is defined as household income less than $50,000. Results are unweighted.

15
Parent Survey Table A.8. Where Children Are Accessing Sports by Grade Level and Income
Overall Sample Middle School High School Lower Income
Percentage Sports N Percentage Sports N Percentage Sports N Percentage Sports N
School 62.38% 1,970 55.30% 824 68.71% 1,146 67.04% 423
Recreational/community program 23.12% 730 28.52% 425 18.29% 305 23.93% 151
Specialized organization 14.50% 458 16.17% 241 13.01% 217 9.03% 57 SOURCE: Authors’ calculations conducted with parent survey data. NOTES: Respondents answered which type of organization(s) provides [SPORT]. Percentages are taken out of total responses for each subgroup (parents could respond for up to three sports): overall N = 3,158; middle school N = 1,490; high school N = 1,668; low-income N = 631. All but one respondent who specified sports also provided one or more selections for where those sports were accessed. Lower income is defined as household income less than $50,000. Results are unweighted.

16
Parent Survey Table A.9. Parent Time Commitment Expectations for Sports
Overall Sample Middle School High School
Percentage N Percentage N Percentage N
Time commitments for parents
Fundraising 57.46% 774 54.19% 343 60.36% 431
Concession stand sales 37.71% 508 36.49% 231 38.80% 277
Team support 68.52% 923 67.46% 427 69.47% 496
None of the above 13.66% 184 15.01% 95 12.46% 89
Other 2.15% 29 2.05% 13 2.24% 16
SOURCE: Authors’ calculations conducted with parent survey data. NOTES: Respondents answered the question “Which of the following commitments are expected of you from your child’s sports teams?” Respondents could select multiple options for why the child does not participate. Percentages are taken out of the total respondents who indicated that the focal child played a sport for each subgroup: overall sample N = 1,347; middle school N = 633; high school N = 714. Four respondents indicated participation in sports but did not provide any parent expectations. Results are unweighted.

17
Parent Survey Table A.10. Travel Distance for School, Community/Recreational, and Specialized/Travel Sports Leagues
Overall Sample Middle School High School
Percentage Sports N Percentage Sports N Percentage Sports N School Sports
Travel distance for practice 0–15 minutes 52.64% 1,036 51.33% 423 53.58% 613 16–30 minutes 29.93% 589 32.16% 265 28.32% 324 31–45 minutes 9.60% 189 9.71% 80 9.53% 109 46+ minutes 7.83% 154 6.80% 56 8.57% 98
Travel distance for games/competitions
0–15 minutes 12.63% 248 16.42% 135 9.90% 113 16–30 minutes 34.13% 670 36.37% 299 32.52% 371 31–45 minutes 30.72% 603 30.41% 250 30.94% 353 46+ minutes 22.52% 442 16.79% 138 26.64% 304
Community/Recreational Sports Travel distance for practice
0–15 minutes 30.56% 66 28.46% 37 33.72% 29 16–30 minutes 29.63% 64 36.92% 48 18.60% 16 31–45 minutes 26.85% 58 21.54% 28 34.88% 30 46+ minutes 12.96% 28 13.08% 17 12.79% 11
Travel distance for games/competitions
0–15 minutes 13.89% 30 13.08% 17 15.12% 13 16–30 minutes 31.02% 67 31.54% 41 30.23% 26 31–45 minutes 34.72% 75 33.08% 43 37.21% 32 46+ minutes 20.37% 44 22.31% 29 17.44% 15
Specialized/Travel Sports Leagues Travel distance for practice
0–15 minutes 23.39% 29 26.03% 19 19.61% 10 16–30 minutes 33.87% 42 27.40% 20 43.14% 22 31–45 minutes 20.97% 26 21.92% 16 19.61% 10 46+ minutes 21.77% 27 24.66% 18 17.65% 9
Travel distance for games/competitions
0–15 minutes 11.29% 14 13.70% 10 7.84% 4 16–30 minutes 23.39% 29 19.18% 14 29.41% 15 31–45 minutes 25.00% 31 27.40% 20 21.57% 11 46+ minutes 40.32% 50 39.73% 29 41.18% 21
SOURCE: Authors’ calculations conducted with parent survey data. NOTES: Respondents answered the question “Thinking about transportation for [SPORT], what is the average commute distance for your family?” Percentages are taken out of total responses for each subgroup (parents could respond for up to three sports). For school travel to practice: overall N = 1,968; middle school N = 824; high school N = 1,144. For school travel to games/competitions: overall N = 1,963; middle school N = 822; high school N = 1,141. For community/recreational travel to practice: overall N = 216; middle school N = 130; high school N = 86. For community/recreational travel to games/competitions: overall N = 216; middle school N = 130; high school N = 86. For specialized/travel leagues travel to practice: overall N = 124; middle school N = 73; high school N = 51. For specialized/travel leagues travel to games/competitions: overall N = 124; middle school N = 73; high school N = 51. Results are unweighted.

18
Parent Survey Table A.11. Focal Child Time Commitment
Overall Sample Middle School High School
Percentage Sports N Percentage Sports N Percentage Sports N Years child has played sports
0–2 years 37.39% 977 43.40% 536 32.00% 441 3–5 years 41.18% 1,076 40.65% 502 41.65% 574 6–9 years 15.96% 417 14.25% 176 17.49% 241 10+ years 5.47% 143 1.70% 21 8.85% 122
Hours child participates in sports per week 0–2 hours 9.57% 250 11.98% 148 7.41% 102 3–6 hours 37.83% 988 46.32% 572 30.21% 416 7–10 hours 29.40% 768 26.64% 329 31.88% 439 11–15 hours 14.82% 387 10.53% 130 18.66% 257 16–19 hours 4.67% 122 2.19% 27 6.90% 95 20+ hours 3.71% 97 2.35% 29 4.94% 68
Months per year child participates 1–3 months 31.39% 820 32.39% 400 30.50% 420 4–6 months 42.92% 1,121 43.16% 533 42.70% 588 7–9 months 15.77% 412 14.66% 181 16.78% 231 10–12 months 9.92% 259 9.80% 121 10.02% 138
SOURCE: Authors’ calculations conducted with parent survey data. NOTES: Respondents answered the following questions “How many years has your child participated in [SPORT] on a team?” “During the season, how many hours does your child participate in [SPORT] each week?” “How many months per year does your child participate in [SPORT]?” Percentages are taken out of total responses for each subgroup (parents could respond for up to three sports). For years child has played sports: overall N = 2,613; middle school N = 1,235; high school N = 1,378. For hours child participates in sports per week: overall N = 2,612; middle school N = 1,235; high school N = 1,377. For months per year child participates in sports: overall N = 2,612; middle school N = 1,235; high school N = 1,377. All respondents who indicated participation in sports provided years, months, and hours played. Results are unweighted.

19
Parent Survey Table A.12. Sports Fees for Overall Sample, Middle School, and High School, and Lower-Income Youth
Overall Sample Middle School High School Lower Income
Percentage Sports N Percentage Sports N Percentage Sports N Percentage Sports N
$0–100 13.67% 357 14.91% 184 12.55% 173 22.20% 127
$101–250 22.40% 585 24.64% 304 20.39% 281 30.24% 173
$251–500 27.83% 727 26.82% 331 28.74% 396 29.02% 166
$501–1,000 20.18% 527 17.67% 218 22.42% 309 12.24% 70
$1,001–2,500 10.38% 271 10.53% 130 10.23% 141 4.37% 25
$2,501–5,000 4.13% 108 3.65% 45 4.57% 63 1.57% 9
$5,001–10,000 1.11% 29 1.22% 15 1.02% 14 0.35% 2
More than $10,000 0.31% 8 0.57% 7 0.07% 1 0.00% 0
SOURCE: Authors’ calculations conducted with parent survey data. NOTES: Respondents answered the question “Over the past 12 months, approximately how much money have you spent for [SPORT] team participation (include participation fees; equipment; travel; private coaching; camps; etc.)?” Percentages are taken out of total responses for each subgroup (parents could respond for up to three sports): overall N = 2,612; middle school N = 1,234; high school N = 1,378; lower income N = 572. All respondents who indicated participation in sports provided fees information. Lower income is defined as household income less than $50,000. Results are unweighted.

20
Parent Survey Table A.13. Focal Child Intends to Play Sport Beyond High School for Overall Sample, Middle School, High School, Lower-Income Youth and by Gender
Percentage N Percentage N Percentage N Overall Sample Middle School High School
Definitely will not play beyond high school 19.30% 504 17.44% 215 20.97% 289
Maybe will play beyond high school 52.59% 1373 53.12% 655 52.10% 718
Definitely will play beyond high school 28.11% 734 29.44% 363 26.92% 371
Lower Income Females Males Definitely will not play beyond high school 18.39% 105 21.83% 236 17.52% 268
Maybe will play beyond high school 56.74% 324 54.76% 592 51.05% 781
Definitely will play beyond high school 24.87% 142 23.40% 253 31.44% 481
SOURCE: Authors’ calculations conducted with parent survey data. NOTES: Respondents answered the question “Please indicate your child’s intention to participate in [SPORT] beyond high school in a competitive team format (e.g., college team, local recreation team, etc.).” Percentages are taken out of total responses for each subgroup (parents could respond for up to three sports): overall N = 2,611; middle school N = 1,233; high school N = 1,378; low income N = 571; female N = 1,081; male N = 1,530. One respondent who reported specific sports did not provide responses to this question. Lower income is defined as household income less than $50,000. Results are unweighted.

21
Parent Survey Table A.14. Parental Beliefs About Sports
Skills Taught Strongly Disagree Disagree Neutral Agree
Strongly Agree
Number of Respondents
Discipline/personal accountability
2.59% 1.22% 8.01% 44.26% 43.92% 2,047
Teamwork 1.52% 1.03% 4.89% 34.07% 58.50% 2,046 Leadership 1.52% 1.27% 13.57% 42.75% 40.89% 2,042 Strategic thinking 1.47% 1.52% 12.64% 44.83% 39.54% 2,041 Confidence 1.62% 1.03% 7.84% 39.90% 49.61% 2,040 Tolerance of diversity
(racial, ethnic, religious, etc.)
2.83% 3.71% 21.07% 37.98% 34.41% 2,046
Competitiveness 1.37% 1.22% 8.95% 38.65% 49.80% 2,044 Perseverance/grit 1.57% 1.52% 11.70% 41.51% 43.71% 2,043 Time management 2.20% 4.21% 18.81% 39.00% 35.77% 2,041 Commitment to physical
health 2.00% 1.81% 11.24% 41.40% 43.55% 2,046
Commitment to academic excellence
4.26% 8.32% 23.49% 34.61% 29.32% 2,043
Developing a supportive peer network 1.81% 3.87% 19.38% 42.83% 32.11% 2,043
Work ethic 2.10% 2.64% 14.47% 41.17% 39.61% 2,045 Creativity 3.72% 7.20% 24.55% 34.44% 30.08% 2,041 Individuality 3.18% 6.71% 23.11% 34.82% 32.17% 2,042 SOURCE: Authors’ calculations conducted with parent survey data. NOTES: Respondents answered the question “Please indicate to what extent you agree that sports teach children the following skills.” Percentages are taken within each category. Results are unweighted.

22
Parent Survey Table A.15. Parental Beliefs About Sports for Lower-Income Parents
Skills Taught Strongly Disagree Disagree Neutral Agree
Strongly Agree
Number of Respondents
Discipline/personal accountability
3.80% 1.27% 9.97% 46.36% 38.61% 632
Teamwork 2.06% 0.79% 5.38% 37.66% 54.11% 632
Leadership 2.22% 1.27% 15.37% 46.43% 34.71% 631 Strategic thinking 2.39% 0.64% 13.38% 45.86% 37.74% 628 Confidence 2.07% 1.43% 7.79% 43.08% 45.63% 629 Tolerance of diversity
(racial, ethnic, religious, etc.)
3.80% 3.32% 25.63% 35.92% 31.33% 632
Competitiveness 1.90% 1.27% 10.46% 40.57% 45.80% 631 Perseverance/grit 2.38% 1.43% 15.10% 44.20% 36.88% 629 Time management 2.55% 4.14% 23.41% 39.65% 30.25% 628 Commitment to physical
health 2.69% 1.90% 14.56% 44.15% 36.71% 632
Commitment to academic excellence 4.29% 9.21% 26.83% 32.22% 27.46% 630
Developing a supportive peer network
2.69% 3.01% 22.66% 42.00% 29.64% 631
Work ethic 2.85% 3.65% 19.49% 41.36% 32.65% 631 Creativity 4.61% 9.06% 23.53% 33.39% 29.41% 629 Individuality 5.07% 7.45% 23.14% 32.49% 31.85% 631 SOURCE: Authors’ calculations conducted with parent survey data. NOTES: Respondents answered the question “Please indicate to what extent you agree that sports teach children the following skills.” Percentages are taken within each category. Lower income is defined as household income less than $50,000. Results are unweighted.

23
Parent Survey Table A.16. Parental Beliefs About Sports, for Middle School Parents
Skills Taught Strongly Disagree Disagree Neutral Agree
Strongly Agree
Number of Respondents
Discipline/personal accountability
3.17% 0.98% 7.99% 44.53% 43.33% 914
Teamwork 1.53% 1.53% 5.03% 34.10% 57.81% 915 Leadership 1.54% 0.99% 12.72% 43.64% 41.12% 912 Strategic thinking 1.31% 0.99% 12.27% 44.47% 40.96% 913 Confidence 1.43% 1.21% 7.68% 37.87% 51.81% 911 Tolerance of diversity
(racial, ethnic, religious, etc.)
2.73% 3.06% 19.78% 39.02% 35.41% 915
Competitiveness 1.31% 1.42% 8.21% 41.58% 47.48% 914 Perseverance/grit 1.54% 1.76% 10.76% 42.48% 43.47% 911 Time management 2.08% 4.71% 17.11% 39.80% 36.29% 912 Commitment to
physical health 2.08% 1.64% 11.15% 41.20% 43.93% 915
Commitment to academic excellence
4.27% 7.67% 22.56% 35.05% 30.45% 913
Developing a supportive peer network
2.08% 3.29% 17.52% 43.81% 33.30% 913
Work ethic 2.19% 3.28% 13.57% 42.23% 38.73% 914 Creativity 4.06% 6.80% 23.68% 33.77% 31.69% 912 Individuality 3.41% 5.93% 22.75% 34.07% 33.85% 910 SOURCE: Authors’ calculations conducted with parent survey data. NOTES: Respondents answered the question “Please indicate to what extent you agree that sports teach children the following skills.” Percentages are taken within each category. Results are unweighted.

24
Parent Survey Table A.17. Parental Beliefs About Sports, for High School Parents
Skills Taught Strongly Disagree Disagree Neutral Agree
Strongly Agree
Number of Respondents
Discipline/personal accountability
2.12% 1.41% 8.03% 44.04% 44.40% 1,133
Teamwork 1.50% 0.62% 4.77% 34.04% 59.06% 1,131 Leadership 1.50% 1.50% 14.25% 42.04% 40.71% 1,130 Strategic thinking 1.60% 1.95% 12.94% 45.12% 38.39% 1,128 Confidence 1.77% 0.89% 7.97% 41.54% 47.83% 1,129 Tolerance of diversity
(racial, ethnic, religious, etc.)
2.92% 4.24% 22.10% 37.14% 33.60% 1,131
Competitiveness 1.42% 1.06% 9.56% 36.28% 51.68% 1,130 Perseverance/grit 1.59% 1.33% 12.46% 40.72% 43.90% 1,132 Time management 2.30% 3.81% 20.19% 38.35% 35.34% 1,129 Commitment to physical
health 1.95% 1.95% 11.32% 41.56% 43.24% 1,131
Commitment to academic excellence
4.25% 8.85% 24.25% 34.25% 28.41% 1,130
Developing a supportive peer network
1.59% 4.34% 20.88% 42.04% 31.15% 1,130
Work ethic 2.03% 2.12% 15.21% 40.32% 40.32% 1,131 Creativity 3.45% 7.53% 25.24% 34.99% 28.79% 1,129 Individuality 3.00% 7.33% 23.41% 35.42% 30.83% 1,132 SOURCE: Authors’ calculations conducted with parent survey data. NOTES: Respondents answered the question “Please indicate to what extent you agree that sports teach children the following skills.” Percentages are taken within each category. Results are unweighted.

25
Parent Survey Table A.18. Parental Thoughts About Sports, for All Parents
Strongly Disagree Disagree Neutral Agree
Strongly Agree
Number of Respondents
Sports are important in our family
5.43% 9.97% 23.46% 34.90% 26.25% 2,046
All children should have access to youth sports if they have a desire to play
0.68% 1.32% 7.29% 38.70% 52.01% 2,044
Youth sports are important for children’s social development
1.17% 4.16% 17.07% 40.46% 37.13% 2,044
Youth sports are important for children’s academic skills
4.46% 11.37% 28.58% 31.37% 24.22% 2,040
I encourage my kids to play sports because they can lead to college scholarships
9.78% 16.32% 24.93% 25.37% 23.61% 2,046
Youth sports can provide a pathway to success for low-income or at-risk kids
2.16% 3.77% 18.86% 44.49% 30.72% 2,041
Youth sports have become too competitive
5.87% 10.08% 25.39% 30.77% 27.89% 2,044
Youth sports are too expensive
4.95% 7.00% 23.60% 37.17% 27.28% 2,042
Youth sports are too dangerous
8.57% 20.52% 36.78% 20.86% 13.27% 2,042
Youth sports take too much time 7.62% 18.44% 31.76% 27.43% 14.75% 2,034
Youth sports are becoming too specialized at an early age
6.21% 11.84% 29.26% 28.57% 24.12% 2,044
Youth school sports improve school climate
3.42% 6.80% 31.75% 38.11% 19.91% 2,044
Youth sports are fun 1.42% 1.81% 14.80% 45.00% 36.96% 2,040 Coaching can make or
break a child’s enjoyment of a sport
1.32% 2.25% 14.67% 35.94% 45.82% 2,045
SOURCE: Authors’ calculations conducted with parent survey data. NOTES: Respondents answered the question “Please indicate to what extent you agree with each of the following statements.” Percentages are taken within each category. Results are unweighted.

26
School Administrator Tables
School Administrator Survey Table B.1. School Administrator Survey Demographic and Background Information
School/School Administrator Characteristic
Percentage (unweighted)
Percentage (weighted)
N (unweighted)
Role in school
Principal 33.62% 32.81% 276
Vice principal 26.92% 27.49% 221
Provost 8.16% 8.1% 67
Athletic director 18.88% 18.84% 155
Other 12.42% 12.77% 102
Number of respondents 821
Years in role
0–1 year 5.73% 5.67% 47
2–5 years 33.54% 34.21% 275
6–9 years 28.05% 28.22% 230
10–14 years 17.07% 16.71% 140
15–19 years 8.90% 8.79% 73
20+ years 6.71% 6.39% 55
Number of respondents 820
School level
Middle school 15.83% 15.63% 130
High school 47.14% 46.04% 387
K–8/K–12 school 37.03% 38.33% 304
Number of respondents 821
Type of school
Public 68.82% 68.46% 565
Private, not religiously affiliated 16.20% 6.11% 133
Private, religiously affiliated 10.35% 19.12% 85
Charter 4.63% 6.31% 38
Number of respondents 821
Single-gender schools (private schools only)
Boys’ school 33.49% 32.35% 73
Girls’ school 8.72% 12.54% 19
Co-ed school 57.80% 55.1% 126
Number of respondents 218

27
School/School Administrator Characteristic
Percentage (unweighted)
Percentage (weighted)
N (unweighted)
Estimated student enrollment
Less than 200 students 7.94% 7.55% 62
200–399 15.62% 16.47% 122
400–799 27.40% 27.01% 214
800–1,199 20.10% 21.13% 157
1,200–1,999 17.67% 16.67% 138
2,000 or more 11.27% 11.16% 88
Number of respondents 781
SOURCE: Authors’ calculations conducted with school administrator survey data. NOTES: Total respondents N = 821; percentages are taken as the percentage of responses for each individual question. Results in percentage column are not weighted.

28
School Administrator Survey Table B.2. School Demographics
Demographic Characteristic Percentage N Students from low-income families
0–9% 7.32% 60
10–19% 9.76% 80
20–29% 19.15% 157
30–49% 20.49% 168
50–59% 15.73% 129
60–69% 9.76% 80
70–79% 8.05% 66
80–89% 3.90% 32
90% or more 5.85% 48
Number of respondents 820
Racial and ethnic student body compositiona
American Indian or Alaska Native 4.01% 818
Asian 11.49% 818
Black 24.54% 820
Hispanic or Latino 19.81% 820
Pacific Islander 3.11% 819
Two or more races 5.25% 819
White 53.61% 821
Majority-minority schools [schools where white student population is less than 50 percent]
52.98% 435
Geographic distribution
Majority rural 18.03% 148
Majority urban 37.88% 311
Majority suburban 35.69% 293
Rural/suburban split 2.92% 24
Suburban/urban split 4.38% 36
Rural/urban split 1.10 9
Number of respondents 821
SOURCE: Authors’ calculations conducted with school administrator survey data. NOTES: Total respondents N = 821; percentages are taken as the percentage of responses for each individual question. a Respondents answered the question “What is the racial and ethnic composition of the student body at your school?” Therefore, percentages presented are the average percentage of the student body, not the percentage of respondents. Results are not weighted.

29
School Administrator Survey Table B.3. Fitness Standards and Competitive Sports
Percentage N School has physical education requirement
Yes 92.54% 757
No 7.46% 61
Number of respondents 818
Physical education requirement changed over the past five years
Increased 43.52% 329
Decreased 12.04% 91
Stayed the same 44.44% 336
Number of respondents 756
School offers competitive sports teams
Yes 90.86% 746
No 9.14% 75
Number of respondents 821
Reasons why no sports team offered
Other schools offering competitive sports teams are too far away 10.67% 8
School is a specialty school 37.33% 28
Sports are offered through a collaborative hosted at another school 32.00% 24
Competitive sports teams were eliminated due to budgetary concerns 17.33% 13
Other 18.67% 14
Number of respondents 75
SOURCE: Authors’ calculations conducted with school administrator survey data. NOTES: Total respondents N = 821; percentages are taken as the percentage of responses for each individual question. “Reasons why no sports team offered” percentages are taken from the number of respondents (N= 75); respondents could select multiple options. Results are not weighted.

30
School Administrator Survey Table B.4. School Year 2017–2018 Budget
All Schools Public Schools Private Schools
Percentage N Percentage N Percentage N
Estimated per-pupil expenditures
Under $6,000 15.71% 123 16.55% 97 13.20% 26
$6,000 to 7,999 17.62% 138 19.62% 115 11.68% 23
$8,000 to 9,999 18.14% 142 20.14% 118 12.18% 24
$10,000 to 11,999 15.33% 120 16.04% 94 13.20% 26
$12,000 to 13,999 14.81% 116 13.48% 79 18.78% 37
$14,000 to 15,999 7.92% 62 7.17% 42 10.15% 20
$16,000 to 17,999 4.34% 34 2.90% 17 8.63% 17
$18,000 or more 6.13% 48 4.10% 24 12.18% 24
Number of respondents 783 586 197
Extracurricular activity generates funding: Sports
Generates funding to pay for itself and support other school activities
34.90% 260 30.09% 167 48.95% 93
Generates funding to pay for itself 20.54% 153 20.90% 116 19.47% 37
Generates funding to partially pay for its activities
32.75% 244 36.22% 201 22.63% 43
Does not generate funding 11.81% 88 12.79% 71 8.95% 17
Number of respondents 745 555 190
Amount generated: Sports
Less than $1,000 7.31% 48 7.44% 36 6.94% 12
$1,000–5,000 37.44% 246 35.33% 171 43.35% 75

31
All Schools Public Schools Private Schools
Percentage N Percentage N Percentage N
$5,000–10,000 32.88% 216 33.88% 164 30.06% 52
More than $10,000 22.37% 147 23.35% 113 19.65% 34
Number of respondents 657 484 173
Extracurricular activity generates funding: Arts programs
Generates funding to pay for itself and support other school activities
33.05% 271 27.91% 168 47.25% 103
Generates funding to pay for itself 17.68% 145 18.11% 109 16.51% 36
Generates funding to partially pay for its activities
26.71% 219 29.40% 177 19.27% 42
Does not generate funding 22.56% 185 24.58% 148 16.97% 37
Number of respondents 820 602 218
Amount generated: Arts
Less than $1,000 6.61% 42 6.17% 28 7.73% 14
$1,000–5,000 49.45% 314 50.88% 231 45.86% 83
$5,000–10,000 33.23% 211 31.94% 145 36.46% 66
More than $10,000 10.71% 68 11.01% 50 9.94% 18
Number of respondents 635 454 181
Extracurricular activity generates funding: Academic programs
Generates funding to pay for itself and support other school activities
30.68% 251 24.63% 148 47.47% 103
Generates funding to pay for itself 18.83% 154 19.13% 115 17.97% 39

32
All Schools Public Schools Private Schools
Percentage N Percentage N Percentage N
Generates funding to partially pay for its activities
17.73% 145 20.13% 121 11.06% 24
Does not generate funding 32.76% 268 36.11% 217 23.50% 51
Number of respondents 818 601 217
Amount generated: Academic
Less than $1,000 8.36% 46 8.85% 34 7.23% 12
$1,000–5,000 49.09% 270 50.00% 192 46.99% 78
$5,000–10,000 30.73% 169 30.99% 119 30.12% 50
More than $10,000 11.82% 65 10.16% 39 15.66% 26
Number of respondents 550 384 166
SOURCE: Authors’ calculations conducted with school administrator survey data. NOTES: Responses are given by activity type (sports, arts, academics), and percentages for each question are taken out of the total responses for each question. If respondents answered that the extracurricular activity did not generate funding, they were not asked how much money it generated in a given year. Results are not weighted.
33
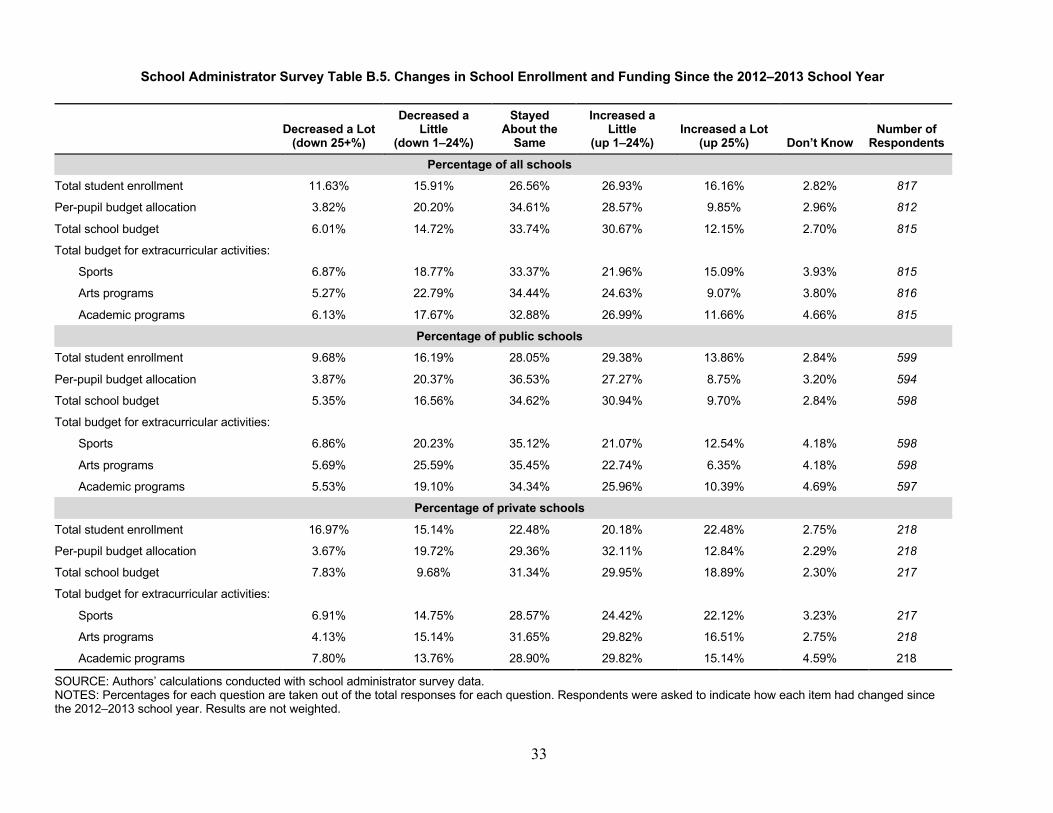
School Administrator Survey Table B.5. Changes in School Enrollment and Funding Since the 2012–2013 School Year
Decreased a Lot
(down 25+%)
Decreased a Little
(down 1–24%)
Stayed About the
Same
Increased a Little
(up 1–24%) Increased a Lot
(up 25%) Don’t Know Number of
Respondents Percentage of all schools
Total student enrollment 11.63% 15.91% 26.56% 26.93% 16.16% 2.82% 817
Per-pupil budget allocation 3.82% 20.20% 34.61% 28.57% 9.85% 2.96% 812
Total school budget 6.01% 14.72% 33.74% 30.67% 12.15% 2.70% 815
Total budget for extracurricular activities:
Sports 6.87% 18.77% 33.37% 21.96% 15.09% 3.93% 815
Arts programs 5.27% 22.79% 34.44% 24.63% 9.07% 3.80% 816
Academic programs 6.13% 17.67% 32.88% 26.99% 11.66% 4.66% 815
Percentage of public schools
Total student enrollment 9.68% 16.19% 28.05% 29.38% 13.86% 2.84% 599
Per-pupil budget allocation 3.87% 20.37% 36.53% 27.27% 8.75% 3.20% 594
Total school budget 5.35% 16.56% 34.62% 30.94% 9.70% 2.84% 598
Total budget for extracurricular activities:
Sports 6.86% 20.23% 35.12% 21.07% 12.54% 4.18% 598
Arts programs 5.69% 25.59% 35.45% 22.74% 6.35% 4.18% 598
Academic programs 5.53% 19.10% 34.34% 25.96% 10.39% 4.69% 597
Percentage of private schools
Total student enrollment 16.97% 15.14% 22.48% 20.18% 22.48% 2.75% 218
Per-pupil budget allocation 3.67% 19.72% 29.36% 32.11% 12.84% 2.29% 218
Total school budget 7.83% 9.68% 31.34% 29.95% 18.89% 2.30% 217
Total budget for extracurricular activities:
Sports 6.91% 14.75% 28.57% 24.42% 22.12% 3.23% 217
Arts programs 4.13% 15.14% 31.65% 29.82% 16.51% 2.75% 218
Academic programs 7.80% 13.76% 28.90% 29.82% 15.14% 4.59% 218
SOURCE: Authors’ calculations conducted with school administrator survey data. NOTES: Percentages for each question are taken out of the total responses for each question. Respondents were asked to indicate how each item had changed since the 2012–2013 school year. Results are not weighted.
34
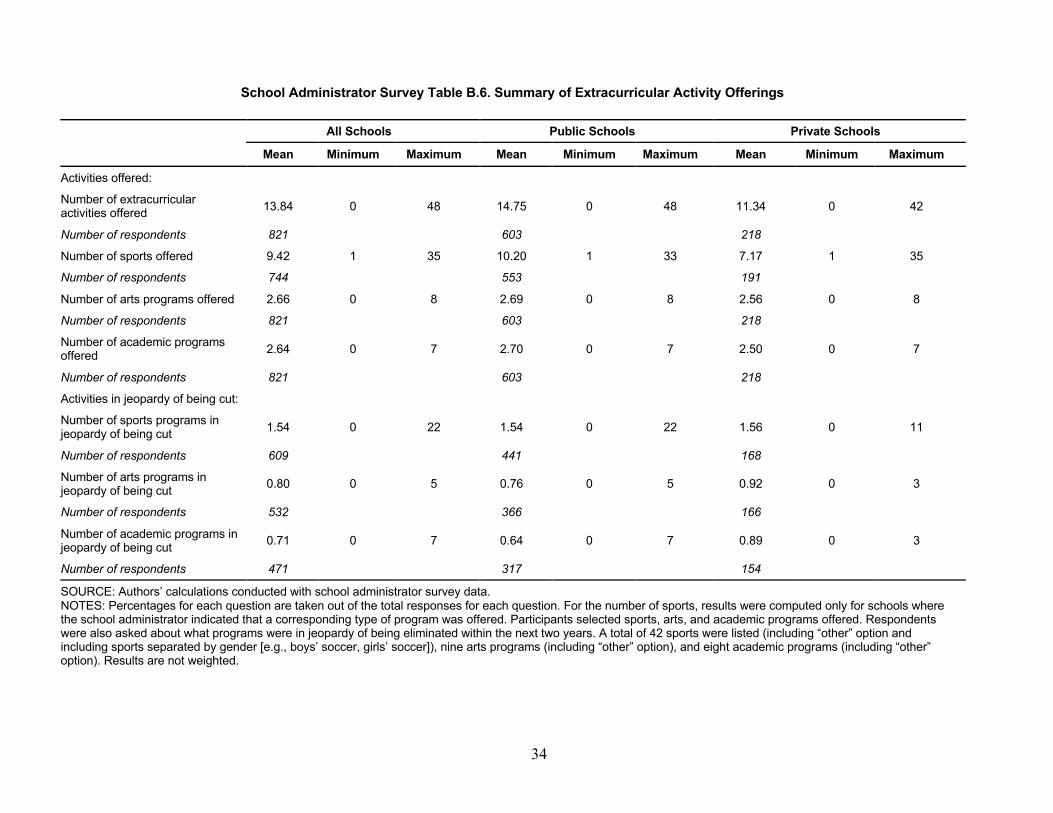
School Administrator Survey Table B.6. Summary of Extracurricular Activity Offerings
All Schools Public Schools Private Schools
Mean Minimum Maximum Mean Minimum Maximum Mean Minimum Maximum
Activities offered:
Number of extracurricular activities offered 13.84 0 48 14.75 0 48 11.34 0 42
Number of respondents 821 603 218
Number of sports offered 9.42 1 35 10.20 1 33 7.17 1 35
Number of respondents 744 553 191
Number of arts programs offered 2.66 0 8 2.69 0 8 2.56 0 8
Number of respondents 821 603 218
Number of academic programs offered 2.64 0 7 2.70 0 7 2.50 0 7
Number of respondents 821 603 218
Activities in jeopardy of being cut:
Number of sports programs in jeopardy of being cut 1.54 0 22 1.54 0 22 1.56 0 11
Number of respondents 609 441 168
Number of arts programs in jeopardy of being cut 0.80 0 5 0.76 0 5 0.92 0 3
Number of respondents 532 366 166
Number of academic programs in jeopardy of being cut 0.71 0 7 0.64 0 7 0.89 0 3
Number of respondents 471 317 154
SOURCE: Authors’ calculations conducted with school administrator survey data. NOTES: Percentages for each question are taken out of the total responses for each question. For the number of sports, results were computed only for schools where the school administrator indicated that a corresponding type of program was offered. Participants selected sports, arts, and academic programs offered. Respondents were also asked about what programs were in jeopardy of being eliminated within the next two years. A total of 42 sports were listed (including “other” option and including sports separated by gender [e.g., boys’ soccer, girls’ soccer]), nine arts programs (including “other” option), and eight academic programs (including “other” option). Results are not weighted.

35
School Administrator Survey Table B.7. Extracurricular Activity Participation for Boys
All Schools Public Schools Private Schools
Percentage N Percentage N Percentage N
Sports participation rate
<25% 16.92% 123 20.65% 114 5.14% 9
26–50% 50.34% 366 51.81% 286 45.71% 80
51–75% 26.27% 191 23.37% 129 35.43% 62
>75% 6.46% 47 4.17% 23 13.71% 24
Number of respondents 727 552 175
In the past five years, sports participation has:
Grown 43.80% 318 39.02% 215 58.86% 103
Declined 20.25% 147 22.32% 123 13.71% 24
Stayed the same 35.95% 261 38.66% 213 27.43% 48
Number of respondents 726 551 175
Arts programs participation rate
<25% 42.14% 303 48.13% 257 24.86% 46
26–50% 37.55% 270 36.52% 195 40.54% 75
51–75% 15.02% 108 11.42% 61 25.41% 47
>75% 5.29% 38 3.93% 21 9.19% 17
Number of respondents 719 534 185
In the past five years, arts programs participation has:
Grown 36.75% 265 32.46% 174 49.19% 91
Declined 26.49% 191 28.36% 152 21.08% 39
Stayed the same 36.75% 265 39.18% 210 29.73% 55
Number of respondents 721 536 185
Academic programs participation rate
<25% 35.71% 255 40.60% 216 21.43% 39
26–50% 40.06% 286 39.10% 208 42.86% 78

36
All Schools Public Schools Private Schools
Percentage N Percentage N Percentage N
51–75% 18.49% 132 15.41% 82 27.47% 50
>75% 5.74% 41 4.89% 26 8.24% 15
Number of respondents 714 532 182
In the past five years, academic programs participation has:
Grown 39.13% 279 34.27% 182 53.30% 97
Declined 18.79% 134 20.53% 109 13.74% 25
Stayed the same 42.08% 300 45.20% 240 32.97% 60
Number of respondents 713 531 182
SOURCE: Authors’ calculations conducted with school administrator survey data. NOTES: Respondents were asked “What percentage of your male students participated in school’s extracurricular [ACTIVITY]?” and “How has male participation changed since the 2012–2013 school year?” Responses are given by activity type (sports, arts, academics), and percentages for each question are taken out of the total responses for each question. Results are not weighted.

37
School Administrator Survey Table B.8. Extracurricular Activity Participation for Girls
All Schools Public Schools Private Schools
Percentage N Percentage N Percentage N
Sports participation rate
<25% 24.55% 165 27.54% 152 10.83% 13
26–50% 49.70% 334 50.72% 280 45.00% 54
51–75% 20.09% 135 17.93% 99 30.00% 36
>75% 5.65% 38 3.80% 21 14.17% 17
Number of respondents 672 552 120
In the past five years, sports participation has:
Grown 41.28% 277 40.83% 225 43.33% 52
Declined 22.06% 148 22.87% 126 18.33% 22
Stayed the same 36.66% 246 36.30% 200 38.33% 46
Number of respondents 671 551 120
Arts programs participation rate
<25% 32.19% 215 34.58% 185 22.56% 30
26–50% 43.86% 293 43.55% 233 45.11% 60
51–75% 18.26% 122 16.64% 89 24.81% 33
>75% 5.69% 38 5.23% 28 7.52% 10
Number of respondents 668 535 133
In the past five years, arts programs participation has:
Grown 39.01% 261 39.93% 214 35.34% 47
Declined 22.27% 149 22.01% 118 23.31% 31
Stayed the same 38.71% 259 38.06% 204 41.35% 55
Number of respondents 669 536 133
Academic programs participation rate
<25% 32.48% 215 34.52% 184 24.03% 31

38
All Schools Public Schools Private Schools
Percentage N Percentage N Percentage N
26–50% 43.05% 285 43.15% 230 42.64% 55
51–75% 17.37% 115 16.14% 86 22.48% 29
>75% 7.10% 47 6.19% 33 10.85% 14
Number of respondents 662 533 129
In the past five years, academic programs participation has:
Grown 39.09% 258 37.78% 201 44.53% 57
Declined 18.03% 119 18.80% 100 14.84% 19
Stayed the same 42.88% 283 43.42% 231 40.63% 52
Number of respondents 660 532 128
SOURCE: Authors’ calculations conducted with school administrator survey data. NOTES: Respondents were asked “What percentage of your female students participated in school’s extracurricular [ACTIVITY]?” and “How has female participation changed since the 2012–2013 school year?” Responses are given by activity type (sports, arts, academics), and percentages for each question are taken out of the total responses for each question. Results are not weighted.

39
School Administrator Survey Table B.9. General Sports Funding Information
All Schools Public Schools Private Schools
Percentage Sports N Percentage Sports N Percentage Sports N
Sports fully funded in school budget 65.50% 2,447 62.68% 1,789 74.60% 658
Sports not fully funded in school budget 34.50% 1,289 37.32% 1,065 25.40% 224
Number of respondents 744 553 191
Supplemental funding for sports
Private donation or sponsorship 17.40% 466 15.90% 365 26.44% 101
Nonprofit donation 11.39% 305 11.80% 271 8.90% 34
Student fundraising 31.07% 832 31.97% 734 25.65% 98
Student participation fees 21.96% 588 21.43% 492 25.13% 96
PTA/Booster Club contributions 18.19% 487 18.90% 434 13.87% 53
Number of respondents 398 322 76
Funding change since school year (SY) 2012-2013
More well-funded 37.43% 1,397 32.64% 931 52.95% 466
Less well-funded 24.73% 923 26.75% 763 18.18% 160
No change 37.83% 1,412 40.60% 1,158 28.86% 254
Number of respondents 743 552 191
Sport requires participation fees 53.82% 2,008 49.32% 1,406 68.41% 602
Sport does not require participation fees 46.18% 1,723 50.68% 1,445 31.59% 278
Number of respondents 743 552 191
Participation fees
Under $50 22.18% 445 24.36% 342 17.11% 103
$50–100 33.65% 675 37.04% 520 25.75% 155

40
All Schools Public Schools Private Schools
Percentage Sports N Percentage Sports N Percentage Sports N
$101–150 25.12% 504 21.72% 305 33.06% 199
$151–200 10.47% 210 9.05% 127 13.79% 83
Over $200 8.57% 172 7.83% 110 10.30% 62
Number of respondents 536 378 158
Participation fees change since SY 2012–2013
Increased 58.15% 1,166 55.52% 779 64.29% 387
Decreased 11.52% 231 10.98% 154 12.79% 77
Stayed the same 30.32% 608 33.50% 470 22.92% 138
Number of respondents 536 378 158
Area most in need
Facilities 20.76% 771 20.82% 591 20.60% 180
Uniforms 24.19% 898 22.40% 636 29.98% 262
Gear/equipment 25.15% 934 26.42% 750 21.05% 184
Staff/coaching support 17.02% 632 17.75% 504 14.65% 128
Transportation 10.26% 381 10.32% 293 10.07% 88
Other 2.61% 97 2.29% 65 3.66% 32
Number of respondents 742 551 191
SOURCE: Authors’ calculations conducted with school administrator survey data. NOTES: Respondents were asked whether [GENDER SPORT] team was fully funded within the school’s main budget—meaning that no additional funds were needed to provide the program. If respondents answered no, then they were asked “What does the supplemental funding include?” (respondents could select multiple options). Respondents were also asked how funding has changed for [GENDER SPORT] since the 2012–2013 school year, whether [GENDER SPORT] requires student participation fees, and, if yes, how much the participation fees were and how student participation fees for [GENDER SPORT] have changed since 2012–2013. Respondents were also asked “What area is most in need for [GENDER SPORT] currently?” Percentages for fully funded budget are taken from the total number of sports that school administrators answered questions about in the survey (maximum of six sports per school administrator). Percentages for all other questions are taken from total responses, by subgroup. Results are not weighted.

41
School Administrator Survey Table B.10. General Sports Information
All Schools Public Schools Private Schools
Percentage N Percentage N Percentage N
School has GPA requirement for sports participation 78.57% 583 77.86% 429 80.63% 154
School has no GPA requirement for sports participation 21.43% 159 22.14% 122 19.37% 37
Number of respondents 742 551 191
Primary challenges when providing sports programming
Equipment/uniform/gear costs 22.98% 417 23.13% 319 22.48% 98
Facilities costs/availability 19.28% 350 18.78% 259 20.87% 91
Staffing costs/availability 20.44% 371 20.01% 276 21.79% 95
Transportation costs/availability 14.99% 272 15.08% 208 14.68% 64
Interest 10.36% 188 10.30% 142 10.55% 46
Family support 7.71% 140 8.27% 114 5.96% 26
Competition from school-based or club/travel sports 3.80% 69 3.92% 54 3.44% 15
Other 0.44% 8 0.51% 7 0.23% 1
Number of respondents 737 548 189
How competitive sports offerings will change in the next five years
Offer more competitive sports teams 32.32% 265 26.74% 161 47.71% 104
Offer the same number of competitive sports teams 50.00% 410 54.32% 327 38.07% 83
Offer fewer competitive sports teams 13.41% 110 14.78% 89 9.63% 21
Not offer any competitive sports teams 4.27% 35 4.15% 25 4.59% 10
Number of respondents 820 602 218
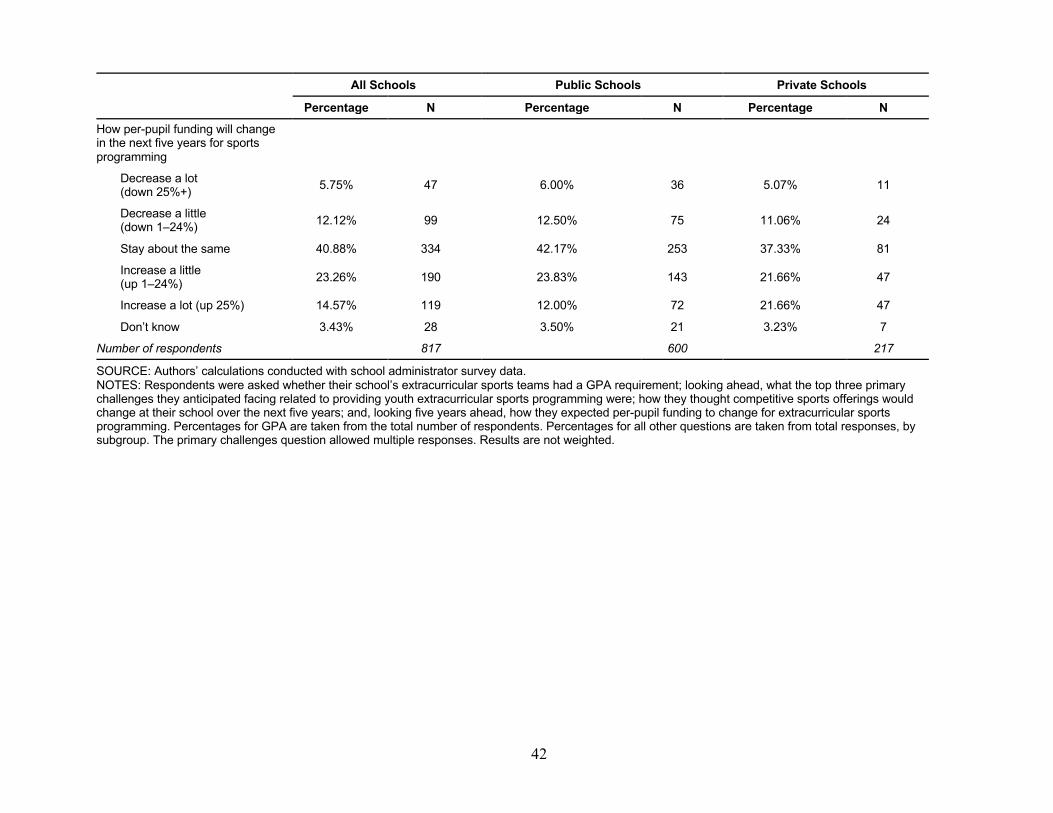
42
All Schools Public Schools Private Schools
Percentage N Percentage N Percentage N
How per-pupil funding will change in the next five years for sports programming
Decrease a lot (down 25%+) 5.75% 47 6.00% 36 5.07% 11
Decrease a little (down 1–24%) 12.12% 99 12.50% 75 11.06% 24
Stay about the same 40.88% 334 42.17% 253 37.33% 81
Increase a little (up 1–24%) 23.26% 190 23.83% 143 21.66% 47
Increase a lot (up 25%) 14.57% 119 12.00% 72 21.66% 47
Don’t know 3.43% 28 3.50% 21 3.23% 7
Number of respondents 817 600 217
SOURCE: Authors’ calculations conducted with school administrator survey data. NOTES: Respondents were asked whether their school’s extracurricular sports teams had a GPA requirement; looking ahead, what the top three primary challenges they anticipated facing related to providing youth extracurricular sports programming were; how they thought competitive sports offerings would change at their school over the next five years; and, looking five years ahead, how they expected per-pupil funding to change for extracurricular sports programming. Percentages for GPA are taken from the total number of respondents. Percentages for all other questions are taken from total responses, by subgroup. The primary challenges question allowed multiple responses. Results are not weighted.

43
School Administrator Survey Table B.11. Extracurricular Arts and Academic Programs Funding Information
All Schools Public Schools Private Schools
Percentage N Percentage N Percentage N
Arts programs fully funded in school budget 62.52% 462 58.50% 313 73.04% 149
Arts programs not fully funded in school budget 37.48% 277 41.50% 222 26.96% 55
Number of respondents 739 535 204
Arts programs funding change since SY 2012–2013
More well-funded 39.32% 291 33.96% 182 53.43% 109
Less well-funded 32.16% 238 36.01% 193 22.06% 45
No change 28.51% 211 30.04% 161 24.51% 50
Number of respondents 740 536 204
Arts programs require participation fees 53.86% 398 49.07% 263 66.50% 135
Arts programs do not require participation fees 46.14% 341 50.93% 273 33.50% 68
Number of respondents 739 536 203
Arts program participation fees
Under $50 12.76% 50 14.67% 38 9.02% 12
$50–100 31.38% 123 32.82% 85 28.57% 38
$101–150 31.38% 123 27.80% 72 38.35% 51
$150–200 14.03% 55 13.51% 35 15.04% 20
Over $200 10.46% 41 11.20% 29 9.02% 12
Number of respondents 392 259 133
Arts program participation fees change since SY 2012–2013
Increased 62.56% 244 57.59% 148 72.18% 96
Decreased 14.10% 55 14.79% 38 12.78% 17
Stayed the same 23.33% 91 27.63% 71 15.04% 20
Number of respondents 390 257 133
Academic programs fully funded in school budget 66.26% 483 64.27% 340 71.50% 143
Academic programs not fully funded in school budget
33.74% 246 35.73% 189 28.50% 57

44
All Schools Public Schools Private Schools
Percentage N Percentage N Percentage N
Number of respondents 729 529 200
Academic programs funding change since SY 2012–2013
More well-funded 40.71% 298 36.77% 196 51.26% 102
Less well-funded 24.04% 176 24.58% 131 22.61% 45
No change 35.25% 258 38.65% 206 26.13% 52
Number of respondents 732 533 199
Academic programs require participation fees 45.01% 329 39.85% 212 58.79% 117
Academic programs do not require participation fees
54.99% 402 60.15% 320 41.21% 82
Number of respondents 731 532 199
Academic program participation fees
Under $50 20.67% 68 25.00% 53 12.82% 15
$50–100 27.66% 91 29.72% 63 23.93% 28
$101–150 31.31% 103 27.36% 58 38.46% 45
$101–150 12.46% 41 10.85% 23 15.38% 18
Over $200 7.90% 26 7.08% 15 9.40% 11
Number of respondents 329 212 117
Academic program participation fees change since SY 2012–2013
Increased 67.07% 220 62.09% 131 76.07% 89
Decreased 11.89% 39 11.37% 24 12.82% 15
Stayed the same 21.04% 69 26.54% 56 11.11% 13
Number of respondents 328 211 117
SOURCE: Authors’ calculations conducted with school administrator survey data. NOTES: Respondents were asked whether an extracurricular activity was fully funded within the school’s main budget—meaning that no additional funds were needed to provide the program. If respondents answered no, then they were asked what the supplemental funding included (respondents could select multiple options). Respondents were also asked how funding has changed for the activity since the 2012–2013 school year, whether the activity requires student participation fees, and, if yes, how much the participation fees were and how student participation fees for the activity have changed since 2012–2013. Percentages for fully funded budget are taken from the total number of respondents by subgroup. Percentages broken down by fees are taken from the total number who indicated that the program had fees: arts for all (N = 398); arts for public (N = 263); arts for private (N = 135); academic for all (N = 329); academic for public (N = 212); and academic for private (N = 117). Results are not weighted.

45
School Administrator Survey Table B.12. Sports Offered in Schools
All Schools Public Schools Private Schools
Percentage Sports N Percentage Sports N Percentage Sports N
Boys’ badminton 9.27% 69 7.41% 41 14.66% 28
Girls’ badminton 5.78% 43 5.97% 33 5.24% 10
Baseball 50.81% 378 55.52% 307 37.17% 71
Boys’ basketball 58.33% 434 65.82% 364 36.65% 70
Girls’ basketball 53.90% 401 61.48% 340 31.94% 61
Cheerleading/drill team 43.41% 323 52.08% 288 18.32% 35
Cross-country 38.58% 287 41.05% 227 31.41% 60
Dance team 24.06% 179 27.67% 153 13.61% 26
Fencing 6.18% 46 5.24% 29 8.90% 17
Boys’ field hockey 8.47% 63 7.59% 42 10.99% 21
Girls’ field hockey 11.56% 86 12.48% 69 8.90% 17
Football 52.82% 393 59.49% 329 33.51% 64
Boys’ golf 28.76% 214 30.20% 167 24.61% 47
Girls’ golf 23.52% 175 25.68% 142 17.28% 33
Boys’ gymnastics 9.41% 70 9.40% 52 9.42% 18
Girls’ gymnastics 12.63% 94 13.56% 75 9.95% 19
Boys’ ice hockey 9.68% 72 8.86% 49 12.04% 23
Girls’ ice hockey 5.24% 39 4.52% 25 7.33% 14
Boys’ lacrosse 15.86% 118 14.47% 80 19.90% 38
Girls’ lacrosse 14.38% 107 13.56% 75 16.75% 32
Boys’ rowing 7.66% 57 5.79% 32 13.09% 25
Girls’ rowing 4.84% 36 4.52% 25 5.76% 11
Boys’ rugby 7.80% 58 5.97% 33 13.09% 25
Girls’ rugby 3.90% 29 4.34% 24 2.62% 5
Boys’ skiing/snowboarding 4.97% 37 4.16% 23 7.33% 14
Girls’ skiing/snowboarding 5.65% 42 5.97% 33 4.71% 9

46
All Schools Public Schools Private Schools
Percentage Sports N Percentage Sports N Percentage Sports N Boys’ soccer 50.13% 373 53.16% 294 41.36% 79
Girls’ soccer 42.74% 318 47.74% 264 28.27% 54
Softball 42.61% 317 49.37% 273 23.04% 44
Boys’ swimming and diving 25.67% 191 27.12% 150 21.47% 41
Girls’ swimming and diving 24.73% 184 27.85% 154 15.71% 30
Boys’ tennis 30.91% 230 33.45% 185 23.56% 45
Girls’ tennis 30.51% 227 33.63% 186 21.47% 41
Track and field 48.66% 362 54.61% 302 31.41% 60
Boys’ ultimate frisbee 5.38% 40 4.34% 24 8.38% 16
Girls’ ultimate frisbee 3.49% 26 3.44% 19 3.66% 7
Boys’ volleyball 22.04% 164 22.42% 124 20.94% 40
Girls’ volleyball 44.49% 331 50.81% 281 26.18% 50
Boys’ water polo 9.81% 73 8.32% 46 14.14% 27
Girls’ water polo 6.85% 51 7.23% 40 5.76% 11
Wrestling 35.22% 262 42.50% 235 14.14% 27
None 10.35% 77 9.04% 50 14.14% 27
Other (please only list one activity): 1.61% 12 1.27% 7 2.62% 5
Number of respondents 744 553 191
SOURCE: Authors’ calculations conducted with school administrator survey data. NOTES: Percentages are taken from the total number of respondents in each subgroup. Sports n: overall sample = 7,088; public schools = 5,691; private schools = 1,397. Results are not weighted.

47
School Administrator Survey Table B.13. Extracurricular Arts and Academic Programs Offered in Schools
All Schools Public Schools Private Schools
Percentage N Percentage N Percentage N
Arts programs
Band 58.09% 431 61.34% 330 49.51% 101
Choir 43.13% 320 44.61% 240 39.22% 80
Creative writing 11.32% 84 13.01% 70 6.86% 14
Dance 33.29% 247 34.76% 187 29.41% 60
Media arts 29.11% 216 28.81% 155 29.90% 61
Orchestra 30.19% 224 31.97% 172 25.49% 52
Theater/musicals 44.34% 329 47.58% 256 35.78% 73
Visual arts 42.45% 315 37.55% 202 55.39% 113
Other 2.29% 17 2.42% 13 1.96% 4
None 10.65% 79 12.08% 65 6.86% 14
Number of respondents 742 538 204
Academic programs
Career 24.63% 181 29.35% 157 12.00% 24
Community service 35.78% 263 35.89% 192 35.50% 71
Government 49.39% 363 49.91% 267 48.00% 96
Honors 37.14% 273 41.12% 220 26.50% 53
Publications 52.24% 384 54.02% 289 47.50% 95
Speech/debate 34.42% 253 33.08% 177 38.00% 76
STEM [science, technology, engineering, and math] activities
59.59% 438 58.88% 315 61.50% 123
Other 2.04% 15 1.68% 9 3.00% 6
None 11.70% 86 12.71% 68 9.00% 18
Number of respondents 735 535 200
SOURCE: Authors’ calculations conducted with school administrator survey data. NOTES: Percentages for each question are taken out of the respondents in each subgroup. Arts programs n: overall sample = 2,262; public schools = 1,690; private schools = 572. Academic programs n: overall sample = 2,256; public schools = 1,694; private schools = 562. Results are not weighted.

48
School Administrator Survey Table B.14. Barriers to Extracurricular Participation, Overall
Strongly Disagree Disagree Neutral Agree Strongly Agree Don’t Know Total N
Sports
Family financial limitations 6.34% 10.26% 18.08% 27.67% 35.49% 2.16% 741
Family time commitment 2.70% 8.89% 16.17% 45.28% 24.26% 2.70% 742
Transportation challenges 2.96% 9.42% 22.34% 31.22% 32.17% 1.88% 743
Limited roster spots on teams 4.99% 14.02% 21.29% 35.44% 21.70% 2.56% 742
Safety concerns 6.81% 16.62% 24.93% 23.71% 24.39% 3.54% 734
Academic ineligibility 4.99% 14.84% 21.32% 31.85% 24.02% 2.97% 741
Insufficient choice of sports for youth 9.89% 18.16% 23.58% 22.49% 21.95% 3.93% 738
Arts programs
Family financial limitations 7.33% 11.26% 16.69% 27.82% 34.74% 2.17% 737
Family time commitment 2.72% 10.05% 16.71% 41.03% 27.31% 2.17% 736
Transportation challenges 3.81% 11.43% 22.59% 32.24% 27.35% 2.59% 735
Limited spots in activity 7.49% 18.66% 19.75% 32.15% 18.94% 3.00% 734
Academic ineligibility 15.96% 20.46% 17.87% 18.55% 24.56% 2.59% 733
Insufficient choice of programs for youth 10.91% 20.33% 20.05% 23.33% 21.96% 3.41% 733
Academic programs
Family financial limitations 8.76% 14.23% 18.06% 25.85% 31.19% 1.92% 731
Family time commitment 2.88% 12.05% 17.67% 40.14% 25.07% 2.19% 730
Transportation challenges 3.97% 10.81% 24.08% 30.64% 28.04% 2.46% 731
Limited spots in activity 9.30% 17.24% 19.84% 29.27% 21.89% 2.46% 731
Academic ineligibility 17.03% 18.13% 18.68% 18.68% 25.55% 1.92% 728
Insufficient choice of programs for youth 11.80% 16.19% 19.07% 27.71% 21.54% 3.70% 729
SOURCE: Authors’ calculations conducted with school administrator survey data. NOTES: Respondents were asked to indicate the extent to which they agreed that the following barriers limiting participation in their school’s extracurricular program. Percentages are taken out of the total N for each individual question. Results are not weighted.
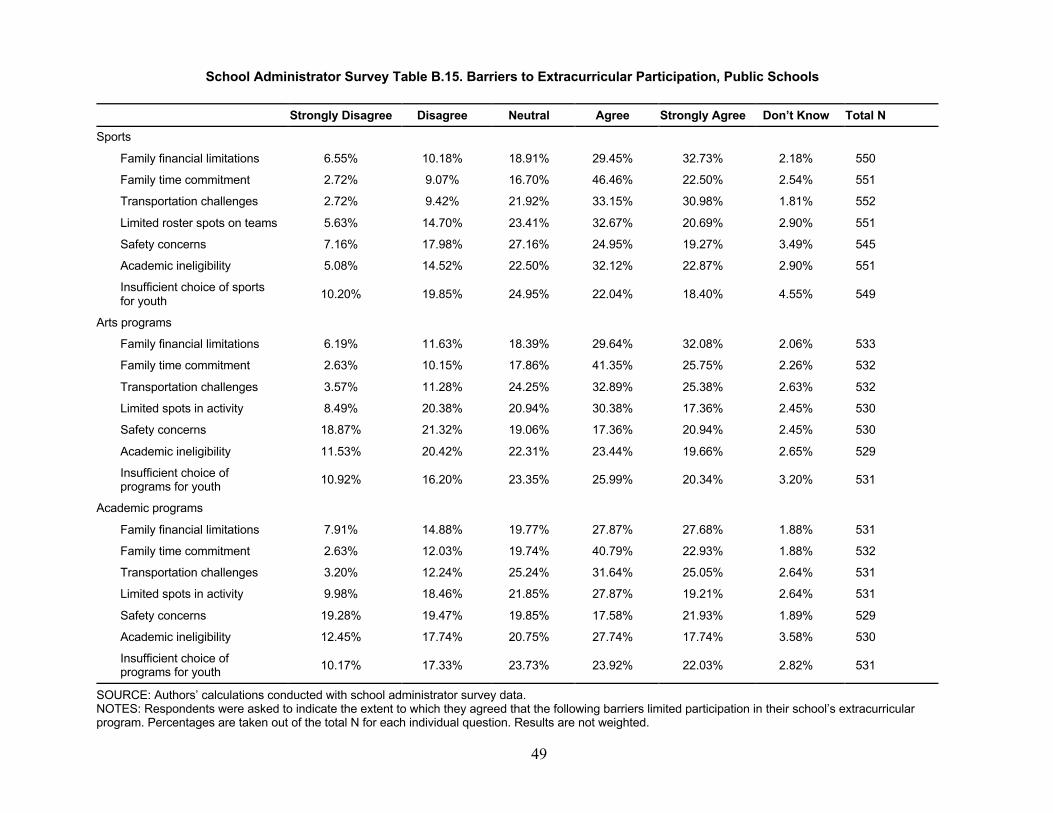
49
School Administrator Survey Table B.15. Barriers to Extracurricular Participation, Public Schools
Strongly Disagree Disagree Neutral Agree Strongly Agree Don’t Know Total N Sports
Family financial limitations 6.55% 10.18% 18.91% 29.45% 32.73% 2.18% 550
Family time commitment 2.72% 9.07% 16.70% 46.46% 22.50% 2.54% 551
Transportation challenges 2.72% 9.42% 21.92% 33.15% 30.98% 1.81% 552
Limited roster spots on teams 5.63% 14.70% 23.41% 32.67% 20.69% 2.90% 551
Safety concerns 7.16% 17.98% 27.16% 24.95% 19.27% 3.49% 545
Academic ineligibility 5.08% 14.52% 22.50% 32.12% 22.87% 2.90% 551
Insufficient choice of sports for youth 10.20% 19.85% 24.95% 22.04% 18.40% 4.55% 549
Arts programs
Family financial limitations 6.19% 11.63% 18.39% 29.64% 32.08% 2.06% 533
Family time commitment 2.63% 10.15% 17.86% 41.35% 25.75% 2.26% 532
Transportation challenges 3.57% 11.28% 24.25% 32.89% 25.38% 2.63% 532
Limited spots in activity 8.49% 20.38% 20.94% 30.38% 17.36% 2.45% 530
Safety concerns 18.87% 21.32% 19.06% 17.36% 20.94% 2.45% 530
Academic ineligibility 11.53% 20.42% 22.31% 23.44% 19.66% 2.65% 529
Insufficient choice of programs for youth 10.92% 16.20% 23.35% 25.99% 20.34% 3.20% 531
Academic programs
Family financial limitations 7.91% 14.88% 19.77% 27.87% 27.68% 1.88% 531
Family time commitment 2.63% 12.03% 19.74% 40.79% 22.93% 1.88% 532
Transportation challenges 3.20% 12.24% 25.24% 31.64% 25.05% 2.64% 531
Limited spots in activity 9.98% 18.46% 21.85% 27.87% 19.21% 2.64% 531
Safety concerns 19.28% 19.47% 19.85% 17.58% 21.93% 1.89% 529
Academic ineligibility 12.45% 17.74% 20.75% 27.74% 17.74% 3.58% 530
Insufficient choice of programs for youth 10.17% 17.33% 23.73% 23.92% 22.03% 2.82% 531
SOURCE: Authors’ calculations conducted with school administrator survey data. NOTES: Respondents were asked to indicate the extent to which they agreed that the following barriers limited participation in their school’s extracurricular program. Percentages are taken out of the total N for each individual question. Results are not weighted.

50
School Administrator Survey Table B.16. Barriers to Extracurricular Participation, Private Schools
Strongly Disagree Disagree Neutral Agree
Strongly Agree Don’t Know Total N
Sports
Family financial limitations 5.76% 10.47% 15.71% 22.51% 43.46% 2.09% 191
Family time commitment 2.62% 8.38% 14.66% 41.88% 29.32% 3.14% 191
Transportation challenges 3.66% 9.42% 23.56% 25.65% 35.60% 2.09% 191
Limited roster spots on teams 3.14% 12.04% 15.18% 43.46% 24.61% 1.57% 191
Safety concerns 5.82% 12.70% 18.52% 20.11% 39.15% 3.70% 189
Academic ineligibility 4.74% 15.79% 17.89% 31.05% 27.37% 3.16% 190
Insufficient choice of sports for youth 8.99% 13.23% 19.58% 23.81% 32.28% 2.12% 189
Arts programs
Family financial limitations 10.29% 10.29% 12.25% 23.04% 41.67% 2.45% 204
Family time commitment 2.94% 9.80% 13.73% 40.20% 31.37% 1.96% 204
Transportation challenges 4.43% 11.82% 18.23% 30.54% 32.51% 2.46% 203
Limited spots in activity 4.90% 14.22% 16.67% 36.76% 23.04% 4.41% 204
Safety concerns 8.37% 18.23% 14.78% 21.67% 33.99% 2.96% 203
Academic ineligibility 9.31% 20.10% 14.22% 23.04% 27.94% 5.39% 204
Insufficient choice of programs for youth 10.34% 15.27% 12.32% 23.65% 35.96% 2.46% 203
Academic programs
Family financial limitations 11.00% 12.50% 13.50% 20.50% 40.50% 2.00% 200
Family time commitment 3.54% 12.12% 12.12% 38.38% 30.81% 3.03% 198
Transportation challenges 6.00% 7.00% 21.00% 28.00% 36.00% 2.00% 200
Limited spots in activity 7.50% 14.00% 14.50% 33.00% 29.00% 2.00% 200
Safety concerns 11.06% 14.57% 15.58% 21.61% 35.18% 2.01% 199
Academic ineligibility 10.05% 12.06% 14.57% 27.64% 31.66% 4.02% 199
Insufficient choice of programs for youth 7.54% 13.07% 18.59% 22.61% 35.18% 3.02% 199
SOURCE: Authors’ calculations conducted with school administrator survey data. NOTES: Respondents were asked to indicate the extent to which they agreed that the following barriers limited participation in their school’s extracurricular program. Percentages are taken out of the total N for each individual question. Results are not weighted.

51
School Administrator Survey Table B.17. Order of Program to Cut Due to Hypothetical Future Budget Cuts
Overall Public Schools Private Schools
Percentage N Percentage N Percentage N
Sports cut first 26.44% 179 26.13% 127 27.23% 52
Sports cut second 31.91% 216 33.74% 164 27.23% 52
Sports cut last 41.65% 282 40.12% 195 45.55% 87
Number of respondents 677 486 191
Arts cut first 36.63% 248 35.60% 173 39.27% 75
Arts cut second 28.80% 195 27.16% 132 32.98% 63
Arts cut last 34.56% 234 37.24% 181 27.75% 53
Number of respondents 677 486 191
Academic program cut first 36.93% 250 38.27% 186 33.51% 64
Academic program cut second 39.29% 266 39.09% 190 39.79% 76
Academic program cut last 23.78% 161 22.63% 110 26.70% 51
Number of respondents 677 486 191
SOURCE: Authors’ calculations conducted with school administrator survey data. NOTES: Respondents were asked “If the school’s budget for extracurricular programming was drastically decreased, please rank the order of which area would be cut starting with the first to the last.” Percentages are taken out of total respondents. Results are not weighted.

52
School Administrator Survey Table B.18. Prediction of Sports Changes in Next Five Years by School Type
All Public Schools Private Schools
Percentage N Percentage N Percentage N
Our school will not offer any competitive sports teams 4.27% 35 4.15% 25 4.59% 10
Our school will offer fewer competitive sports teams 13.41% 110 14.78% 89 9.63% 21
Our school will offer more competitive sports teams 32.32% 265 26.74% 161 47.71% 104
Our school will offer the same number of competitive sports teams 50.00% 410 54.32% 327 38.07% 83
Number of respondents 820 602 218
SOURCE: Authors’ calculations conducted with school administrator survey data. NOTES: Respondents were asked “How do you think competitive sports offerings will change at your school over the next five years?” Percentages are taken out of the total number of respondents and by subgroup. Results are not weighted.

53
School Administrator Survey Table B.19. Prediction of Changes in Next Five Years by Majority Low-Income and Not Majority Low-Income Schools
Student Body Is Majority Low-Income Student Body Is Not Majority Low-Income
Percentage N Percentage N
Our school will not offer any competitive sports teams 2.81% 10 5.39% 25
Our school will offer fewer competitive sports teams 13.48% 48 13.36% 62
Our school will offer more competitive sports teams 40.17% 143 26.29% 122
Our school will offer the same number of competitive sports teams 43.54% 154 54.96% 255
Number of respondents 355 464
SOURCE: Authors’ calculations conducted with school administrator survey data. NOTES: Respondents were asked “How do you think competitive sports offerings will change at your school over the next five years?” Majority low-income is 50 percent or more of students from low-income families. Percentages are taken out of the total number of respondents by subgroup. Results are not weighted.

54
School Administrator Survey Table B.20. Community Support by School Type
All Public Schools Private Schools
Percentage N Percentage N Percentage N
Very strong 33.11% 246 28.26% 156 47.12% 90
Strong 37.15% 276 40.04% 221 28.80% 55
Adequate 21.53% 160 23.01% 127 17.28% 33
Weak 6.86% 51 7.43% 41 5.24% 10
Very weak 1.35% 10 1.27% 7 1.57% 3
Number of respondents 743 552 191
SOURCE: Authors’ calculations conducted with school administrator survey data. NOTES: Respondents were asked what their perception of wider community sport was for their school’s sports teams (e.g., community attendance, community funding support). Percentages are taken out of the total number of respondents by subgroup. Results are not weighted.

55
School Administrator Survey Table B.21. Community Support by Majority Low-Income and Not Majority Low-Income Schools
Student Body Is Majority Low-Income Student Body Is Not Majority Low-Income
Percentage N Percentage N
Very strong 29.02% 121 38.34% 125
Strong 41.73% 174 31.29% 102
Adequate 22.78% 95 19.94% 65
Weak 6.24% 26 7.67% 25
Very weak 0.24% 1 2.76% 9
Number of respondents 417 326
SOURCE: Authors’ calculations conducted with school administrator survey data. NOTES: Respondents were asked what their perception of wider community sport was for their school’s sports teams (e.g., community attendance, community funding support). Majority low-income is 50 percent or more of students from low-income families. Percentages are taken out of the total number of respondents and by subgroup. Results are not weighted.

56
School Administrator Survey Table B.22. Sports as Personal Skill Development, Overall
Strongly Disagree Disagree Neutral Agree Strongly Agree Total N Skills
Commitment to academic excellence 2.45% 6.87% 24.17% 38.90% 27.61% 815
Commitment to physical health 1.36% 4.81% 18.00% 43.28% 32.55% 811
Competitiveness 1.84% 3.19% 15.71% 38.28% 40.98% 815
Confidence 2.09% 2.83% 14.13% 37.22% 43.73% 814
Creativity 2.09% 9.59% 23.49% 38.87% 25.95% 813
Developing a supportive peer network 2.21% 4.18% 21.87% 41.89% 29.85% 814
Discipline/personal accountability 4.90% 2.57% 11.02% 40.51% 41.00% 817
Individuality 2.71% 6.89% 26.08% 36.16% 28.17% 813
Leadership 1.97% 2.47% 14.92% 41.55% 39.09% 811
Perseverance/grit 1.61% 4.33% 14.48% 44.68% 34.90% 808
Strategic thinking 1.47% 2.21% 16.58% 45.82% 33.91% 814
Teamwork 1.84% 4.79% 12.15% 37.30% 43.93% 815
Time management 3.35% 4.71% 20.47% 40.45% 31.02% 806
Tolerance of diversity (racial, ethnic, religious, etc.) 2.21% 5.77% 21.35% 39.51% 31.17% 815
Work ethic 1.85% 3.57% 17.10% 39.36% 38.13% 813
SOURCE: Authors’ calculations conducted with school administrator survey data. NOTES: Respondents were asked to indicate to what extent they agreed that sports teach children the following skills. Percentages are taken out of the total number of respondents. Results are not weighted.

57
School Administrator Survey Table B.23. Sports as Personal Skill Development, Public Schools
Strongly Disagree Disagree Neutral Agree Strongly Agree Total N Skills
Commitment to academic excellence 2.17% 7.51% 23.87% 39.73% 26.71% 599
Commitment to physical health 1.18% 4.71% 18.15% 42.69% 33.28% 595
Competitiveness 1.34% 3.34% 15.19% 37.23% 42.90% 599
Confidence 1.85% 2.52% 13.26% 37.92% 44.46% 596
Creativity 2.35% 10.07% 22.65% 39.77% 25.17% 596
Developing a supportive peer network 2.68% 3.69% 21.11% 42.38% 30.15% 597
Discipline/personal accountability 4.01% 2.50% 11.19% 41.90% 40.40% 599
Individuality 2.68% 6.87% 25.80% 37.19% 27.47% 597
Leadership 2.02% 2.18% 14.29% 43.19% 38.32% 595
Perseverance/grit 1.52% 3.87% 13.64% 44.78% 36.20% 594
Strategic thinking 1.50% 1.33% 16.17% 48.17% 32.83% 600
Teamwork 1.84% 4.01% 11.71% 37.12% 45.32% 598
Time management 3.37% 5.06% 20.40% 40.30% 30.86% 593
Tolerance of diversity (racial, ethnic, religious, etc.) 2.34% 5.01% 22.04% 40.40% 30.22% 599
Work ethic 1.51% 3.69% 16.78% 39.77% 38.26% 596
SOURCE: Authors’ calculations conducted with school administrator survey data. NOTES: Respondents were asked to indicate to what extent they agreed that sports teach children the following skills. Percentages are taken out of the total number of respondents and by subgroup. Results are not weighted.

58
School Administrator Survey Table B.24. Sports as Personal Skill Development, Private Schools
Strongly Disagree Disagree Neutral Agree Strongly Agree Total N Skills
Commitment to academic excellence 3.24% 5.09% 25.00% 36.57% 30.09% 216
Commitment to physical health 1.85% 5.09% 17.59% 44.91% 30.56% 216
Competitiveness 3.24% 2.78% 17.13% 41.20% 35.65% 216
Confidence 2.75% 3.67% 16.51% 35.32% 41.74% 218
Creativity 1.38% 8.29% 25.81% 36.41% 28.11% 217
Developing a supportive peer network 0.92% 5.53% 23.96% 40.55% 29.03% 217
Discipline/personal accountability 7.34% 2.75% 10.55% 36.70% 42.66% 218
Individuality 2.78% 6.94% 26.85% 33.33% 30.09% 216
Leadership 1.85% 3.24% 16.67% 37.04% 41.20% 216
Perseverance/grit 1.87% 5.61% 16.82% 44.39% 31.31% 214
Strategic thinking 1.40% 4.67% 17.76% 39.25% 36.92% 214
Teamwork 1.84% 6.91% 13.36% 37.79% 40.09% 217
Time management 3.29% 3.76% 20.66% 40.85% 31.46% 213
Tolerance of diversity (racial, ethnic, religious, etc.) 1.85% 7.87% 19.44% 37.04% 33.80%
216
Work ethic 2.76% 3.23% 17.97% 38.25% 37.79% 217
SOURCE: Authors’ calculations conducted with school administrator survey data. NOTES: Respondents were asked to indicate to what extent they agreed that sports teach children the following skills. Percentages are taken out of the total number of respondents and by subgroup. Results are not weighted.

59
Community Sports Leader Tables
Community Sports Leader Survey Table C.1. Community Sports Leader Survey Background Information
All Community/Recreational
Programs Travel/Competitive
Programs
Percentage N Percentage N Percentage N
Type of organization
Community-based program 32.09% 60 - - - -
Government agency 8.02% 15 - - - -
Nonprofit agency 40.11% 75 - - - -
Competitive/travel club 19.79% 37 - - - -
Number of respondents 187
Years organization operating in community
0–2 years 5.91% 11 5.33% 8 8.33% 3
3–6 years 11.29% 21 8.00% 12 25.00% 9
7–10 years 11.83% 22 10.70% 16 16.67% 6
11+ years 70.97% 132 76.00% 114 50.00% 18
Number of respondents 186 150 36
Role in organization
Executive director 44.39% 83 46.00% 69 37.84% 14
Program manager 19.25% 36 22.00% 33 8.11% 3
League administrator 10.70% 20 12.67% 19 2.70% 1
Volunteer 3.21% 6 2.67% 4 5.41% 2
Coach/instructor 8.56% 16 4.67% 7 24.32% 9
Other 13.90% 26 12.00% 18 21.62% 8
Number of respondents 187 150 37
SOURCE: Authors’ calculations conducted with community sports leader survey data. NOTES: Sample sizes: total program N = 188; community program N = 150; travel program N = 37. Because one participant did not answer the type of program question, the community and travel programs do not add up to 188, which is the total sample size. Results are not weighted.

60
Community Sports Leader Survey Table C.2. Community Sports Leader Survey Youth Served
All Community/Recreational
Programs Travel/Competitive
Programs
Percentage N Percentage N Percentage N
Number of youth served
Less than 100 13.83% 26 8.67% 13 35.14% 13
101–250 18.62% 35 13.33% 20 40.54% 15
251–500 15.96% 30 17.33% 26 10.81% 4
501–750 9.57% 18 11.33% 17 2.70% 1
751–1,000 7.98% 15 9.33% 14 2.70% 1
More than 1,000 34.04% 64 40.00% 60 8.11% 3
Number of respondents 188 150 37
Female
0% 2.15% 4 2.70% 4 0% 0
<25% 24.73% 46 25.68% 38 18.92% 7
26–50% 44.09% 82 50.68% 75 18.92% 7
51–75% 15.59% 29 11.49% 17 32.43% 12
>75% 11.29% 21 7.43% 11 27.03% 10
Don’t know 2.15% 4 2.03% 3 2.70% 1
Number of respondents 186 148 37
Male
0% 4.97% 9 3.40% 5 12.12% 4
<25% 5.52% 10 2.72% 4 18.18% 6
26–50% 28.18% 51 27.21% 40 33.33% 11
51–75% 39.78% 72 43.54% 64 24.24% 8
>75% 19.89% 36 21.09% 31 12.12% 4
Don’t know 1.66% 3 2.04% 3 0% 0
Number of respondents 181 147 33
Low-income
0% 0.54% 1 0.00% 0 2.78% 1
<25% 30.43% 56 28.57% 42 38.89% 14
26–50% 21.20% 39 23.13% 34 13.89% 5
51–75% 13.04% 24 13.61% 20 11.11% 4
>75% 13.59% 25 14.97% 22 8.33% 3
Don’t know 21.20% 39 19.73% 29 25.00% 9
Number of respondents 184 147 36
Hispanic
0% 3.30% 6 2.76% 4 5.56% 2
<25% 69.23% 126 67.59% 98 77.78% 28
26–50% 8.79% 16 9.66% 14 5.56% 2

61
All Community/Recreational
Programs Travel/Competitive
Programs
Percentage N Percentage N Percentage N 51–75% 4.40% 8 4.14% 6 5.56% 2
>75% 1.65% 3 2.07% 3 0.00% 0
Don’t know 12.64% 23 13.79% 20 5.56% 2
Number of respondents 182 145 36
African American
0% 2.72% 5 2.04% 3 5.56% 2
<25% 52.17% 96 50.34% 74 61.11% 22
26–50% 14.67% 27 17.01% 25 5.56% 2
51–75% 9.24% 17 8.16% 12 13.89% 5
>75% 9.24% 17 9.52% 14 8.33% 3
Don’t know 11.96% 22 12.93% 19 5.56% 2
Number of respondents 184 147 36
Asian American
0% 11.73% 21 11.19% 16 14.29% 5
<25% 68.72% 123 70.63% 101 62.86% 22
26–50% 4.47% 8 2.10% 3 14.29% 5
51–75% 0.56% 1 0.70% 1 0.00% 0
>75% 0.56% 1 0.70% 1 0.00% 0
Don’t know 13.97% 25 14.69% 21 8.57% 3
Number of respondents 179 143 35
Age groups served
<5 years old 49.72% 90 54.00% 81 27.27% 9
5–10 years old 93.37% 169 92.67% 139 90.91% 30
11–13 years old 95.03% 172 92.67% 139 100.00% 33
14–18 years old 81.77% 148 74.00% 111 112.12% 37
Number of respondents 181 150 33
Geographic distribution
Majority rural 13.30% 25 14.00% 21 10.81% 4
Majority suburban 47.87% 90 45.33% 68 56.76% 21
Majority urban 34.04% 64 36.00% 54 27.03% 10
Rural/suburban split 2.13% 4 2.00% 3 2.70% 1
Suburban/urban split 2.66% 5 2.67% 4 2.70% 1
Number of respondents 188 150 37
SOURCE: Authors’ calculations conducted with community sports leader survey data. NOTES: Sample sizes: total program N = 188; community program N = 150; travel program N = 37. Because one participant did not answer the type of program question, community and travel programs do not add up to 188, which is the total sample size. The age groups served percentages are taken from the total respondents per subgroup (respondent could select multiple age groups served). All other percentages are also taken out of the number of respondents. Results are not weighted.

62
Community Sports Leader Survey Table C.3. Community Sports Information
Percentage N Number of sports offered
0 0.53% 1
1 26.06% 49
2 31.38% 59
3 2.66% 5
4 5.32% 10
5 or more 34.04% 64
Number of respondents 188
Organization has sport in jeopardy of being cut in next two years
Yes 27.66% 52
No 72.34% 136
Number of respondents 188
Why sport is in jeopardy of being cut
Lack of participation 73.42% 58
Cost challenges 39.24% 31
Facility challenges 22.78% 18
Transportation challenges 17.72% 14
Staffing challenges 46.84% 37
Other 6.33% 5
Number of respondents 51
Organization had sport eliminated from offering
Yes 12.77% 24
No 87.23% 164
Number of respondents 188
Why sport was eliminated
Lack of participation 56.25% 18
Cost challenges 40.63% 13
Facility challenges 28.13% 9
Transportation challenges 9.38% 3
Staffing challenges 28.13% 9
Other 12.50% 4
Number of respondents 22
SOURCE: Authors’ calculations conducted with community sports leader survey data. NOTES: Respondents were asked whether a sport was in jeopardy of being eliminated within the next two years, and, if so, why the sport might be eliminated (respondents could select multiple options). Respondents were also asked to indicate whether any specific sports had been eliminated from their offerings during the past five years, and, if so, why the sport was eliminated (respondents could select multiple options). Reasons for why a sport is in jeopardy or why a sport was eliminated were asked about individual sports (N = 79 and N= 32, respectively). Percentages for those two questions are out of the total sports that respondents answered the questions about, not the total respondents. Sample sizes: total program N = 188. Results are not weighted.

63
Community Sports Leader Survey Table C.4. Sports Offered in Community Programs
All
Sports Offered Percentage N
Boys’ badminton 0.00% 0
Girls’ badminton 0.00% 0
Baseball 36.90% 69
Boys’ basketball 34.76% 65
Girls’ basketball 33.16% 62
Cheerleading/drill team 20.86% 39
Cross-country 9.63% 18
Dance team 6.95% 13
Fencing 3.21% 6
Boys’ field hockey 1.07% 2
Girls’ field hockey 3.21% 6
Football 27.81% 52
Boys’ golf 5.35% 10
Girls’ golf 5.35% 10
Boys’ gymnastics 6.42% 12
Girls’ gymnastics 7.49% 14
Boys’ ice hockey 2.14% 4
Girls’ ice hockey 2.14% 4
Boys’ lacrosse 6.42% 12
Girls’ lacrosse 4.81% 9
Other 17.65% 33
Boys’ rowing 1.07% 2
Girls’ rowing 1.07% 2
Boys’ rugby 3.21% 6
Girls’ rugby 3.74% 7
Boys’ skiing/snowboarding 2.14% 4
Girls’ skiing/snowboarding 2.14% 4
Boys’ soccer 37.97% 71
Girls’ soccer 38.50% 72
Softball 24.60% 46
Boys’ swimming/diving 11.23% 21
Girls’ swimming/diving 11.76% 22
Boys’ tennis 9.63% 18
Girls’ tennis 9.63% 18
Track and field 13.37% 25
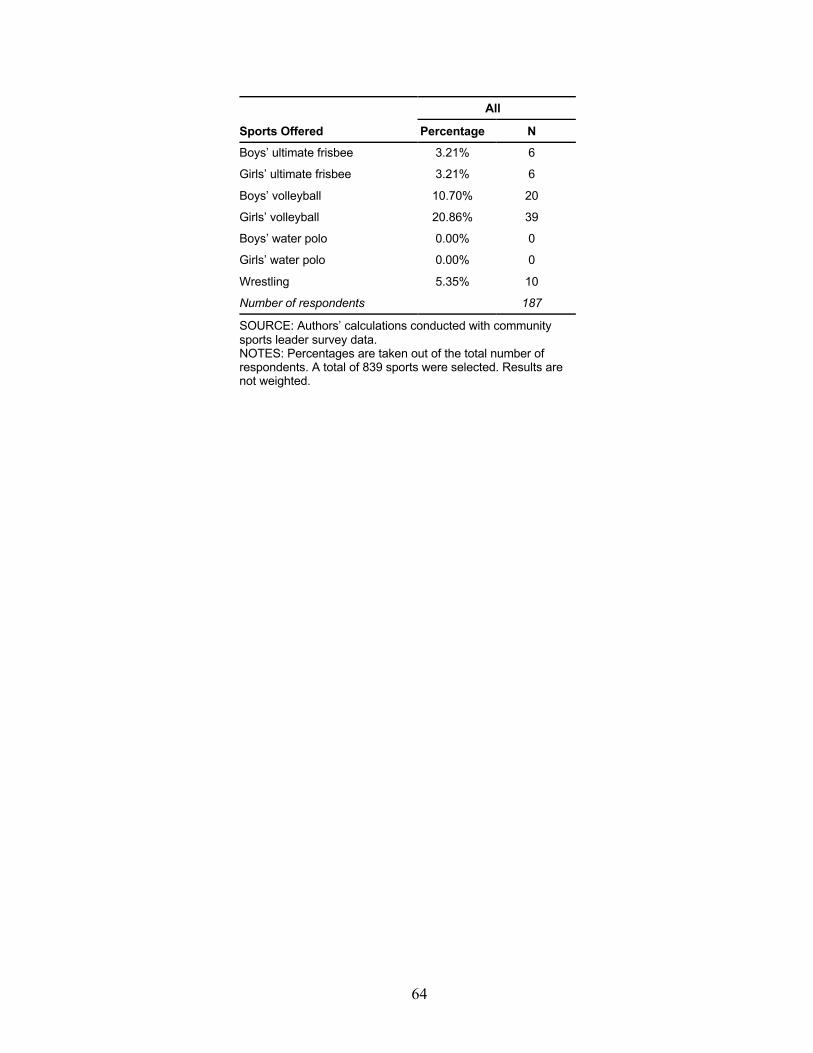
64
All
Sports Offered Percentage N Boys’ ultimate frisbee 3.21% 6
Girls’ ultimate frisbee 3.21% 6
Boys’ volleyball 10.70% 20
Girls’ volleyball 20.86% 39
Boys’ water polo 0.00% 0
Girls’ water polo 0.00% 0
Wrestling 5.35% 10
Number of respondents 187
SOURCE: Authors’ calculations conducted with community sports leader survey data. NOTES: Percentages are taken out of the total number of respondents. A total of 839 sports were selected. Results are not weighted.
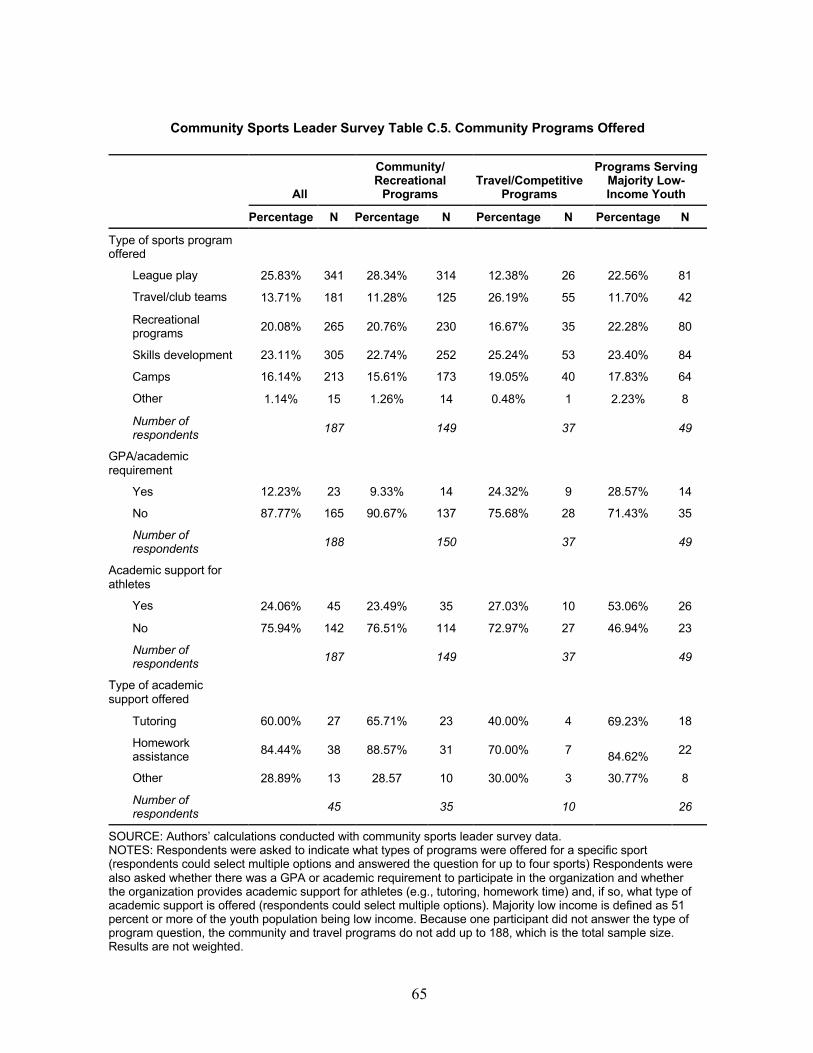
65
Community Sports Leader Survey Table C.5. Community Programs Offered
All
Community/ Recreational
Programs Travel/Competitive
Programs
Programs Serving Majority Low-Income Youth
Percentage N Percentage N Percentage N Percentage N
Type of sports program offered
League play 25.83% 341 28.34% 314 12.38% 26 22.56% 81
Travel/club teams 13.71% 181 11.28% 125 26.19% 55 11.70% 42
Recreational programs 20.08% 265 20.76% 230 16.67% 35 22.28% 80
Skills development 23.11% 305 22.74% 252 25.24% 53 23.40% 84
Camps 16.14% 213 15.61% 173 19.05% 40 17.83% 64
Other 1.14% 15 1.26% 14 0.48% 1 2.23% 8
Number of respondents 187 149 37 49
GPA/academic requirement
Yes 12.23% 23 9.33% 14 24.32% 9 28.57% 14
No 87.77% 165 90.67% 137 75.68% 28 71.43% 35
Number of respondents 188 150 37 49
Academic support for athletes
Yes 24.06% 45 23.49% 35 27.03% 10 53.06% 26
No 75.94% 142 76.51% 114 72.97% 27 46.94% 23
Number of respondents 187 149 37 49
Type of academic support offered
Tutoring 60.00% 27 65.71% 23 40.00% 4 69.23% 18
Homework assistance 84.44% 38 88.57% 31 70.00% 7 84.62% 22
Other 28.89% 13 28.57 10 30.00% 3 30.77% 8
Number of respondents 45 35 10 26
SOURCE: Authors’ calculations conducted with community sports leader survey data. NOTES: Respondents were asked to indicate what types of programs were offered for a specific sport (respondents could select multiple options and answered the question for up to four sports) Respondents were also asked whether there was a GPA or academic requirement to participate in the organization and whether the organization provides academic support for athletes (e.g., tutoring, homework time) and, if so, what type of academic support is offered (respondents could select multiple options). Majority low income is defined as 51 percent or more of the youth population being low income. Because one participant did not answer the type of program question, the community and travel programs do not add up to 188, which is the total sample size. Results are not weighted.

66
Community Sports Leader Survey Table C.6. Sports Participation over the Past Five Years, Girls
All
Community/ Recreational
Programs
Travel/ Competitive Programs
Programs Serving Majority Low-Income Youth
Percentage N Percentage N Percentage N Percentage N
Participation has:
Grown 44.94% 80 43.97% 62 50.00% 18 45.83% 22
Declined 24.72% 44 25.53% 36 22.22% 8 20.83% 10
Stayed roughly the same 30.34% 54 30.50% 43 27.78% 10 33.33% 16
Number of respondents 178 141 36 48
SOURCE: Authors’ calculations conducted with community sports leader survey data. NOTES: Respondents were asked to indicate how participation rates in their organization have changed over the past five years. Majority low income is defined as 51 percent or more of youth population served being low income. Because one participant did not answer the type of program question, the community and travel programs do not add up to the all programs total. Results are not weighted.

67
Community Sports Leader Survey Table C.7. Sports Participation over the Past Five Years, Boys
All
Community/ Recreational
Programs
Travel/ Competitive Programs
Programs Serving Majority Low-Income Youth
Percentage N Percentage N Percentage N Percentage N
Participation has:
Grown 46.15% 78 46.04% 64 48.28% 14 44.19% 19
Declined 18.93% 32 18.71% 26 20.69% 6 20.93% 9
Stayed roughly the same 34.91% 59 35.25% 49 31.03% 9 34.88% 15
Number of respondents 169 139 29 43
SOURCE: Authors’ calculations conducted with community sports leader survey data. NOTES: Respondents were asked to indicate how participation rates in their organization have changed over the past five years. Majority low income is defined as 51 percent or more of youth population served being low income. Because one participant did not answer the type of program question, the community and travel programs do not add up to the all programs total. Results are not weighted.

68
Community Sports Leader Survey Table C.8. Sports Fees
All
Community/ Recreational
Programs
Travel/ Competitive Programs
Programs Serving Majority
Low-Income Youth
Percentage N Percentage N Percentage N Percentage N
League/team participation fees
Under $50 23.91% 121 27.17% 119 2.99% 2 44.78% 60
$50–250 59.49% 301 61.64% 270 46.27% 31 40.30% 54
$250–500 10.28% 52 10.05% 44 10.45% 7 10.45% 14
$500–750 0.79% 4 0.46% 2 2.99% 2 0.00% 0
$750–1,000 1.38% 7 0.23% 1 8.96% 6 0.75% 1
More than $1,000 4.15% 21 0.46% 2 28.36% 19 3.73% 5
Number of respondents 186 148 37 49
How participation fees changed in past five years
Increased 58.27% 296 56.36% 248 71.64% 48 29.63% 40
Decreased 3.94% 20 3.64% 16 5.97% 4 7.41% 10
No change 37.80% 192 40.00% 176 22.39% 15 62.96% 85
Number of respondents 187 149 37 49
Financial assistance available for low-income families
Yes 84.57% 159 89.33% 134 67.57% 25 91.84% 45
No 15.43% 29 10.67% 16 32.43% 12 8.16% 4
Number of respondents 188 150 37 49
Organization provide scholarships
Yes 7.98% 15 7.33% 11 10.81% 4 12.24% 6
No 92.02% 173 92.67% 139 89.19% 33 87.76% 43
Number of respondents 188 150 37 49
SOURCE: Authors’ calculations conducted with community sports leader survey data. NOTES: Respondents were asked what the league/team participation fees for a specific sport were (they could answer for up to four sports total) and how the participation fees have changed for the sport in the last five years. Respondents were also asked whether financial assistance was available for youths from low-income families to support participation in programs, including sliding-scale fees depending on household income, and whether the organization provides scholarships based on youth skill level. Percentages for fee questions are taken out of total responses (i.e., number of sports), and financial assistance and scholarship percentages are taken out of the number of respondents. Because one participant did not answer the type of program question, the community and travel programs do not add up to the all programs total. Results are not weighted.

69
Community Sports Leader Survey Table C.9. Parent Expectations for Time Commitment
All Community/Recreational
Programs Travel/Competitive
Programs
Programs Serving Majority Low-Income
Youth
Percentage N Percentage N Percentage N Percentage N
Time commitments required of parents
Fundraising 16.92% 110 14.98% 83 28.42% 27 21.31% 39
Concession stand sales 8.92% 58 8.84% 49 9.47% 9 9.29% 17
Team support 37.85% 246 38.09% 211 36.84% 35 37.16% 68
None of the above 33.85% 220 35.92% 199 22.11% 21 30.60% 56
Other 2.46% 16 2.17% 12 3.16% 3 1.64% 3
Number of respondents 186 148 37 49
SOURCE: Authors’ calculations conducted with community sports leader survey data. NOTES: Respondents were asked which of the following commitments are expected of players or their families for a specific sport (they could answer for up to four sports; respondents could select multiple options). Percentages are taken out of the number of responses for each subgroup. Majority low income is defined as 51 percent or more of the youth population served being low income. Because one participant did not answer the type of program question, the community and travel programs do not add up to the all programs total. Results are not weighted.

70
Community Sports Leader Survey Table C.10. Who Pays for Costs of Sports
All
Community/ Recreational
Programs
Travel/ Competitive Programs
Programs Serving Majority Low-Income Youth
Percentage N Percentage N Percentage N Percentage N
Equipment/gear
Provided solely by parents or participation fees 33.13% 162 31.92% 136 41.27% 26 21.54% 28
Provided solely by the organization 31.49% 154 32.63% 139 23.81% 15 41.54% 54
Provided by both 35.38% 173 35.45% 151 34.92% 22 36.92% 48
Insurance/medical fees
Provided solely by parents or participation fees 47.91% 229 47.46% 196 50.77% 33 30.58% 37
Provided solely by the organization 29.08% 139 31.72% 131 12.31% 8 51.24% 62
Provided by both 23.01% 110 20.82% 86 36.92% 24 18.18% 22
Transportation
Provided solely by parents or participation fees 74.29% 338 74.23% 291 74.60% 47 40.17% 47
Provided solely by the organization 9.45% 43 10.97% 43 0.00% 0 28.21% 33
Provided by both 16.26% 74 14.80% 58 25.40% 16 31.62% 37
Uniforms
Provided solely by parents or participation fees 55.31% 271 53.41% 227 67.69% 44 43.94% 58
Provided solely by the organization 20.41% 100 20.94% 89 16.92% 11 28.79% 38
Provided by both 24.29% 119 25.65% 109 15.38% 10 27.27% 36
Other
Provided solely by parents or participation fees 31.37% 16 27.50% 11 45.45% 5 13.79% 4
Provided solely by the organization 37.25% 19 42.50% 17 18.18% 2 55.17% 16
Provided by both 31.37% 16 30.00% 12 36.36% 4 31.03% 9
SOURCE: Authors’ calculations conducted with community sports leader survey data. NOTES: Respondents indicated for each category whether parents, their organization, or both contributed to cover the cost for a specific sport (could answer for up to four sports). Percentages are taken out of total responses. Majority low income is defined as 51 percent or more of the youth population served being low income. Results are not weighted.

71
Community Sports Leader Survey Table C.11. Barriers to Participation, All Programs
Strongly Disagree Disagree Neutral Agree
Strongly Agree Don’t Know Total N
Family financial limitations 8.02% 14.97% 15.51% 33.69% 27.27% 0.53% 187
Family time commitment 3.78% 6.49% 20.00% 43.78% 25.41% 0.54% 185
Transportation challenges 8.06% 15.05% 22.04% 34.41% 19.35% 1.08% 186
Limited roster spots on teams
30.98% 36.96% 15.76% 11.41% 4.89% 0.00% 184
Safety concerns 34.05% 33.51% 17.30% 8.65% 5.41% 1.08% 185
Academic ineligibility 41.30% 26.63% 23.91% 1.09% 1.63% 5.43% 184
SOURCE: Authors’ calculations conducted with community sports leader survey data. NOTES: Respondents indicated the extent to which they agreed that the following barriers limited participation in their organization’s sports programs. Percentages are taken from within each option. Results are not weighted.

72
Community Sports Leader Survey Table C.12. Barriers to Participation, Community/Recreational Programs
Strongly Disagree Disagree Neutral Agree
Strongly Agree
Don’t Know Total N
Family financial limitations
8.05% 17.45% 17.45% 28.86% 27.52% 0.67% 149
Family time commitment
4.03% 7.38% 20.13% 43.62% 24.16% 0.67% 149
Transportation challenges
8.72% 16.11% 20.81% 32.21% 21.48% 0.67% 149
Limited roster spots on teams
31.08% 38.51% 16.89% 8.78% 4.73% 0.00% 148
Safety concerns 31.76% 32.43% 18.92% 9.46% 6.08% 1.35% 148
Academic ineligibility 43.24% 25.00% 22.97% 1.35% 2.03% 5.41% 148
SOURCE: Authors’ calculations conducted with community sports leader survey data. NOTES: Respondents indicated the extent to which they agreed that the following barriers limited participation in their organization’s sports programs. Percentages are taken from within each option. Results are not weighted.

73
Community Sports Leader Survey Table C.13. Barriers to Participation, Travel/Competitive Programs
Strongly Disagree Disagree Neutral Agree
Strongly Agree
Don’t Know Total N
Family financial limitations
2.86% 2.86% 20.00% 45.71% 28.57% 0.00% 37
Family time commitment
5.56% 11.11% 27.78% 44.44% 8.33% 2.78% 35
Transportation challenges
31.43% 31.43% 11.43% 20.00% 5.71% 0.00% 36
Limited roster spots on teams
41.67% 38.89% 11.11% 5.56% 2.78% 0.00% 35
Safety concerns 34.29% 34.29% 25.71% 0.00% 0.00% 5.71% 36
Academic ineligibility 2.86% 2.86% 20.00% 45.71% 28.57% 0.00% 35
SOURCE: Authors’ calculations conducted with community sports leader survey data. NOTES: Respondents indicated the extent to which they agreed that the following barriers limited participation in their organization’s sports programs. Percentages are taken from within each option. Results are not weighted.

74
Community Sports Leader Survey Table C.14. Current Sports Funding
All Community/Recreational
Programs Travel/Competitive
Programs
Average Percentage N Average Percentage N
Average Percentage N
Percentage of revenue from:
Business support/sponsorship 10.45% 12.25% 3.30%
Government support 7.12% 8.92% 0%
Other 6.28% 6.20% 6.76%
Participation fees/tuition 69.27% 65.08% 85.54%
Support from nonprofit organizations/foundations 6.97% 7.65% 4.41%
Number of respondents 188 150 37
Percentage Percentage Percentage
Organization’s sports programming fully funded through existing contributions
Yes 47.59% 89 46.98% 70 51.35% 19
No 52.41% 98 53.02% 79 48.65% 18
Number of respondents 187 149 37
Type of supplemental support that would be beneficial
Facilities space 59.57% 112 57.33% 87 67.57% 25
Gear/equipment 70.21% 132 71.33% 107 67.57% 25
Miscellaneous funds 44.68% 84 42.67% 65 51.35% 19
Staffing/coaching support 51.60% 97 50.00% 75 59.46% 22
Transportation 25.00% 47 26.00% 39 21.62% 8
Other 3.72% 7 4.00% 6 2.70% 1
Number of respondents 188 150 37
SOURCE: Authors’ calculations conducted with community sports leader survey data. NOTES: Respondents answered approximately what percentage of revenue comes from each of the sources, whether the organization’s sports programming was adequately funded through existing contributions, and what types of supplemental support would be beneficial to their organization (respondents could select multiple options). Because one participant did not answer the type of program question, the community and travel programs do not add up to the all programs total. Results are not weighted.

75
Community Sports Leader Survey Table C.15. Changes in Sports Funding over Past Five Years
Decreased a Lot
(down 25+%) Decreased a Little
(down 1–24%) Stayed About
the Same Increased a Little
(up 1–24%) Increased a Lot
(up 25%) Total N
All Programs
Overall sports programming funding 3.21% 9.63% 36.36% 40.64% 10.16% 187
Participation fees/tuition 2.69% 8.60% 38.71% 45.70% 4.30% 186
Government support 3.66% 8.54% 78.05% 8.54% 1.22% 164
Business support/sponsorships 4.12% 8.24% 51.18% 32.94% 3.53% 170
Support from nonprofit organizations 3.16% 3.16% 72.78% 18.99% 1.90% 158
Local league/team support 3.23% 2.58% 86.45% 6.45% 1.29% 155
Other 2.44% 2.44% 58.54% 26.83% 9.76% 41
Community/Recreational Programs
Overall sports programming funding 2.68% 9.40% 34.89% 42.95% 10.07% 149
Participation fees/tuition 1.35% 8.11% 38.51% 47.30% 4.73% 148
Government support 3.79% 10.61% 75.00% 9.85% 0.76% 132
Business support/sponsorships 4.38% 8.76% 47.45% 35.77% 3.65% 137
Support from nonprofit organizations 3.20% 2.40% 70.40% 22.40% 1.60% 125
Local league/team support 3.23% 3.23% 84.68% 8.06% 0.81% 124
Other 3.45% 0.00% 48.28% 37.93% 10.34% 29
Travel/Competitive Programs
Overall sports programming funding 5.41% 10.81% 40.54% 32.43% 10.81% 37
Participation fees/tuition 8.11% 10.81% 37.84% 40.54% 2.70% 37
Government support 3.23% 0.00% 90.32% 3.23% 3.23% 31
Business support/sponsorships 3.13% 6.25% 65.63% 21.87% 3.13% 32
Support from nonprofit organizations 3.13% 6.25% 81.25% 6.25% 3.13% 32
Local league/team support 3.33% 0.00% 93.33% 0.00% 3.33% 30
Other 0.00% 8.33% 83.33% 0.00% 8.33% 12
SOURCE: Authors’ calculations conducted with community sports leader survey data. NOTES: Respondents were asked how the relative contribution of each of the funding sources to their organization had changed over the past five years. Percentages are taken from within each option. Because one participant did not answer the type of program question, the community and travel programs do not add up to the all programs total. Results are not weighted.

76
Community Sports Leader Survey Table C.16. Challenges and Future Sports Program Funding
All Community/Recreational Programs Travel/Competitive Programs
Percentage N Percentage N Percentage N
Primary challenges when providing sports programming
Equipment/uniform/gear costs 42.25% 79 42.95% 64 37.84% 14
Facilities costs/availability 75.94% 142 75.84% 113 75.68% 28
Staffing costs/availability 58.82% 110 57.72% 86 64.86% 24
Transportation costs/availability 23.53% 44 22.82% 34 27.03% 10
Interest 36.36% 68 38.93% 58 24.32% 9
Number of respondents 187 149 37
How competitive sports offerings will change in the next five years
Offer more competitive sports teams 47.85% 89 50.68% 75 37.84% 14
Offer fewer competitive sports teams 5.91% 11 4.73% 7 10.81% 4
Offer the same number of competitive sports teams 46.24% 86 44.59% 66 51.35% 19
Number of respondents 186 148 37
How do you expect organization’s sports program funding to change on per participant basis
Decrease a lot 0.00% 0 0.00% 0 0 0
Decrease a little 3.74% 7 4.00% 6 2.70% 1
Stay about the same 19.25% 36 19.46% 29 18.92% 7
Increase a little 66.31% 124 66.44% 99 64.86% 24
Increase a lot 10.70% 20 10.07% 15 13.51% 5
Number of respondents 187 149 37
If funding decreases or stays the same, will organization have to:

77
All Community/Recreational Programs Travel/Competitive Programs
Percentage N Percentage N Percentage N
Increase participant fees 34.04% 16 37.14% 13 25.00% 3
Eliminate programs 10.64% 5 5.71% 2 25.00% 3
Reduce access to programming for low-income students due to insufficient external support
8.51% 4 2.86% 1 25.00% 3
None of the above 46.81% 22 54.29% 19 25.00% 3
Number of respondents 42 34 8
SOURCE: Authors’ calculations conducted with community sports leader survey data. NOTES: Respondents were asked, as they looked five years ahead, what the top three primary challenges their organization faces related to providing youth sports programming were, and, as they looked five years ahead, how they thought sports programming would change within their organization. Respondents were also asked, as they looked five years ahead, how they expected their organization’s sports program funding to change on a per participant basis, and, if funding stayed the same or decreased, whether they anticipated having to make any of the listed changed (respondents could select multiple options). Percentages for the last question presented are taken out of the total number of respondents, like the other percentages in the table. Because one participant did not answer the type of program question, the community and travel programs do not add up to the all programs total. Results are not weighted.

78
Community Sports Leader Survey Table C.17. Opinions About Sports Programming
Strongly
Agree Agree Neutral Disagree Strongly Disagree N
All Programs
Our organization serves as a pipeline for school sports in our community
31.91% 32.45% 23.94% 10.11% 1.60% 188
Our organization serves kids who otherwise may not have opportunities to play sports
47.87% 35.11% 10.11% 4.79% 2.13% 188
Participation in our program is growing because local schools in our area are cutting their sports programs
5.91% 12.37% 33.87% 40.32% 7.53% 186
Participation in our program is declining because of competing sports programs in our area
8.06% 23.66% 25.27% 27.42% 15.59% 186
Participation in our program is declining because youth are playing sports our organization doesn’t offer
3.23% 16.13% 26.88% 35.48% 18.28% 186
Community/Recreational Programs
Our organization serves as a pipeline for school sports in our community
31.91% 32.45% 23.94% 10.11% 1.60% 150
Our organization serves kids who otherwise may not have opportunities to play sports
52.67% 32.00% 8.67% 4.67% 2.00% 150
Participation in our program is growing because local schools in our area are cutting their sports programs
6.71% 13.42% 32.89% 38.26% 8.72% 149

79
Strongly
Agree Agree Neutral Disagree Strongly Disagree N
Participation in our program is declining because of competing sports programs in our area
10.07% 22.82% 26.85% 25.50% 14.77% 149
Participation in our program is declining because youth are playing sports our organization doesn’t offer
4.03% 14.77% 28.19% 34.90% 18.12% 149
Travel/Competitive Programs
Our organization serves as a pipeline for school sports in our community
43.24% 24.32% 13.51% 16.22% 2.70% 37
Our organization serves kids who otherwise may not have opportunities to play sports
29.73% 48.65% 13.51% 5.41% 2.70% 37
Participation in our program is growing because local schools in our area are cutting their sports programs
2.78% 8.33% 38.89% 47.22% 2.78% 36
Participation in our program is declining because of competing sports programs in our area
0.00% 25.00% 19.44% 36.11% 19.44% 36
Participation in our program is declining because youth are playing sports our organization doesn’t offer
0.00% 22.22% 22.22% 38.89% 16.67% 36
SOURCE: Authors’ calculations conducted with community sports leader survey data. NOTES: Participants were asked to rate their agreement with the listed statements. Percentages are taken from within each option. Results are not weighted.

80
Community Sports Leader Survey Table C.18. Community Perception of Sports Programming
Perception of Wider Community Support of Organization’s Sports Programs Very Strong Strong Adequate Weak Very Weak
All programs (n = 188) 13.83% 28.72% 32.98% 20.74% 3.72%
Community/recreational programs (n = 150) 16.00% 31.33% 34.00% 17.33% 1.33%
Competitive/travel programs (n = 37) 5.41% 18.92% 29.73% 32.43% 13.51%
SOURCE: Authors’ calculations conducted with community sports leader survey data. NOTES: Respondents were asked what their perception of wider community support was for their organization’s sports programs (e.g., community attendance, community funding support). Because one participant did not answer the type of program question, the community and travel programs do not add up to the all programs total. Percentages are taken from within each option. Results are not weighted.
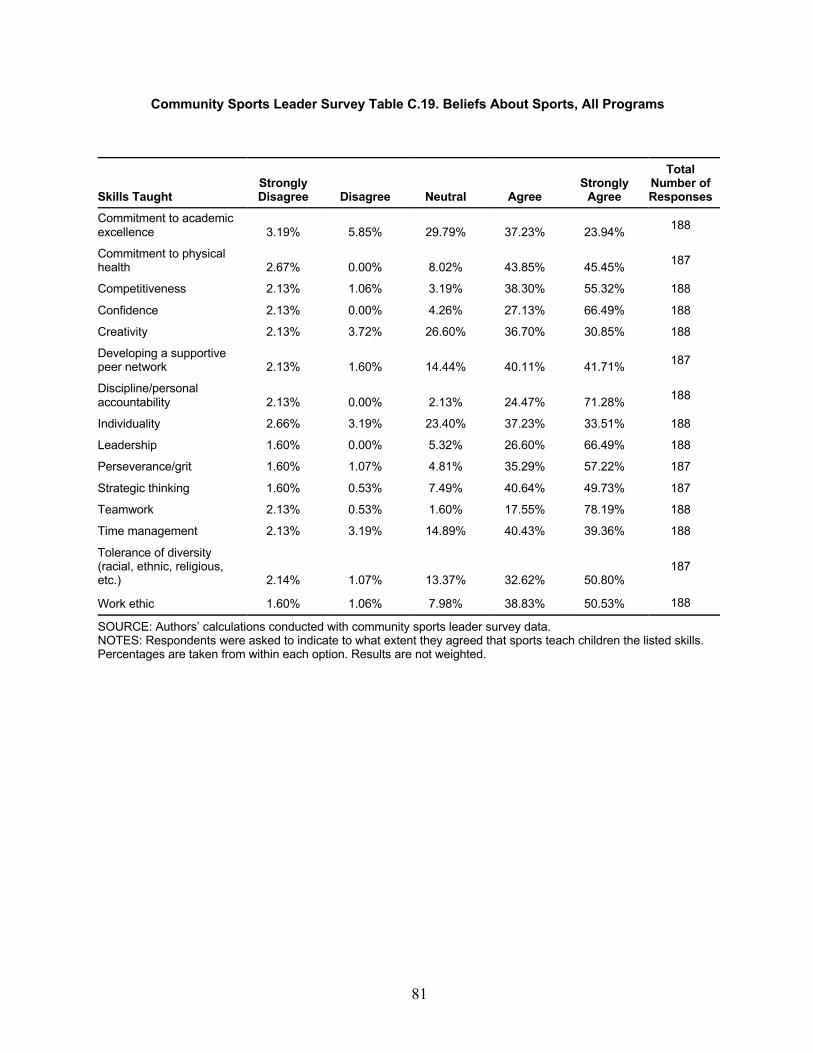
81
Community Sports Leader Survey Table C.19. Beliefs About Sports, All Programs
Skills Taught Strongly Disagree Disagree Neutral Agree
Strongly Agree
Total Number of Responses
Commitment to academic excellence 3.19% 5.85% 29.79% 37.23% 23.94% 188
Commitment to physical health 2.67% 0.00% 8.02% 43.85% 45.45% 187
Competitiveness 2.13% 1.06% 3.19% 38.30% 55.32% 188
Confidence 2.13% 0.00% 4.26% 27.13% 66.49% 188
Creativity 2.13% 3.72% 26.60% 36.70% 30.85% 188
Developing a supportive peer network 2.13% 1.60% 14.44% 40.11% 41.71% 187
Discipline/personal accountability 2.13% 0.00% 2.13% 24.47% 71.28% 188
Individuality 2.66% 3.19% 23.40% 37.23% 33.51% 188
Leadership 1.60% 0.00% 5.32% 26.60% 66.49% 188
Perseverance/grit 1.60% 1.07% 4.81% 35.29% 57.22% 187
Strategic thinking 1.60% 0.53% 7.49% 40.64% 49.73% 187
Teamwork 2.13% 0.53% 1.60% 17.55% 78.19% 188
Time management 2.13% 3.19% 14.89% 40.43% 39.36% 188
Tolerance of diversity (racial, ethnic, religious, etc.) 2.14% 1.07% 13.37% 32.62% 50.80%
187
Work ethic 1.60% 1.06% 7.98% 38.83% 50.53% 188
SOURCE: Authors’ calculations conducted with community sports leader survey data. NOTES: Respondents were asked to indicate to what extent they agreed that sports teach children the listed skills. Percentages are taken from within each option. Results are not weighted.

82
Community Sports Leader Survey Table C.20. Beliefs About Sports, Community/Recreational Programs
Skills Taught Strongly Disagree Disagree Neutral Agree
Strongly Agree
Total Number of Responses
Commitment to academic excellence 2.67% 6.00% 32.00% 38.67% 20.67% 150
Commitment to physical health 2.01% 0.00% 8.05% 47.65% 42.28% 149
Competitiveness 1.33% 1.33% 4.00% 42.67% 50.67% 150
Confidence 1.33% 0.00% 5.33% 26.00% 67.33% 150
Creativity 1.33% 3.33% 27.33% 39.33% 28.67% 150
Developing a supportive peer network 1.34% 1.34% 15.44% 42.28% 39.60% 149
Discipline/personal accountability 0.67% 0.00% 2.67% 26.67% 70.00% 150
Individuality 1.33% 3.33% 25.33% 38.67% 31.33% 150
Leadership 0.67% 0.00% 6.67% 26.00% 66.67% 150
Perseverance/grit 0.67% 1.34% 6.04% 38.26% 53.69% 149
Strategic thinking 0.67% 0.67% 7.38% 43.62% 47.65% 149
Teamwork 1.33% 0.00% 2.00% 16.67% 80.00% 150
Time management 1.33% 4.00% 18.00% 43.33% 33.33% 150
Tolerance of diversity (racial, ethnic, religious, etc.) 1.34% 1.34% 14.77% 32.89% 49.66%
149
Work ethic 0.67% 1.33% 10.00% 41.33% 46.67% 150
SOURCE: Authors’ calculations conducted with community sports leader survey data. NOTES: Percentages are taken from within each option. Respondents were asked to indicate to what extent they agreed that sports teach children the listed skills. Results are not weighted.

83
Community Sports Leader Survey Table C.21. Beliefs About Sports, Competitive/Travel Programs
Skills Taught Strongly Disagree Disagree Neutral Agree
Strongly Agree
Total Number of Responses
Commitment to academic excellence 5.41% 5.41% 18.92% 32.43% 37.84% 37
Commitment to physical health 5.41% 0.00% 8.11% 27.03% 59.46% 37
Competitiveness 5.41% 0.00% 0.00% 21.62% 72.97% 37
Confidence 5.41% 0.00% 0.00% 32.43% 62.16% 37
Creativity 5.41% 5.41% 21.62% 27.03% 40.54% 37
Developing a supportive peer network 5.41% 2.70% 8.11% 32.43% 51.35% 37
Discipline/personal accountability 8.11% 0.00% 0.00% 16.22% 75.68% 37
Individuality 8.11% 2.70% 13.51% 32.43% 43.24% 37
Leadership 5.41% 0.00% 0.00% 29.73% 64.86% 37
Perseverance/grit 5.41% 0.00% 0.00% 24.32% 70.27% 37
Strategic thinking 5.41% 0.00% 8.11% 29.73% 56.76% 37
Teamwork 5.41% 2.70% 0.00% 21.62% 70.27% 37
Time management 5.41% 0.00% 2.70% 27.03% 64.86% 37
Tolerance of diversity (racial, ethnic, religious, etc.)
5.41% 0.00% 8.11% 32.43% 54.05% 37
Work ethic 5.41% 0.00% 0.00% 27.03% 67.57% 37
SOURCE: Authors’ calculations conducted with community sports leader survey data. NOTES: Percentages are taken from within each option. Respondents were asked to indicate to what extent they agreed that sports teach children the listed skills. Results are not weighted.

84
Parent Survey Protocol
1. What is your gender?
• Male
• Female
• Prefer not to answer
2. What is your race/ethnicity? [choose all that apply]
• African American
• American Indian or Alaska Native
• Asian
• Hispanic or Latino
• Pacific Islander
• Other
• White
3. What is your highest level of education?
• Less than a high school diploma
• High school degree or GED
• Some college, university, or technical school education
• Technical or vocational degree
• Associate’s degree
• Bachelor’s degree
• Master’s degree
• Professional or doctoral degree (PhD, Ed.D, JD, MD, or similar)
4. What is your household income?
• Less than $25,000
• $25,000–49,999
• $50,000–74,999
• $75,000–99,999
• $100,000–149,999
• $150,000–199,999
• $200,000 or more
5. What is your zip code?

85
6. How many children do you have in grades 6–12? Number of children in middle and/or
high school (grades 6–12):
7. Please indicate the gender and grade levels for each of your children in middle or high
school (grades 6–12)
[NOTE: At this point the survey system should pick one child at random and instruct the parent they are to answer all child-specific questions about this child only – IF more than 1 child is same gender and grade please prompt the respondent to answer for child born first]
8. What type of school does your child attend? • Public
• Private
• Parochial
• Charter
• Home school
• Online
9. Does your child participate in any extracurricular activities?
• Yes
• No
10. Why doesn’t your child participate in any extracurricular activities? (select all that apply)
• No/lost interest
• Too expensive
• Time commitment too high
• Sports-related injury
• Safety concerns
• Not enough playing time
• Didn’t make team
• Coaching issues
• Sport no longer offered in community
• Unable to find transportation to practice or games
• Too competitive
• Other (please specify)

86
11. How important is it that your child participates in extracurricular activities?
• Very important
• Important
• Neutral
• Not important at all
12. Over the past 12 months, how many of the following extracurricular activities has your
child participated in?
• Arts programs (music, dance, visual arts, theater)
• Academic clubs (math league, debate team)
• Career clubs (4-H, DECA)
• Character/civic development (scouting, student government)
• Publications (yearbook, newspaper)
• Sports
• Non-sport physical activities (yoga, fitness, rock climbing, hiking, independent running)
• Other
• None of the above
13. In your youth, did you (or your child’s other parent) participate in the same activities as
your child?
• Yes, all
• Yes, some
• No
14. Which of the following commitments are expected of you from your child’s sports
teams? (select all that apply) • Fundraising
• Concession stand sales
• Team support (organizing snacks, informal practices, travel, etc.)
• None of the above
• Other (please specify)

87
15. Why did your child NOT participate in any team sports in the last 12 months? (select all
that apply):
• No/lost interest
• Too expensive
• Time commitment too high
• Sports-related injury
• Safety concerns
• Not enough playing time
• Didn’t make team
• Coaching issues
• Sport no longer offered in community
• Unable to find transportation to practice or games
• Too competitive
• Other (please specify)
16. Which team sport(s) did your child participate in within the last 12 months?
[Badminton; baseball; basketball; cheerleading/drill team; cross-country; dance team;
fencing; field hockey; football; golf; gymnastics; ice hockey; lacrosse; rowing; rugby;
skiing/snowboarding; soccer; softball; swimming and diving; tennis; track and field;
ultimate frisbee; volleyball; water polo; wrestling; other (please specify)]
17. Please select your child’s three favorite team sports:
18. Which type of organization(s) provides [PROVIDE NAME OF SPORT]? (select all that
apply).
• The school (e.g., school football team)
• A recreational/community program (e.g., YMCA, Parks and Recreation)
• A specialized organization (e.g., travel soccer club, swim club)
19. How many years has your child participated in [SPORT] on a team?
• 0–2 years
• 3–5 years
• 6–9 years
• 10+ years

88
20. During the season, how many hours does your child participate in [SPORT] each week?
• 0–2 hours
• 3–6 hours
• 7–10 hours
• 11–15 hours
• 16–19 hours
• 20+ hours
21. How many months per year does your child participate in [SPORT]?
• 1–3 months
• 4–6 months
• 7–9 months
• 10–12 months
22. Over the past 12 months, approximately how much money have you spent for [SPORT] team participation (include participation fees; equipment; travel; private coaching; camps;
etc.)?
• $0–100
• $101–250
• $251–500
• $501–1,000
• $1,001–$2,500
• $2,501–$5,000
• $5,001–$10,000
• More than $10,000
23. Please indicate your child’s seriousness about participating in [SPORT].
• Not at all serious
• Not very serious
• Somewhat serious
• Very serious
24. How much does your child enjoy participating in [SPORT]?
• Not at all
• A little
• Mostly
• Very much

89
25. Please indicate your child’s intention to participate in [SPORT] beyond high school in a
competitive team format (e.g., college team, local recreation team, etc.).
• Definitely will NOT play beyond HS
• Maybe will play beyond HS
• Definitely will play beyond HS
26. Thinking about transportation for [SPORT], what is the average commute distance for
your family? [NOTE: Asked for both practice and games/competitions separately]
27. Please mark any sports that your child has previously participated in, but no longer plays
or competes in.
28. What is the reason your child is no longer participating in [SPORT]? (check all that
apply)
• Competing sports schedules
• Lost interest
• Too expensive
• Time commitment too high
• Sports-related injury
• Safety concerns
• Not enough playing time
• Didn’t make team
• Coaching issues
• Sport no longer offered in community
• Unable to find transportation to practice or games
• Too competitive
• Other (please specify)
29. Please indicate which sports, if any, you would not allow your child to play.
30. Among the non-sport extracurricular activities your child has participated in over the past
12 months, please indicate which is your child’s favorite activity.
31. Please indicate the name of your child’s favorite non-sport extracurricular activity:
32. Which type of organization offers [FAVORITE NON-SPORT (NS) ACTIVITY]? (select
all that apply):
• The school
• A recreation program (YMCA, community, park district)
• A specialized program (community theater, professional training program, university-
based)
90
33. How many years has your child participated in [FAVORITE NS ACTIVITY]?
• 0–2 years
• 3–5 years
• 6–9 years
• 10+ years
34. Over the past 12 months, how many hours has your child typically spend participating in
[FAVORITE NS ACTIVITY] each week?
• 0–2 hours
• 3–6 hours
• 7–10 hours
• 11–15 hours
• 16–19 hours
• 20+ hours
35. How many months per year does your child spend participating in [FAVORITE NS
ACTIVITY]?
• 1–3 months
• 4–6 months
• 7–9 months
• 10–12 months
36. Over the past 12 months, approximately how much money have you spent for
[FAVORITE NS ACTIVITY] (include lessons; supplies/gear/instrument fees; transportation;
camps; etc.)?
• $0–100
• $101–250
• $251–500
• $501–1,000
• $1,001–$2,500
• $2,501–$5,000
• $5,001–$10,000
• More than $10,000
37. Please indicate your child’s seriousness about [FAVORITE NS ACTIVITY].
• 1 = Not at all serious
• 2 = Not very serious
• 3 = Somewhat serious
• 4 = Very serious

91
38. How much does your child enjoy [FAVORITE NS ACTIVITY].
• Not at all
• A little
• Mostly
• Very much
39. Please indicate your child’s intention to continue [FAVORITE NS ACTIVITY] beyond
high school in a structured format (e.g., college orchestra, community theater).
• Definitely will NOT participate beyond HS
• Maybe will participate beyond HS
• Absolutely will participate beyond HS
40. How well is your child performing academically?
• Very poorly (mostly failing grades)
• Poor (mixture of Ds and Fs)
• Fair (mostly Cs)
• Good (mostly Bs)
• Great (mostly As)
41. Is your child enrolled in honors or AP classes (e.g., advanced classes)?
• Yes
• No
42. What are your child’s anticipated educational plans for after high school?
• 4-year college or university
• 2-year junior college or community college
• Technical college (e.g., associate’s degree, certificate programs)
• Full-time employment
• Military
• Gap year
43. Does your child work (outside paid employment) during the school year?
• Yes
• No
44. How many hours does [HE/SHE – FILL IN] work during a typical week?
• 1–5 hours
• 6–10 hours
• 11–15 hours
• 16–20 hours
• 20+ hours

92
45. Please indicate to what extent you agree that sports teach children the following skills.
Strongly Disagree Disagree Neutral Agree
Strongly Agree
Discipline/personal accountability
Teamwork
Leadership
Strategic thinking
Confidence
Tolerance of diversity (racial, ethnic, religious, etc.)
Competitiveness
Perseverance/grit
Time management
Commitment to physical health
Commitment to academic excellence
Developing a supportive peer network
Work ethic
Creativity
Individuality

93
46. Please indicate to what extent you agree with each of the following statements.
Strongly Disagree Disagree Neutral Agree
Strongly Agree
Sports are important in our family
All children should have access to youth sports if they have a desire to play
Youth sports are important for children’s social development
Youth sports are important for children’s academic skills
I encourage my kids to play sports because they can lead to college scholarships
Youth sports can provide a pathway to success for low-income or at-risk kids
Youth sports have become too competitive
Youth sports are too expensive
Youth sports are too dangerous
Youth sports take too much time
Youth sports are becoming too specialized at an early age
Youth school sports improve school climate
Youth sports are fun
Coaching can make or break a child’s enjoyment of a sport
47. How many people live in your home?
48. How many are 18 years of age or younger?
49. Considering all of the children in your home, how many extracurricular activities does
your child(ren) participate in during a given week? This includes clubs, theater, sports, work,
religious groups, tutoring, etc. that your child(ren) participates in outside of school hours.
49a. Number of activities:
49b. Number of days/week when your children have activities:

94
50. Considering all of the children in your home, how much do you spend per year on
extracurricular activities? This includes clubs, theater, sports, work, religious groups,
tutoring, etc. that your child(ren) participates in outside of school hours.
• $0–100
• $101–250
• $251–500
• $501–1,000
• $1,001–$2,500
• $2,501–$5,000
• $5,001–$10,000
• More than $10,000

95
School Administrator Survey Protocol
1. Is your school an elementary, middle, high, or K–8/K–12 school?
• Elementary school
• Middle school
• High school
• K–8/K–12 school
2. What grade levels does your school serve? (Please check all that apply)
• Kindergarten
• 1st grade
• 2nd grade
• 3rd grade
• 4th grade
• 5th grade
• 6th grade
• 7th grade
• 8th grade
• 9th grade
• 10th grade
• 11th grade
• 12th grade
3. What is your role in the school?
• Principal
• Vice-principal
• Provost
• Athletic director
• Other (please specify): _________
4. How many years have you been in your current role at this school?
• 0–1 year
• 2–5 years
• 6–9 years
• 10–14 years
• 15–19 years
• 20+ years

96
5. What type of school do you oversee?
• Public
• Private, not religiously affiliated
• Private, religiously affiliated
• Charter
• Other
6. Is your school a single-gender school?
• Yes, it’s a boys school
• Yes, it’s a girls school
• No, our school includes students of both genders
7. What is the annual tuition for secondary (grades 6–12) school students? [OPEN ENDED]
8. What percent of the students in your school are from low-income families?
• 0–9%
• 10–19%
• 20–29%
• 30–49%
• 50–59%
• 60–69%
• 70–79%
• 80–89%
• 90% or more
9. Has the percentage of students from low-income families in your school increased,
decreased or remained the same over the past five years (since SY 2012–2013)?
• Increased
• Decreased
• Stayed about the same
10. What is the geographic distribution of your school’s student population? • Rural ___ %
• Suburban ___%
• Urban ____%
97
11. What is the racial and ethnic composition of the student body at your school? OPEN RESPONSE FOR EACH BULLET] [DOES NOT NEED TO ADD TO 100%]
• American Indian or Alaska Native
• Asian
• Black
• Hispanic or Latino
• Pacific Islander
• Two or more races
• White
12. Does your school offer competitive sports teams? Competitive sports teams are
competitive, team-based intramural and interscholastic sports. This would NOT include
things like a yoga or rock climbing club, but would include a competitive dance team or
competitive individual sport such as cross-country or swimming.
• Yes
• No
13. Why does your school not offer competitive sports?
• Other schools offering competitive sports teams are too far away
• School is a specialty school (e.g. magnet, trade school)
• Sports are offered through a collaborative hosted at another school
• Competitive sports teams were eliminated due to budgetary concerns
• Other (please specify):__________
14. Does your school have a P.E. requirement for students?
• Yes
• No
15. Have the P.E. requirements changed over the past 5 years?
• Yes, more is required
• Yes, less is required
• No, requirements have stayed the same

98
16. For the 2017–2018 school year, what is your school’s estimated per-pupil expenditure:
• Under $6,000
• $6,000–7,999
• $8,000–9,999
• $10,000–11,999
• $12,000–13,999
• $14,000–15,999
• $16,000–17,999
• $18,000 or more
17. For the 2017–2018 school year, what is your school’s estimated total student enrollment:
• Less than 200 students
• 200–399
• 400–799
• 800–1,199
• 1,200–1,999
• 2,000 or more
18. Since the 2012–2013 school year, how have the following changed?
Decreased a Lot (down
25%+)
Decreased a Little (down 1–
24%)
Stayed About the
Same
Increased a Little (up 1–
24%)
Increased a Lot (up 25%+)
Don’t Know
Total student enrollment
Per pupil budget allocation
Total school budget
Total budget for extracurricular ARTS programs
Total budget for extracurricular sports programs
Total budget for extracurricular ACADEMIC programs

99
19. Does your extracurricular ARTS programming generate funding (ticket sales, facility
rentals, concessions, etc.)?
• Yes. The extracurricular ARTS program generates sufficient funding to fully pay for
itself and help support other school activities
• Yes. The extracurricular ARTS program generates sufficient funding to fully pay for
itself
• Yes. The extracurricular ARTS program generates funding that helps to pay for its
activities
• No. The extracurricular ARTS program does not generate any funding
20. Approximately how much money does it generate in a given year?
• <$1,000
• $1,001–$5,000
• $5,001–$10,000
• $10,000+
21. Does your extracurricular ACADEMIC programming generate funding (ticket sales,
facility rentals, concessions, etc.)?
• Yes. The extracurricular ACADEMIC program generates sufficient funding to fully pay
for itself and help support other school activities
• Yes. The extracurricular ACADEMIC program generates sufficient funding to fully pay
for itself
• Yes. The extracurricular ACADEMIC program generates funding that helps to pay for its
activities
• No. The extracurricular ACADEMIC program does not generate any funding
22. How much money does it generate in a given year?
• <$1,000
• $1,001–$5,000
• $5,001–$10,000
• $10,000+

100
23. Does your extracurricular sports programming generate funding (ticket sales, facility
rentals, concessions, etc.)?
• Yes. The extracurricular sports program generates sufficient funding to fully pay for itself
and help support other school activities
• Yes. The extracurricular sports program generates sufficient funding to fully pay for itself
• Yes. The extracurricular sports program generates funding that helps to pay for its
activities
• No. The extracurricular sports program does not generate any funding
24. How much money does it generate in a given year?
• <$1,000
• $1,001–$5,000
• $5,001–$10,000
• $10,000+
25. As you look 5 years ahead, how do you expect per-pupil funding to change for
extracurricular enrichment opportunities?
26. If the school’s budget for extracurricular programming was drastically decreased, please
rank the order of which area would be cut starting with the first to the last.
• Arts programming
• Academic club programming
• Sports programming
Extracurricular Activities
Decrease a Lot (down
25%+)
Decrease a Little (down
1–24%) Stay About the Same
Increase a Little (up 1–
24%)
Increase a Lot (up 25%+)
Don’t Know
Extracurricular ARTS programming
Extracurricular ACADEMIC club programming
Extracurricular sports programming
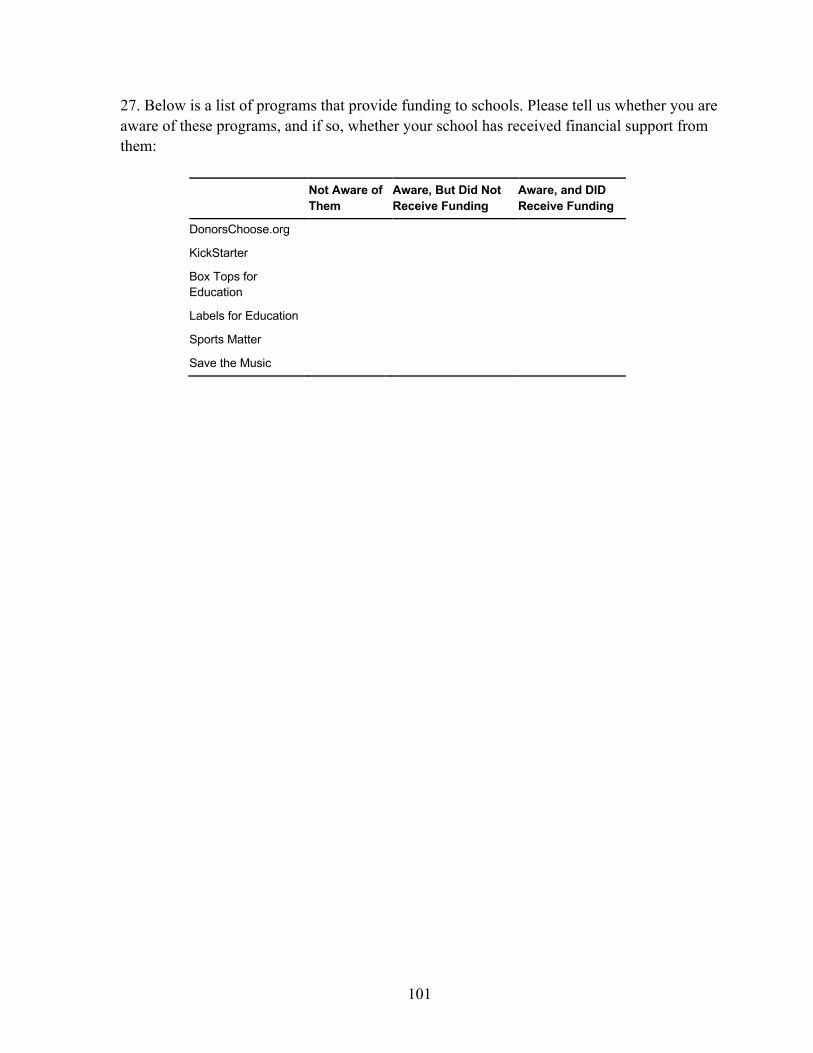
101
27. Below is a list of programs that provide funding to schools. Please tell us whether you are
aware of these programs, and if so, whether your school has received financial support from
them:
Not Aware of Them
Aware, But Did Not Receive Funding
Aware, and DID Receive Funding
DonorsChoose.org
KickStarter
Box Tops for Education
Labels for Education
Sports Matter
Save the Music

102
28. Where have you obtained information about these types of funding programs? (Check all
that apply)
Funding Program Where Did You Obtain Information on This Program? (check all that apply)
Program 1 • In a retail store • On a product • Email communication • Advertisement (online, print, television, etc.) • Online grant aggregator • Parent recommendations • District recommendations • School staff, including teachers and coaches • Peer recommendations • Professional resource/publication • Other (please specify):________
Program 2 • In a retail store • On a product • Email communication • Advertisement (online, print, television, etc.) • Online grant aggregator • Parent recommendations • District recommendations • School staff, including teachers and coaches • Peer recommendations • Professional resource/publication • Other (please specify):________
Program n • In a retail store • On a product • Email communication • Advertisement (online, print, television, etc.) • Online grant aggregator • Parent recommendations • District recommendations • School staff, including teachers and coaches • Peer recommendations • Professional resource/publication • Other (please specify):________
29. Is your school restricted from receiving donations from a non-profit organization?
• Yes
• No

103
30. Think about the competitive extracurricular sports teams (intramural and interscholastic)
offered through your school. We are only interested in those that happen OUTSIDE CLASS
TIME—things like tennis team, not tennis as a gym class. Please check which sports are
offered at your school.
Sport Do You Offer This Activity as a Competitive Sports Team?
Badminton Boys Girls
Baseball
Basketball Boys Girls
Cheerleading/drill team
Cross-country
Dance team
Fencing
Field hockey Boys Girls
Football
Golf Boys Girls
Gymnastics Boys Girls
Ice hockey Boys Girls
Lacrosse Boys Girls
Rowing Boys Girls
Rugby Boys

104
Sport Do You Offer This Activity as a Competitive Sports Team?
Girls
Skiing/snowboarding Boys Girls
Soccer Boys Girls
Softball
Swimming and diving Boys Girls
Tennis Boys Girls
Track and field
Ultimate frisbee Boys Girls
Volleyball Boys Girls
Water polo Boys Girls
Wrestling
Other:
31. Please select the program(s) in jeopardy of being eliminated within the next 2 years.
Sport
Sport 1 o Yes o No
Sport 2 o Yes o No
Sport n o Yes o No

105
32. What is the most popular sport for girls in your school?
Sport Check the Most Popular for Girls [ALLOW ONLY
ONE CHOICE]
Sport 1 •
Sport 2 •
Sport n •
33. What is the most popular sport for boys in your school?
Sport Check the Most Popular for Boys [ALLOW ONLY
ONE CHOICE]
Sport 1 •
Sport 2 •
Sport n •
34. What are the two most popular sports in your school?
Sport Check the Two Most Popular Sports
Sport 1 •
Sport 2 •
Sport n •
35. Is the [GENDER SPORT] team fully funded within the school’s main budget—meaning
no additional funds are needed to provide the program?
• Yes
• No
36. [IF PREVIOUS RESPONSE IS NO]: Does supplemental funding for [GENDER SPORT] include: (select all that apply)
• Private donation or sponsorship
• Nonprofit donation
• Student fundraising
• Student participation fees
• PTA/Booster Club contributions

106
37. How has funding changed for [GENDER SPORT] since the 2012–2013 school year?
• More well-funded now than in 2012–2013
• Less well-funded now than in 2012–2013
• No change from 2012–2013
38. Does [GENDER SPORT] require student participation fees?
• Yes
• No
39. How much are participation fees for [GENDER SPORT]?
• Under $50
• $50–100
• $101–150
• $151–200
• Over $200
40. How have student participation fees for [GENDER SPORT] changed since 2012–2013?
• Increased
• Decreased
• Stayed the same
41. What area is most in need for [GENDER SPORT] currently?
• Uniforms
• Gear/equipment
• Facilities space
• Staffing/coaching support
• Transportation
• Other (please specify): ________
42. You indicated that [GENDER SPORT] may not be offered within the next two years.
What is the reason(s) for this? • Lack of student interest
• Lack of facilities/facility costs
• Gear/equipment costs
• Lack of staffing/staffing costs
• Insurance costs
• Transportation challenges
• Other (please specify): ________

107
43. Please indicate whether any of these extracurricular sports teams have been eliminated
from your offerings during the past 5 years.
Sport Has Sport Been Eliminated from Your School Within
the Last 5 Years? (check box if yes)
Sport 1 •
Sport 2 •
Sport n •
44. Why was the extracurricular sport team eliminated?
Sport Reason Sport Was Eliminated (select all that apply)
Sport 1 o Lack of participation o Cost challenges o Facility challenges o Transportation challenges o Staffing challenges o Existence of other options in community o Other
Sport 2 o Lack of participation o Cost challenges o Facility challenges o Transportation challenges o Staffing challenges o Existence of other options in community o Other
Sport n o Lack of participation o Cost challenges o Facility challenges o Transportation challenges o Staffing challenges o Existence of other options in community o Other
45. What percentage of your male students participate in the school’s competitive
extracurricular sport teams?
• <25%
• 26–50%
• 51–75%
• >75%

108
46. How has male participation changed since the 2012–2013 school year? (Select one)
• Participation has grown
• Participation has declined
• Participation has stayed roughly the same
47. What percentage of your female students participate in the school’s competitive
extracurricular sport teams?
• <25%
• 26–50%
• 51–75%
• >75%
48. How has female participation changed since the 2012–2013 school year? (Select one)
• Participation has grown
• Participation has declined
• Participation has stayed roughly the same
49. Please indicate the extent to which you agree the following barriers limit participation in
your school’s extracurricular sports programs.
Strongly Disagree Disagree Neutral Agree
Strongly Agree Don’t Know
Family financial limitations
Family time commitment
Transportation challenges
Limited roster spots on teams
Safety concerns
Academic ineligibility
Insufficient choice of sports for youth
50. Do your school’s extracurricular sports teams have a GPA requirement?
• Yes
• No

109
51. What is your perception of wider community support for your school’s sports teams?
(e.g., community attendance, community funding support)?
• Very strong
• Strong
• Adequate
• Weak
• Very weak
52. Looking ahead, what are the top 3 primary challenges you anticipate facing when it
comes to providing youth extracurricular sports programming?
• Equipment/uniform/gear costs
• Facilities costs/availability
• Staffing costs/availability
• Transportation costs/availability
• Interest
• Family support
• Competition from school-based or club/travel sports
• Other (please specify):____________
53. How do you think competitive sports offerings will change at your school over the next 5
years?
• Our school will offer more competitive sports teams
• Our school will offer the same number of competitive sports teams
• Our school will offer fewer competitive sports teams
• Our school will not offer any competitive sports teams

110
54. Please indicate to what extent you agree that sports teach children the following skills.
Strongly Disagree Disagree Neutral Agree
Strongly Agree
Discipline/personal accountability
Teamwork
Leadership
Strategic thinking
Confidence
Tolerance of diversity (racial, ethnic, religious, etc.)
Competitiveness
Perseverance/grit
Time management
Commitment to physical health
Commitment to academic excellence
Developing a supportive peer network
Work ethic
Creativity
Individuality

111
55. We’d like you to think about the extracurricular ARTS programs offered through your
school. We are specifically interested in those that happen OUTSIDE of class time—so, not
an acting class, but a play; not a drawing class, but an art club.
Do You Offer This Activity as an Extracurricular Activity Outside
Scheduled Class Times?
Visual arts
Media arts
Band
Orchestra
Choir(s)
Dance
Theater/musicals
Creative writing
Other:
No extracurricular arts programs are offered
56. Please select the program(s) in jeopardy of being eliminated within the next 2 years.
Activity
Sport 1 o Yes o No
Sport 2 o Yes o No
Sport n o Yes o No

112
57. Why is the extracurricular ARTS program in jeopardy of being cut?
Activity Reason Activity Is in Jeopardy of Being Cut (select
all that apply)
Sport 1 o Lack of participation o Cost challenges o Facility challenges o Transportation challenges o Staffing challenges o Existence of other options in community o Other
Sport 2 o Lack of participation o Cost challenges o Facility challenges o Transportation challenges o Staffing challenges o Existence of other options in community o Other
Sport n o Lack of participation o Cost challenges o Facility challenges o Transportation challenges o Staffing challenges o Existence of other options in community o Other
58. Are extracurricular ARTS programs fully funded within the school’s main budget—
meaning no additional funds are needed to provide the program?
• Yes
• No
59. How has funding for extracurricular ARTS programs changed since the 2012–2013 school year?
• More well-funded now than in 2012–2013
• Less well-funded now than in 2012–2013
• No change from 2012–2013
60. Do any of the extracurricular ARTS programs at your school require student participation
fees?
• Yes
• No

113
61. Which type of program has the highest participation fees?
Activity Check Program with Highest Participation Fee
Activity 1
Activity 2
Activity n
62. What are ACTIVITY participation fees?
• Under $50
• $50–100
• $101–150
• $151–200
• Over $200
63. How has this requirement changed for ACTIVITY since 2012–2013?
• Increased
• Decreased
• Stayed the same
64. Please indicate whether any of these extracurricular ARTS programs have been
eliminated from your offerings during the past 5 years.
Activity Has Activity Been Eliminated from Your Organization Within the Last 5 Years? (check box if yes)
Activity 1
Activity 2
Activity n

114
65. Why was [ARTS PROGRAM] eliminated?
Activity Reason Activity Was Eliminated (select all that apply)
Activity 1 o Lack of participation o Cost challenges o Facility challenges o Transportation challenges o Staffing challenges o Existence of other options in community o Other
Activity 2 o Lack of participation o Cost challenges o Facility challenges o Transportation challenges o Staffing challenges o Existence of other options in community o Other (please specify): ___________
Activity 3 o Lack of participation o Cost challenges o Facility challenges o Transportation challenges o Staffing challenges o Existence of other options in community o Other (please specify): ___________
66. What percentage of your male students participate in the school’s extracurricular arts
programs?
• <25%
• 26–50%
• 51–75%
• >75%
67. How has male participation changed since the 2012–2013 school year? (Select one)
• Participation has grown
• Participation has declined
• Participation has stayed roughly the same
68. What percentage of your female students participate in the school’s extracurricular arts
programs? • <25%
• 26–50%
• 51–75%
• >75%

115
69. How has female participation changed since the 2012–2013 school year? (Select one)
• Participation has grown
• Participation has declined
• Participation has stayed roughly the same
70. Please indicate the extent to which you agree the following barriers limit participation in
your school’s extracurricular ARTS programs. [ONLY ALLOW ONE OPTION SELECTED PER ROW]
Strongly Disagree Disagree Neutral Agree
Strongly Agree
Don’t Know
Family financial limitations
Family time commitment
Transportation challenges
Limited spots in activity
Safety concerns
Academic ineligibility
Insufficient choice of programs for youth
71. Do extracurricular ARTS programs have a GPA requirement?
• Yes
• No
72. What is your perception of wider community support for your school’s extracurricular
ARTS activities? (e.g., community attendance, community funding support)?
• Very strong
• Strong
• Adequate
• Weak
• Very weak

116
73. Now we’d like you to think about the extracurricular ACADEMIC programs or clubs
offered through your school. We are only interested in those that happen OUTSIDE CLASS
TIME—things like math team, not math class.
Do You Offer This Activity as an Extracurricular Activity Outside Scheduled Class
Times?
STEM activities (math league, robotics club/team, Lego club/team, etc.)
Publications (yearbook, newsletter, literary magazine)
Government (student government, Model UN, Rotary, political clubs)
Community service organizations
Speech/debate team
Honors societies
Career clubs (DECA, 4-H, mock trial, forensics)
Other:
No extracurricular academic programs are offered
74. Please select the program(s) in jeopardy of being eliminated within the next 2 years.
Activities
Sport 1 o Yes o No
Sport 2 o Yes o No
Sport n o Yes o No

117
75. Why is the extracurricular ACADEMICS program in jeopardy of being cut?
Activity Reason Activity is in Jeopardy of Being Cut (select all that apply)
Sport 1 o Lack of participation o Cost challenges o Facility challenges o Transportation challenges o Staffing challenges o Existence of other options in community o Other
Sport 2 o Lack of participation o Cost challenges o Facility challenges o Transportation challenges o Staffing challenges o Existence of other options in community o Other
Sport n o Lack of participation o Cost challenges o Facility challenges o Transportation challenges o Staffing challenges o Existence of other options in community o Other
76. Are extracurricular ACADEMIC programs fully funded within the school’s main
budget—meaning no additional funds are needed to provide the program?
• Yes
• No
77. How has funding for extracurricular ACADEMIC programs changed since the 2012–
2013 school year?
• More well-funded now than in 2012–2013
• Less well-funded now than in 2012–2013
• No change from 2012–2013
78. Do any of the extracurricular ACADEMIC programs at your school require student
participation fees?
• Yes
• No

118
79. Which type of program has the highest participation fees?
Activity Check Program with Highest Participation Fee
Activity 1
Activity 2
Activity n
80. What are participation fees?
• Under $50
• $50–100
• $101–150
• $151–200
• Over $200
81. How has this requirement changed since 2012–2013?
• Increased
• Decreased
• Stayed the same
82. Please indicate whether any of these extracurricular ACADEMIC programs have been
eliminated from your offerings during the past 5 years.
Activity Has Activity Been Eliminated from Your Organization
Within the Last 5 Years? (check box if yes)
Activity 1
Activity 2
Activity n
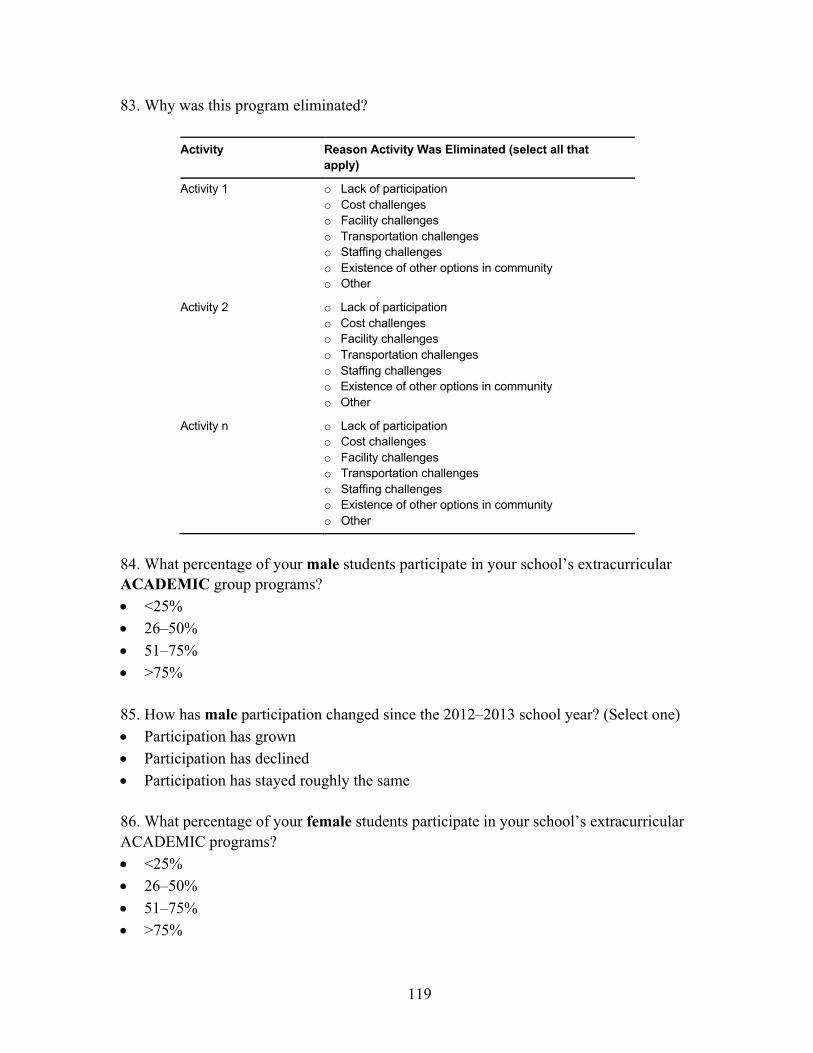
119
83. Why was this program eliminated?
Activity Reason Activity Was Eliminated (select all that apply)
Activity 1 o Lack of participation o Cost challenges o Facility challenges o Transportation challenges o Staffing challenges o Existence of other options in community o Other
Activity 2 o Lack of participation o Cost challenges o Facility challenges o Transportation challenges o Staffing challenges o Existence of other options in community o Other
Activity n o Lack of participation o Cost challenges o Facility challenges o Transportation challenges o Staffing challenges o Existence of other options in community o Other
84. What percentage of your male students participate in your school’s extracurricular ACADEMIC group programs?
• <25%
• 26–50%
• 51–75%
• >75%
85. How has male participation changed since the 2012–2013 school year? (Select one)
• Participation has grown
• Participation has declined
• Participation has stayed roughly the same
86. What percentage of your female students participate in your school’s extracurricular
ACADEMIC programs? • <25%
• 26–50%
• 51–75%
• >75%

120
87. How has female participation changed since the 2012–2013 school year? (Select one)
• Participation has grown
• Participation has declined
• Participation has stayed roughly the same
88. Please indicate the extent to which you agree the following barriers limit participation in
your school’s extracurricular ACADEMIC programs.
Strongly Disagree Disagree Neutral Agree
Strongly Agree
Don’t Know
Family financial limitations
Family time commitment
Transportation challenges
Limited spots in activity
Safety concerns
Academic ineligibility
Insufficient choice of programs for youth
89. Do extracurricular ACADEMIC programs have a GPA requirement?
• Yes
• No
90. As you look 5 years ahead, what role do you think schools will play in providing
enrichment opportunities beyond academics? Do you think the demand for school-based
competitive sports teams in the future will be greater, less, or the same? Why?

121
Local Out-of-School Organizations Survey Protocol
1. Please indicate which description best describes your organization.
• Community-based program (i.e., local Little League, local AYSO)
• Government agency (i.e., city park system)
• Nonprofit organization (i.e., local YMCA, Harlem Lacrosse)
• Competitive/travel club (i.e., East Cobb Baseball)
2. How long has your organization been operating in your community?
• 0–2 years
• 3–6 years
• 7–10 years
• 11+ years
3. What is your role in the organization?
• Executive director
• Program manager
• League administrator
• Coach/instructor
• Volunteer
• Other (please specify):__________
4. How long have you served in this role?
• 0–2 years
• 3–6 years
• 7–10 years
• 11+ years
5. Approximately how many youth does your organization serve?
• Less than 100
• 101–250
• 251–500
• 501–750
• 751–1,000
• More than 1,000

122
6. Among the youth who participate in your program, what percentage are:
0% 1–25% 26–50% 51–75% 76–100% Don’t Know
Female
Male
Hispanic
African American
Asian American
Native American
Low-income (earning <$46k/year for a family of 4)
Have a disability
7. What age groups do you serve? [please check all that apply]
• <5 years old
• 5–10 year olds
• 11–13 year olds
• 14–18 year olds
8. What is the geographic distribution of your organization’s membership? • Rural ___ %
• Suburban ___%
• Urban ____%

123
9. Which youth sports does your organization offer? (Check all that apply)
Boys Girls
Badminton
Baseball
Basketball
Cheerleading/drill team
Cross-country
Dance team
Fencing
Field hockey
Football
Golf
Gymnastics
Ice hockey
Lacrosse
Rowing
Rugby
Skiing/snowboarding
Soccer
Softball
Swimming and diving
Tennis
Track and field
Ultimate frisbee
Volleyball
Water polo
Wrestling
Other:

124
10. Is this sport in jeopardy of being eliminated within the next 2 years?
Sport
Sport 1 o Yes o No
Sport 2 o Yes o No
Sport n o Yes o No
11. Please indicate whether you offer the following programs listed below for [SPORT].
• League play (e.g., organized teams compete within the organization)
• Travel/club teams (e.g., organized teams compete against teams external to the
organization)
• Recreational programs (e.g., clubs, open gym time)
• Skills development programs
• Camps
• Other (please specify)
12. What are the league/team participation fees for [SPORT]?
• Under $50
• $50–250
• $250–500
• $500–750
• $750–1,000
• Over $1,000
13. How have these participation fees for [SPORT] changed in the last 5 years?
• Increased
• Decreased
• No change in fees

125
14. For each category listed below, please indicate whether parents, your organization, or
both parties contribute to covering the cost for [SPORT]?
Provided Solely by Parents
Provided Solely by the Organization Both
Uniform
Equipment/gear
Transportation
Insurance/medical fees
Other [please explain]
15. For each age range, how many hours per week do youth typically participate in
(including practice) [SPORT] during a season?
0–4 Hours 5–10 Hours 11–15 Hours >15 Hours
[SPORT]
16. Which of the following commitments are expected of players and/or their families for
[SPORT]?
• Fundraising
• Concession stand sales
• Team support (organizing snacks, arranging travel, etc.)
• None of the above
• Other (please specify):__________

126
17. You indicated [SPORT] is in jeopardy of not being offered in the future. What are the
reasons for this?
Sport Reason Sport May Be Eliminated (select all that
apply)
Sport 1 o Lack of participation o Cost challenges o Facility challenges o Transportation challenges o Staffing challenges o Other (please specify): ___________
Sport 2 o Lack of participation o Cost challenges o Facility challenges o Transportation challenges o Staffing challenges o Other (please specify): ___________
Sport n o Lack of participation o Cost challenges o Facility challenges o Transportation challenges o Staffing challenges o Other (please specify): ___________
18. Please indicate which of these sports have been eliminated from your offerings during the
past 5 years.
Sport
Has the Sport Been Eliminated from Your
Organization Within the Last 5 Years? (yes/no)
Sport 1 • Yes • No
Sport 2 • Yes • No
Sport n • Yes • No

127
19. Why was the program eliminated?
Sport Reason Sport Was Eliminated (select all that apply)
Sport 1 o Lack of participation o Cost challenges o Facility challenges o Transportation challenges o Staffing challenges o Other (please specify): ___________
Sport 2 o Lack of participation o Cost challenges o Facility challenges o Transportation challenges o Staffing challenges o Other (please specify): ___________
Sport n o Lack of participation o Cost challenges o Facility challenges o Transportation challenges o Staffing challenges o Other (please specify): ___________
20. How have participation rates in your organization changed over the past 5 years? Boys:
• Participation has grown
• Participation has declined
• Participation has stayed roughly the same
Girls:
• Participation has grown
• Participation has declined
• Participation has stayed roughly the same
21. Is there a GPA or academic requirement to participate in your organization?
• Yes
• No
22. Does your organization provide academic support for athletes (e.g., tutoring, homework
time)?
• Yes
• No

128
23. What type of academic support is offered? (check all that apply)
• Tutoring
• Homework assistance
• Other (please specify):__________
24. Is financial assistance available for youth from low-income families to support
participation in programs, including sliding scale fees depending on household income?
• Yes
• No
25. Does your organization provide scholarships based on youth skill level?
• Yes
• No
26. What is your perception of wider community support for your organization’s sports
programs? (e.g., community attendance, community funding support)?
• Very strong
• Strong
• Adequate
• Weak
• Very weak
27. Please indicate the extent to which you agree the following barriers limit participation in
your organization’s sports programs.
Strongly Disagree Disagree Neutral Agree
Strongly Agree
Don’t Know
Family financial limitations
Family time commitment
Transportation challenges
Limited roster spots on teams
Safety concerns
Academic ineligibility
28. Are there other barriers that limit participation in sports programs?

129
29. As you look 5 years ahead, what are the top 3 primary challenges your organization faces
when it comes to providing youth sports programming?
• Equipment/uniform/gear costs
• Facilities costs/availability
• Staffing costs/availability
• Transportation costs/availability
• Interest
30. As you look 5 years ahead, how do you think sports programming will change within
your organization?
• Our organization will offer more sports programming.
• Our organization’s sports programming will remain the same.
• Our organization will offer less sports programming.
• Our organization will not offer any sports programming.
31. Please rate your agreement with the following statements:
Strongly
Agree Agree Neutral Disagree Strongly Disagree
Our organization serves as a pipeline for school sports in our community.
Our organization serves kids who otherwise may not have opportunities to play sports.
Participation in our program is growing because local schools in our area are cutting their sports programs.
Participation in our program is declining because of competing sports programs in our area.
Participation in our program is declining because youth are playing sports our organization doesn’t offer.

130
32. Thinking about the total revenue for your organization’s sports programs (including cash,
gear, services), approximately what percentage of revenue comes from each of the following
sources?
Participation fees/tuition
Government support (federal, state, local)
Business support/sponsorship
Support from nonprofit organizations/foundations
Other
33. Overall, how has funding for your organization’s sports programs changed over the past 5
years?
• Increased a lot (up 25%+)
• Increased a little (up 1–24%)
• Stayed the same
• Decreased a little (down 1–24%)
• Decreased a lot (down 25%+)
34. How has the relative contribution of each of these funding sources to your organization
changed over the past 5 years? Please check one option for each row.
Decreased a Lot (down
25+%)
Decreased a Little (down 1–
24%) Stayed the
Same
Increased a Little (up 1–
24%)
Increased a Lot (up 25%+)
Participation fees/tuition
Government support (federal, state, local)
Business support/sponsorships
Support from nonprofit organization
Local league/team support
Other (please specify)___________

131
35. Is your organization’s sports programming adequately funded through existing
contributions?
• Yes
• No
36. What types of supplemental support would be beneficial to your organization? (check all
that apply)
• Uniforms
• Gear/equipment
• Facilities space
• Staffing/coaching support
• Transportation
• Miscellaneous funds
• Other (please specify):________________
37. As you look 5 years ahead, how do you expect your organization’s sports program
funding to change on a per participant basis?
• Increase a lot
• Increase slightly
• Stay the same
• Decrease slightly
• Decrease a lot
38. As you look 5 years ahead, do you anticipate having to: (please check all that apply)
• Increase participant fees due to lack of funding or increased costs
• Eliminate programs due to high cost
• Reduce access to programming for low-income students due to insufficient external
support
• None of the above

132
39. Below is a list of programs that provide funding to youth sports programs. From the
following list, please tell us whether you are aware of the program, and whether your
organization has received funding from them.
Not Aware of This Program
Aware of This Program, But Have Not Received
Funding from Them
Aware of This Program, and We Have Received
Funding from Them
GoFundMe
Good Sports
Sports Matter
Finish Line Youth Foundation
Daniels Fund
40. Please indicate to what extent you agree that sports teach children the following skills.
Strongly Disagree Disagree Neutral Agree
Strongly Agree
Discipline/personal accountability
Teamwork
Leadership
Strategic thinking
Confidence
Tolerance of diversity (racial, ethnic, religious, etc.)
Competitiveness
Perseverance/grit
Time management
Commitment to physical health
Commitment to academic excellence
Developing a supportive peer network
Work ethic
Creativity
Individuality

133
41. As you look 5 years ahead, what role do you think your organization will play in
providing enrichment opportunities? Do you think the demand for competitive sports teams
in the future will be greater, less, or the same? Why?

134
References
Battaglia, M., D. Izrael, D. Hoaglin, and M. Frankel, “Tips and Tricks for Raking Survey Data
(a.k.a. Sample Balancing),” Proceedings of the Survey Research Methods Section of the American Statistical Association, Alexandria, Va.: American Statistical Association, 2004,
pp. 4740–4745.
Centers for Disease Control and Prevention, “Results from the School Health Policies and
Practices Study,” 2016. As of November 15, 2018:
https://www.cdc.gov/healthyyouth/data/shpps/results.htm
Lohr, S., Sampling: Design and Analysis, 2nd ed., Boston, Mass.: Brooks/Cole, 2010.
U.S. Department of Education, National Center for Education Statistics, “Private School
Universe Survey (PSS), 2013–14,” undated-a. As of November 15, 2018:
https://nces.ed.gov/surveys/pss/tables/table_2013_21.asp
U.S. Department of Education, National Center for Education Statistics, Common Core of Data
(CCD), "Public Elementary/Secondary School Universe Survey Data, 1990–91 Through
2014–15,” undated-b. As of November 15, 2018:
https://nces.ed.gov/ccd/pubschuniv.asp
U.S. Department of Education, National Center for Education Statistics, “Schools and Staffing
Survey (SASS),” undated-c. As of November 23, 2018:
https://nces.ed.gov/surveys/sass/
U.S. Census Bureau, American Community Survey, “2012–2016 American Community Survey
5-Year Estimates, Table B01001: Age and Sex,” undated-a. As of November 15, 2018:
http://factfinder2.census.gov
U.S. Census Bureau, American Community Survey, “2012–2016 American Community Survey
5-Year Estimates, Table B02001: Race,” undated-b. As of November 15, 2018:
http://factfinder2.census.gov
U.S. Census Bureau, American Community Survey, “2012–2016 American Community Survey
5-Year Estimates, Table B19001: Household Income in the Past 12 Months,” undated-c. As
of November 15, 2018:
http://factfinder2.census.gov