who speaks broken english us undergraduates’ perceptions of non-native english
DESCRIPTION
TESL / TEFLTRANSCRIPT
© Blackwell Publishing Ltd. 2005
Who speaks “broken English”? w 187International Journal of Applied Linguistics w Vol. 15 w No. 2 w 2005
© Blackwell Publishing Ltd. 2005, 9600 Garsington Road, Oxford OX4 2DQ, UK and350 Main Street, Malden, MA 02148, USA
Who speaks “broken English”?US undergraduates’ perceptions ofnon-native English1
Stephanie Lindemann Georgia State University
This study attempts to discover how native US English speakers con-struct social categories for people outside the US. A close look at one group’sbelief system provides insights that can be used in addressing linguisticdiscrimination, with information on how varieties and features of varietiesare perceived. Here 79 US undergraduates labeled maps with descriptions ofEnglish spoken by international students, and 208 rated the English of studentsfrom 58 countries. Familiarity and socio-political relationships with countriesof origin appeared to play a role in responses. Evaluation was often central todescription, with a category of stigmatized, often “broken”, English used forall non-native speakers except perhaps (Western) Europeans. Salient subgroupswere: negatively evaluated “Chinese” English, somewhat negatively evaluated“Mexican” English, and “harsh” and “guttural” Russian English. Respondentshad competing frameworks for classifying Indian and German English. Amodel of these overlapping categories and implications for addressinglinguistic prejudice are suggested.
Keywords: accent evaluations, language attitudes, non-native English,perceptual dialectology, pronunciation
188 w Stephanie Lindemann
© Blackwell Publishing Ltd. 2005
Introduction
With globalization and growing numbers of immigrants coming to the UnitedStates, relationships between native and non-native speakers of English arebecoming an increasingly significant aspect of daily life. Native speakers’perceptions of the language of various groups can provide insights intothese relationships, as they suggest how these native speakers organize theirsocial worlds, including information about how different groups are viewedand indeed what the groups are perceived to be. As numerous researchershave pointed out, evaluations of language varieties can be understood asevaluations of the groups who speak them rather than of language per se.Lippi-Green (1997) has argued that in terms of non-native English in the US,it is “not all foreign accents, but only accent linked to skin that isn’t white, orwhich signals a third-world homeland, that evokes such negative reactions”(pp. 238–9, italics in original). She has also pointed out that such ideologiesin the United States are closely related to patterns of immigration; over time,the groups whose English has been most criticized have corresponded to thelargest recent immigrant groups.
Such non-linguistically based reactions to non-native speech have beenshown to play a role in job discrimination (Lippi-Green 1997) and in native-speaker behavior in interactions with non-natives (Lindemann 2002). Beliefsabout the ethnicity of a speaker have been sufficient to trigger assessmentsof the speaker as non-native and have even led to lower comprehensionrates (Rubin 1992). The relationship between speakers’ perceived origin andreactions to their speech is thus not only of theoretical interest, indicatingpatterns of social organization, but also of practical importance, relevant tofair treatment of (perceived) non-native speakers. This study pursues a betterunderstanding of this relationship in order to be able to more effectivelyaddress issues of linguistic prejudice, both in the education of future teachersand assessors of non-native English speakers, and in the education of thewider public.
Research using the verbal guise procedure, in which listeners are askedto rate recorded speakers of different varieties on qualities such as intelligenceand likeability, has shown that US listeners negatively evaluate (at leastunder some conditions) native speakers of Spanish (Ryan, Carranza andMoffie 1977) and German (Ryan and Bulik 1982), as well as Malaysians (Gill1994), Chinese (Cargile 1997), Japanese (Cargile and Giles 1998), Koreans(Lindemann 2003), and Italians, Norwegians, and Eastern Europeans (Mulac,Hanley and Prigge 1974). However, to quote an important review of suchwork, it is “overrepresented by one-off studies in widely varying cultures,sociolinguistic conditions, situational and procedural domains. This has madeit impossible to infer anything other than very general principles” (Giles andCoupland 1991: 49). Specifically, although such studies have been related toissues of discrimination, the lack of systematicity makes it difficult to predicthow linguistic bias would play out in a particular situation, in turn making
© Blackwell Publishing Ltd. 2005
Who speaks “broken English”? w 189
it more difficult to apply our knowledge about linguistic bias to addressingspecific cases of possible discrimination.
In addition, the emphasis on respondents’ rating scores in verbal guisestudies has meant that we do not know whether rated descriptors mean thesame things to all respondents. A particular term may be used with differentmeanings, and the same perceived features may be described using moreneutral or more negatively loaded terms. For example, “broken” is adescriptor commonly used to describe non-native speech, but it may be usedto refer to anything from speech with frequent pauses to incomprehensibleor very low-proficiency speech.
Work in perceptual dialectology has the goal of uncovering the folk’sown understanding of different varieties, looking not only at evaluations oflanguage varieties but also at how these varieties are categorized. Respondentsmay be asked to label maps with where different dialects are spoken, or torate various areas (e.g. each state in the US) on how “correct” and “pleasant”the language spoken there is. Such studies have allowed more systematicinvestigation into beliefs about US varieties. Preston (1999) suggests thatsince verbal guise studies usually do not tell us who the listeners think theyare hearing, asking study participants to respond to varieties based oncategory names may provide similar information while ensuring that therespondents are rating areas that are “cognitively real” for them. Of course,it is possible that study participants may respond differently to written tasksthan to voice samples, especially if the varieties they are responding to areless familiar non-native ones. Work in folk linguistics more generally (e.g.Niedzielski and Preston 2003) has also used interviews and participantobservation to get a more detailed look at folk theories about language,including beliefs about language as well as evaluations of it. Such analysisprovides much more information on why community members react as theydo to different varieties, what aspects of varieties are salient for them andwhy, and the degree to which beliefs are shared in a community.
The current study brings the methodology of perceptual dialectology tolooking at folk perceptions of non-native English. The use of a country-rating task paralleling Preston’s US state-rating task offers a look at howevaluations of a large number of varieties compare to each other, allowing amore systematic investigation than has been possible using the verbal guisemethod. A map-labeling task gives an idea of folk frameworks for evaluatingdifferent varieties and the degree to which there is agreement on these. Ithelps illustrate how various non-native varieties are categorized as well asevaluated, and what areas of the world and what aspects of varieties aresalient to native speakers of US English.
This detailed look at reactions to non-native English allows us to addressthe biases of such reactions in several ways. First of all, as Niedzielski andPreston (2003) have pointed out, we need to understand what the folk actuallythink about different varieties if we hope to influence folk opinion. Lookingat several individual responses is helpful in order to see the degree of

190 w Stephanie Lindemann
© Blackwell Publishing Ltd. 2005
agreement in reactions to speakers. Where there is less agreement, it may besomewhat easier to challenge stereotypical notions by pointing out theconflicts. Where reactions are more uniformly negative, it is particularlyimportant to keep in mind that these opinions may be shared as self-evidentbackground knowledge, e.g. by all parties involved in a job discriminationcase, including employers, customers, judges, and juries.
Second, respondents’ comments on specific non-native features give usan idea of what is negatively stereotyped for particular varieties. This cansuggest what areas language learners may wish to focus on (see Lindemannin press). Although there is some anecdotal knowledge about what featuresare negatively stereotyped (such as /r~l/ issues for Japanese native speakers),we should not assume that linguists, ESL teachers, and teacher-educatorswill necessarily notice the same features as laypeople.
Third, looking at respondents’ full descriptions gives us clues as to whatthey mean by various terms which we (and they) may initially take to beself-evident but about which there may not be agreement. The wide variabilityin possible interpretations of the term “broken English” mentioned abovehas clear implications for cases of possible language discrimination. Itsuggests, for example, that even a customer’s comment about an employee’s“broken English” shouldn’t necessarily be taken as evidence that the customerfound the employee’s English to be insufficient for the job.
Finally, looking at what areas of the world are evaluated similarly and/or described as a group gives us information about how non-native Englishesare categorized and what groups are relevant to the respondents. This is oftheoretical interest, giving us an idea of which nonlinguistic features may playa role in evaluations of non-native English. It is also highly relevant to appliedconcerns, as evaluations of one group of people bleed over into evaluationsof other groups that respondents consider to be part of the same category –as was seen in the US after the destruction of the World Trade Center, whenSikhs were attacked because they were thought to be Arabs/Muslims.
Thus, looking closely at a whole system of beliefs held by one group ofpeople can give us a better understanding of both theoretical and practicalissues. We not only learn the relevant factors in reactions to language varieties,but we also get ideas on how to address discrimination arising from thesereactions. The findings about this one group’s beliefs are likely to be relevantto varying degrees when looking at other groups’ reactions to speech; it ishoped that further studies looking at different groups and using a similarmethodology will help clarify which factors are more general and whichmore specific to the population considered here.
Method
Two tasks were involved: map-labeling and country-rating. For both tasks,participants were asked to think of students who come to the university

© Blackwell Publishing Ltd. 2005
Who speaks “broken English”? w 191
from all over the world. For the map-labeling task, they were each given amap of the world and asked to label it with descriptions of the Englishspoken by these students. They could thus choose both how they describeddifferent varieties and the areas which encompassed them. The map showedcountry borders but no names of countries so as to allow space to write.Although respondents were encouraged to ask if they weren’t sure where anarea was, a few odd descriptions (e.g. an arrow pointing to Poland with“French speaking” in the description) were probably due to their sometimeslimited knowledge of geography. Where participants’ intended areas wereunclear, they were asked for clarification after they completed the task. Afterthe first 30 respondents carried out the task, the remaining participants weregiven a labeled political map to look at when completing their own, whichimproved the accuracy of responses.
For the country-rating task, respondents were given a list of 58 countriesand asked to rate the English of university students from each of thesecountries on how correct, friendly, and pleasant2 they found it on a scale of1 to 10. They were also asked to rate how familiar the English of people fromeach of these countries was to them using the same scale. The countries to berated were chosen through pilot tests on a list of all countries with apopulation greater than two million; if most pilot participants left blanks fora particular country, it was omitted from the final country list.
A total of 213 US undergraduate students, 162 women and 51 men,participated in this study; 208 of them completed the country-rating task,and a mostly overlapping group of 79 completed the map-labeling task. Allwere native speakers of English who had grown up in the US speaking onlyEnglish in the home. Their ages ranged from 17 to 47, with most of them atthe lower end of that range (mean 20, median 19, mode 18). Participantswho completed both tasks were given the map-labeling task first so thattheir free-response answers would not be influenced by the more overtlyevaluative nature of the country-rating task. Both tasks were completed byparticipants in groups of two to seven people.
Results
Country ratings
Since participants were completely unfamiliar with the English of speakersfrom some countries, many 1s were given for the familiarity rating (1 beingthe lowest possible score). Some participants nevertheless were willing tomake guesses about correctness, pleasantness, and friendliness; a smallminority gave 1s for all unfamiliar countries. In several cases, whenparticipants were asked further about these scores, they explained that theygave 1s on correct, pleasant, and friendly as well as on familiar to show thatthey were unfamiliar with the English of speakers from that country. When

192 w Stephanie Lindemann
© Blackwell Publishing Ltd. 2005
it was explained that their scores would be interpreted as guesses that theEnglish would be very incorrect, very unpleasant, and very unfriendly aswell as very unfamiliar, some chose to cross out those scores. Others statedthat they did in fact intend to give low ratings. The data for those respondentswho gave 1s on all scores (not just familiar) for unfamiliar countries andwere not asked their intent are not included in the analysis, which is thereforebased on a total of 195 respondents.
Table 1 shows the fifteen countries whose English was rated highest onfamiliarity, together with each country’s rank and average score for each ofthe four characteristics. Within these there is a steep drop in familiarity, suchthat after the US, rated 10 (9.96) on average, no country was rated above 8.5,the most familiar non-native variety was rated 7.9, and the fifteenth mostfamiliar, Russia, was rated only 5.1. These most familiar varieties consist ofsome but not all of the countries with primarily native English speakers andsome with primarily non-native English speakers. They include countrieswhose English was rated quite low, at least on some traits, as well as countrieswhose English was rated very positively. Thus, although correct, pleasant,friendly, and familiar scores were closely related to each other (a factor analysisfinds a single factor explaining 90% of variance, with loadings of .967, .973,.969, and .879, respectively), relatively familiar varieties of English did notnecessarily translate into correct, pleasant, and friendly English. Among themost familiar Englishes were those spoken by people from China, Japan,India, and Russia, all rated below the median in at least one of the other
Table 1. Fifteen countries whose English was rated most familiar. Rankings(out of 58) for familiar, correct, pleasant, and friendly are followed by the meanratings (rounded to the nearest tenth) in parentheses. Values in bold fell belowthe mean scores
Country Familiar Correct Pleasant Friendly
US 1 (10.0) 1 (9.3) 1 (8.7) 2 (8.5)Canada 2 (8.5) 2 (9.0) 2 (8.4) 1 (8.5)UK 3 (8.1) 3 (8.8) 3 (8.3) 5 (7.9)Mexico 4 (7.9) 26 (6.0) 21 (6.1) 15 (6.6)Australia 5 (7.5) 4 (8.3) 4 (8.1) 3 (8.4)Jamaica 6 (6.9) 6 (7.1) 5 (7.8) 4 (8.0)France 7 (6.8) 7 (7.1) 8 (7.0) 11 (6.7)China 8 (6.6) 38 (5.4) 38 (5.5) 31 (5.9)Germany 9 (6.5) 12 (6.8) 31 (5.8) 32 (5.9)Ireland 10 (6.2) 5 (7.7) 6 (7.7) 6 (7.8)Japan 11 (6.0) 30 (5.8) 35 (5.6) 28 (6.0)Italy 12 (5.9) 8 (6.9) 7 (7.5) 7 (7.5)India 13 (5.9) 24 (6.0) 32 (5.7) 24 (6.1)Spain 14 (5.7) 10 (6.8) 9 (6.8) 8 (6.9)Russia 15 (5.1) 23 (6.0) 49 (4.8) 49 (5.0)

© Blackwell Publishing Ltd. 2005
Who speaks “broken English”? w 193
scores. Mexican English was the most familiar non-native variety, but thisEnglish was not rated as particularly correct or pleasant.
Groups that have been identified as non-stigmatized (e.g. by Lippi-Green1997) were rated positively (France, Germany), at least on correctness; groupsthat have been described as stigmatized (Mexico, Japan, China, India) wererated as less correct. Of the countries with primarily non-native Englishspeakers, Italy was rated the most positively overall. In general, we can seethat of the countries whose non-native English was most familiar, those thatare rated positively are in Western Europe, have had comparatively favorablerelationships with the US during the respondents’ lifetimes, and do not havelarge populations of recent immigrants in the US.
Although a given country tended to have similar average scores for correct,friendly, and pleasant, there are a few cases where there is a clear differenceamong these. Most notably, ratings for Russian and German English onpleasant and friendly are markedly lower than their ratings for correct. Thesplit between correctness and other scores is most obvious for Germany,which is rated fairly high on correct and below the median on pleasant andfriendly; in contrast, all three scores are low for Russia. While the highcorrectness rating for German English is consistent with the generally non-stigmatized status of Western Europeans’ English, the lower ratings onpleasant and friendly are consistent with some stereotypes of Germans,especially those associated with World War II films.
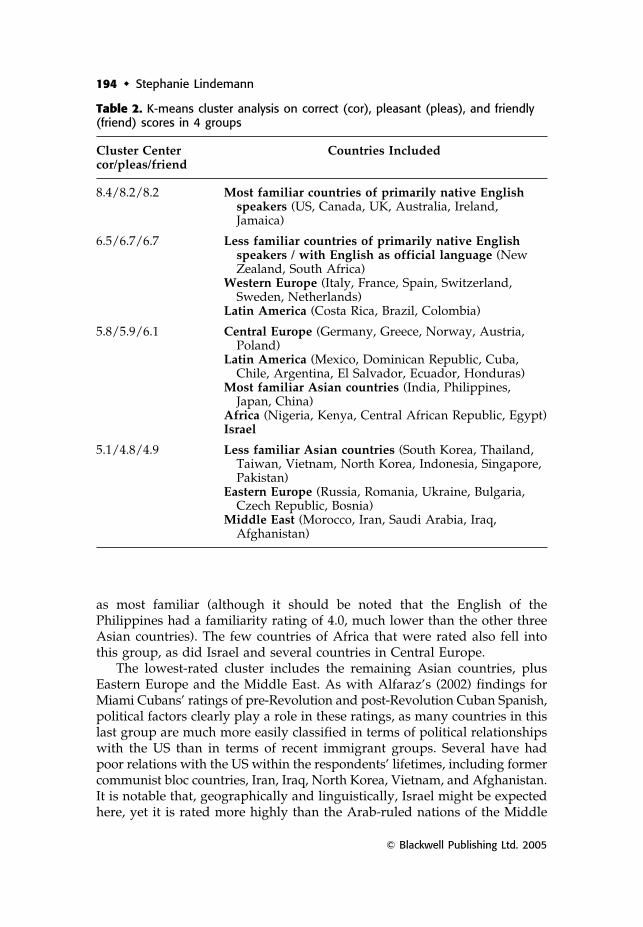
To investigate overall patterns of evaluation, K-means cluster analyseswere carried out on the correct, pleasant, and friendly ratings for all 58 countries.A number of different clusters were attempted, with four clusters proving tobe the most informative. This cluster analysis, given in Table 2, shows astriking pattern of country ratings. In this table, all countries have beenorganized within their cluster by geographical area, showing the high degreeto which English ratings are predictable based on the region of the worldand to a lesser extent on familiarity. Within each geographical area, countriesare listed from highest combined correct–pleasant–friendly rating to lowest.Thus Poland, in the third cluster under Central Europe, was rated the lowestof these countries, as might be expected since it could also be classed asEastern Europe, the other countries of which fell into the lowest-rated cluster.Likewise, Egypt is the lowest rated of the African countries in the thirdcluster and could logically also fall with the other Middle Eastern countriesin the bottom cluster.
The highest-rated group unsurprisingly consists of the six countries ofprimarily native English speakers that respondents rated as most familiar.The next highest cluster includes another country of primarily native speakersand South Africa (which has English as an official language), plus six WesternEuropean and three Latin American nations.
All other countries fell into the bottom two clusters. The third cluster coversthe remaining countries of Latin America that were rated by respondents,including Mexico, as well as the four Asian countries that respondents rated
194 w Stephanie Lindemann
© Blackwell Publishing Ltd. 2005
Table 2. K-means cluster analysis on correct (cor), pleasant (pleas), and friendly(friend) scores in 4 groups
Cluster Center Countries Includedcor/pleas/friend
8.4/8.2/8.2 Most familiar countries of primarily native Englishspeakers (US, Canada, UK, Australia, Ireland,Jamaica)
6.5/6.7/6.7 Less familiar countries of primarily native Englishspeakers / with English as official language (NewZealand, South Africa)
Western Europe (Italy, France, Spain, Switzerland,Sweden, Netherlands)
Latin America (Costa Rica, Brazil, Colombia)
5.8/5.9/6.1 Central Europe (Germany, Greece, Norway, Austria,Poland)
Latin America (Mexico, Dominican Republic, Cuba,Chile, Argentina, El Salvador, Ecuador, Honduras)
Most familiar Asian countries (India, Philippines,Japan, China)
Africa (Nigeria, Kenya, Central African Republic, Egypt)Israel
5.1/4.8/4.9 Less familiar Asian countries (South Korea, Thailand,Taiwan, Vietnam, North Korea, Indonesia, Singapore,Pakistan)
Eastern Europe (Russia, Romania, Ukraine, Bulgaria,Czech Republic, Bosnia)
Middle East (Morocco, Iran, Saudi Arabia, Iraq,Afghanistan)
as most familiar (although it should be noted that the English of thePhilippines had a familiarity rating of 4.0, much lower than the other threeAsian countries). The few countries of Africa that were rated also fell intothis group, as did Israel and several countries in Central Europe.
The lowest-rated cluster includes the remaining Asian countries, plusEastern Europe and the Middle East. As with Alfaraz’s (2002) findings forMiami Cubans’ ratings of pre-Revolution and post-Revolution Cuban Spanish,political factors clearly play a role in these ratings, as many countries in thislast group are much more easily classified in terms of political relationshipswith the US than in terms of recent immigrant groups. Several have hadpoor relations with the US within the respondents’ lifetimes, including formercommunist bloc countries, Iran, Iraq, North Korea, Vietnam, and Afghanistan.It is notable that, geographically and linguistically, Israel might be expectedhere, yet it is rated more highly than the Arab-ruled nations of the Middle

© Blackwell Publishing Ltd. 2005
Who speaks “broken English”? w 195
East. Of course, it is also possible that respondents were aware that the closerelationship between the US and Israel has included migration between thesetwo countries and considered this in giving it a somewhat higher rating.Egypt may have also fared slightly better than other Middle Eastern countriesthat are well known to US students as fundamentalist (Iran, Afghanistan,Saudi Arabia) or long out of favor with the US (Iraq).
Other sociopolitical factors may be relevant in the ratings of countrieswhich are ranked more highly than this bottom group. Turning to countriesof primarily Spanish speakers, we see that Spain falls in the highest clusterthat includes countries of primarily non-native speakers; it is rated higherthan any Latin American country, most of which fall in the next clusterdown. In this case the pattern may be better explained with reference torecent patterns of immigration to the US.
Cases other than Asia where familiarity appears to play a role includeMorocco, whose English had the lowest familiarity rating (2.2) except forBulgaria. It falls in the lowest group, although it is not likely to be associatedin respondents’ minds with fundamentalism or poor relations with the US.The Eastern European countries show a similar pattern, where both a morefamiliar traditional foe of the US (Russia) and less familiar countries (Romania,Ukraine, Bulgaria, Czech Republic, Bosnia) are rated lowest, with a slightlymore familiar country (Poland) rated higher. The highly rated countriesclassed in Table 2 as “Western Europe” were likewise nearly all rated ashaving more familiar English than the lower-rated ones classed as “CentralEurope”, except for Germany, which respondents may associate with WorldWar II, especially through films.
In summary, it appears that sociopolitical factors and familiarity canlargely explain respondents’ patterns of evaluation of the English of thesecountries, with countries that may be identified as adversaries of the US andless familiar countries being rated most negatively. While the number ofimmigrants from these countries to the US also appears to be relevant insuch evaluations, as has been suggested by Lippi-Green (1997), this factorseems more important for the countries that are not rated in the bottom-most group. Consideration of the factors relevant to respondents’ evaluationsis revisited below in light of the qualitative data from the map-labeling task.
Map labels
Data from the map-labeling task were investigated in three major ways.First, the number of responses about different areas suggest what respondentssee as speech areas and which of these are most salient to them. Second, thetypes of descriptors used indicate what general aspects of language are mostsalient to respondents. Third, the details of the actual descriptors shed lighton how respondents regard different varieties and how they see these varietiescompared to each other.
196 w Stephanie Lindemann
© Blackwell Publishing Ltd. 2005
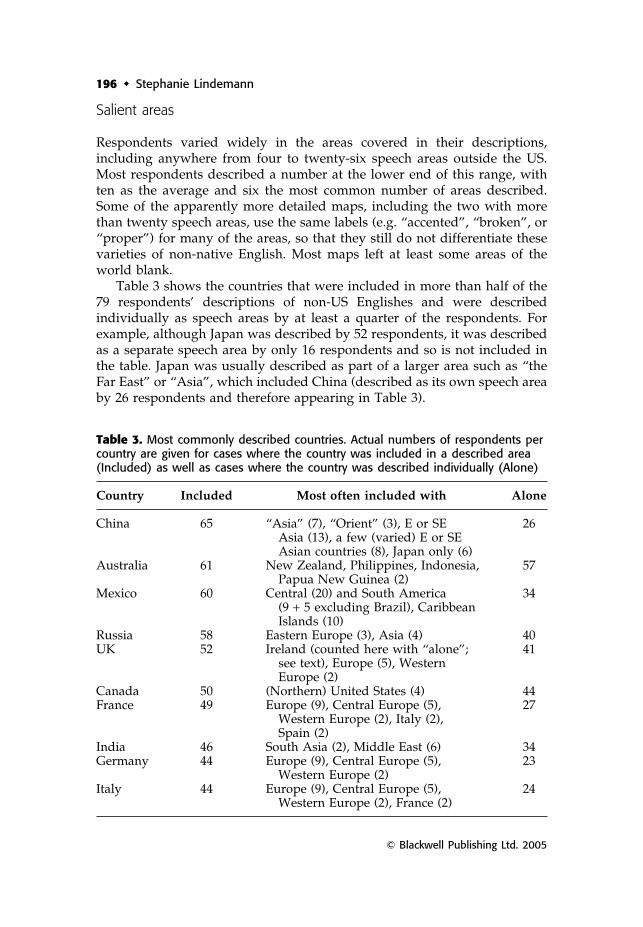
Table 3. Most commonly described countries. Actual numbers of respondents percountry are given for cases where the country was included in a described area(Included) as well as cases where the country was described individually (Alone)
Country Included Most often included with Alone
China 65 “Asia” (7), “Orient” (3), E or SE 26Asia (13), a few (varied) E or SEAsian countries (8), Japan only (6)
Australia 61 New Zealand, Philippines, Indonesia, 57Papua New Guinea (2)
Mexico 60 Central (20) and South America 34(9 + 5 excluding Brazil), CaribbeanIslands (10)
Russia 58 Eastern Europe (3), Asia (4) 40UK 52 Ireland (counted here with “alone”; 41
see text), Europe (5), WesternEurope (2)
Canada 50 (Northern) United States (4) 44France 49 Europe (9), Central Europe (5), 27
Western Europe (2), Italy (2),Spain (2)
India 46 South Asia (2), Middle East (6) 34Germany 44 Europe (9), Central Europe (5), 23
Western Europe (2)Italy 44 Europe (9), Central Europe (5), 24
Western Europe (2), France (2)
Salient areas
Respondents varied widely in the areas covered in their descriptions,including anywhere from four to twenty-six speech areas outside the US.Most respondents described a number at the lower end of this range, withten as the average and six the most common number of areas described.Some of the apparently more detailed maps, including the two with morethan twenty speech areas, use the same labels (e.g. “accented”, “broken”, or“proper”) for many of the areas, so that they still do not differentiate thesevarieties of non-native English. Most maps left at least some areas of theworld blank.
Table 3 shows the countries that were included in more than half of the79 respondents’ descriptions of non-US Englishes and were describedindividually as speech areas by at least a quarter of the respondents. Forexample, although Japan was described by 52 respondents, it was describedas a separate speech area by only 16 respondents and so is not included inthe table. Japan was usually described as part of a larger area such as “theFar East” or “Asia”, which included China (described as its own speech areaby 26 respondents and therefore appearing in Table 3).

© Blackwell Publishing Ltd. 2005
Who speaks “broken English”? w 197
The ten countries listed in Table 3 correspond closely to the fifteencountries with the most familiar English shown in Table 1. Missing is theUS, which is not considered here as respondents were not asked to describeUS English, plus Ireland (except where included with the UK), Jamaica,Japan (except where included with China), and Spain (except where includedwith Germany, France, and/or Italy). Geography almost certainly played arole in the absence of Jamaica, which is small and tended to be confused orclassed together with Cuba, Haiti, and the Dominican Republic. Similarly,Ireland was sometimes described separately but often circled together withGreat Britain and labeled as “England” or “UK”, making it difficult tosystematically distinguish respondents’ descriptions. Geography may alsoexplain in part why countries of primarily non-native English speakers werevery often described within a larger area whereas countries of primarilynative English speakers were more likely to be treated separately: Australia,Great Britain, and Ireland are each surrounded by water (though theaforementioned confusion of geographical and political labels for the UKand Ireland did not allow these to be considered separately), and Canada’sonly neighbor is the US. On the other hand, the English of these countrieswas also rated among the most familiar on the country-rating task, so wemight expect respondents’ descriptions of them to be more specific.
This group of most commented-on countries includes countries of chieflynative speakers as well as countries of chiefly non-native speakers; bothpositively and negatively evaluated countries are represented. However, thenon-native Englishes that were most often commented on were those thatwere also evaluated relatively negatively, namely China, Mexico, and Russia.China appears to be the major representative for Asia or the Far East, asdoes Mexico for all of Latin America. In contrast, no one country appears tostand for (Western) Europe; France, Germany, and Italy are described withapproximately equal frequency.
No country in Africa appears among the most frequently commented-oncountries, either as a part of an area typically included with one of thesecountries or on its own. Thirty-three respondents described the entire continentas one speech area, including one whose comment was only “I’m not reallysure” and a couple who referred to “the entire country”. Nearly as manyrespondents (29) described African sub-areas, although only South Africawas mentioned with any frequency (14). This leaves nearly a quarter ofrespondents (18/79) who did not describe the English of any part of Africa.
Salient aspects of language
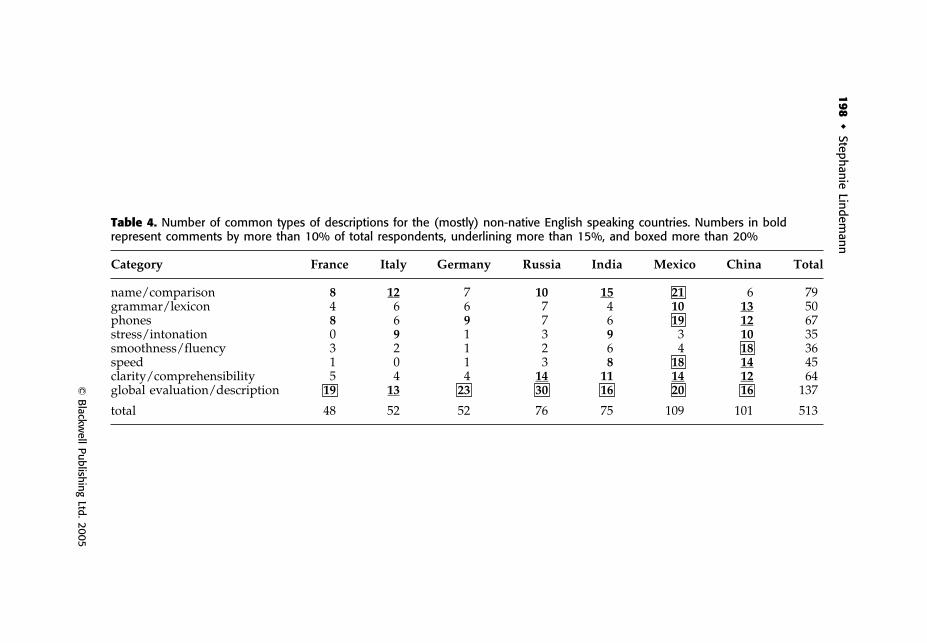
Table 4 provides an overview of the types of comments most oftenmade about the countries of primarily non-native English speakers listed inTable 3 (See Hartley and Preston 1999 for a somewhat different classificationof labels used by their respondents for varieties of US English.) Since many
198w
Stephanie Lindemann
© B
lackwell Publishing Ltd. 2005
Table 4. Number of common types of descriptions for the (mostly) non-native English speaking countries. Numbers in boldrepresent comments by more than 10% of total respondents, underlining more than 15%, and boxed more than 20%
Category France Italy Germany Russia India Mexico China Total
name/comparison 8 12 7 10 15 21 6 79grammar/lexicon 4 6 6 7 4 10 13 50phones 8 6 9 7 6 19 12 67stress/intonation 0 9 1 3 9 3 10 35smoothness/fluency 3 2 1 2 6 4 18 36speed 1 0 1 3 8 18 14 45clarity/comprehensibility 5 4 4 14 11 14 12 64global evaluation/description 19 13 23 30 16 20 16 137
total 48 52 52 76 75 109 101 513
© Blackwell Publishing Ltd. 2005
Who speaks “broken English”? w 199
respondents made more than one type of comment about a particular speecharea, the totals in some cases exceed the total number of respondents. Globalevaluations such as “broken English” or “speaks English well” were by farthe most common descriptors. For the countries that were highly rated oncorrectness – Germany, France, and Italy – no other type of comment wasmade as frequently, with the exception of name or comparison descriptorsfor Italy (e.g. “Italian accent”, or “a bit similar to English w/Spanish accent”).This descriptor type was much less common than global evaluations butwas the second most frequent type of comment, followed by descriptions ofspecific sounds that differed and comments on clarity or comprehensibility.
In general, respondents had more to say about the countries that wererated negatively on correctness, both in terms of overall number of commentsand variety of comment types. For example, comments on clarity orcomprehensibility, while one of the most common types of descriptors, wereonly common for the countries rated negatively for correctness. The mostnegatively-rated of these ‘familiar’ countries, China, had large numbers ofcomments in several categories, and Mexico had the largest number ofcomments overall.
Descriptors of salient speech areas
This section turns to the qualitative analysis of the actual descriptions ofvarious perceived speech areas. As respondents focused particularly on morenegatively evaluated countries, the analysis will begin with a look at theirdescriptions of the English of salient negatively evaluated areas. First to bediscussed is China – about which respondents made the widest variety ofcommon comment types – followed by India, Mexico, and Russia. Germany,as an area which was highly rated on correctness but which shared somenegative pleasantness-related descriptors with Russia, is described next,followed by France and Italy, the most positively described.
ChinaAlthough respondents made a wide variety of comment types about China,they showed a surprising amount of agreement. A few responses listed infull below give an idea of both the variety of comment types and the level ofagreement on comment contents. (The area being described is noted inparentheses following the comment if this is not China alone or not obviousfrom the comment itself.)
1) Speak quickly, pronounce L’s as R’s. (similar to description by anotherrespondent for “Oriental Countries”, indicated as China, Japan, and Korea)
2) This country speaks very fast; I don’t know how they understand eachother; the only way you know if these people are cursing you is if theirvoice rises.
200 w Stephanie Lindemann
© Blackwell Publishing Ltd. 2005
3) Asians tend to speak choppy, high toned English and often leave outpredicates in sentences. (5 others mention “high” or “high pitched”)
4) China and Japan are comparable to Mexico. They speak English, butsometimes leave out some words. It also sounds very cut up. By that Imean that their words do not seem to flow.
5) Difficult to understand, hard time pronouncing many words w/r and l,many times forget to put plural “-s” on ends of words. (describing areacentered on China and including southeast Asia)
6) Broken English. (identical comment from another respondent for Asia;2 other respondents include this as part of a longer answer)
Respondents are very strikingly in agreement with (1) and (2) above thatChinese English is spoken quickly; all 14 respondents who mention speedagree on this. Likewise, all 18 who comment on smoothness/fluency agreewith (3) and (4) that Chinese English is “choppy” (eight use this exact word,plus one describes it as “chopped up”). The comments by seven respondentsthat describe Chinese English grammar as missing unimportant words maywell be referring with greater linguistic specificity to the same perceivedfeature as the “choppy” comments, as five of the seven mention both“choppiness” and “missing words”, although these are mentioned separately.Where the “missing words” are more specifically described, they are verbs;still more explicitly, they appear to refer to the copula: “linking verbs” and“is, are, and other small words”.
In terms of pronunciation, respondents chiefly focus on the pronunciationof /r/ and /l/ (eight respondents). Perceptions of pronunciation may alsocontribute to the “choppy” image, as two respondents mention specific soundsin tandem with a “choppy” impression: “words are short and cut off . . . lotsof a i e e sounds” and “choppy short sounds, often forget the last consonantsound” (the latter also mentions missing “linking verbs”).
Like example (5) above, all of the comments on clarity and compre-hensibility describe Chinese English as in some way unclear or difficult tounderstand. Interestingly, (2) above even goes to the extreme of wonder-ing how Chinese people can understand each other. Half of the twelverespondents do not comment explicitly on difficulty of understanding butdo describe the variety as “slurred, blurry”, “not enunciated”, or “heavilyaccented”.
Some of the global evaluations are a bit more ambivalent, however. Whileseven respondents describe Chinese or Asians as speaking “broken”, “poor”,or “little English”, others acknowledge that some speak English well.One uses “very broken” together with “not bad” and goes on to explain thatspeakers sometimes pause in the middle of sentences, apparently acomparatively benign definition of “broken”. Another respondent notes that“people from the Far East usually speak more standard English than nativespeakers of English”, the only positive comment lacking ambivalence. Twoothers suggest variation in how well Chinese students speak English.

© Blackwell Publishing Ltd. 2005
Who speaks “broken English”? w 201
IndiaIndia was described together with China by four respondents but was usuallydescribed as a separate speech area, even if this speech area was strikinglysimilar to China. In general, descriptions of Indian English showed lessagreement among respondents than did descriptions of Chinese English, insome cases because even comments of the same general type referred todifferent aspects of the variety, and in some cases because comments on thesame aspect disagreed.
7) The few people I’ve met who were raised in India seem to speak“precisely”. Maybe it has something to do with the “British” English soto me it sounds more enunciated b/c that’s the way British English alsosounds to me.
8) English from here is very pronounced and seems clear/is spoken slowly.9) Speak fast and not always clear; most would not be able to speak proper
English unless educated in the language; lack proper sentence structureand only able to converse basically versus in depth. (describing theMiddle East with India)
10) Very hard to understand. Not enunciated clearly enough. (describingthe Middle East with India)
11) Speak choppy English – associated w/kwicky marts.12) I can’t understand I believe, these people speak English. Any Indian
(Indonesian?) professor I’ve had could barely pernounce English so Idropped their courses.
Respondents more often named a variety associated with India orcompared it with other varieties than they did with a variety associated withChina. The different labels and comparisons suggest two different frameworksfor understanding Indian English, perhaps explaining some of the otherdisagreements: seven respondents associate it with British English, whereasthree associate it with “kwicky marts”, a reference to the US animatedtelevision show The Simpsons, in which an Indian character owns aconvenience store by that name. While the few respondents who make thelatter association do not necessarily make overtly negative comments aboutIndian English, none of them describe it positively. In contrast, those whoassociate it with British English either describe it positively or neutrally.Interestingly, one additional respondent mentions both labels: “Althoughthis is a stereotype, we hear a lot about Indian speakers of English havingthe ‘Welcome to Dairy Queen’ accent. They are taught British English inschool & I guess this is why we like to make fun.” She also wrote that sheenjoyed British English, suggesting that perhaps it is not British English perse but the use of British English by Indian speakers that is made fun of.
The respondent in (7) associates Indian English with British English whiledescribing both as “precise” and “more enunciated”, an association madeless explicitly by another respondent who also mentions a British accent and
202 w Stephanie Lindemann
© Blackwell Publishing Ltd. 2005
greater enunciation; the respondent in (8) appears to agree with the ideaabout the clarity of pronunciation. However, four respondents use oppositeor near-opposite descriptors such as “more swallowed” and “run together”.The respondents in both (9) and (10), unlike the three respondents whofound Indian English to be clearly enunciated, describe Indian Englishtogether with the Middle East, although the other two describe India only.The four remaining comments on clarity and comprehensibility are mostlymore negative, including the rather extreme example (12) where therespondent is very negative about the English although not sure of the countryshe is describing.
Global evaluations of English spoken by Indians are also mixed. Fiveappear to be completely positive: one goes so far as to describe it as “eloquent”(this is a respondent who also describes it as “British English”), and othersdescribe it as “nice”, “well spoken”, or “fairly good English surprisinglywell” (this last is describing India and the Middle East). Just one gives onlya negative global evaluation, “very broken English”, while four others suggestvariety in how well Indians speak English.
MexicoRespondents frequently provided a name for the English of Mexico,including “Spanish” or “Spanish-like” (11 respondents), “Mexican English”(4 respondents), and “Spanglish” (2 responses); one labeled an area aroundthe US–Mexico border as “Tex-Mex ‘English’”. Six sample descriptions aregiven in their entirety in (13)–(18):
13) Mexican English seems less Romantic than Spanish English is someways.They over stress eee sounds. They don’t say “R” sounds strongly.
14) Mexicans tend to speak faster than what I think is normal and they alsotrill their tongues.
15) Fast.16) Slow.17) Most Mexicans speak English well, but have a strong Spanish accent.18) I would say that the Mexicans speak “sloppy” English, partly because
some only know phrases + no grammatical formations, but when theytalk it just sounds sloppy to me!
While some respondents directly contradict others, there appear to be anumber of commonalities in descriptions of areas including Mexico. In termsof pronunciation of specific phones, seven respondents refer to pronunciationof /r/. Six respondents describe vowels or a particular vowel as stressed,long, “more full-bodied”, or “dominant”.
The majority (11/18) of respondents who comment on the speed ofMexican English describe it as fast, but five describe it as slow. Tworespondents suggest that perhaps the perceived problem is that the speed isjust wrong; as one puts it, speakers “Talk either very quickly or very slowly”.
© Blackwell Publishing Ltd. 2005
Who speaks “broken English”? w 203
Many comments on clarity and global evaluations have a modified-positive or mixed orientation, as in example (17). Six other comments onclarity are neutral or mixed, such as “English is decent – understandable butdefinitely short of fluent” (a full description the respondent used for severalcountries, including Mexico, Central and South America, Russia and EasternEurope, West Africa, and Saudi Arabia). Six others describe the English ofthe area as unclear or difficult to understand, although one of these qualifiesthe difficult-to-understand claim by adding “if they don’t speak English well”.
While four respondents describe the English of Mexico as “brokenEnglish”, one who writes “Perhaps slightly broken English?” again suggestsa somewhat less harsh evaluation of Mexican compared to Chinese English,consistent with the higher ratings of Mexican English on the country-ratingtask. However, three do describe it as “sloppy”, “lazy sounding”, or not“respectable” (the respondent also puts this word in quotation marks). Othersdescribe it as “less formal” or “less Romantic than Spanish English”. Fiveuse neutral or qualified positive statements as discussed above with theclarity comments, and one simply notes that it differs “from person to person”(this respondent mentions having been to Mexico).
RussiaThe English of Russia, the remaining country that garnered a comparablenumber of comments, was, like China, India, and Mexico, not highly ratedon correctness, although it was rated especially negatively on pleasant andfriendly. It also has the largest number of global evaluation comments, manyof which appear to be relevant to the low pleasant and friendly ratings. Thesample descriptions below focus on those that mention clarity/compre-hensibility and global evaluations, by far the most common comment types.
19) Russia: sounds “slurred”, have thick accents even once they learn a lotof English.
20) Very thick accent, hard to understand, but most have English as 2ndlanguage; hard to get point across b/c most Americans would notunderstand what they were saying with such a thick accent.
21) Germany & Russia: harsh, broken, hard.22) E. Europe & Russia: more gutteral sounding.23) Russia: language sounds very forceful and damaging to the throat. The
words seem to come directly from the throat.24) Hard sounds, very throat-like, tough. (Russia and Germany indicated)
Most respondents (10/14) who address the issue of clarity describe a lackof it. Only one describes it as “well-articulated”; the other three are moreneutral: “accented”, “English with an accent”, and (referring to a friend)“she has a definite Russian accent”.
Similarly, global evaluations are chiefly negative, although the respondentdescribing her Russian friend continued her comment with “her English
204 w Stephanie Lindemann
© Blackwell Publishing Ltd. 2005
is very good”. The only other evaluation which could be positive is“proper sounding”. A few other evaluations are neutral to good, such as“speak okay” (2 respondents). Five respondents describe Russian Englishas “broken”, and three refer to English as a “struggle” or a “hard time” forRussian speakers.
Particularly noticeable among the descriptors of Russian English are thoseexemplified in (21)–(24), which describe it as harsh and guttural. Thirteencomments fit this mold, plus one describes Russian as “very masculine” –stereotypically consistent with the other thirteen, although “masculine” iscertainly associated with other qualities as well. These descriptors were codedas global evaluation/description, which accounts for the large number ofglobal comments for Russian English.
GermanyTurning to Germany, we find that, as with India, respondents appear tohave two key frameworks for understanding German English. One focuseson Germany as part of Western Europe and is associated with positiveevaluations of German English and probably its high rating for correctness.The other appears to separate German-influenced varieties of English fromthose influenced by Romance languages of Western Europe, with descriptionsmore in line with those of Russian English. We have seen examples of thislatter association in examples (21) and (24), where German and RussianEnglish were described together. Examples of both associations can be seenin (25)–(30).
25) When those people talk they speak like they’re angry or fighting.26) German “Slavic” accent hard – English.27) Central Europe → very much invaded by accents. It is hard for them
(more so than Indians) to articulate “th”, and “o” (changing to “au”)sounds. Rough sentence structure if not fluent.
28) Very sophisticated, nice English w/French accent (sexy). (describing allof Europe)
29) Western Europe in general: The language of business is English so forthe most part these folks have no problem and it sounds close to normal.
30) Well.
Examples (25)–(27) are consistent with the “Russian” orientation of (21)and (24), as are eight further descriptions of German English as “harsh”,“gruff”, or “guttural”. Of the more positive global evaluations exemplifiedin (28)–(30), only (30) describes Germany by itself; the four others all describeit as part of a larger speech area, usually either Western Europe or Europe.
The only other comment type commonly made in reference to Germanywas descriptions of specific sounds. Three respondents mention difficultieswith “th” sounds, three describe /w/ pronounced as /v/, two mention /r/pronounced as /w/, and two mention “o” sounds.
© Blackwell Publishing Ltd. 2005
Who speaks “broken English”? w 205
FranceExamples (28) and (29), as well as two of the other four positive globalevaluations for Germany, are applied to France and Italy as well as Germany.The remaining global evaluations assigned to France, a subset of which areshown in (31)–(36), suggest another set of competing frameworks forunderstanding French English.
31) Say words very poetic, sweet.32) France: Their English sounds “prettier”/more romantic/nicer.33) France, Italy: rough, yet clear, nice sounding.34) Most French people don’t want to speak English, and when they do, it
blends with their French.35) Always come across as pompous and think they are too good for English.
It [learning English] is demeaning to French speakers.36) Speak arrogant, romantic.
As can be seen in these examples, many of the global commentsabout France in particular are very positive, making reference to “poetic”or “more romantic” language; another specifically describes it in contrastto this view as not romantic but “more feminine”. However, (34) and (35)suggest that the French can also be seen as arrogant and unwilling to speakEnglish; (36) is particularly interesting in that it combines both of theseperspectives.
ItalyRespondents show more agreement on Italy, the most highly rated ofcountries with primarily non-native speakers of English. Examples (37)–(42)show most of the types of comments made about Italy.
37) I think that Italians have an “Italian” accent when they speak English.They still use the same fluency + stresses on the English words.
38) Add “a” to end of words.39) Italy: “sing song” melody to phrase structure.40) Lots of emotion.41) Accents are easily recognizable; many speakers are quite bilingual, but
accent still shows. (points to Italy & Greece, each circled)42) Associated w/mafia, “youz guys” “fuhget about it”.
The comparatively large number of people who name or compare Englishspoken by people from Italy tend to simply refer to an Italian accent, as in(37), although two compare it to Spanish and one to “the Hispanics”.Comments on stress and intonation take three (probably related) forms: usingItalian stress on English words (two respondents); adding vowels, especially“a”, to the end of words (four respondents); and “sing song” or “musical”intonation (three respondents).
206 w Stephanie Lindemann
© Blackwell Publishing Ltd. 2005
Global evaluations of Italian English are chiefly positive. Unique to Italyand likely to be related to its high ratings for friendliness are the descriptionswhich refer ambiguously to speakers or their language as involving “lots ofemotion” or “always smiling”. Three comments describe Italian English asokay or good with a noticeable accent. Others describe it as “eloquent”,“nice sounding” (along with France, example 33), or “sophisticated . . . sexy”(along with the rest of Europe, example 28). The only (probably) negativecomment about Italy itself that was unmitigated, in example (42), appears torefer to a second- or higher-generation northeast US urban population ratherthan the students from Italy that respondents were asked to imagine.
Discussion
Although respondents were initially asked to describe various Englishes,they tended to interpret this as a request to evaluate them, as did Preston’s(1986) respondents describing US varieties. The classification of varieties byhow “good” they are in some cases leads to rather undifferentiated categoriesof “good” and “bad” non-native speech. The respondents’ focus on evaluationis also relevant to the salience of varieties, as the most salient non-nativespeech appeared to be negatively evaluated. While respondents some-times describe specific sounds they like, they describe what non-nativespeakers do “wrong” in greater detail. Mexico and China were describedas getting the most “wrong”; they were described the most often and inthe most detail. The salience of these two countries and the larger areasthey are perceived as representing is most likely related to their largeimmigrant populations in the US, a connection that has been suggested byLippi-Green (1997). Areas rated highly on correctness (France, Italy, Germany)as well as less familiar negatively rated areas (India, Russia) garnered fewerand less detailed comments. The areas rated highly on correctness have notproduced large numbers of immigrants recently; it is noteworthy that theone negative description of Italian English appeared to refer to (second- orhigher-generation) immigrants rather than temporary visitors or studentsfrom Italy.
The relationship between negative evaluation and salience parallelsPreston’s (e.g. 1996, 1999) findings for assessments of native US dialects, inwhich the salience of a largely undifferentiated “Southern” dialect wascorrelated with its perceived incorrectness. On the other hand, in the currentstudy the most negatively rated countries tended to be rated as veryunfamiliar and were not described at all, suggesting a less linear relationshipbetween stigma and salience than that found by Preston for native varieties.Here it appears that a total lack of familiarity allowed respondents to makeevaluations based completely on stereotypes, as they lacked access tocounterexamples that could neutralize or soften them. They were less likelyto comment unless specifically asked about those countries, however.

© Blackwell Publishing Ltd. 2005
Who speaks “broken English”? w 207
These US listeners appear to have multiple overlapping categories forevaluations of non-native English, schematized in Figure 1. The thicker linesin Figure 1 show the strongest associations respondents make. The nativeand non-native branches are thus both represented with thick lines sincethey are both salient categories; native/non-native may be the only distinctionmany respondents would be able to make reliably if they actually heard thevarieties in question.
The largest category within non-native English, and for some respondentsperhaps the only category, is a general one of stigmatized non-native English.Such a salient, negatively evaluated category would be consistent withfindings from a verbal guise study in which listeners identified negativelyevaluated Korean accents as East Asian, Indian, or Latino (Lindemann 2003).For most respondents, this stigmatized category does not include WesternEurope (the English of France and Italy were never described as “broken”),but for some it appears to apply to the rest of the world with very fewdistinctions made. This is particularly clear for the respondents who describedmost of the world in just a few groups and for those who confused varieties.
Figure 1. US listeners’ categorization of non-US English varieties. Thicker linesdenote more salient subcategories

208 w Stephanie Lindemann
© Blackwell Publishing Ltd. 2005
Some comparisons and classifications also point to undifferentiated groupings,especially the comparison of China and Japan to Mexico and the classificationof the Middle East and India together. Further evidence of this salientstigmatized non-native English category can be seen in the many referencesto simply “heavy accents” and “broken English”. These and many other lessovertly evaluative comments (e.g. “speaks fast”) were sufficiently unspecificthat some comments were similar for very different areas, suggesting animplicit general category even where varieties were separately describedand not explicitly compared.
Most respondents, including those who appeared to have a “stigmat-ized non-native English” category, appeared to have a European or WesternEuropean category, although the countries included varied somewhat.Apparently no country was seen as representing the whole category; typically,either respondents described all or a large part of Europe or else theydescribed multiple individual countries. France, Italy, and Spain wereprototypical members, all evaluated highly on correct, pleasant, and friendlyand described in non-stigmatized and in some cases even prestigious terms.German English, rated highly on correctness, was also sometimes included,although some respondents described it as harsh and guttural, categorizingit with Russian English as “Slavic”. Friendly and pleasant ratings for Germanyhad the highest standard deviations for any country (2.6), giving additionalevidence of two conflicting categorizations rather than a more agreed-upon,moderately negative evaluation.
The most salient sub-categories of stigmatized non-native English wereEast Asian or “Chinese” English and Latin American or “Mexican” English.Respondents agreed that speakers from East Asia speak quickly and choppily,confuse /r/ and /l/, leave out words, enunciate poorly, and are hard tounderstand. Much of this description (quick, choppy, poorly enunciated,hard to understand) was often applied to India as well, but some respondentsassociated Indian English with convenience stores while others saw it as amore positively evaluated, British-influenced variety. Latin American Englishwas evaluated somewhat less negatively than East Asian English, althoughit was seen as more casual and less prestigious than the English from Spain.Respondents described speakers from this area as speaking at a differentspeed than typical native US English speakers, usually faster, trilling /r/ orpronouncing it differently, and stressing vowels.
These findings suggest a more complex set of relevant factors than hastypically been proposed to account for reactions to speakers of differentvarieties. Neither patterns of immigration (Lippi-Green 1997) nor in-group/out-group and dominant/subordinate contrasts (Ryan, Giles and Sebastian1982) can individually explain the full range of results, specifically the multiplelayers of evaluation. However, these factors appear to apply in combinationwith each other and with other factors. As Lippi-Green (1997) has suggested,the most salient groups are those which include the largest numbers ofrecent immigrants to the US: Latin Americans and East Asians. On the other

© Blackwell Publishing Ltd. 2005
Who speaks “broken English”? w 209
hand, an explanation based on immigration figures alone might lead us toexpect the most negative evaluations of Latin American English, especiallyMexican English, since US Census data (Schmidley 2001) suggest that LatinAmericans account for approximately half of all the foreign-born people inthe US (Mexicans accounting for half of these), with Asians as the nextlargest group, accounting for a quarter of those born outside the US. Itappears that while negative evaluation is connected with salience, and saliencewith immigration demographics, the most negatively evaluated varieties arenot necessarily the most salient, as discussed above.
A number of explanations are possible for the more negative evaluationsof Asian English in comparison to Latin American English. One is that whileall non-native speakers may be considered out-group in comparison to nativespeakers, when non-native varieties are considered together, Latin Americanspeakers are in-group compared to the Asian speakers. In fact, descriptionsof Latin American English as “more casual” English corresponds somewhatto descriptions of Southern US English, which may be rated highly onfriendliness if not correctness (Preston 1999). Asians, on the other hand, maybe perceived as exhibiting greater cultural, linguistic, or even physicaldifferences. Such a “comparative in-group-ness” factor was found by Abramsand Hogg (1987) for native varieties of English in Scotland: respondentsfrom Dundee preferred their own dialect to that of Glasgow but preferredboth their own and the Glasgow dialects to RP.
The more negative evaluations of Asian English may also stem fromexperiences that are more particular to the group investigated here. Forexample, for the college students surveyed in this study, experiences withnon-native teaching assistants may be especially relevant. East Asians maybe particularly likely to be teaching assistants in required difficult courses,and Orth (1982, cited in Rubin 1992) found a relationship between the gradesstudents expected and their assessment of the instructor’s English. Thus,respondents may be more likely to rate the English of East Asians negativelybecause they have done poorly in classes taught by them.
Reactions to the less salient negatively evaluated groups are probablybased on images of these groups in the popular media, since respondentsare likely to have fewer first-hand experiences with them. For example, mostrespondents are unlikely to know anyone at all from Iraq; they may associate itonly with Saddam Hussein. Although English varieties from Russia, Germany,and India are probably more familiar to respondents, reactions to thesevarieties also appear to be influenced by media images. Respondents describ-ing India in some cases made references to a popular TV show character,and more general media images of TV and movie “bad guys” are hypothes-ized to be relevant to evaluations of Russian English and German English.
The various categories of non-native English are of interest for verbalguise research, in which both non-native speech and stigmatized native speechhave been compared to non-stigmatized native dialects. In such research,non-native varieties are often treated as another non-standard variety, but
210 w Stephanie Lindemann
© Blackwell Publishing Ltd. 2005
the current findings suggest that there may be qualitative differences betweennon-native and non-standard. As Wolfram and Schilling-Estes (1998) havenoted, US English has no real prestigious varieties, only stigmatized andnon-stigmatized ones. A few prestige-oriented descriptors such as “eloquent”used by respondents in the current study suggest that at least some USEnglish speakers may consider some non-native varieties to be prestigious.Even if they are not seen as prestige varieties, varieties of English spoken byWestern Europeans tended to be viewed more positively than stigmatizednative US dialects.
Another difference between stigmatized native dialects and non-nativeEnglish is the lesser degree of familiarity with non-native varieties, whichappears to be related to the looser connection between salience and perceivedincorrectness. It may also result in different evaluations of a variety and therelevance of different explanatory ideologies depending on whether a voicesample or variety label is provided. A comparison of reactions to voicesamples and to variety labels would illuminate the relationship between thecategories used in identifying varieties and reactions to those varieties.
Addressing language discrimination
The patterns of responses based on familiarity, immigration trends, andsociopolitical relationships (especially as portrayed in the popular media)suggest what expectations these US undergraduates are likely to have ofnon-native English speakers from all over the world. Of course, theseexpectations may play out in different ways: the belief that someone is froma particular part of the world may trigger the perception of a “foreign”accent where none exists (Rubin 1992), or such a belief may lead to a positiveevaluation because the speaker’s English is better than expected (Brown1992). While further research is needed into how expectations translate intoevaluations of actual speakers, knowledge about the expectations themselvesis an important step towards addressing language discrimination in severalways. For example, educating the public about the close ties betweensociopolitical relationships and expectations about English helps bring tolight the prejudicial nature of such expectations, while knowledge aboutgeneral linguistic biases may provide important background information foraddressing specific cases of possible discrimination.
The lack of specificity in respondents’ classifications, descriptions, andevaluations of non-native English also has clear implications for addressinglanguage prejudice, as many undergraduate respondents describe most(hypothetical) international students’ non-native English as simply “broken”or “bad”. On the other hand, further investigation of folk linguistic ways ofdescribing and understanding non-native speech is clearly needed. While“broken” is typically taken as a generic, very negative evaluation, for somerespondents it appeared to be somewhat less negative and was used to refer
© Blackwell Publishing Ltd. 2005
Who speaks “broken English”? w 211
to specific features, such as frequent pauses or possibly copula omission. Adescription of speech as “broken English” thus need not automatically betaken as an indication that the describer believes the speaker’s English isinadequate. Likewise, terms such as “accented” may have different meaningsfor different respondents. Other general terms such as “choppy”, often usedto describe Asian-accented English, can give an idea of what featuresrespondents are most likely to react negatively to, such as final consonantomission, which can be tested later in an experimental study and used toinform pronunciation teaching.
Finally, further study is needed to discover how the biases of these collegestudents compare to those of other populations, and the degree to whichthey apply to different non-native speaker groups. Respondents were askedto describe the English of international students, whom we might expect tohave higher proficiency than the more general immigrant population.However, it was not always clear that respondents were imagining students.This suggests both a possible type of bias (non-native speakers may nottypically be imagined as college students) and an area for further study.
Notes
1. Thanks to Gyl Mattioli and Sara Plowman for their assistance collecting andcoding the data, and to Lesley Milroy, Dennis Preston, Barbara Seidlhofer, LeivEgil Breivik, Jean Hannah, Guiling Hu, and an anonymous reviewer for theirhelpful comments.
2. These descriptors have been used in previous studies (e.g. Preston 1996, 1999).Both friendly and pleasant were used here, as differences have been found betweenratings of friendly and a descriptor similar to pleasant (‘nice to listen to’) for KoreanEnglish (Lindemann 2003).
References
Abrams, D. and M.A. Hogg (1987) Language attitudes, frames of reference, andsocial identity: a Scottish dimension. Language and Social Psychology 6: 201–13.
Alfaraz, G.G. (2002) Miami Cuban perceptions of varieties of Spanish. In D.R. Preston(ed.), Handbook of perceptual dialectology. Amsterdam: John Benjamins. 1–11.
Brown, K. (1992) American college student attitudes toward non-native instructors.Multilingua 11: 249–65.
Cargile, A.C. (1997) Attitudes toward Chinese-accented speech: an investigation intwo contexts. Journal of Language and Social Psychology 16: 434–44.
— and H. Giles (1998) Language attitudes toward varieties of English: an American-Japanese context. Journal of Applied Communication Research 26: 338–56.
Giles, H. and N. Coupland (1991) Language: contexts and consequences. Pacific Grove,California: Brooks/Cole.
Gill, M.M. (1994) Accent and stereotypes: their effect on perceptions of teachers andlecture comprehension. Journal of Applied Communication Research 22: 349–61.
212 w Stephanie Lindemann
© Blackwell Publishing Ltd. 2005
Hartley, L.C. and D.R. Preston (1999) The names of US English: valley girl, cowboy,yankee, normal, nasal and ignorant. In R.J. Watts (ed.), Standard English: thewidening debate. London: Routledge. 207–38.
Lindemann, S. (2002) Listening with an attitude: a model of native-speaker comprehen-sion of non-native speakers in the United States. Language in Society 31: 419–41.
— (2003) Koreans, Chinese, or Indians? Attitudes and ideologies about non-nativeEnglish speakers in the United States. Journal of Sociolinguistics 7: 348–64.
— (in press) What the other half gives: the interlocutor’s role in non-native speakerperformance. In R. Hughes (ed.), Spoken English, TESOL and applied linguistics:challenges for theory and practice. Palgrave Macmillan.
Lippi-Green, R. (1997) English with an accent: language, ideology, and discrimination inthe United States. New York: Routledge.
Mulac, A., T.D. Hanley and D.Y. Prigge (1974) Effects of phonological speechforeignness upon three dimensions of attitude of selected American listeners.Quarterly Journal of Speech 60: 411–20.
Niedzielski, N. and D.R. Preston (2003) Folk linguistics. Berlin/New York: Mouton deGruyter.
Preston, D.R. (1986) Five visions of America. Language in Society 15: 221–40.— (1996) Where the worst English is spoken. In E.W. Schneider (ed.), Focus on the
USA. Amsterdam/Philadelphia: John Benjamins. 297–361.— (1999) A language attitude analysis of regional US speech: is northern US English
not friendly enough? Cuadernos de Filología Inglesa 8: 129–46.Rubin, D.L. (1992) Nonlanguage factors affecting undergraduates’ judgments of
non-native English-speaking teaching assistants. Research in Higher Education 33:511–31.
Ryan, E.B. and C.M. Bulik (1982) Evaluations of middle class and lower class speakersof standard American and German-accented English. Journal of Language and SocialPsychology 1: 51–61.
— , M.A. Carranza and R.W. Moffie (1977) Reactions toward varying degreesof accentedness in the speech of Spanish–English bilinguals. Language and Speech20: 267–73.
— , H. Giles and R.J. Sebastian (1982) An integrative perspective for the study ofattitudes toward language variation. In H. Giles (ed.), Attitudes towards languagevariation: social and applied contexts. London: Edward Arnold. 1–19.
Schmidley, A.D. (2001) Profile of the foreign born population in the United States: 2000.[US Census Bureau, Current Population Reports, Series P23–206.] Washington,DC: US Government Printing Office.
Wolfram, W. and N. Schilling-Estes (1998) American English. Oxford, UK and Malden,MA: Blackwell.
[Received 11/7/04; revised 14/2/05]
Stephanie LindemannDepartment of Applied Linguistics and ESLGeorgia State UniversityP.O. Box 4099Atlanta, GA 30302-4099USAe-mail: [email protected]
