who suffers during recessions? an analysis of the united ... · who suffers during recessions? an...
TRANSCRIPT

Who Suffers During Recessions? An Analysis of the United States in the Great Recession
Hilary Hoynes, University of California, Berkeley
Overview• The Great Recession generated large reductions in
employment; the recovery has been slow and weak.• We comprehensively analyze how business cycles affect
labor market outcomes in the U.S. We ask two questions:– How do cycles affect outcomes across age, education,
race/ethnicity and gender groups?– Are the across group differences in the Great Recession different
from prior recessions?
• We find that there are significant differences across groups and those patterns are persistent over time.
• My talk is based on joint work:– Hilary Hoynes, Doug Miller and Jessamyn Schaller
“Who Suffers in Recessions,” Journal of Economic Perspectives, 2012 (extended using data through 2013)
– Marianne Bitler and Hilary Hoynes “The More Things Change the More They Stay the Same? The Safety Net and Poverty in the Great Recession,” forthcoming Journal of Labor Economics.
Data
• Our primary measure of the cycle is the unemployment rate (seasonally adjusted, monthly)
• Monthly data from the CPS Outgoing Rotation Group from 1979-2013, ages 16-60.
• Annual data from March CPS (for poverty rates)
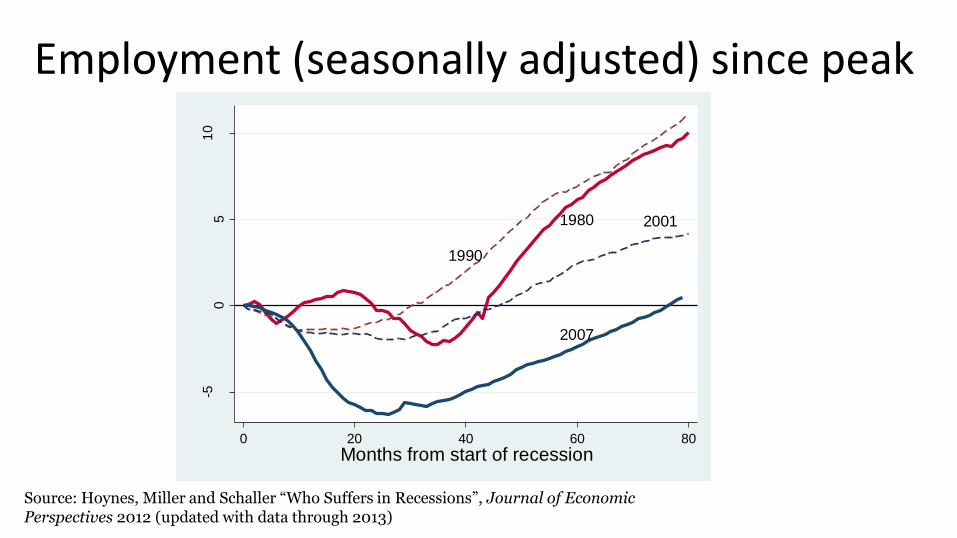
Employment (seasonally adjusted) since peak
Source: Hoynes, Miller and Schaller “Who Suffers in Recessions”, Journal of Economic Perspectives 2012 (updated with data through 2013)
1980
1990
2001
2007
-50
51
0
Perc
en
t cha
ng
e s
ince s
tart
of re
cessio
n
0 20 40 60 80
Months from start of recession
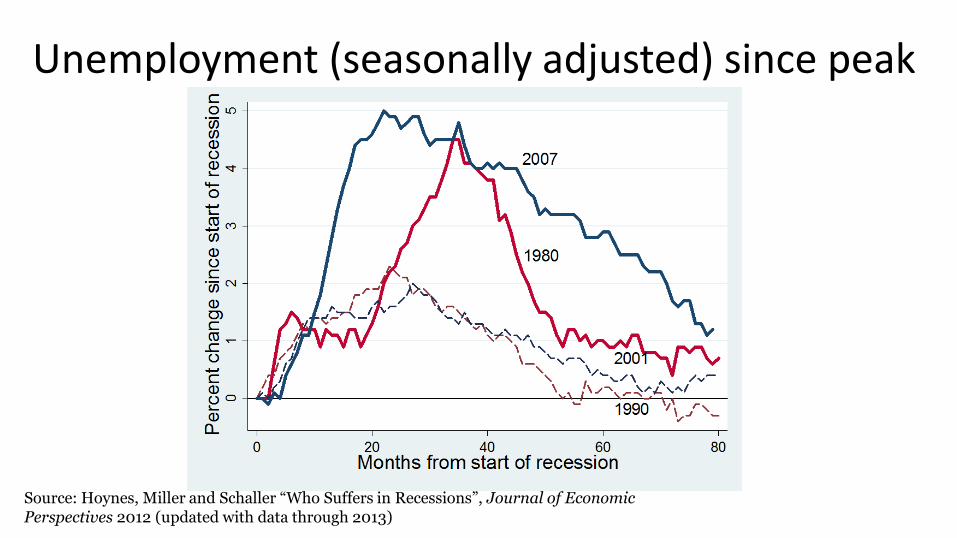
Unemployment (seasonally adjusted) since peak
Source: Hoynes, Miller and Schaller “Who Suffers in Recessions”, Journal of Economic Perspectives 2012 (updated with data through 2013)
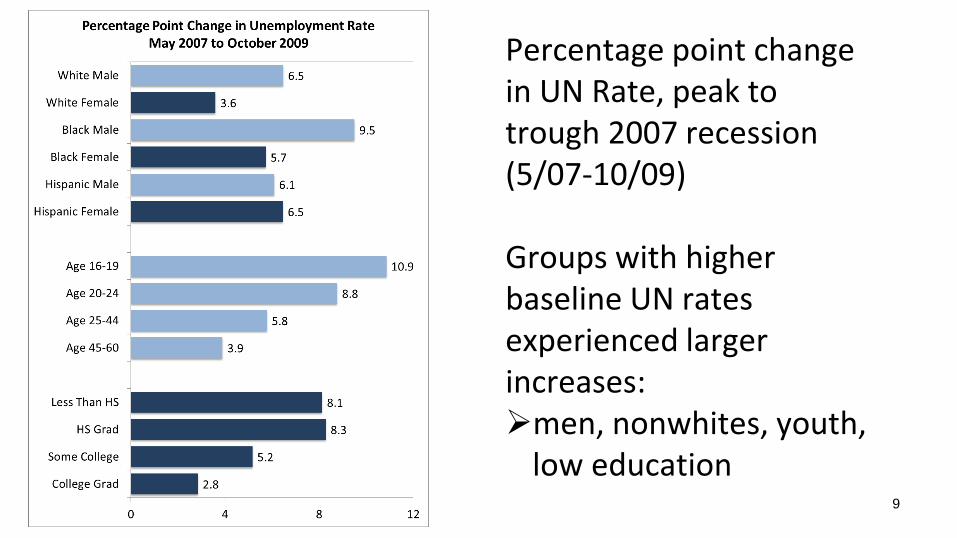
Percentage point change in UN Rate, peak to trough 2007 recession (5/07-10/09)
Groups with higher baseline UN rates experienced larger increases:men, nonwhites, youth,
low education9
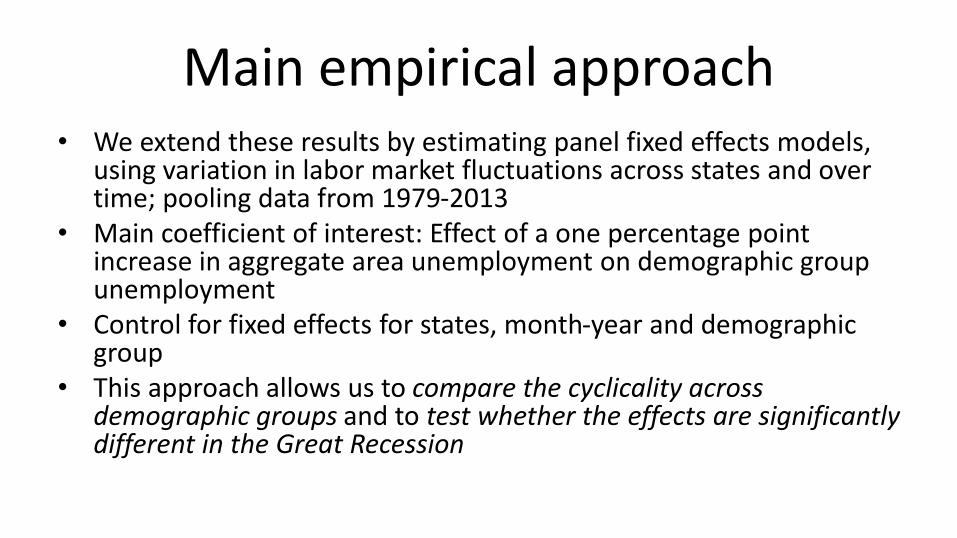
Main empirical approach• We extend these results by estimating panel fixed effects models,
using variation in labor market fluctuations across states and over time; pooling data from 1979-2013
• Main coefficient of interest: Effect of a one percentage point increase in aggregate area unemployment on demographic group unemployment
• Control for fixed effects for states, month-year and demographic group
• This approach allows us to compare the cyclicality across demographic groups and to test whether the effects are significantly different in the Great Recession
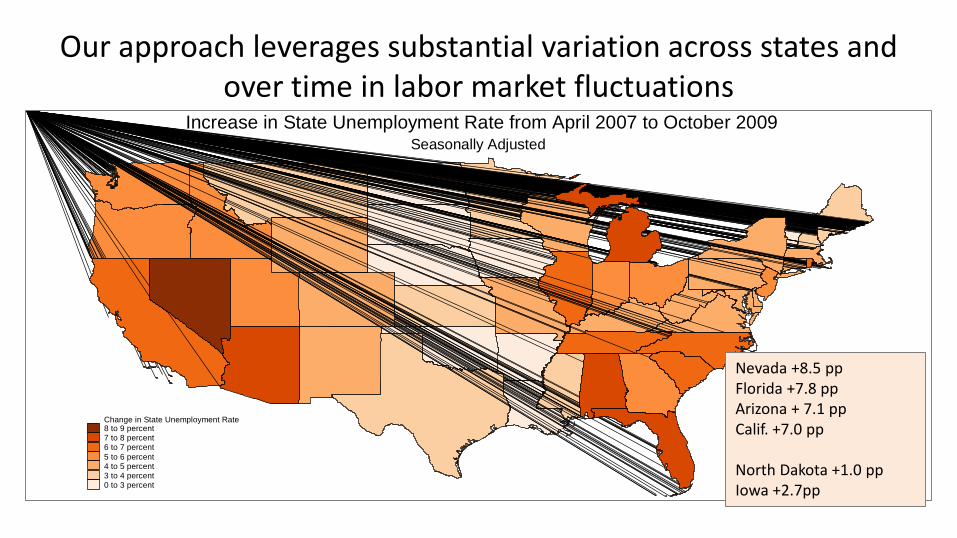
Change in State Unemployment Rate8 to 9 percent7 to 8 percent6 to 7 percent
5 to 6 percent4 to 5 percent3 to 4 percent0 to 3 percent
Seasonally Adjusted
Increase in State Unemployment Rate from April 2007 to October 2009
Our approach leverages substantial variation across states and over time in labor market fluctuations
Nevada +8.5 ppFlorida +7.8 ppArizona + 7.1 ppCalif. +7.0 pp
North Dakota +1.0 ppIowa +2.7pp
-0.5
0.0
0.5
1.0
1.5
2.0
2.5
3.0
3.5
16 20 25 30 35 40 45 50 55 60Age
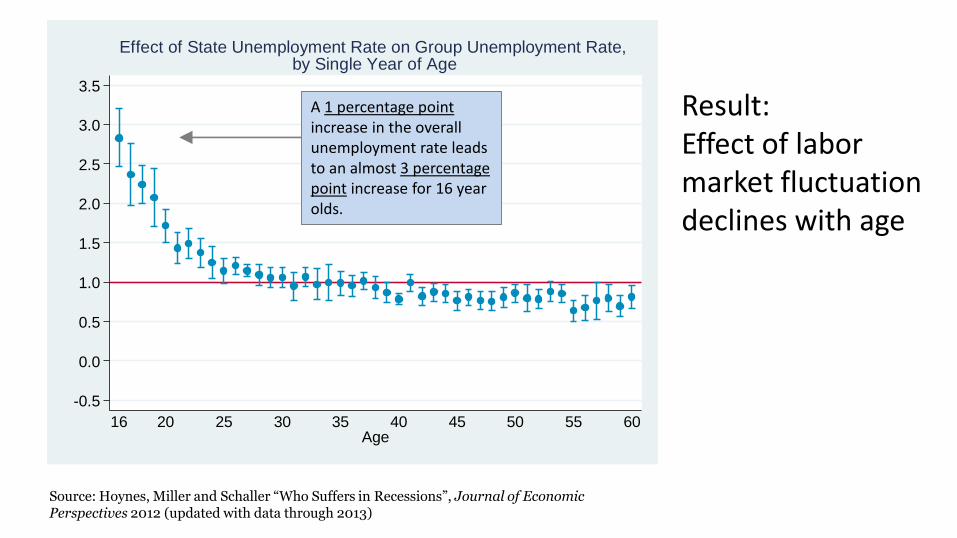
Effect of State Unemployment Rate on Group Unemployment Rate,by Single Year of Age
Source: Hoynes, Miller and Schaller “Who Suffers in Recessions”, Journal of Economic Perspectives 2012 (updated with data through 2013)
A 1 percentage pointincrease in the overall unemployment rate leads to an almost 3 percentage point increase for 16 year olds.
Result:Effect of labor market fluctuation declines with age
Source: Hoynes, Miller and Schaller “Who Suffers in Recessions”, Journal of Economic Perspectives 2012 (updated with data through 2013)
-0.5
0.0
0.5
1.0
1.5
2.0
2.5
WhiteMale
WhiteFemale
BlackMale
BlackFemale
HispMale
HispFemale
LessThan HS
HSGrad
SomeCol
CollegeGrad
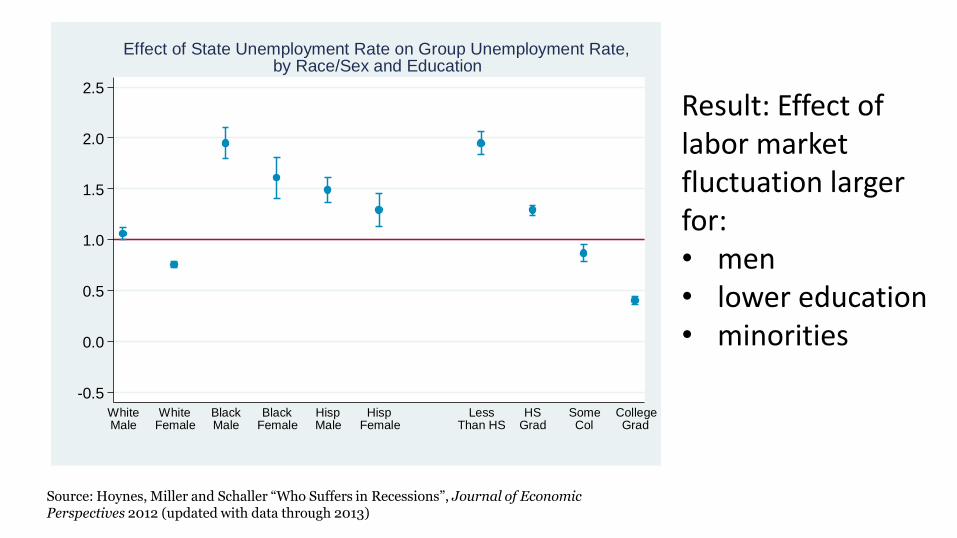
Effect of State Unemployment Rate on Group Unemployment Rate,by Race/Sex and Education
Result: Effect of labor market fluctuation larger for: • men• lower education • minorities
Summary: Impacts of cycles across groups
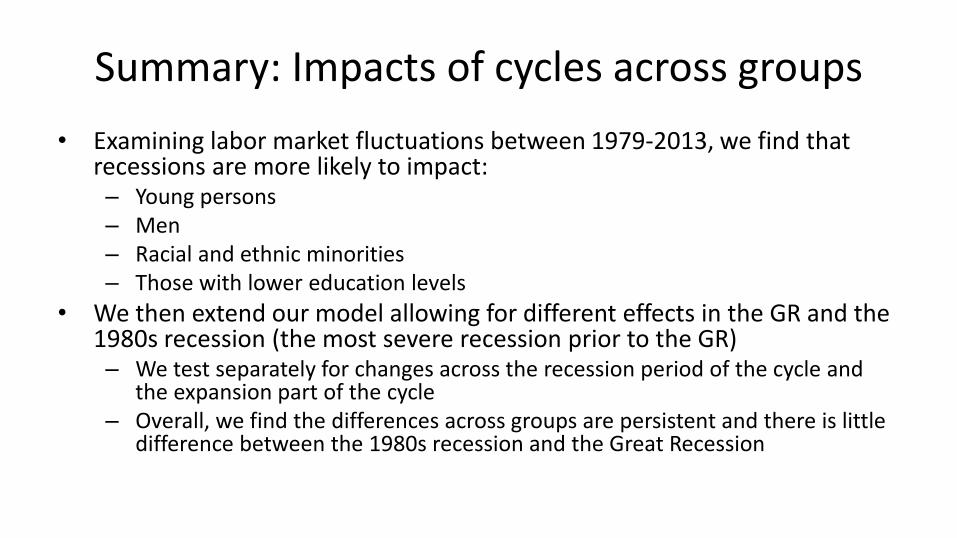
• Examining labor market fluctuations between 1979-2013, we find that recessions are more likely to impact:– Young persons– Men– Racial and ethnic minorities– Those with lower education levels
• We then extend our model allowing for different effects in the GR and the 1980s recession (the most severe recession prior to the GR)– We test separately for changes across the recession period of the cycle and
the expansion part of the cycle– Overall, we find the differences across groups are persistent and there is little
difference between the 1980s recession and the Great Recession
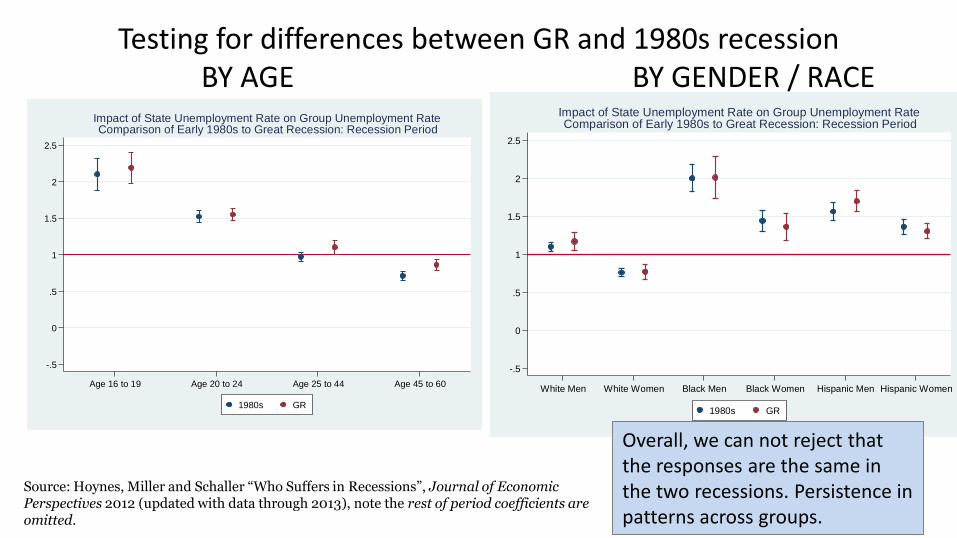
Source: Hoynes, Miller and Schaller “Who Suffers in Recessions”, Journal of Economic Perspectives 2012 (updated with data through 2013), note the rest of period coefficients are omitted.
Testing for differences between GR and 1980s recessionBY AGE BY GENDER / RACE
-.5
0
.5
1
1.5
2
2.5
Age 16 to 19 Age 20 to 24 Age 25 to 44 Age 45 to 60
1980s GR
Impact of State Unemployment Rate on Group Unemployment RateComparison of Early 1980s to Great Recession: Recession Period
-.5
0
.5
1
1.5
2
2.5
White Men White Women Black Men Black Women Hispanic Men Hispanic Women
1980s GR
Impact of State Unemployment Rate on Group Unemployment RateComparison of Early 1980s to Great Recession: Recession Period
Overall, we can not reject that the responses are the same in the two recessions. Persistence in patterns across groups.
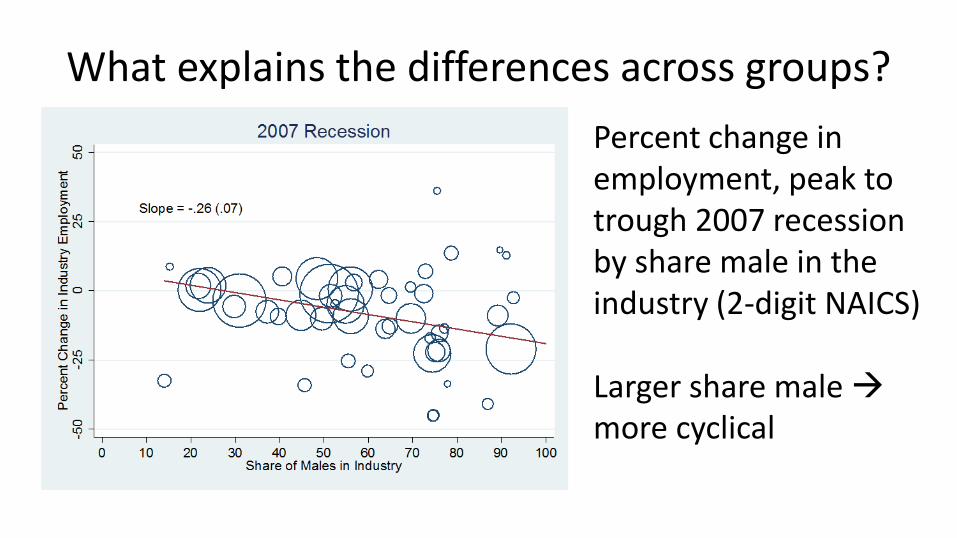
What explains the differences across groups?
Percent change in employment, peak to trough 2007 recession by share male in the industry (2-digit NAICS)
Larger share male more cyclical
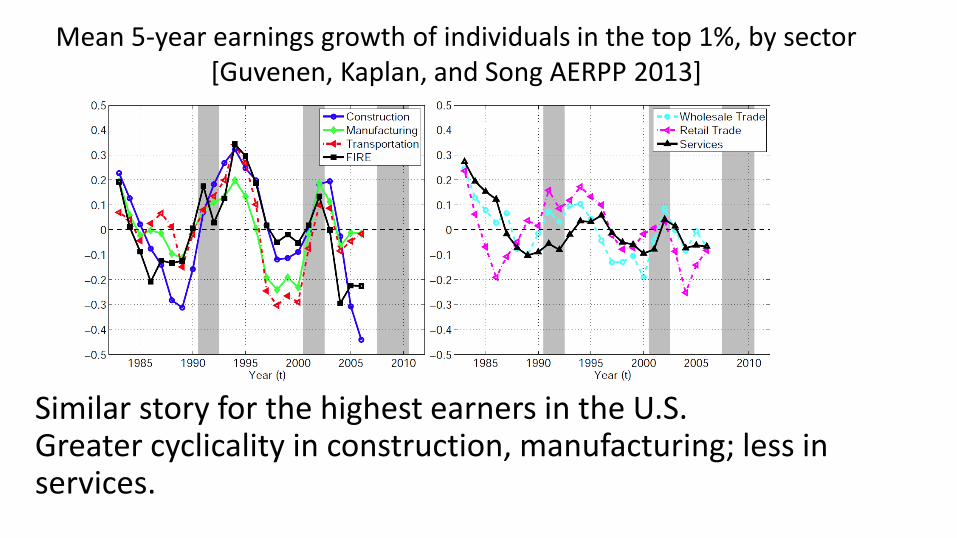
Mean 5-year earnings growth of individuals in the top 1%, by sector [Guvenen, Kaplan, and Song AERPP 2013]
Similar story for the highest earners in the U.S. Greater cyclicality in construction, manufacturing; less in services.
Extending the analysis to examine the effect of cycles on poverty
• U.S. defines poverty as an absolute measure
• A family is poor if their resources are less than the federal poverty threshold
– Poverty lines vary by family size and are adjusted for changes in prices each year
• We measure family resources comprehensively as after tax and transfer income, including the value of in-kind transfers (e.g. food stamps, housing benefits) [U.S. official poverty uses only cash resources.]
-1.0
0.0
1.0
2.0
3.0
4.0
5.0
6.0
7.0
8.0
9.0
<25%
<50%
<75%
<100
%
<125
%
<150
%
<175
%
<200
%
<225
%
<250
%
<275
%
<300
%
<325
%
<350
%
<375
%
<400
%
Alternative Poverty (post-tax, all transfers)
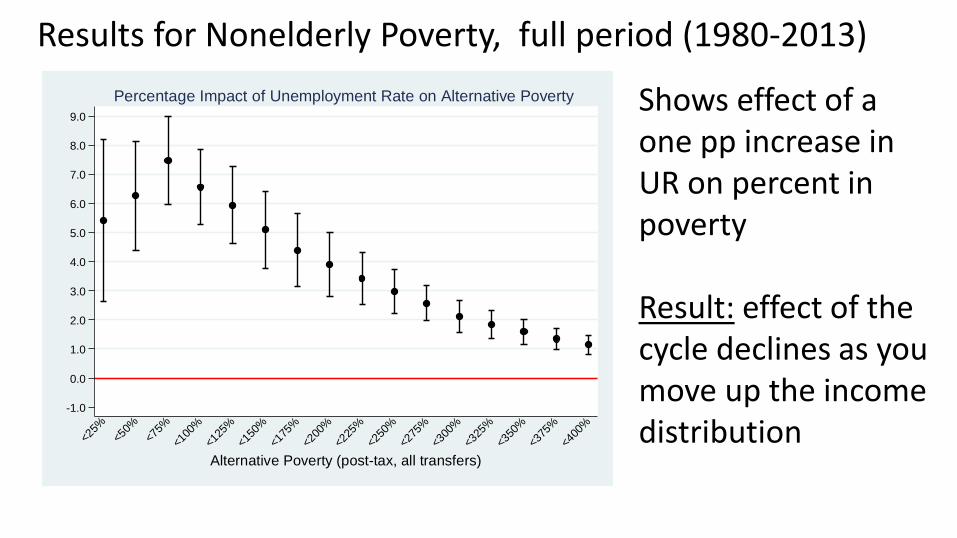
Percentage Impact of Unemployment Rate on Alternative Poverty Shows effect of a one pp increase in UR on percent in poverty
Result: effect of the cycle declines as you move up the income distribution
Results for Nonelderly Poverty, full period (1980-2013)
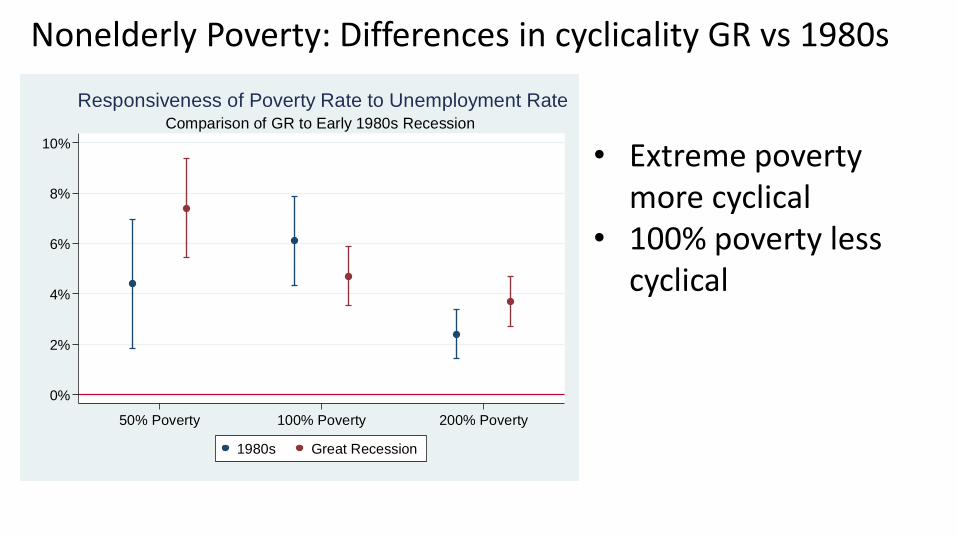
• Extreme poverty more cyclical
• 100% poverty less cyclical
0%
2%
4%
6%
8%
10%
50% Poverty 100% Poverty 200% Poverty
1980s Great Recession
Comparison of GR to Early 1980s Recession
Responsiveness of Poverty Rate to Unemployment Rate
Nonelderly Poverty: Differences in cyclicality GR vs 1980s
Summary of findings• Impacts of the Great Recession are not uniform across groups:
men, blacks, Hispanics, youth, low education groups, and the lowest income groups are more heavily affected.
• These differences across demographic groups are remarkably stable over this 30 year period, and across recessions and expansions.
• Any changes over time are small relative to the baseline differences across groups. Amazing given the changes in the economy over this period (increase in female emp, increase in Hispanics, decline of manufacturing) 21