who/bs/10.2138 english only expert committee on …
TRANSCRIPT

WHO/BS/10.2138
ENGLISH ONLY
EXPERT COMMITTEE ON BIOLOGICAL STANDARDIZATION
Geneva, 18 to 22 October 2010
Collaborative Study to Evaluate the Proposed 1st WHO International
Standard for Human Cytomegalovirus (HCMV) for Nucleic Acid
Amplification (NAT)-Based Assays
Jacqueline F. Fryer
1,3, Alan B. Heath
2, Rob Anderson
1, Philip D. Minor
1 and the
Collaborative Study Group *
1 Division of Virology and
2 Biostatistics
National Institute for Biological Standards and Control,
South Mimms, Potters Bar, Herts, EN6 3QG, UK
3 Study Coordinator; Tel +44 1707 641000, Fax +44 1707 641050,
E-mail [email protected]
* See Appendix 1
© World Health Organization 2010
All rights reserved. Publications of the World Health Organization can be obtained from WHO Press, World Health Organization, 20 Avenue Appia, 1211 Geneva 27, Switzerland (tel.: +41 22 791 3264; fax: +41 22 791 4857; e-mail: [email protected]). Requests for permission to reproduce or translate WHO publications – whether for sale or for noncommercial distribution – should be addressed to WHO Press, at the above address (fax: +41 22 791 4806; e-mail: [email protected]).
The designations employed and the presentation of the material in this publication do not imply the expression of any opinion whatsoever on the part of the World Health Organization concerning the legal status of any country, territory, city or area or of its authorities, or concerning the delimitation of its frontiers or boundaries. Dotted lines on maps represent approximate border lines for which there may not yet be full agreement. The mention of specific companies or of certain manufacturers’ products does not imply that they are endorsed or recommended by the World Health Organization in preference to others of a similar nature that are not mentioned. Errors and omissions excepted, the names of proprietary products are distinguished by initial capital letters.
All reasonable precautions have been taken by the World Health Organization to verify the information contained in this publication. However, the published material is being distributed without warranty of any kind, either expressed or implied. The responsibility for the interpretation and use of the material lies with the reader. In no event shall the World Health Organization be liable for damages arising from its use. The named authors alone are responsible for the views expressed in this publication.

WHO/BS/10.2138
Page 2
Summary This report describes the development and worldwide collaborative study evaluation of the
candidate 1st WHO International Standard for human cytomegalovirus (HCMV) for use in the
standardisation of nucleic acid amplification techniques (NAT). Proposals for the formulation of
the candidate standard were discussed at the Standardisation of Genome Amplification
Techniques (SoGAT) Clinical Diagnostics meeting at NIBSC in June 2008. The candidate is a
whole virus preparation of the HCMV Merlin strain, formulated in a universal buffer comprising
Tris-HCl and human serum albumin, and freeze-dried for long-term stability. Thirty-two
laboratories from 14 countries participated in a collaborative study to evaluate the fitness for
purpose and potency of the candidate standard using their routine NAT-based assays for HCMV.
The freeze-dried candidate standard (Sample 1) was evaluated alongside the liquid bulk of the
candidate preparation (Sample 2), a whole virus HCMV AD169 preparation (Sample 3) and
purified Merlin DNA cloned into a bacterial artificial chromosome (Sample 4). The majority of
data sets returned were from laboratory-developed quantitative assays based on real-time PCR
technology. However, a wide range of extraction and amplification methodologies were used.
The overall mean potency estimate for the candidate standard sample 1, across the different
laboratory assays, was 5×10⁶ (6.7 log10) 'copies/mL'. The variability in individual mean estimates
for whole virus samples 1-3 was 2 log10 (100-fold), however, the variability for the purified
DNA sample 4 was higher (>3 log10). The agreement between laboratories was markedly
improved when the potencies of the virus samples 2 and 3 were expressed relative to the
candidate standard (sample 1). In contrast, the agreement between laboratories for the purified
DNA sample 4 was not improved. This suggests that purified DNA that is not extracted
alongside the clinical samples is not suitable for standardising these types of assays. The overall
data returned from each laboratory indicates that there was no significant loss in potency upon
freeze-drying. In addition, the results obtained from accelerated thermal degradation studies at
four and eight months indicate that the candidate is extremely stable and suitable for long-term
use.
The results of the study indicate the suitability of the candidate HCMV Merlin standard as the
proposed 1st WHO International Standard for HCMV. It is therefore proposed that the candidate
standard (NIBSC code 09/162) be established as the 1st WHO International Standard for HCMV
with an assigned potency of 5×10⁶ International Units (IU) when reconstituted in 1 mL of
nuclease-free water.
Introduction HCMV is a ubiquitous herpesvirus with a high seroprevalence worldwide. It causes disease in
the immunologically-naïve, such as newborns and infants, and immunosuppressed individuals,
particularly transplant recipients and AIDS patients. Severe and life-threatening HCMV
infections in immunocompromised individuals are managed through the administration of anti-
herpetic agents, however, all are associated with toxicity with prolonged use.
The clinical utility of viral load measurements in the diagnosis and antiviral management of
HCMV in transplant recipients has been well documented 1,2
. Two therapeutic approaches have
evolved; prophylaxis, whereby antiviral drugs are administered for a fixed period from the time
of transplant, and pre-emptive treatment, which is administered in response to an increased risk
of CMV disease. The pre-emptive approach requires diagnosis of HCMV replication, and
initiation of antiviral therapy when a predetermined level of virus in peripheral blood is reached,
prior to the appearance of clinical symptoms. Subsequently, the levels of virus are frequently
measured in order to monitor the response to and determine the duration of treatment. Although
there is no consensus on the optimal sample type or frequency of testing, both plasma and whole
blood provide prognostic information.
WHO/BS/10.2138
Page 3
Consensus guidelines for the management of HCMV infection and disease in transplant
recipients have been published 1,3
. These recommend the use of NAT-based approaches in order
to determine viral load measurements in pre-emptive programmes for disease prevention. These
NAT assays measure the quantity of HCMV DNA present in a clinical sample, following
extraction of viral nucleic acid. The application and range of NAT assays used in the diagnosis
and management of HCMV varies significantly. Currently, many sites use laboratory-developed
assays based on real-time PCR technology, many of which have been described in the literature.
A range of commercial assays are also available, and comprise either analyte-specific reagents
(ASR) or assay kits specific for different amplification platforms. Each laboratory-developed or
commercial assay differs in the specimen type and nucleic acid extraction method used, as well
as in the reagents (including primers and probes) and instrumentation used for the amplification
and detection of HCMV DNA. In addition, each assay uses proprietary quantification controls to
determine the concentration of viral DNA present. These may comprise either a plasmid clone of
the PCR target, or quantified viral DNA or virus particles, and may or may not be included in the
extraction step.
Given the heterogeneity of these NAT-based assay systems, and the lack of traceability to a
standardised reference system, it is difficult to compare viral load measurements between
different laboratories and to develop uniform treatment strategies. Indeed, variability in the
performance of different assays for HCMV has been documented 4,5
. These studies have
highlighted the need for an internationally-accepted reference standard for HCMV. In 2004, the
International Herpes Management Forum called for; ‘an international quantification standard…
to compare studies using different PCR-based systems and to facilitate patient management at
multiple care centres’ 1. In the absence of such a standard, current clinical guidelines recommend
that individual laboratories establish their own viral load thresholds for HCMV management,
which are specific to their laboratory assay 1,3
. It is also recommended that the specimen type is
not changed when monitoring patients.
The World Health Organisation’s Expert Committee on Biological Standardisation establishes
reference standards for biological substances used in the prevention, treatment or diagnosis of
human disease. WHO International Standards are recognised as the highest order of reference for
biological substances, and are arbitrarily assigned a potency in International Units (IU). Their
primary purpose is to calibrate secondary references used in routine laboratory assays, in terms
of the IU, thereby providing a uniform result reporting system, and traceability of measurements,
independent of the method used 6.
Proposals for the development of the 1st WHO International Standard for HCMV were discussed
at the SoGAT Clinical Diagnostics meeting held at NIBSC in June 2008 7. Options for source
materials and formulation of the candidate standard were discussed 8. It was agreed that the
candidate standard would comprise a whole virus preparation of the prototype clinical HCMV
strain Merlin, and would be formulated in a universal buffer for further dilution in the sample
matrix appropriate to each assay. The use of whole virus would standardise the entire assay
including both extraction and DNA amplification steps. It was also agreed that the final
concentration would be in the order of 1×10⁷ ‘copies/mL’, and would be expressed in IU when
established. The proposal was adopted into the WHO biological standardisation programme in
October 2008.
The proposed standard is intended to be used in the in vitro diagnostics field and it relates to ISO
17511:2003 Section 5.5.
WHO/BS/10.2138
Page 4
Aims of study The aim of this collaborative study is to determine the potency of the candidate standard using a
range of NAT-based assays for HCMV, and to evaluate the suitability of the candidate for the
calibration of secondary reference materials and the standardisation of HCMV viral load
measurements.
Materials Candidate standard The proposed candidate standard comprises a cell-free live virus preparation of the prototype
clinical HCMV strain Merlin 10
. This low passage strain represents a well characterised, near
complete HCMV genome compared with other laboratory strains, and has been fully sequenced
(GenBank Accession number AY446894). The Merlin strain is classified as a genotype 1 virus,
based on the glycoprotein B gene UL55. Given the wide range of samples routinely tested for
HCMV, the candidate standard is formulated in a universal buffer, comprising 10 mM Tris-HCl
and human serum albumin, for further dilution in the appropriate sample matrix used in each
laboratory assay. This preparation has then been freeze-dried to ensure long-term stability.
Preparation of bulk material A tissue culture supernatant sample of HCMV Merlin strain (passage 4) was propagated in
MRC-5 cells, infecting at a multiplicity of infection of 0.1. Tissue culture fluid (passage 6) was
harvested once a cytopathic effect (CPE) was observed, and repeated until all the cells showed
CPE. The culture fluid was clarified by low speed centrifugation and virus pelleted by
ultracentrifugation. Viral pellets were pooled to make a stock of virus in 200 mL 10 mM Tris-
HCl buffer (pH 7.4), containing 0.5% human serum albumin (Tris-HSA buffer). The human
serum albumin used in the production of the candidate standard and other study samples was
derived from licensed products, and was screened and tested negative for anti-HIV-1, HBsAg,
and HCV RNA.
The concentration of the HCMV Merlin stock was determined at NIBSC, using a laboratory-
developed real-time PCR assay. Briefly, 400 µL of sample was extracted using the QIAamp®
MinElute®
Virus Spin Kit (QIAGEN, Hilden, Germany), on the QIAcube®
instrument. Five
microlitres of purified nucleic acid was then amplified by real-time PCR using the LightCycler®
480 Instrument (Roche Applied Science, Mannheim, Germany) 11
. The target was quantified
against serial dilutions of a plasmid clone of the PCR target. The HCMV DNA concentration
was also assessed at NIBSC using two commercial HCMV assays (Roche LightCycler®
CMV
Quant Kit and Nanogen Q-CMV Real Time Complete Kit), and in five clinical laboratories in
the UK using a range of laboratory-developed and commercial assays. The stock was diluted
1/8000 in Tris-HSA buffer and dispensed in 0.5 mL volumes prior to evaluation. The remainder
of the stock was stored at -80 °C until preparation of the final bulk. The geometric mean virus
concentration from all assays, in ‘copies/mL’, was used to determine a consensus HCMV
concentration for the stock.
The bulk preparation was formulated to contain approximately 1×10⁷ HCMV 'copies/mL' in a
final volume of 6.4 L Tris-HSA buffer, and mixed for a total of 30 minutes using a magnetic
stirrer. Approximately 250 mL of the liquid bulk was dispensed in 1 mL aliquots into 2 mL
Sarstedt screw cap tubes and stored at -80 °C. The remaining bulk volume was immediately
processed for lyophilisation in order to prepare the final product, NIBSC code 09/162.
Filling and lyophilisation of candidate standard
WHO/BS/10.2138
Page 5
The filling and lyophilisation of the bulk material was performed at NIBSC, and the production
summary is detailed in Table 1. The filling was performed in a Metall and Plastic
GmbH (Radolfzell, Germany) negative pressure isolator that contains the entire filling line and
is interfaced with the freeze dryer (CS150 12m2, Serail, Arguenteil, France) through a ‘pizza
door’ arrangement to maintain integrity of the operation. The bulk material was kept at 4 °C
throughout the filling process, and stirred constantly using a magnetic stirrer. The bulk was
dispensed into 5 mL screw cap glass vials in 1 ml volumes, using a Bausch & Strobel (Ilfshofen,
Germany) filling machine FVF5060. The homogeneity of the fill was determined by on-line
check-weighing of the wet weight, and vials outside the defined specification were discarded.
Filled vials were partially stoppered with halobutyl 14mm diameter cruciform closures and
lyophilised in a CS150 freeze dryer. Vials were loaded onto the shelves at -50 °C and held at this
temperature for 4 hrs. A vacuum was applied to 270 µb over 1 hr, followed by ramping to 30 µb
over 1 hr. The temperature was then raised to -40 °C, and the vacuum maintained at this
temperature for 42.5 hrs. The shelves were ramped to 25 °C over 15 hrs before releasing the
vacuum and back-filling the vials with nitrogen. The vials were then stoppered in the dryer,
removed and capped in the isolator, and the isolator decontaminated with formaldehyde before
removal of the product. The sealed vials are stored at -20 °C at NIBSC under continuous
temperature monitoring for the lifetime of the product (NIBSC to act as custodian and worldwide
distributor).
Post-fill testing Assessments of residual moisture and oxygen content, as an indicator of vial integrity after
sealing, were determined for twelve vials of freeze-dried product. Residual moisture was
determined by non-invasive near-infrared (NIR) spectroscopy (MCT 600P, Process Sensors,
Corby, UK). NIR results were then correlated to Karl Fischer (using calibration samples of the
same excipient, measured using both NIR and Karl Fischer methods) to give % w/w moisture
readings. Oxygen content was measured using a Lighthouse Infra-Red Analyser (FMS-750,
Lighthouse Instruments, Charlottesville, USA).
Samples of the liquid bulk (n=18) and freeze-dried product (n=18) were tested by HCMV real-
time PCR as described earlier, in order to determine the homogeneity of the product prior to
dispatch for collaborative study.
Stability of the freeze-dried candidate Accelerated degradation studies are underway at NIBSC in order to predict the stability of
09/162 when stored at the recommended temperature of -20 °C. Vials of freeze-dried product are
being held at -70 °C, -20 °C, +4 °C, +20 °C, +37 °C, +45 °C. At specified time points during the
life of the product, three vials will be removed from storage at each temperature and HCMV
DNA quantified by real-time PCR (as previously described). In addition, a limited assessment of
the stability of reconstituted product was performed. Reconstituted product was stored at +4 °C,
+20 °C, and +37 °C, and HCMV DNA quantified by real-time PCR after 24 and 48 hrs.
Study samples The freeze-dried candidate HCMV Merlin preparation was evaluated alongside the unprocessed
liquid bulk (used to prepare the freeze-dried candidate), a live virus preparation of the HCMV
strain AD169 12
, and a sample of purified HCMV Merlin DNA cloned into a bacterial artificial
chromosome (BAC) 13
.
The AD169 virus was propagated in MRC-5 cells as described earlier. The culture fluid was
harvested once a CPE was observed, clarified at low speed centrifugation and virus pelleted by

WHO/BS/10.2138
Page 6
ultracentrifugation. Virus was then diluted to approximately 1×10⁷ HCMV 'copies/mL' in Tris-
HSA buffer. As the prototype laboratory strain of HCMV, AD169 DNA is frequently used as a
calibrator in NAT-based assays. It has been classified as a genotype 2 virus, based on the
glycoprotein B gene.
The Merlin BAC had been prepared from the complete HCMV Merlin genome 10,13
. BAC DNA
was purified using a Nucleobond BAC100 kit (Machery-Nagel GmbH, Düren, Germany)
according to manufacturer’s instructions. The concentration of purified BAC DNA was
determined by absorbance at 260 nm, using a NanoDrop ND-1000 spectrophotometer
(NanoDrop Technologies Inc., Wilmington, DE), and diluted to 1×10⁵ HCMV 'copies/µL' in
nuclease-free water. The purpose of including this purified HCMV DNA sample was to
investigate the effect of the extraction step on the variability in HCMV quantification.
Aliquots of AD169 (n=18) and Merlin BAC (n=18) were tested by HCMV real-time PCR (as
previously described), in order to determine the homogeneity of the samples prior to dispatch for
collaborative study. Study samples were stored at -20 °C (sample 1) and -70°C (samples 2-4)
prior to shipment to participants.
Study samples shipped to participants were coded as samples 1-4 and were as follows:
– Sample 1 - Lyophilised preparation 09/162 in a 5 mL screw cap glass vial.
– Sample 2 - 1 mL frozen liquid preparation of the HCMV Merlin bulk (used to prepare freeze-
dried candidate) in a 2 mL Sarstedt screw cap tube.
– Sample 3 - 1 mL frozen liquid whole virus preparation of HCMV AD169 in a 2 mL Sarstedt
screw cap tube.
– Sample 4 - 50 µL frozen liquid preparation of purified BAC-cloned Merlin DNA in a 0.5 mL
Sarstedt screw cap tube.
Study design The aim of the collaborative study was to evaluate the suitability and potency of the candidate
HCMV International Standard in a range of NAT based assays. Four vials each of study samples
1-4 were delivered to participating laboratories by courier on dry ice, with specific instructions
for storage and reconstitution.
Study protocol Participants were requested to test dilutions of each sample using their routine NAT-based assay
for HCMV on four separate occasions, using a fresh vial of each sample in each independent
assay. In accordance with the study protocol (Appendix 2), the lyophilized sample 1 was to be
reconstituted with 1 mL of deionised, nuclease-free molecular-grade water and left for a
minimum of 20 minutes with occasional agitation before use. Meanwhile, study samples 1-3
were to be thawed and vortexed briefly before use.
Participants were requested to dilute samples 1-3 to within the quantitative range of the assay,
using the sample matrix specific to their individual assay, and to extract each dilution prior to
amplification. Meanwhile, participants were requested to dilute sample 4 in nuclease-free water,
and add an aliquot of each dilution directly to the amplification reaction. For quantitative assays,
participants were requested to test a minimum of two serial ten-fold dilutions within the linear
range of the assay. For qualitative assays, participants were requested to test ten-fold serial
dilutions of each sample to determine the assay end-point, and then a minimum of two half-log
serial dilutions either side of the predetermined end-point, for subsequent assays.
WHO/BS/10.2138
Page 7
Participants were requested to report the viral load in ‘copies/mL’ (positive/negative for
qualitative assays) for each dilution of each sample and return results including details of
methodology used to NIBSC for analysis.
Participants Study samples were sent to 32 participants representing 14 countries (Appendix 1). Participants
were selected for their experience in CMV NAT and geographic distribution. They represented
mainly clinical laboratories, but also included a range of manufacturers of in vitro diagnostic
devices (IVDs), as well as reference, research and quality assurance laboratories. All
participating laboratories are referred to by a code number, allocated at random, and not
representing the order of listing in Appendix 1. Where a laboratory returned data using different
assay methods, the results were analysed separately, as if from different laboratories, and are
referred to as, for example, laboratory 9A, 9B etc.
Statistical methods Qualitative and quantitative assay results were evaluated separately. In the case of qualitative
assays, for each laboratory and assay method, data from all assays were pooled to give a number
positive out of number tested at each dilution step. A single ‘end-point’ for each dilution series
was calculated, to give an estimate of ‘NAT detectable units/mL’, as described previously 14
. It
should be noted that these estimates are not necessarily directly equivalent to a genuine genome
equivalent number/mL. In the case of quantitative assays, analysis was based on the results
supplied by the participants. Results were reported as ‘copies/mL’ although the relationship to
genuine genome equivalence numbers is unknown. For each assay run, a single estimate of log10
‘copies/mL’ was obtained for each sample, by taking the mean of the log10 estimates of
‘copies/mL’ across replicates, after correcting for any dilution factor. A single estimate for the
laboratory and assay method was then calculated as the mean of the log10 estimates of
‘copies/mL’ across assay runs.
Overall analysis was based on the log10 estimates of ‘copies/mL’ or ‘NAT detectable units/mL’.
Overall mean estimates were calculated as the means of all individual laboratories. Variation
between laboratories (inter-laboratory) was expressed as standard deviations (SD) of the log10
estimates and % geometric coefficient of variation (%GCV) 15
of the actual estimates. Potencies
relative to sample 1, the candidate International Standard, were calculated as the difference in
estimated log10 ‘units per mL’ (test sample – candidate standard) plus a candidate assigned value
in International Units/ml (IU/mL) for the candidate standard. So for example, if in an individual
assay, the test sample is 0.5 log10 higher than the candidate standard, and the candidate standard
is assigned 6.7 log10 IU/mL, the relative potency of the test sample is 7.2 log10 IU/mL. The same
approach was used to calculate the potencies relative to sample 4, in order the evaluate the utility
of purified DNA to standardise HCMV assays.
Variation within laboratories and between assays (intra-laboratory), was expressed as standard
deviations of the log10 estimates and %GCVs of the individual assay mean estimates. These
estimates were pooled across samples 1 to 3, but calculated separately for sample 4. The
significance of the inter-laboratory variation relative to the intra-laboratory variation was
assessed by an analysis of variance.
Results and data analysis Validation of study samples and stability assessment Production data for the candidate standard sample 1 showed that the CV of the fill mass and
mean residual moisture were within acceptable limits for a WHO International Standard (Table

WHO/BS/10.2138
Page 8
1). Residual oxygen content was within the NIBSC working limit of 1.1%. Evaluation of
multiple aliquots (n=18) of each study sample at NIBSC prior to dispatch indicated that the
homogeneity of HCMV content was similar for all study samples (2SD less than 0.3 log10
‘copies/mL’ for each sample).
Samples of the candidate standard 09/162 were stored at elevated temperatures, and assayed at
NIBSC concurrently with samples stored at -20 °C and -70 °C, after 4 months or 8 months
storage, by HCMV real-time PCR (as described earlier). At each time point, three vials of
samples stored at each temperature were extracted and amplified in triplicate. The mean
estimated log10 ‘copies/ml’ and differences (log10 ‘copies/ml’) from the -70 °C baseline sample
are shown in Table 2. A negative value indicates a drop in potency relative to the -70 °C baseline.
95% confidence intervals for the differences are ±0.16 log10 based on a pooled estimate of the
standard deviation between individual vial test results. Considered individually, only the
difference of +0.204 for the 45 °C samples stored for 8 months is therefore statistically
significant. However, there does appear to be a pattern of apparent increase in potency with
increasing temperature and length of storage. The reason for this is not clear. As there is no
observed drop in potency it is not possible to fit the usual Arrhenius model for accelerated
degradation studies, or obtain any predictions for the expected loss per year with long term
storage at -20 °C. However, using the ‘rule of thumb’ that the decay rate will approximately
double with every 10 °K increase in temperature (personal communication: Dr P K Philips), and
noting that there is no detectable drop in potency after 8 months at +20 °C, then there should be
no detectable difference after 64 months at -20 °C. A similar argument applied to the +37 °C
data would imply no detectable loss after 256 months (over 20 years) at -20 °C. However, with
the unexplained trend for an apparent increase in potency at the higher temperatures,
extrapolations based on the +37 °C data may not be reliable. In summary, there is no evidence of
any degradation at any temperature after storage for 8 months. It is not possible to obtain precise
estimates of any degradation rates for long term storage at -20 °C. All available data indicates
adequate stability. Subsequent testing will take place at 12 and 18 months, then at 2, 3, 4, and 5
years.
The limited assessment of the stability of reconstituted product stored at +4 °C, +20 °C, and +37
°C for 24 and 48 hrs showed that there was no marked decrease in HCMV DNA concentration in
vials stored at +20 °C and +37 °C compared with those stored at 4 °C, as determined by real-
time PCR (data not shown).
Data received
Data were received from all 32 participating laboratories. Participants performed a variety of
different assay methods, with some laboratories performing more than one assay method. In total,
data sets were received from 53 quantitative assays, and 5 qualitative assays. Apart from the
cases noted below, there were no exclusions of data.
Qualitative Assays:
Laboratories 24 and 25 used 1-log dilution steps for all 4 assays. For laboratory 24, the majority
of the results for sample 4 were positive. Estimates for this laboratory will therefore be less
precise than from those using half-log dilution steps.
Laboratory 31 had anomalous results for sample 1 in assay 4 (negative at 10-4.5
to 10-6
but
positive at 10-6.5
dilutions). These results were excluded for this assay.
Quantitative Assays:
WHO/BS/10.2138
Page 9
Laboratories 2B, 4, 19B, 19C and 25 did not return results for sample 4. This was principally
because it was not possible to determine viral load without extracting the sample.
Laboratory 12A reported problems with their second assay for most replicates of samples 1, 2 &
3. This assay was excluded from further analysis.
Laboratory 16 only provided data from 2 assays. The second assay was on freeze/thawed
extractions and was excluded. The first assay did not have valid results for sample 3 (noted by
participant as possible technical error).
Laboratory 20A reported that “Samples were frozen between dilution/extraction and PCR assay”.
Laboratory 22B returned data from 4 assays, but the last 2 were after freeze-thaw cycles and
were excluded from further analysis.
For some laboratories and assays, results from individual dilutions were excluded when they
were noted as being outside the linear range of the assays.
Summary of assay methodologies The majority of participants prepared dilutions of study samples 1-3 using either plasma or
whole blood, however, urine, PBS, and nuclease-free water were also used. The extent of the
dilutions performed varied slightly between each laboratory. Extractions were predominantly
automated, and employed a range of instruments including; Abbott m2000sp, QIAGEN’s
QIAsymphony SP and RG Q, BioRobot, MDx, and EZ1, bioMérieux NucliSENS®
easyMag®
,
Roche MagNA Pure LC and COBAS®
AmpliPrep, and Siemens VERSANT®
kPCR. Manual
extraction protocols included Roche High Pure Viral Nucleic Acid Kit, Nanogen EXTRAgen®
,
QIAGEN QIAamp (Blood DNA, DNA and Viral RNA) Mini Kits, QIAGEN QIAamp DSP
Virus Kit, Cepheid affigene®
DNA Extraction Kit, and phenol-chloroform extraction.
The majority of datasets reported the use of real-time PCR technology. Seventeen participants
used commercial assays and reagents (37 data sets), while 13 participants used laboratory-
developed assays (17 data sets). Two participants used both commercial and laboratory-
developed assays (4 data sets). Commercial assays and reagents included; Roche COBAS®
AMPLICOR CMV MONITOR Test, Nanogen Q-CMV Real Time Complete Kit, Argene CMV
R-gene™ and CMV HHV6,7,8 R-gene™, QIAGEN artus CMV (LC and RG) PCR Kits, Roche
COBAS®
TaqMan®
CMV Test, Cepheid’s affigene®
CMV trender and SmartCMV™, Abbott
RealTime CMV (in development), ‘ELITech/Epoch CMV 3.0’, and Quantification of CMV
PrimerDesign™ Ltd. The range of HCMV genes targeted included; UL122/UL123 (MIE/IE19),
UL54 (DNA polymerase), UL83 (pp65), UL55 (glycoprotein B), US8, HXFL4, and UL34 and
UL80.5. Amplification platforms included; Roche LightCycler®
1.5, 2.0 and 480 systems,
COBAS®
TaqMan®
and COBAS®
AMPLICOR Analyzer, Applied Biosystems™ 7300, 7500,
7500 Fast, and 7900 HT Fast Real-Time PCR Systems, Agilent Mx3000P®
qPCR System,
QIAGEN Rotor-Gene Q, Rotor-Gene 3000 and 6000 instruments, Cepheid SmartCycler™ II and
Bio-Rad MyCycler™. Given the range of assay combinations and variables, and the fact that no
two assays were alike (apart from two laboratories using the Roche COBAS®
AMPLICOR CMV
MONITOR Test), it was not possible to group methods and perform analysis according to the
method used.
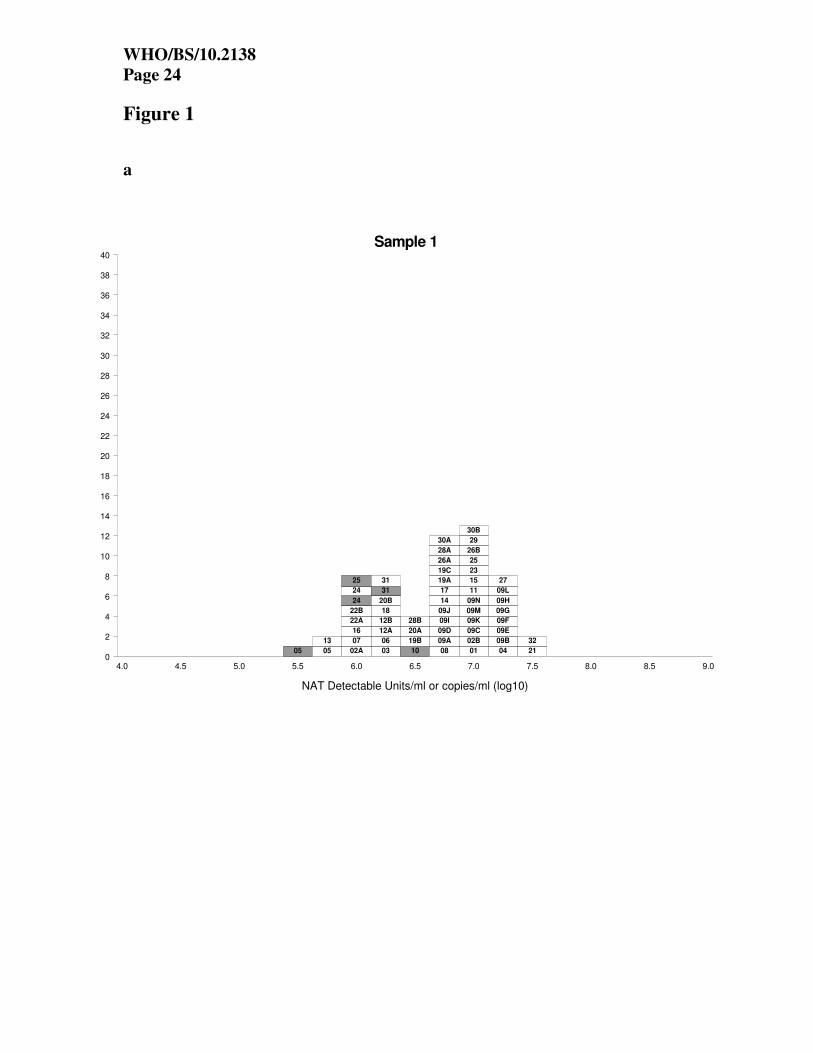
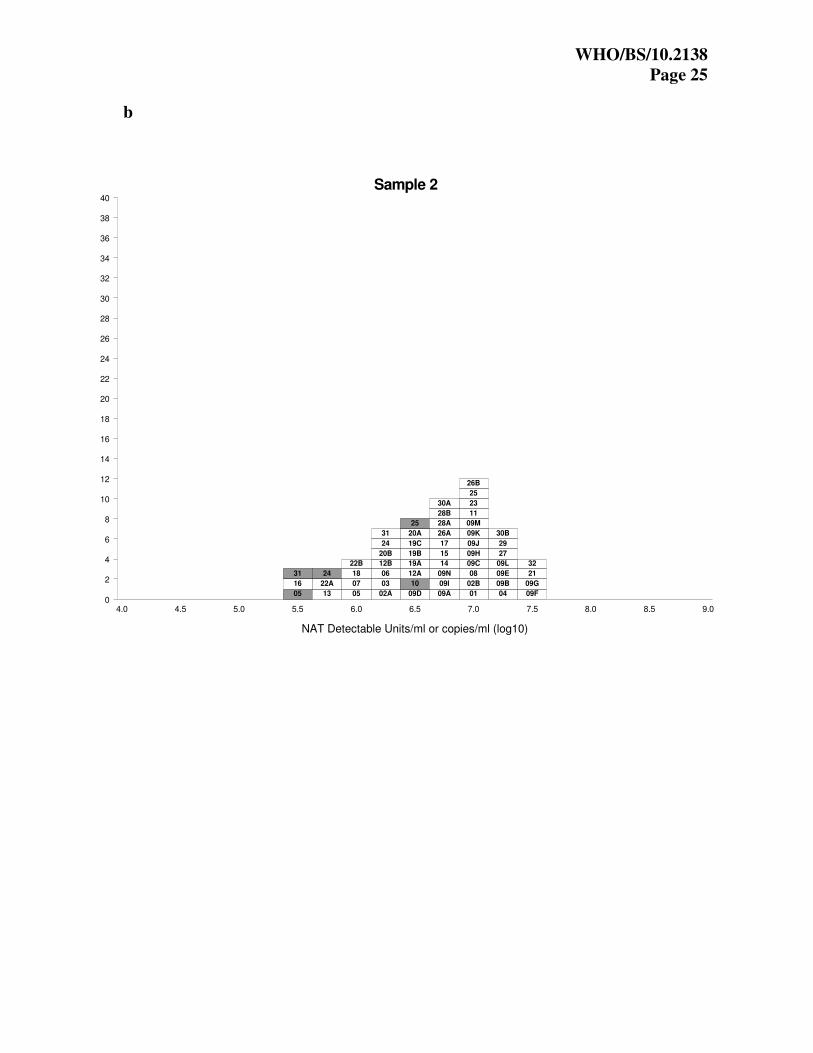
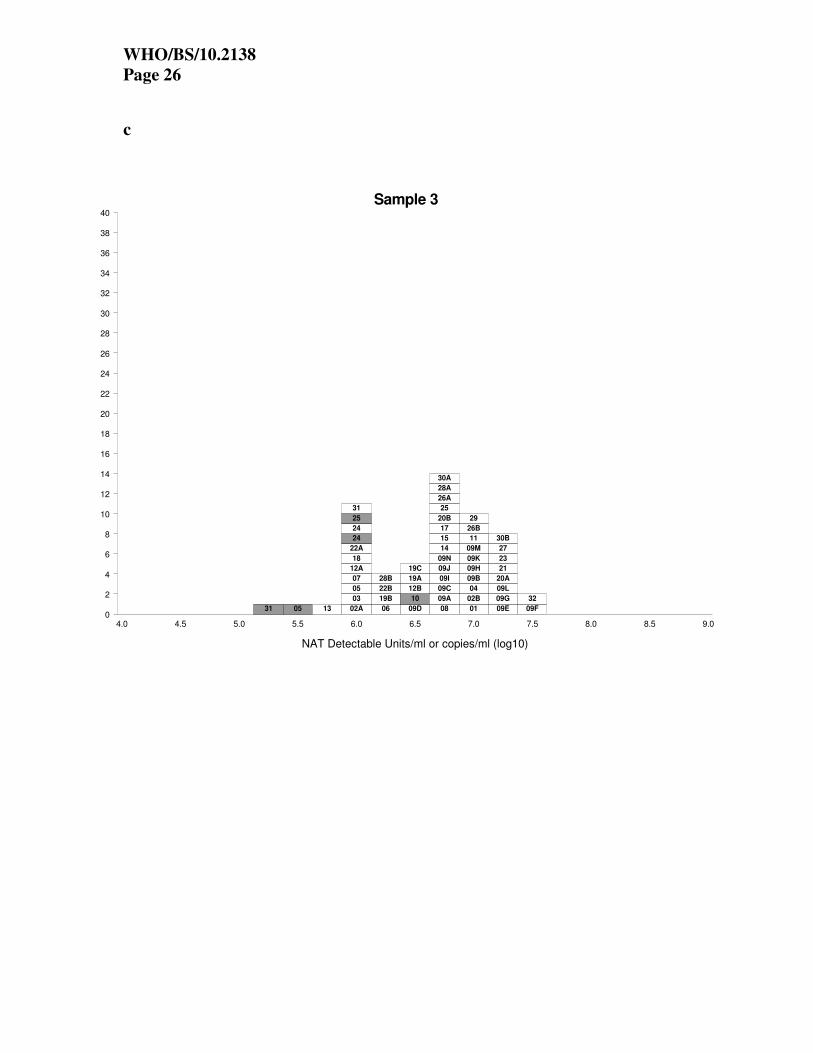
Estimated potencies of study samples The laboratory mean estimates for each study sample for quantitative assays (in log10
‘copies/mL’) and qualitative assays (in log10 ‘NAT detectable units/mL’) are shown in Tables 3
and 4 respectively. The individual laboratory mean estimates for each assay and study sample are
also shown in histogram form in Figures 1a-d. Each box represents the mean estimate from one
laboratory, and the boxes are labelled with the laboratory code number. The results from the
qualitative assays are shaded in grey.

WHO/BS/10.2138
Page 10
Results for samples 1-3 show considerable variation in viral load reported between different
assays, with estimates differing by up to 2 log10 (100-fold) (Table 5). The estimates from the
qualitative assays were typically lower than those for quantitative assays. Meanwhile, the
variability for sample 4 was greater than that of samples 1-3, although this was principally due to
outlying results from five different assays (Figure 1d). Evaluation of the spread of results based
on individual assay parameters, such as the dilution matrix, showed that there was no observed
relationship between these factors and the HCMV concentration for each sample (data not
shown).
Table 5 shows the overall mean estimates for each study sample, for quantitative and qualitative
assays, along with the standard deviation (of log10 estimates) and the %GCV (of actual estimates).
For samples 1 – 3, the standards deviation for quantitative assays is approximately 0.5 log, and
%GCV is approximately 200%. These figures are consistent with the observed 2-log range of
estimates. The spread for the qualitative assays is similar. The SD and %GCV for sample 4, are
higher than those for samples 1-3, again most likely due to the outlying results.
Comparison of overall mean estimates for freeze-dried candidate sample 1 and liquid bulk
sample 2 indicates that there was no significant loss in potency upon freeze-drying (Table 5). In
addition, comparison of overall mean estimates for Merlin sample 2 and AD169 sample 3
indicates the suitability of all assays to equally quantify these two strains.
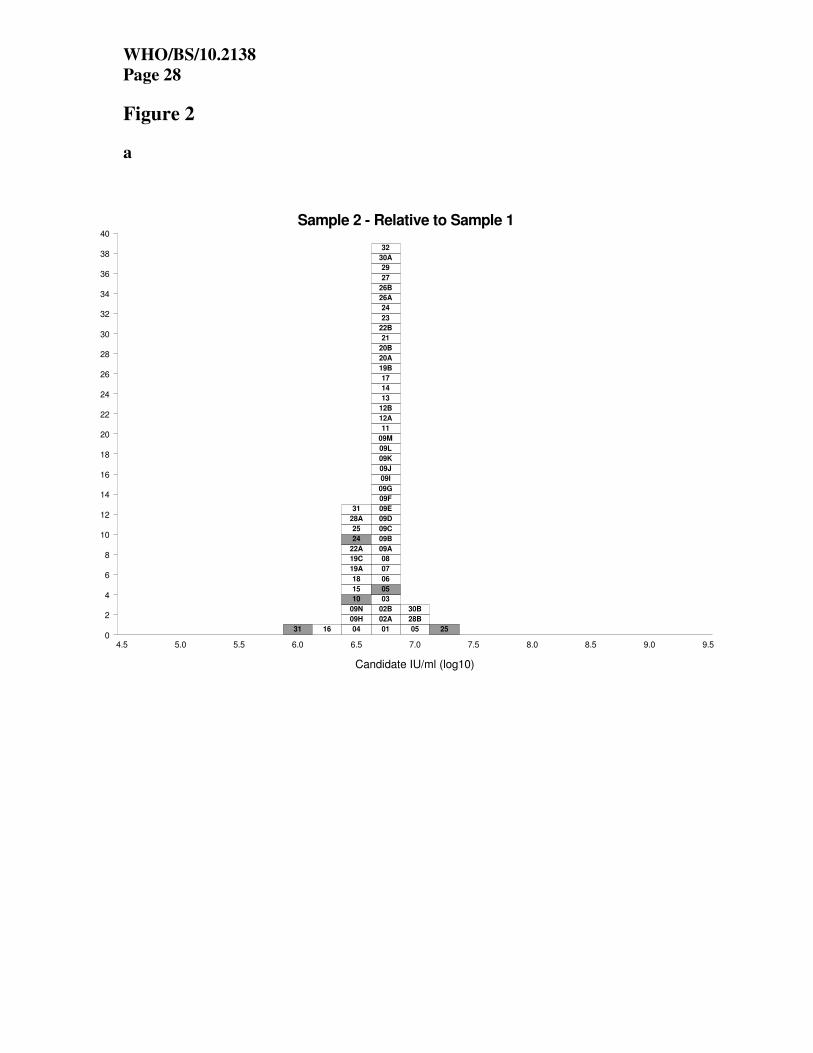
Potencies relative to sample 1 The expression of potency of samples 2-4 relative to sample 1 (as described in the statistical
methods section), allows an assessment of the suitability of the candidate standard for the
standardisation of CMV NAT assays. The relative potencies of samples 2-4 against sample 1, for
each quantitative and qualitative assay, are shown in Tables 6 and 7 respectively. Units are
expressed as candidate log10 IU/ml in both cases. The relative potencies are also shown in
histogram form in Figures 2a-c. Figures 2a and 2b show that when the mean estimates of
samples 2 and 3 are expressed relative to sample 1, there is a marked improvement in agreement
between laboratories, compared with Figures 1b and 1c. While the results from the qualitative
assays remain more variable, they are now centred around the overall mean. However, when the
mean estimates of sample 4 are expressed relative to sample 1 (Figure 2c), there is no significant
improvement in agreement between laboratories, compared with Figure 1d.
Table 8 shows the overall mean relative potency estimates (in ‘candidate log10 IU/mL’) for
samples 2-4, for quantitative and qualitative assays, along with the standard deviation (of log10
estimates) and the %GCV (of actual estimates). For the quantitative assays, the SD has reduced
from approximately 0.5 log10 to 0.12 and 0.19 log10 for samples 2 and 3 respectively. This
demonstrates that the use of a sample 1 as a standard would lead to significant reductions in
inter-laboratory variability in the estimation of CMV concentrations for clinical samples similar
to virus samples 2 and 3. Meanwhile for sample 4, the there is no reduction in the SD for
quantitative assays. As sample 1 requires extraction, and sample 4 does not, differences in
extraction efficiency between laboratories and methods will still contribute to the observed
variation between laboratories for sample 4.
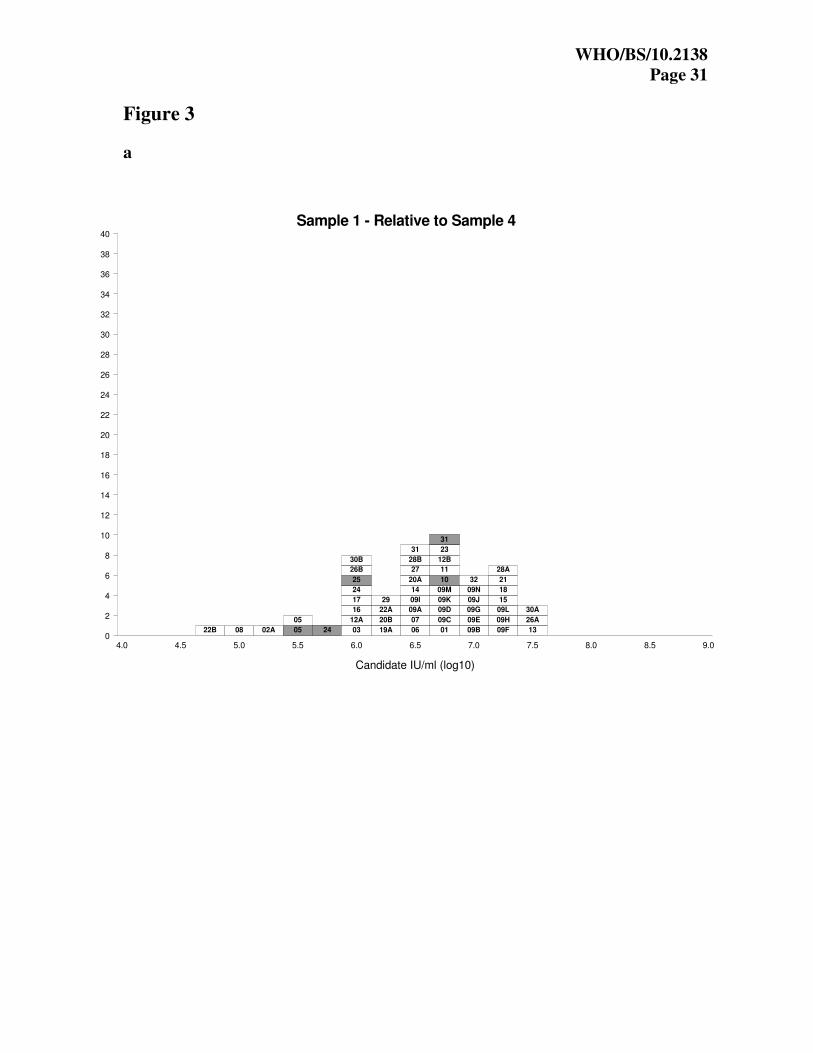
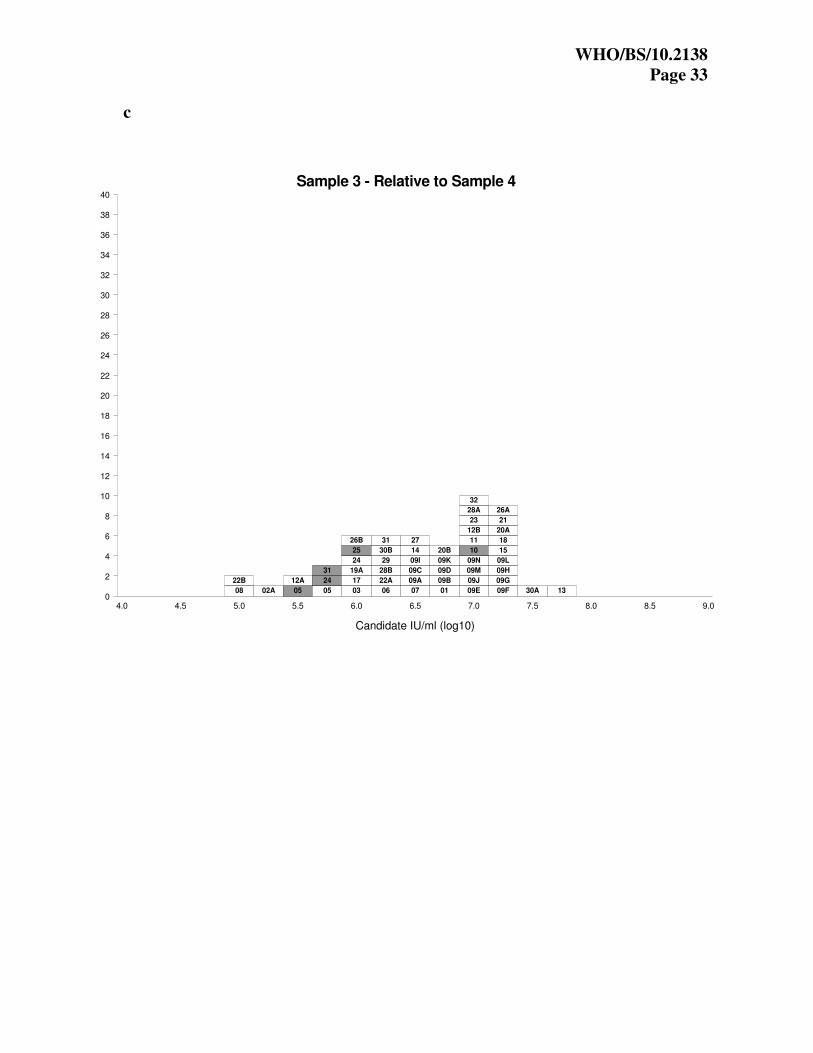
Potencies relative to sample 4 The estimated concentrations of samples 1-3 were also expressed in ‘candidate IU’, relative to
sample 4, using a hypothetical unitage of 107 IU/ml for sample 4. The relative potencies of
samples 1-3 against sample 4, for each quantitative and qualitative assay, are shown in Tables 9
and 10 respectively. The results are also shown in histogram form in Figures 3a-c. These results
show that when the purified DNA sample 4 is used as a standard there is no improvement in
agreement between laboratories, as compared with Figure 1a-c. From Table 11, it can be seen

WHO/BS/10.2138
Page 11
that the standard deviation between laboratories has in fact increased from around 0.5 log10 to
0.64 log10, while the %GCVs have increased to over 300%. These results show that as the
purified DNA sample 4 is not extracted alongside clinical samples, it cannot control for
differences in extraction methods or efficiency between laboratories.
Intra-laboratory variation Table 12 shows the intra-laboratory standard deviations and %GCVs for each laboratory,
calculated by pooling estimates for samples 1-3, but separately for sample 4. For all samples, the
inter-laboratory variation was greater than the intra-laboratory variation (p<0.0001). For samples
1-3 there were differences between the repeatability of laboratory estimates across assays, with
the average standard deviation being 0.11 log10 or a %GCV of 30%. For sample 4, there was a
greater range of values between laboratories, with the average standard deviation being 0.21
log10 or a %GCV of 63%.
Discussion and conclusions In this study, a range of NAT-based assays for HCMV have been used to evaluate the suitability
and potency of the candidate standard preparation as the 1st WHO International Standard for
HCMV.
The candidate standard comprises a whole virus preparation of the prototype clinical HCMV
strain Merlin. This strain was chosen as it is well characterised and more likely to represent a
clinical virus than other laboratory-adapted strains. The use of a whole virus preparation, allows
the candidate standard to be extracted alongside clinical samples thereby standardising the entire
HCMV assay. In addition, because of the range of patient samples routinely tested for HCMV,
the candidate has been formulated in a universal buffer for further dilution in the sample matrix
appropriate to each HCMV test. This allows the matrix of the candidate standard to be as similar
as possible to that of the test analyte.
In the collaborative study, the freeze-dried candidate standard was evaluated alongside whole
virus preparations of Merlin and AD169 strains. In the analysis of results, these samples
represent the samples to be calibrated by the candidate standard and enable the study to evaluate
the suitability of the candidate standard to harmonise assay results for these samples. In addition,
a purified DNA sample comprising the entire Merlin sequence cloned into a BAC was included
in the study. The purpose of including this sample was to evaluate the effect of the extraction
step on the variability of HCMV viral load measurements. It also enabled the investigation of the
utility of a purified DNA sample to standardise assays of whole virus samples.
The study results showed that all assays detected both Merlin and AD169 strains, demonstrating
the suitability of the Merlin strain for use as the candidate International Standard, and confirming
its ability to calibrate secondary references comprising the AD169 strain.
The overall mean estimate for the candidate standard sample 1 was 5×10⁶ (6.7 log10) 'copies/mL'.
Individual laboratory mean estimates ranged from 5.4 to 7.5 log10 ‘copies/mL’. The target
concentration for the candidate standard was 1×10⁷ ‘copies/mL’, based on preliminary testing of
the Merlin stock at NIBSC and in a selection of UK clinical laboratories. The overall mean
estimate for the liquid bulk sample 2 was similar to that of the freeze-dried sample 1, indicating
that there was no significant loss in potency upon freeze-drying. The small difference between
the overall mean estimate and the target concentration for the candidate standard is likely to be a
result of the selection of a small subset of laboratories for preliminary testing, and the large inter-
laboratory variation observed in assay results.

WHO/BS/10.2138
Page 12
The overall range in laboratory mean estimates for the whole virus study samples 1-3 was 2 log10.
This variability reflects the range and differences in diagnostic testing procedures between
laboratories and is similar to levels previously reported for HCMV NAT assays 4,5
. The overall
range in laboratory mean estimates for the purified DNA sample 4 was higher. This was
unexpected since the purified DNA sample 4 was not extracted, however, the spread was
principally due to outlying results from five assays (there was no observed relationship between
these five assays). Inter-laboratory variability was significantly greater than intra-laboratory
variability. This was also reported by Pang et al., 4.
The agreement between laboratories for virus samples 2 and 3 was markedly improved when the
potencies of these study samples was expressed relative to the candidate standard (sample 1),
demonstrating the suitability of the candidate to standardise assays of whole virus samples.
However, when the purified DNA sample 4 was used as the standard, it did not lead to any
improvement in agreement between laboratories, and such a preparation would not be suitable
for the standardisation of assays of whole virus samples.
The matter of commutability of the candidate standard for clinical HCMV samples has not been
specifically assessed in this study. Commutability is affected by a range of factors including
matrix and molecular variants of the analyte (in this case HCMV DNA). The idea behind
preparing the candidate in a universal matrix for subsequent dilution in the sample matrix
appropriate to each assay was to control for matrix effects. In this study, the marked
improvement of all assay results for samples 2 and 3 when expressed relative to sample 1,
independent of the sample matrix used to dilute the samples, might suggest that this approach
does control for different sample matrices. However, it is difficult to control for differences in
HCMV forms that are present in different clinical samples. In this study, the candidate standard
is derived from a crude cell-free preparation of HCMV from cell culture, which comprises both
whole virus and naked HCMV DNA (as determined by DNase digestion experiments – data not
shown). However, patient samples derived from peripheral blood are likely to comprise a range
of HCMV forms including whole and disrupted virions, and fragmented genomic DNA, with
different forms predominating in different blood compartments. Plasma and serum samples from
renal transplant recipients have been reported to contain highly fragmented HCMV DNA 16
.
Meanwhile, whole blood samples from the same patients comprised a mixture of highly
fragmented and large DNA forms, some of which may have been derived from whole
virus. Therefore, further studies are needed to assess the commutability of this material with
respect to HCMV DNA forms present in different clinical samples.
The results obtained from accelerated thermal degradation studies at four and eight months
indicate that the candidate is stable and suitable for long-term use.
The results of this study have demonstrated that the candidate standard, NIBSC code 09/162, has
been shown to be suitable for use as a standard in a range of NAT-based assays for the
quantification of HCMV DNA. As this is proposed as the 1st WHO International Standard for
HCMV the assignment of an International Unit is arbitrary. In the case of this study a value of
5×10⁶ International Units has been chosen as this represents the consensus estimate for the
candidate across all laboratory assays. The uncertainty can be derived from the variance of the
fill and is 0.23%.

WHO/BS/10.2138
Page 13
Proposal It is proposed that the candidate standard (NIBSC code 09/162) is established as the International
Standard for HCMV with an assigned potency of 5×10⁶ International Units when reconstituted in
1 mL of nuclease-free water. The proposed standard is intended to be used by clinical
laboratories and IVD manufacturers to calibrate secondary references used in routine NAT-based
assays for HCMV. Proposed Instructions for Use (IFU) for the product are included in Appendix
3.
Comments from participants Fifteen of thirty-two participants responded to the report. There were no disagreements with the
suitability of the candidate standard (NIBSC code 09/162) to serve as the 1st WHO International
Standard for HCMV. The majority of comments suggested editorial changes and these have been
implemented where appropriate. Two participants commented on the proposal to assign the
candidate a concentration of 6.7 log10 IU/mL, despite the initial proposal to assign a
concentration of 7 log10 IU/mL.
Acknowledgements We would like to thank Professor Gavin Wilkinson and Dr Rich Stanton, Cardiff University, UK,
for the provision of materials used in the preparation of the candidate standard and collaborative
study samples. We would also like to thank the selected UK clinical laboratories (Claire
Atkinson, Virology, Royal Free Hospital; Dr Malcolm Guiver, HPA Laboratory North West; Dr
Melvyn Smith, London South Specialist Virology Centre; Dr Rory Gunson, West of Scotland
Specialist Virology Centre; Dr Duncan Clark, Virology, Barts and The London NHS Trust) for
performing preliminary testing of the HCMV Merlin stock. We are grateful to all participants of
the collaborative study.
References 1. Razonable RR, Emery VC; 11th Annual Meeting of the IHMF (International Herpes
Management Forum). Management of CMV infection and disease in transplant patients. 27-
29 February 2004. Herpes. 2004;11(3):77-86.
2. Baldanti F, Lilleri D, Gerna G. Monitoring human cytomegalovirus infection in transplant
recipients. J Clin Virol. 2008;41(3):237-41.
3. Kotton CN, Kumar D, Caliendo AM, Asberg A, Chou S, Snydman DR, Allen U, Humar A;
Transplantation Society International CMV Consensus Group. International consensus
guidelines on the management of cytomegalovirus in solid organ transplantation.
Transplantation. 2010;89(7):779-95.
4. Pang XL, Fox JD, Fenton JM, Miller GG, Caliendo AM, Preiksaitis JK; American Society
of Transplantation Infectious Diseases Community of Practice; Canadian Society of
Transplantation. Interlaboratory comparison of cytomegalovirus viral load assays. Am J
Transplant. 2009;9:258-68.
5. Wolff DJ, Heaney DL, Neuwald PD, Stellrecht KA, Press RD. Multi-Site PCR-based CMV
viral load assessment-assays demonstrate linearity and precision, but lack numeric
standardization: a report of the association for molecular pathology. J Mol Diagn.
2009 ;11:87-92.
6. Recommendations for the preparation, characterization and establishment of international
and other biological reference standards (revised 2004). WHO Technical Report Series 2007.
Geneva, Switzerland:WHO 2007; 932,73-131.
7. Fryer JF, Minor PD. Standardisation of nucleic acid amplification assays used in clinical
diagnostics: a report of the first meeting of the SoGAT Clinical Diagnostics Working Group.
WHO/BS/10.2138
Page 14
J Clin Virol. 2009;44(2):103-5.
8. SoGAT Clinical Diagnostics Meeting report;
www.nibsc.ac.uk/spotlight/sogat/clinical_diagnostics/past_meetings.aspx
9. Dolan A, Cunningham C, Hector RD, Hassan-Walker AF, Lee L, Addison C, Dargan DJ,
McGeoch DJ, Gatherer D, Emery VC, Griffiths PD, Sinzger C, McSharry BP, Wilkinson
GW, Davison AJ. Genetic content of wild-type human cytomegalovirus. J Gen Virol.
2004;85:1301-12.
10. Guiver M, Fox AJ, Mutton K, Mogulkoc N, Egan J. Evaluation of CMV viral load using
TaqMan CMV quantitative PCR and comparison with CMV antigenemia in heart and lung
transplant recipients. Transplantation. 2001;71(11):1609-15.
11. Chee MS, Bankier AT, Beck S, Bohni R, Brown CM, Cerny R, Horsnell T, Hutchison CA
3rd
, Kouzarides T, Martignetti JA, et al. Analysis of the protein-coding content of the
sequence of human cytomegalovirus strain AD169. Curr Top Microbiol Immunol.
1990;154:125-69.
12. Stanton RJ, Baluchova K, Dargan DJ, Cunningham C, Sheehy O, Seirafian S, McSharry BP,
Neale ML, Davies J, Tomasec P, Davison AJ, Wilkinson GWG. Reconstruction of the
complete human cytomegalovirus genome in a BAC reveals RL13 to be a potent inhibitor of
replication. J Clin Invest. 2010. In press.
13. Saldanha J; Lelie N and Heath A B. Establishment of the First International Standard for
Nucleic Acid Amplification Technology (NAT) assays for HCV RNA. 1999. Vox Sanquinis.
76: 149-158.
14. Kirkwood TBL. Geometric means and measures of dispersion. Biometrics 1979;35:908-9.
15. Boom R, Sol CJ, Schuurman T, Van Breda A, Weel JF, Beld M, Ten Berge IJ, Wertheim-
Van Dillen PM, De Jong MD. Human cytomegalovirus DNA in plasma and serum
specimens of renal transplant recipients is highly fragmented. J Clin Microbiol.
2002;40(11):4105-13.

WHO/BS/10.2138
Page 15
Table 1. Production summary for the candidate standard (sample 1).
NIBSC code 09/162
Product name Human Cytomegalovirus
Dates of processing Filling; 25 September 2009
Lyophilisation; 25-29 September 2009
Sealing; 29 September 2009
Presentation Freeze-dried preparation in 5mL screw-cap
glass vial
Appearance Robust opaque white cake
No. of vials filled 6029
Mean fill weight (g) 1.00 (n=126)
CV of fill weight (%) 0.23
Mean residual moisture (%) 0.6 Karl Fischer, 0.41 NIR units (n=12)
CV of residual moisture (%) 7.2
Mean oxygen content (%) 0.22 (n=12)
CV of oxygen content (%) 40.6
No. of vials available to
WHO
5100
Table 2. Stability of 09/162 at 4 and 8 months.
Mean log10 ‘copies/mL’ Difference in log10 ‘copies/mL’
from -70°C baseline sample
Temperature
(°C)
4 months 8 months 4 months 8 months
-70 6.92 6.77 - -
-20 6.92 6.78 0.008 0.015
+4 6.86 6.72 -0.054 -0.048
+20 6.96 6.84 0.044 0.071
+37 7.02 6.91 0.103 0.141
+45 7.07 6.97 0.155 0.204

WHO/BS/10.2138
Page 16
Table 3. Laboratory Mean Estimates from Quantitative Assays (log10 ‘copies/mL’).
Sample Participant
S1 S2 S3 S4 01 6.91 6.92 6.93 7.26
02A 6.05 6.14 5.96 7.81
02B 6.93 7.00 6.99 .
03 6.25 6.30 6.12 7.20
04 7.24 7.14 7.09 .
05 5.71 5.89 5.99 7.21
06 6.31 6.24 6.16 6.80
07 6.03 5.96 6.00 6.56
08 6.74 6.90 6.84 8.81
09A 6.78 6.85 6.68 7.24
09B 7.24 7.20 7.00 7.34
09C 7.04 6.99 6.80 7.21
09D 6.66 6.59 6.43 6.80
09E 7.21 7.29 7.21 7.23
09F 7.32 7.46 7.39 7.15
09G 7.30 7.39 7.35 7.21
09H 7.13 7.03 7.10 6.87
09I 6.67 6.78 6.82 7.21
09J 6.84 6.89 6.85 6.73
09K 7.06 7.03 7.08 7.23
09L 7.29 7.35 7.34 7.15
09M 7.04 7.11 7.11 7.21
09N 6.92 6.74 6.83 6.87
11 7.04 7.11 7.06 7.18
12A 6.31 6.38 6.05 7.43
12B 6.36 6.35 6.57 6.55
13 5.65 5.77 5.73 5.06
14 6.76 6.78 6.76 7.34
15 6.95 6.87 6.82 6.67
16 5.97 5.58 . 6.91
17 6.66 6.75 6.73 7.64
18 6.15 5.99 5.97 5.81
19A 6.65 6.53 6.47 7.37
19B 6.49 6.42 6.36 .
19C 6.76 6.57 6.49 .
20A 6.57 6.58 7.32 7.19
20B 6.18 6.22 6.66 6.88
21 7.46 7.53 7.36 7.14
22A 6.02 5.84 6.12 6.86
22B 6.11 6.09 6.36 8.39
23 6.94 7.02 7.15 7.08
24 6.09 6.13 6.06 7.10
25 7.05 6.91 6.87 .
26A 6.82 6.75 6.65 6.41
26B 7.03 6.97 6.95 7.91
27 7.23 7.30 7.30 7.69
28A 6.85 6.65 6.66 6.55
28B 6.52 6.72 6.24 7.03
29 7.08 7.13 7.10 7.79
30A 6.67 6.82 6.72 6.09
30B 7.05 7.24 7.23 8.02
31 6.24 6.13 6.03 6.69
32 7.43 7.41 7.39 7.49

WHO/BS/10.2138
Page 17
Table 4. Laboratory Mean Estimates from Qualitative Assays (log10 ‘NAT detectable
units/mL’).
Sample Laboratory
S1 S2 S3 S4
05 5.39 5.53 5.53 6.92
10 6.55 6.38 6.62 6.68
24 5.96 5.83 6.02 7.16
25 5.98 6.43 5.98 6.86
31 6.15 5.47 5.18 6.51
Table 5. Overall Mean Estimates and Inter-Laboratory Variation (log10 ‘copies/mL’ for
quantitative or ‘NAT-detectable units/mL’ for qualitative assays).
Sample Assay No.
data sets Mean SD %GCV Min Max
qualitative 5 6.01 0.42 161 5.39 6.55 S1
quantitative 53 6.71 0.46 188 5.65 7.46
qualitative 5 5.93 0.46 185 5.47 6.43 S2
quantitative 53 6.71 0.49 207 5.58 7.53
qualitative 5 5.86 0.54 249 5.18 6.62 S3
quantitative 52 6.72 0.46 190 5.73 7.39
qualitative 5 6.82 0.25 77 6.51 7.16 S4
quantitative 48 7.11 0.61 307 5.06 8.81

WHO/BS/10.2138
Page 18
Table 6. Laboratory Estimates of Potency Relative to S1 from Quantitative Assays log10
IU/mL taking Sample 1 as 5×10⁶ (6.7 log10 ) IU/mL.
Sample Participant
S2 S3 S4 01 6.70 6.71 7.05
02A 6.79 6.61 8.45
02B 6.77 6.76 .
03 6.75 6.57 7.64
04 6.60 6.55 .
05 6.88 6.98 8.20
06 6.63 6.56 7.20
07 6.63 6.67 7.23
08 6.87 6.81 8.77
09A 6.77 6.61 7.16
09B 6.66 6.46 6.81
09C 6.64 6.46 6.87
09D 6.63 6.47 6.83
09E 6.78 6.70 6.72
09F 6.84 6.78 6.54
09G 6.80 6.75 6.61
09H 6.60 6.67 6.44
09I 6.81 6.86 7.24
09J 6.75 6.70 6.59
09K 6.67 6.72 6.87
09L 6.76 6.75 6.57
09M 6.77 6.77 6.87
09N 6.51 6.61 6.65
11 6.77 6.72 6.84
12A 6.77 6.44 7.82
12B 6.69 6.91 6.89
13 6.82 6.79 6.11
14 6.72 6.70 7.29
15 6.62 6.57 6.42
16 6.31 . 7.64
17 6.79 6.77 7.68
18 6.54 6.52 6.36
19A 6.59 6.52 7.43
19B 6.63 6.56 .
19C 6.51 6.43 .
20A 6.71 7.46 7.32
20B 6.74 7.18 7.41
21 6.77 6.60 6.38
22A 6.52 6.80 7.55
22B 6.69 6.95 8.99
23 6.78 6.90 6.83
24 6.74 6.66 7.70
25 6.57 6.52 .
26A 6.63 6.53 6.29
26B 6.65 6.62 7.58
27 6.77 6.77 7.16
28A 6.50 6.50 6.39
28B 6.89 6.42 7.20
29 6.75 6.72 7.40
30A 6.86 6.75 6.13
30B 6.90 6.88 7.67
31 6.59 6.49 7.15
32 6.68 6.66 6.76

WHO/BS/10.2138
Page 19
Table 7. Laboratory Estimates of Potency Relative to S1 from Qualitative Assays log10 IU/mL
taking Sample 1 as 5×10⁶ (6.7 log10 ) IU/mL.
Sample Laboratory
S2 S3 S4
05 6.84 6.84 8.23
10 6.52 6.77 6.83
24 6.57 6.76 7.90
25 7.16 6.70 7.58
31 6.02 5.73 7.06
Table 8. Overall Mean Estimates and Inter-Laboratory Variation for Potency Relative to
Sample 1 log10 IU/mL taking Sample 1 as 5×10⁶ (6.7 log10 ) IU/mL.
Sample Assay No.
data sets Mean SD %GCV Min Max
qualitative 5 6.62 0.42 163 6.02 7.16
quantitative 53 6.70 0.12 31 6.31 6.90 S2
combined 58 6.69 0.16 44 6.02 7.16
qualitative 5 6.56 0.47 192 5.73 6.84
quantitative 52 6.69 0.19 56 6.42 7.46 S3
combined 57 6.68 0.23 68 5.73 7.46
qualitative 5 7.52 0.58 280 6.83 8.23
quantitative 48 7.12 0.64 341 6.11 8.99 S4
combined 53 7.16 0.64 340 6.11 8.99

WHO/BS/10.2138
Page 20
Table 9. Laboratory Estimates of Potency Relative to S4 from Quantitative Assays log10
IU/mL taking Sample 4 as 107 (7.0 log10 ) IU/mL.
Sample Participant
S1 S2 S3 01 6.65 6.66 6.67
02A 5.25 5.34 5.15
02B
03 6.06 6.10 5.92
04
05 5.50 5.68 5.79
06 6.50 6.43 6.36
07 6.47 6.39 6.44
08 4.93 5.10 5.04
09A 6.54 6.61 6.45
09B 6.89 6.85 6.66
09C 6.83 6.78 6.59
09D 6.87 6.79 6.64
09E 6.98 7.06 6.98
09F 7.16 7.30 7.24
09G 7.09 7.18 7.14
09H 7.26 7.16 7.23
09I 6.46 6.57 6.61
09J 7.11 7.16 7.11
09K 6.83 6.80 6.85
09L 7.13 7.20 7.19
09M 6.83 6.90 6.90
09N 7.05 6.87 6.96
11 6.86 6.93 6.88
12A 5.88 5.95 5.62
12B 6.81 6.80 7.02
13 7.59 7.71 7.68
14 6.41 6.43 6.41
15 7.28 7.20 7.15
16 6.06 5.68 .
17 6.02 6.11 6.08
18 7.34 7.18 7.16
19A 6.27 6.16 6.10
19B
19C
20A 6.38 6.39 7.13
20B 6.29 6.34 6.77
21 7.32 7.39 7.22
22A 6.15 5.98 6.25
22B 4.71 4.70 4.97
23 6.87 6.94 7.07
24 6.00 6.04 5.96
25
26A 7.41 7.34 7.24
26B 6.12 6.07 6.04
27 6.54 6.61 6.60
28A 7.31 7.11 7.11
28B 6.50 6.69 6.21
29 6.30 6.35 6.31
30A 7.57 7.73 7.62
30B 6.03 6.23 6.21
31 6.55 6.45 6.34
32 6.94 6.92 6.90

WHO/BS/10.2138
Page 21
Table 10. Laboratory Estimates of Potency Relative to S4 from Qualitative Assays log10
IU/mL taking Sample 4 as 107 (7.0 log10 ) IU/mL.
Sample Laboratory
S1 S2 S3
05 5.47 5.61 5.61
10 6.87 6.70 6.94
24 5.80 5.67 5.86
25 6.12 6.58 6.12
31 6.64 5.97 5.68
Table 11. Overall Mean Estimates and Inter-Laboratory Variation for Potency Relative to
Sample 4 log10 IU/mL taking Sample 4 as 107 (7.0 log10 ) IU/mL.
Sample Assay No.
data sets Mean SD %GCV Min Max
qualitative 5 6.18 0.58 280 5.47 6.87
quantitative 48 6.58 0.64 341 4.71 7.59 S1
combined 53 6.54 0.64 340 4.71 7.59
qualitative 5 6.10 0.51 221 5.61 6.70
quantitative 48 6.59 0.64 333 4.70 7.73 S2
combined 53 6.54 0.64 334 4.70 7.73
qualitative 5 6.04 0.54 246 5.61 6.94
quantitative 47 6.60 0.63 325 4.97 7.68 S3
combined 52 6.54 0.64 334 4.97 7.68

WHO/BS/10.2138
Page 22
Table 12. Intra-Laboratory standard deviation of log10 ‘copies/mL’ and %GCV for quantitative
assays. Samples 1-3 Sample 4 Participant
SD %GCV SD %GCV
01 0.12 33 0.13 35
02A 0.10 27 0.07 17
02B 0.09 23 - -
03 0.10 24 0.13 35
04 0.10 25 - -
05 0.13 34 0.04 10
06 0.08 21 0.31 103
07 0.12 32 0.11 30
08 0.10 27 0.09 23
09A 0.10 27 0.12 32
09B 0.06 14 0.14 38
09C 0.09 23 0.07 18
09D 0.11 30 0.10 27
09E 0.06 16 0.12 32
09F 0.09 23 0.16 44
09G 0.05 12 0.07 18
09H 0.08 19 0.11 28
09I 0.10 25 0.07 18
09J 0.13 35 0.23 68
09K 0.08 20 0.12 32
09L 0.09 22 0.16 44
09M 0.07 18 0.07 18
09N 0.12 31 0.11 28
11 0.01 3 0.09 24
12A 0.22 66 0.22 65
12B 0.03 6 0.16 44
13 0.11 28 0.32 108
14 0.03 6 0.13 35
15 0.05 12 0.05 13
16 - - - -
17 0.17 48 0.08 20
18 0.05 12 0.09 24
19A 0.08 20 0.07 18
19B 0.15 42 - -
19C 0.06 15 - -
20A 0.16 45 0.30 97
20B 0.12 33 0.07 18
21 0.09 24 0.37 134
22A 0.36 132 0.06 14
22B 0.16 45 0.05 12
23 0.06 14 0.13 35
24 0.08 21 0.29 96
25 0.05 11 - -
26A 0.07 16 0.50 215
26B 0.04 9 0.72 427
27 0.10 25 0.14 38
28A 0.05 13 0.02 5
28B 0.10 25 0.10 26
29 0.07 17 0.10 25
30A 0.24 72 0.17 47
30B 0.08 21 0.09 22
31 0.14 37 0.34 117
32 0.06 14 0.47 194
Mean 0.11 30 0.21 63
WHO/BS/10.2138
Page 23
Figure legends
Figure 1. Individual laboratory mean estimates for study samples 1-4 obtained using
qualitative or quantitative NAT assays. Each box represents the mean estimate from each
laboratory assay and is labelled with the laboratory code number. The results from the qualitative
assays are shaded in grey.
Figure 2. Relative potencies of samples 2-4 against sample 1, for each quantitative and
qualitative assay. Units are expressed as candidate log10 IU/mL in both cases. Each box
represents the relative potency for each laboratory assay and is labelled with the laboratory code
number. The results from the qualitative assays are shaded in grey.
Figure 3. Estimated concentrations of samples 1-3 expressed in IU, relative to sample 4, using
a hypothetical unitage of 107 IU/mL for sample 4. Each box represents the relative potency for
each laboratory assay and is labelled with the laboratory code number. The results from the
qualitative assays are shaded in grey.
WHO/BS/10.2138
Page 24
Figure 1
a
Sample 1
0
2
4
6
8
10
12
14
16
18
20
22
24
26
28
30
32
34
36
38
40
NAT Detectable Units/ml or copies/ml (log10)
4.0 4.5 5.0 5.5 6.0 6.5 7.0 7.5 8.0 8.5 9.0
05 05
13
02A
07
16
22A
22B
24
24
25
03
06
12A
12B
18
20B
31
31
10
19B
20A
28B
08
09A
09D
09I
09J
14
17
19A
19C
26A
28A
30A
01
02B
09C
09K
09M
09N
11
15
23
25
26B
29
30B
04
09B
09E
09F
09G
09H
09L
27
21
32
WHO/BS/10.2138
Page 25
b
Sample 2
0
2
4
6
8
10
12
14
16
18
20
22
24
26
28
30
32
34
36
38
40
NAT Detectable Units/ml or copies/ml (log10)
4.0 4.5 5.0 5.5 6.0 6.5 7.0 7.5 8.0 8.5 9.0
05
16
31
13
22A
24
05
07
18
22B
02A
03
06
12B
20B
24
31
09D
10
12A
19A
19B
19C
20A
25
09A
09I
09N
14
15
17
26A
28A
28B
30A
01
02B
08
09C
09H
09J
09K
09M
11
23
25
26B
04
09B
09E
09L
27
29
30B
09F
09G
21
32
WHO/BS/10.2138
Page 26
c
Sample 3
0
2
4
6
8
10
12
14
16
18
20
22
24
26
28
30
32
34
36
38
40
NAT Detectable Units/ml or copies/ml (log10)
4.0 4.5 5.0 5.5 6.0 6.5 7.0 7.5 8.0 8.5 9.0
31 05 13 02A
03
05
07
12A
18
22A
24
24
25
31
06
19B
22B
28B
09D
10
12B
19A
19C
08
09A
09C
09I
09J
09N
14
15
17
20B
25
26A
28A
30A
01
02B
04
09B
09H
09K
09M
11
26B
29
09E
09G
09L
20A
21
23
27
30B
09F
32

WHO/BS/10.2138
Page 27
d
Sample 4
0
2
4
6
8
10
12
14
16
18
20
22
24
26
28
30
32
34
36
38
40
NAT Detectable Units/ml or copies/ml (log10)
4.0 4.5 5.0 5.5 6.0 6.5 7.0 7.5 8.0 8.5 9.0
13 18 30A 07
12B
26A
28A
31
06
09D
09H
09J
09N
10
15
22A
25
31
05
16
20B
23
24
28B
01
03
05
09A
09B
09C
09E
09F
09G
09I
09K
09L
09M
11
14
19A
20A
21
24
12A
32
02A
17
27
29
26B
30B
22B 08
WHO/BS/10.2138
Page 28
Figure 2
a
Sample 2 - Relative to Sample 1
0
2
4
6
8
10
12
14
16
18
20
22
24
26
28
30
32
34
36
38
40
Candidate IU/ml (log10)
4.5 5.0 5.5 6.0 6.5 7.0 7.5 8.0 8.5 9.0 9.5
31 16 04
09H
09N
10
15
18
19A
19C
22A
24
25
28A
31
01
02A
02B
03
05
06
07
08
09A
09B
09C
09D
09E
09F
09G
09I
09J
09K
09L
09M
11
12A
12B
13
14
17
19B
20A
20B
21
22B
23
24
26A
26B
27
29
30A
32
05
28B
30B
25

WHO/BS/10.2138
Page 29
b
Sample 3 - Relative to Sample 1
0
2
4
6
8
10
12
14
16
18
20
22
24
26
28
30
32
34
36
38
40
Candidate IU/ml (log10)
4.5 5.0 5.5 6.0 6.5 7.0 7.5 8.0 8.5 9.0 9.5
31 02A
03
04
06
09A
09B
09C
09D
09N
12A
15
18
19A
19B
19C
21
25
26A
26B
28A
28B
31
01
02B
05
07
08
09E
09F
09G
09H
09I
09J
09K
09L
09M
10
11
13
14
17
22A
24
24
25
27
29
30A
32
05
12B
22B
23
30B
20B 20A

WHO/BS/10.2138
Page 30
c
Sample 4 - Relative to Sample 1
0
2
4
6
8
10
12
14
16
18
20
22
24
26
28
30
32
34
36
38
40
Candidate IU/ml (log10)
4.5 5.0 5.5 6.0 6.5 7.0 7.5 8.0 8.5 9.0 9.5
13 18
26A
30A
09F
09G
09H
09J
09L
15
21
28A
09B
09C
09D
09E
09K
09M
09N
10
11
23
32
01
12B
31
06
07
09A
09I
14
20A
27
28B
31
19A
20B
22A
25
26B
29
03
12A
16
17
24
30B
24 05
05
02A 08 22B
WHO/BS/10.2138
Page 31
Figure 3
a
Sample 1 - Relative to Sample 4
0
2
4
6
8
10
12
14
16
18
20
22
24
26
28
30
32
34
36
38
40
Candidate IU/ml (log10)
4.0 4.5 5.0 5.5 6.0 6.5 7.0 7.5 8.0 8.5 9.0
22B 08 02A 05
05
24 03
12A
16
17
24
25
26B
30B
19A
20B
22A
29
06
07
09A
09I
14
20A
27
28B
31
01
09C
09D
09K
09M
10
11
12B
23
31
09B
09E
09G
09J
09N
32
09F
09H
09L
15
18
21
28A
13
26A
30A

WHO/BS/10.2138
Page 32
b
Sample 2 - Relative to Sample 4
0
2
4
6
8
10
12
14
16
18
20
22
24
26
28
30
32
34
36
38
40
Candidate IU/ml (log10)
4.0 4.5 5.0 5.5 6.0 6.5 7.0 7.5 8.0 8.5 9.0
22B 08 02A 05 05
16
24
03
12A
17
22A
24
26B
31
19A
20B
29
30B
06
07
09A
09I
14
20A
25
27
31
01
09B
09C
09D
09K
09N
10
12B
28B
09E
09M
11
23
28A
32
09F
09G
09H
09J
09L
15
18
26A
21 13
30A
WHO/BS/10.2138
Page 33
c
Sample 3 - Relative to Sample 4
0
2
4
6
8
10
12
14
16
18
20
22
24
26
28
30
32
34
36
38
40
Candidate IU/ml (log10)
4.0 4.5 5.0 5.5 6.0 6.5 7.0 7.5 8.0 8.5 9.0
08
22B
02A 05
12A
05
24
31
03
17
19A
24
25
26B
06
22A
28B
29
30B
31
07
09A
09C
09I
14
27
01
09B
09D
09K
20B
09E
09J
09M
09N
10
11
12B
23
28A
32
09F
09G
09H
09L
15
18
20A
21
26A
30A 13
WHO/BS/10.2138
Page 34
Appendix 1
Collaborative study participants (In alphabetical order by country)
Name Laboratory Country
Prof. Dr. Harald Kessler Mol. Diagnostics Lab / IHMEM / Medical Univ. of
Graz, Graz
Austria
Prof. William Rawlinson Virology Division, SEALS Microbiology, Randwick Australia
Dr Guy Boivin Centre de recherché en infectiologie-CHUQ, Québec Canada
Dr Jutta Preiksaitis
Dr Xiao-Li Pang
Provincial Laboratory for Public Health / University of
Alberta, Alberta
Canada
Côme Barranger Argene SA, Verniolle France
Dr Sophie Alain French National Reference Centre for Cytomegalovirus,
Limoges
France
Dr Céline Bressollette-Bodin Virology Laboratory, Nantes University Hospital,
Nantes
France
Prof. Dr. Klaus Hamprecht Institute of Medical Virology, University Hospital of
Tübingen, Tübingen
Germany
Dr Thomas Grewing QIAGEN Hamburg GmbH, Hamburg Germany
Dr Pantelis Constantoulakis Locus Medicus SA, Athens Greece
Dr Valeria Ghisetti Laboratory of Microbiology and Virology, Amedeo di
Savoia Hospital,
Turin
Italy
Dr Maria R Capobianchi
Dr Isabella Abbate
Laboratory of Virology, National Institute for Infectious
Diseases "L. Spallanzani", Rome
Italy
Dr Cristina Olivo Nanogen Advanced Diagnostics, Buttigliera Alta Italy
Dr Tiziana Lazzarotto Operative Unit of Microbiology, Laboratory of
Virology, Bologna
Italy
Dr Fausto Baldanti Molecular Virology Unit, Virology and Microbiology,
Fondazione IRCCS Policlinico San Matteo, Pavia
Italy
Dr Naoki Inoue Laboratory of Herpesviruses, Department of Virology I,
National Institute of Infectious Diseases, Tokyo
Japan
Prof. Fredrik Müller Department of Microbiology, Oslo University Hospital,
Rikshospitalet,
Norway
Dr Craig Corcoran Ampath Pathology Laboratories,
Pretoria
South Africa
Dr Diana Hardie Diagnostic Virology Laboratory Groote Schuur
Hospital, Cape Town
South Africa
Dr Jacqueline Prieto Cepheid AB, Bromma Sweden
Dr Rob Schuurman
Dr Anton van Loon
University Medical Center Utrecht, Dept. Virology,
Utrecht
The Netherlands
Dr Shiaolan Ho Abbott Molecular, Inc., Des Plaines USA
Dr David Hillyard ARUP Laboratories, Inc. (University of Utah
enterprise), Salt Lake City
USA
Dr Richard Hodinka Clinical Virology Laboratory, Children’s Hospital of
Philadelphia, Philadelphia
USA
Dr Marie Louise Landry Clinical Virology Laboratory, Yale New Haven
Hospital, New Haven
USA
Dr Angela Caliendo Emory University Hospital, Altanta USA
Dr Nell Lurain NIH/DAIDS/NIAID Viral Quality Assurance
Laboratory, Rush University Medical Center, Chicago
USA
Dr Lee Sung Roche Molecular Systems Inc., Pleasanton USA
Dr Margaret Gulley University of North Carolina, Chapel Hill USA
Claire Atkinson Department of Virology, Royal Free Hospital, London UK
Dr Jon Bible GSTS Pathology, London UK
Dr Malcolm Guiver HPA Laboratory NorthWest, Department of Virology,
Manchester
UK

WHO/BS/10.2138
Page 35
Appendix 2
Study protocol

WHO/BS/10.2138
Page 36

WHO/BS/10.2138
Page 37

WHO/BS/10.2138
Page 38

WHO/BS/10.2138
Page 39
Appendix 3
Proposed instructions for use
WHO/BS/10.2138
Page 40
= = =