whole-genome analysis of mrna decay in plasmodium ...derisilab.ucsf.edu/pdfs/jshock_2007.pdf ·...
TRANSCRIPT
com
ment
reviews
reports
deposited research
refereed researchinteractio
nsinfo
rmatio
n
Open Access2007Shocket al.Volume 8, Issue 7, Article R134ResearchWhole-genome analysis of mRNA decay in Plasmodium falciparum reveals a global lengthening of mRNA half-life during the intra-erythrocytic development cycleJennifer L Shock*, Kael F Fischer* and Joseph L DeRisi*†
Addresses: *Department of Biochemistry and Biophysics, University of California San Francisco, 1700 4th Street, San Francisco, California 94158-2330, USA.. †Howard Hughes Medical Institute, Jones Bridge Road, Chevy Chase, Maryland 20815-6789, USA..
Correspondence: Joseph L DeRisi. Email: [email protected]
© 2007 Shock et al.; licensee BioMed Central Ltd. This is an open access article distributed under the terms of the Creative Commons Attribution License (http://creativecommons.org/licenses/by/2.0), which permits unrestricted use, distribution, and reproduction in any medium, provided the original work is properly cited.Bias in tree reconciliation methods<p>A consistent bias in tree reconciliation methods is described that occurs when the inferred gene tree is not correct, casting doubt on previous conclusions about ancient duplications and losses in vertebrate genome history.</p>
Abstract
Background: The rate of mRNA decay is an essential element of post-transcriptional regulationin all organisms. Previously, studies in several organisms found that the specific half-life of eachmRNA is precisely related to its physiologic role, and plays an important role in determining levelsof gene expression.
Results: We used a genome-wide approach to characterize mRNA decay in Plasmodium falciparum.We found that, globally, rates of mRNA decay increase dramatically during the asexual intra-erythrocytic developmental cycle. During the ring stage of the cycle, the average mRNA half-lifewas 9.5 min, but this was extended to an average of 65 min during the late schizont stage ofdevelopment. Thus, a major determinant of mRNA decay rate appears to be linked to the stage ofintra-erythrocytic development. Furthermore, we found specific variations in decay patternssuperimposed upon the dominant trend of progressive half-life lengthening. These variations indecay pattern were frequently enriched for genes with specific cellular functions or processes.
Conclusion: Elucidation of Plasmodium mRNA decay rates provides a key element for decipheringmechanisms of genetic control in this parasite, by complementing and extending previous mRNAabundance studies. Our results indicate that progressive stage-dependent decreases in mRNAdecay rate function are a major determinant of mRNA accumulation during the schizont stage ofintra-erythrocytic development. This type of genome-wide change in mRNA decay rate has notbeen observed in any other organism to date, and indicates that post-transcriptional regulation maybe the dominant mechanism of gene regulation in P. falciparum.
BackgroundPlasmodium falciparum is the most deadly of the four Plas-modia spp. that cause human malaria, and it is responsiblefor more than 500 million clinical episodes and 1 milliondeaths per year [1]. Because of increasing worldwide resist-
ance to the most affordable and accessible antimalarial drugs,this number is expected to increase in the near future. In fact,deaths from malaria have increased over the past 6 years,despite a global health initiative designed to halve the burdenof malaria by 2010 [2]. Gaining a more thorough
Published: 7 August 2007
Genome Biology 2007, 8:R134 (doi:10.1186/gb-2007-8-7-r134)
Received: 19 March 2007Accepted: 5 July 2007
The electronic version of this article is the complete one and can be found online at http://genomebiology.com/2007/8/7/R134
Genome Biology 2007, 8:R134
R134.2 Genome Biology 2007, Volume 8, Issue 7, Article R134 Shock et al. http://genomebiology.com/2007/8/7/R134
understanding of the molecular biology of P. falciparum is animportant step toward the identification of new drug and vac-cine targets.
The P. falciparum 48-hour asexual intra-erythrocytic devel-opment cycle (IDC) is characterized by the progression of theparasite through several distinct morphologic stages: ring,trophozoite, and schizont. Each cycle begins with invasion ofan erythrocyte by a merozoite, followed by the remodeling ofthe host cell in the ring stage. The parasite then progressesinto the trophozoite stage, where it continues to grow and ishighly metabolically active. Finally, in the schizont stage, theparasite prepares for the next round of invasion by replicatingits DNA and packaging merozoites.
The completion of the P. falciparum genome sequence repre-sents a milestone in our understanding of this parasite andsubsequently enabled numerous genomic and proteomicprojects [3]. In previously reported work, our laboratoryexhaustively profiled genome-wide mRNA abundance at a 1-hour time resolution throughout the IDC for three separatestrains of P. falciparum [4,5]. Analysis of the IDC transcrip-tome revealed a cascade of highly periodic gene expression,unlike that seen in any other organism studied to date. Littleis known about how this unique pattern of regulation is estab-lished or maintained.
The relative abundance of mRNA, as measured by conven-tional expression profiling, is a result of the rate at which eachmessage is produced, offset by the rate at which each messageis degraded. When compared with organisms with similargenome sizes, the P. falciparum genome appears to encodeonly about one-third the number of proteins associated withtranscription [6]. Given this apparent lack of a full transcrip-tional control repertoire, unexpected post-transcriptionalmechanisms, including mRNA decay, may contribute signifi-cantly to gene regulation.
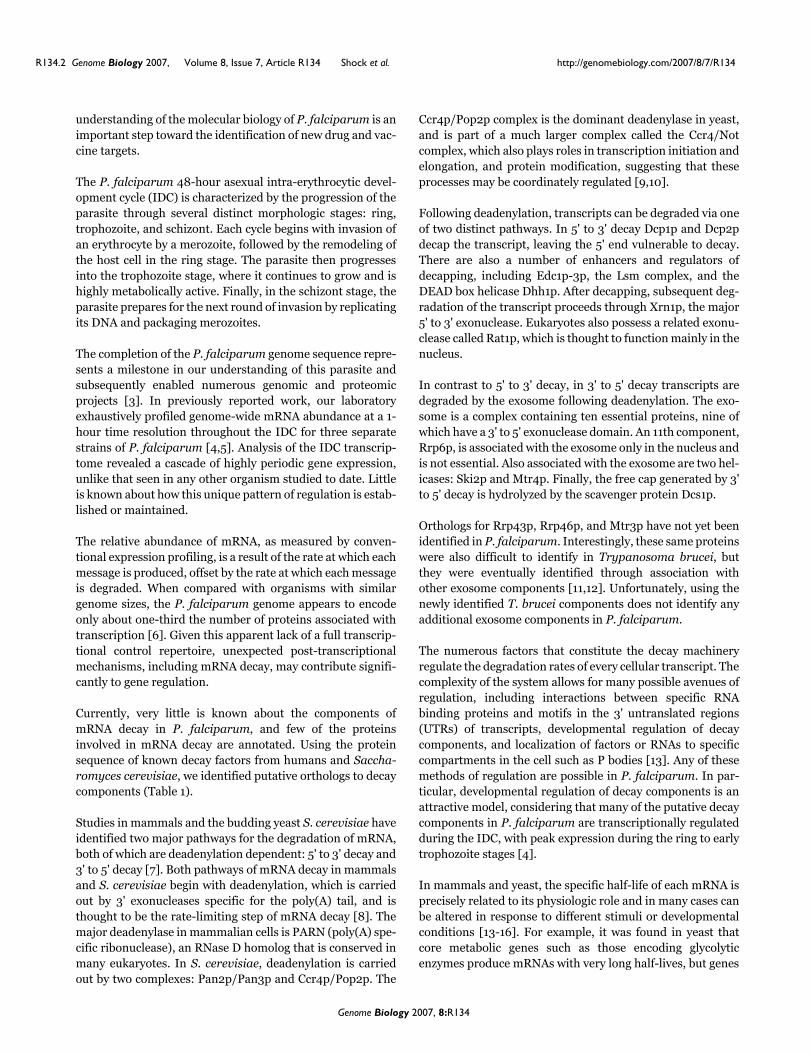
Currently, very little is known about the components ofmRNA decay in P. falciparum, and few of the proteinsinvolved in mRNA decay are annotated. Using the proteinsequence of known decay factors from humans and Saccha-romyces cerevisiae, we identified putative orthologs to decaycomponents (Table 1).
Studies in mammals and the budding yeast S. cerevisiae haveidentified two major pathways for the degradation of mRNA,both of which are deadenylation dependent: 5' to 3' decay and3' to 5' decay [7]. Both pathways of mRNA decay in mammalsand S. cerevisiae begin with deadenylation, which is carriedout by 3' exonucleases specific for the poly(A) tail, and isthought to be the rate-limiting step of mRNA decay [8]. Themajor deadenylase in mammalian cells is PARN (poly(A) spe-cific ribonuclease), an RNase D homolog that is conserved inmany eukaryotes. In S. cerevisiae, deadenylation is carriedout by two complexes: Pan2p/Pan3p and Ccr4p/Pop2p. The
Ccr4p/Pop2p complex is the dominant deadenylase in yeast,and is part of a much larger complex called the Ccr4/Notcomplex, which also plays roles in transcription initiation andelongation, and protein modification, suggesting that theseprocesses may be coordinately regulated [9,10].
Following deadenylation, transcripts can be degraded via oneof two distinct pathways. In 5' to 3' decay Dcp1p and Dcp2pdecap the transcript, leaving the 5' end vulnerable to decay.There are also a number of enhancers and regulators ofdecapping, including Edc1p-3p, the Lsm complex, and theDEAD box helicase Dhh1p. After decapping, subsequent deg-radation of the transcript proceeds through Xrn1p, the major5' to 3' exonuclease. Eukaryotes also possess a related exonu-clease called Rat1p, which is thought to function mainly in thenucleus.
In contrast to 5' to 3' decay, in 3' to 5' decay transcripts aredegraded by the exosome following deadenylation. The exo-some is a complex containing ten essential proteins, nine ofwhich have a 3' to 5' exonuclease domain. An 11th component,Rrp6p, is associated with the exosome only in the nucleus andis not essential. Also associated with the exosome are two hel-icases: Ski2p and Mtr4p. Finally, the free cap generated by 3'to 5' decay is hydrolyzed by the scavenger protein Dcs1p.
Orthologs for Rrp43p, Rrp46p, and Mtr3p have not yet beenidentified in P. falciparum. Interestingly, these same proteinswere also difficult to identify in Trypanosoma brucei, butthey were eventually identified through association withother exosome components [11,12]. Unfortunately, using thenewly identified T. brucei components does not identify anyadditional exosome components in P. falciparum.
The numerous factors that constitute the decay machineryregulate the degradation rates of every cellular transcript. Thecomplexity of the system allows for many possible avenues ofregulation, including interactions between specific RNAbinding proteins and motifs in the 3' untranslated regions(UTRs) of transcripts, developmental regulation of decaycomponents, and localization of factors or RNAs to specificcompartments in the cell such as P bodies [13]. Any of thesemethods of regulation are possible in P. falciparum. In par-ticular, developmental regulation of decay components is anattractive model, considering that many of the putative decaycomponents in P. falciparum are transcriptionally regulatedduring the IDC, with peak expression during the ring to earlytrophozoite stages [4].
In mammals and yeast, the specific half-life of each mRNA isprecisely related to its physiologic role and in many cases canbe altered in response to different stimuli or developmentalconditions [13-16]. For example, it was found in yeast thatcore metabolic genes such as those encoding glycolyticenzymes produce mRNAs with very long half-lives, but genes
Genome Biology 2007, 8:R134
http://genomebiology.com/2007/8/7/R134 Genome Biology 2007, Volume 8, Issue 7, Article R134 Shock et al. R134.3
com
ment
reviews
reports
refereed researchdepo
sited researchinteractio
nsinfo
rmatio
n
Table 1
Putative decay components in Plasmodium falciparum were identified using known factors from human and yeast
Components Gene PlasmoDB ID Description
Deadenylation Ccr4 PFE0980c† Catalytic subunit of the Ccr4/Pop2 deadenylase complex
Pop2 MAL8P1.104† Component of the Ccr4/Pop2 deadenylase complex
Not1 PF11_0049† Component of the Ccr4/Not complex
Not2 PF11_0297† Component of the Ccr4/Not complex
Not3 ? Component of the Ccr4/Not complex
Not4 PFL1705w† Component of the Ccr4/Not complex
Not5 PF10_0062† Component of the Ccr4/Not complex
Caf130 ? Component of the Ccr4/Not complex
Caf40 PFE0375w Component of the Ccr4/Not complex
PARN PF14_0413*† Major deadenylase in mammals
Pab1 PFL1170w PolyA binding protein
Pan2 ? Component of the Pan2/Pan3 deadenylase complex
Pan2 ? Component of the Pan2/Pan3 deadenylase complex
Decapping Dcp1 PF10_0314*† Component of the Dcp1/Dcp2 decapping complex
Dcp2 Pf13_0048† Catalytic subunit of the Dcp1/Dcp2 decapping complex
DcpS/Dcs1 ? Scavenger decapping enzyme
Dhh1 PFC0915w Helicase-roles in deadenylation and decapping
Lsm1 PF11_0255† Involved in decapping
Lsm2 PFE1020w Involved in decapping
Lsm3 PF08_0049 Involved in decapping
Lsm4 PF11_0524 Involved in decapping
Lsm5 PF14_0411 Involved in decapping
Lsm6 PF13_0142 Involved in decapping
Lsm7 PFL0460w Involved in decapping
Exosome Csl4 MAL7P1.104 Exosome subunit
Dis3/Rrp44 MAL13P1.289† Exosome subunit-RNase II domain
Mtr3 ? Exosome subunit-RNase PH domain
Rrp4 PFD0515w Exosome subunit-hydrolytic exonuclease
Rrp40 MAL13P1.36† exosome subunit-hydrolytic exonuclease
Rrp42 MAL13P1.204† Exosome subunit-RNase PH domain
Rrp43 ? Exosome subunit-RNase PH domain
Rrp45 PF13_0340 Exosome subunit-RNase PH domain
Rrp46 ? Exosome subunit-RNase PH domain
Rrp6 PF14_0473 Exosome subunit found only in the nucleus
Ski2 PFI0480w Helicase associated with the exosome and Ski complex
Ski3/Ski5 ? Associated with exosome and Ski complex
Ski6/Rrp41 PF14_0256 Exosome subunit-RNase PH domain
Ski7 ? Associated with exosome and Ski complex
Ski8 ? Associated with exosome and Ski complex
5' to 3' decay Xrn1 PFI0455w/PF11_0074† 5' to 3' exonuclease-cytoplasmic
Rat1 PFI0455w/PF11_0074† 5' to 3' exonuclease-nuclear
Orthologs were identified using a simple reciprocal best BLASTP match between Plasmodium falciparum and Saccharomyces cerevisiae and between P. falciparum and human sequences. Orthologs could not be found for those genes with question marks. *Components identified only when the human sequence was used for the query sequence. †P. falciparum proteins that either are described in PlasmoDB as hypothetical proteins or, in the case of PF10_0314, are assigned a function other than the one relevant here.
Genome Biology 2007, 8:R134

R134.4 Genome Biology 2007, Volume 8, Issue 7, Article R134 Shock et al. http://genomebiology.com/2007/8/7/R134
encoding components of the mating type signaling pathwayproduce mRNAs with very short half-lives.
Thus far, decay rates have not been determined for any P. fal-ciparum transcripts, and neither have any of the mRNAdecay components been genetically or biochemically charac-terized. Given that mRNA decay is an integral component ofgene expression regulation, we conducted a genome-widestudy of mRNA decay in P. falciparum using a microarray-based approach to measure mRNA half-life as a function ofthe IDC. Interestingly, we found that a major determinant ofmRNA decay rate appears to be tightly linked to IDC, and to alesser extent the functional category of the mRNAs them-selves. Decay rates in the early hours after invasion are rapidand tightly distributed, but by the end of the cycle globaldecay rates decrease considerably, causing a lengthening ofhalf-lives. An analogous genome-wide change in mRNAdecay rate during a development cycle has not been observedin any other organism to date.
ResultsOverview of the dataTo explore the role of mRNA decay during the IDC of P. falci-parum, we used microarrays to determine decay rates on agenome-wide scale at four distinct stages. Using aliquotsfrom a single synchronized culture of 3D7 strain parasites(sequenced strain), transcription was inhibited and total RNAwas harvested for microarray hybridization. Transcriptionalshut off was achieved by addition of actinomycin D (actD),which is known to intercalate into DNA and inhibit DNA-dependant RNA polymerases [17]. ActD has also been shownpreviously to inhibit P. falciparum transcription strongly in a
dose-dependent manner, with little or no RNA synthesis seenat higher drug concentrations [18]. We further confirmedtranscription inhibition in our own experimental conditionsthrough nuclear run-on experiments using synchronous cul-tures in the ring and late schizont stages, and we note that thedegree of relative transcriptional inhibition was approxi-mately equal between ring and schizont stage parasites (Fig-ure 1). Although some residual labeling of nuclear run-onRNA was observed after treatment with actD in both stages,any remaining transcriptional activity over the course of theexperiment is not anticipated to affect the determination ofthe decay rate (see Materials and methods, below). Althoughit remains a formal possibility that treatment with actD couldalter the activity of decay processes through indirect or sec-ondary effects, no such effects have been reported in otherorganisms to our knowledge.
Nuclear run-on analysis shows that actD halts transcription in Plasmodium falciparumFigure 1Nuclear run-on analysis shows that actD halts transcription in Plasmodium falciparum. Actinomycin D (actD) was added to synchronous cultures in the ring and late schizont stages. Time points were then taken before addition of actD and then at 0, 7.5, and 15 min intervals after addition of drug. The samples were normalized such that the no actD sample was normalized to 100% transcription.
0
0.2
0.4
0.6
0.8
1.0
No actD actD 0' actD 7.5' actD 15'
RingLate schizont
Transcription inhibition using actinomycin D
Per
cent
tran
scrip
tion
Schematic of the microarray experiment to determine half-lives through the life cycleFigure 2Schematic of the microarray experiment to determine half-lives through the life cycle. Four separate time course experiments were conducted at 12-hour intervals using a single source culture of synchronized parasites. Numbers in red represent the hour after invasion when actD was added in relationship to the previously published transcriptome experiment. Total RNA was subsequently harvested at the indicated time points. These samples were reverse transcribed into cDNA and hybridized to DNA microarrays. Specific spiked controls were included to determine correct normalization during microarray scanning.
31 hours
0'
actinomycin D
5' 10'15'30' 60' 120' 240'
5'0'+ActD-ActD
0' 10' 15' 30' 60' 120' 240'
Trophozoite
SchizontR
ing
48Hours
Total RNA isolation microarray hybridization
Each RNA decay timecourse
20 hours44 hours
10 h
ours
Genome Biology 2007, 8:R134
http://genomebiology.com/2007/8/7/R134 Genome Biology 2007, Volume 8, Issue 7, Article R134 Shock et al. R134.5
com
ment
reviews
reports
refereed researchdepo
sited researchinteractio
nsinfo
rmatio
n
For each of the four decay time courses, an initial sample washarvested immediately before addition of drug, followed byeight more samples at intervals from 0 to 240 min (Figure 2).Each sample was mixed with a reference pool and applied toa 70 mer DNA oligonucleotide microarray in a standard two-color competitive hybridization [19]. This experiment wasrepeated every 12 hours throughout the IDC, starting in thering stage. A Pearson correlation was used to compare thezero minute (untreated cells) results at each of the four stageswith the previously characterized 48-hour transcriptome ofthe HB3 strain [4]. The highest correlations between thedecay experiments and the transcriptome data were at 10, 20,31, and 44 hours after invasion, corresponding to the ring,trophozoite, schizont, and late schizont stages, respectively (r= 0.79, 0.80, 0.67, and 0.73, respectively). The hours of peakcorrelation for subsequent time points in each of the four sep-arate time courses were unchanged, although the actual cor-relation value progressively decreased, consistent with globaltranscriptional shutoff at each stage. Using RNA samplesfrom the same experiment, each microarray hybridizationwas performed at least twice, and in most cases three times.
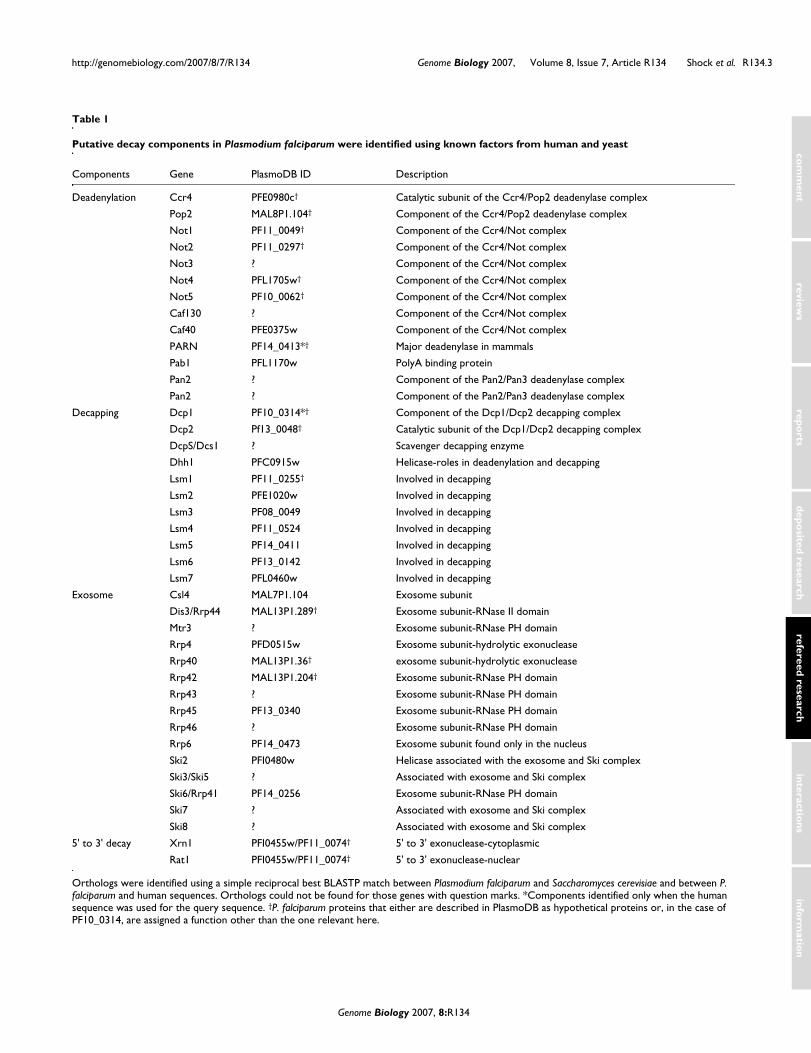
The data from each series of microarrays were fit to an expo-nential decay curve using nonlinear least squares fit, and thehalf-life was calculated for the transcript hybridized to eacholigo at each of the four stages analyzed (Additional data file1). Figure 3 shows arbitrarily chosen examples of decay curvesfor four individual transcripts, each at one of the four stages.A set of 6,225 oligos (representing 4,783 genes) passed ourquality control filters and had a fit decay curve for at least onestage (see Materials and methods, below). Of these, 3,903 oli-gos (representing 2,744 genes) had a calculated half-life forall four stages. The decay curves for these genes are availableat the DeRisi laboratory malaria database [20]. Those oligosthat did not pass the quality control filters are listed in Addi-tional data file 2.
Calculated half-lives ranged from 1 min to longer than 138min, which was the maximum half-life that could be reliablyfit given that each time course was terminated at 240 minafter addition of actD. As previously noted, we cannot rule outlow levels of ongoing transcription after the addition of drug,but an ongoing zero-order process would not affect our fittedhalf-lives (see Materials and methods, below). Because manygenes are represented by more than one oligo, it is possible touse this information to corroborate internally the microarraymeasurement and calculation of half-lives. In general, half-
Figure 3
Time (minutes)
26S proteasome subunitt1/2 26.3 minutes
PFC0520w (oligo C345)
0
0.2
0.4
0.6
0 50 100 150 200 250
Rat
io
DHFR-TSt1/2 >138 minutes
PFD0830w (oligo oPFD66954)
0
0.2
0.4
0.6
0.8
0 50 100 150 200 250
Rat
io
Cell cycle control proteint1/2 4.5 minutes
PF07_0091 (oligo E26598_3)
0
0.2
0.6
1
1.4
0 50 100 150 200 250
Rat
io
Ribosomal proteint1/2 20.5 minutes
PFC0520w (oligo C191)
0
0.5
1
1.5
2
2.5
3
0 50 100 150 200 250
Rat
io
Late schizont
Schizont
Trophozoite
RingExamples of mRNA decay profiles for each stage determined by microarray analysisFigure 3Examples of mRNA decay profiles for each stage determined by microarray analysis. Four example genes were chosen to demonstrate the range of half-lives that can be measured in this experiment. The black dots represent data points from each of the microarray replicates for that time point, including the 0 time point with and without actinomycin D treatment. The colored lines represent the fitted decay curve. The half-life (t1/2) for each example is listed.
Genome Biology 2007, 8:R134
R134.6 Genome Biology 2007, Volume 8, Issue 7, Article R134 Shock et al. http://genomebiology.com/2007/8/7/R134
lives for oligos within a single open reading frame (ORF)agreed well (Table 2). For example, the average standarddeviation for half-lives in the ring stage was 9.9 min, whereasthe average standard deviation for half-lives of oligos within asingle ORF in the ring stage was 4.6 min. Depending on thestage, 13% to 17% of genes that have more than one oligo hadpoor intragenic correlations, with greater than two standarddeviation difference for oligos within a single ORF. There maybe underlying technical or biologic explanations for discrep-ancies in these genes. Because the vast majority of annotatedgenes in the P. falciparum genome exist only as gene modelswithout experimental validation, oligos thought to be com-
mon to a given gene may in fact be hybridizing to distincttranscripts. Furthermore, alternative splicing of transcriptsand bias in the directionality of decay may also result in poorintragenic correlations.
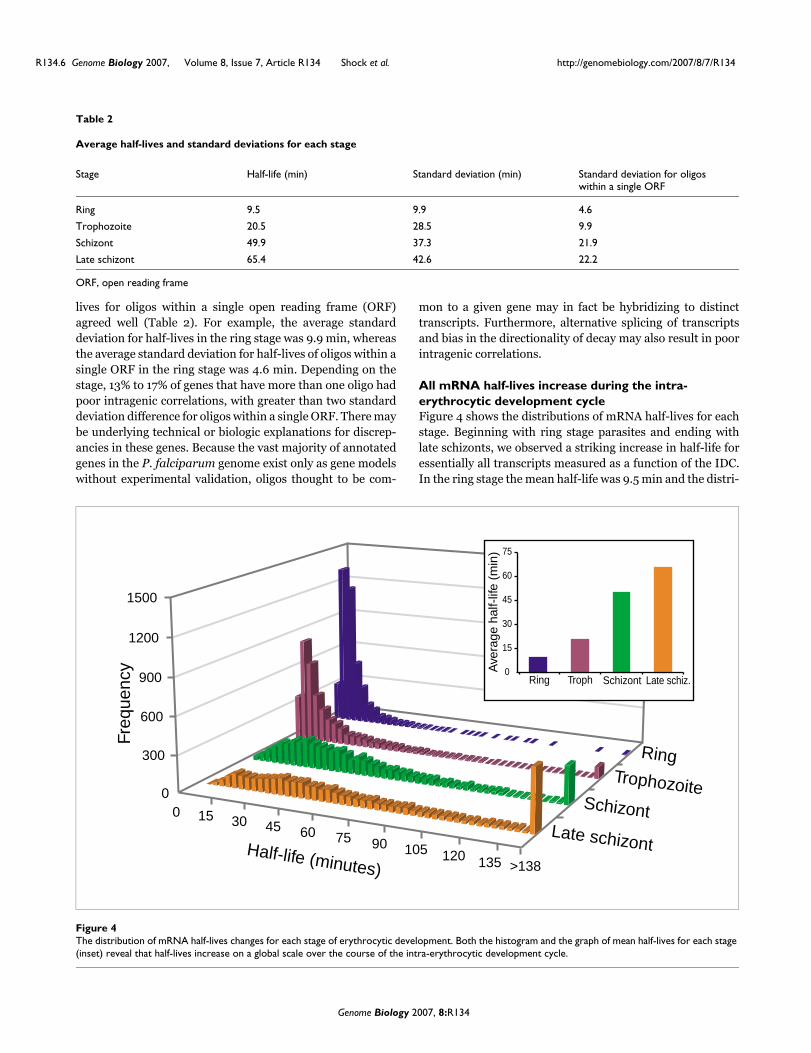
All mRNA half-lives increase during the intra-erythrocytic development cycleFigure 4 shows the distributions of mRNA half-lives for eachstage. Beginning with ring stage parasites and ending withlate schizonts, we observed a striking increase in half-life foressentially all transcripts measured as a function of the IDC.In the ring stage the mean half-life was 9.5 min and the distri-
Table 2
Average half-lives and standard deviations for each stage
Stage Half-life (min) Standard deviation (min) Standard deviation for oligos within a single ORF
Ring 9.5 9.9 4.6
Trophozoite 20.5 28.5 9.9
Schizont 49.9 37.3 21.9
Late schizont 65.4 42.6 22.2
ORF, open reading frame
The distribution of mRNA half-lives changes for each stage of erythrocytic developmentFigure 4The distribution of mRNA half-lives changes for each stage of erythrocytic development. Both the histogram and the graph of mean half-lives for each stage (inset) reveal that half-lives increase on a global scale over the course of the intra-erythrocytic development cycle.
0 15 30 45 60 75 90 105 120
0
300
600
900
1200
1500
Freq
uenc
y
Half-life (minutes)
Late schizont
Schizont
Trophozoite
Ring
Ring Troph
Ave
rage
hal
f-lif
e (m
in)
Schizont Late schiz.0
15
30
45
60
75
>138135
Genome Biology 2007, 8:R134
http://genomebiology.com/2007/8/7/R134 Genome Biology 2007, Volume 8, Issue 7, Article R134 Shock et al. R134.7
com
ment
reviews
reports
refereed researchdepo
sited researchinteractio
nsinfo
rmatio
n
bution of half-lives was very narrow, with a standard devia-tion of only 9.9 min (Table 2). In the later stages, the averagehalf-life progressively lengthened and the distribution pro-gressively widened. By the late schizont stage, the mean half-life for all transcripts had increased more than sixfold (65.4min) and the standard deviation had increased by fourfold(42.6 min). Although the scope of mRNA decay studies hasbeen limited to model systems or mammalian cells, this pro-gressive and dramatic shift in global mRNA decay rates as afunction of developmental cell cycle has not previously beenobserved in any other organism to date.
We compared half-life with ORF length and relative tran-script abundance and, as in yeast and mammalian cells, nostrong correlation was found. This indicates that mRNAdecay in P. falciparum is most likely a regulated processrather than a simple, basal degradation of all transcripts[14,21]. Although there exists a global trend in decay ratechange that is common to all genes, we sought to determinewhether individual patterns of rate change correlated withthe corresponding profile of steady-state abundance, meas-ured previously [5]. We found no significant correlationbetween the transcriptome phase of each gene (roughly, whenthe peak of expression occurs during the IDC) and its patternof half-life change (data not shown).
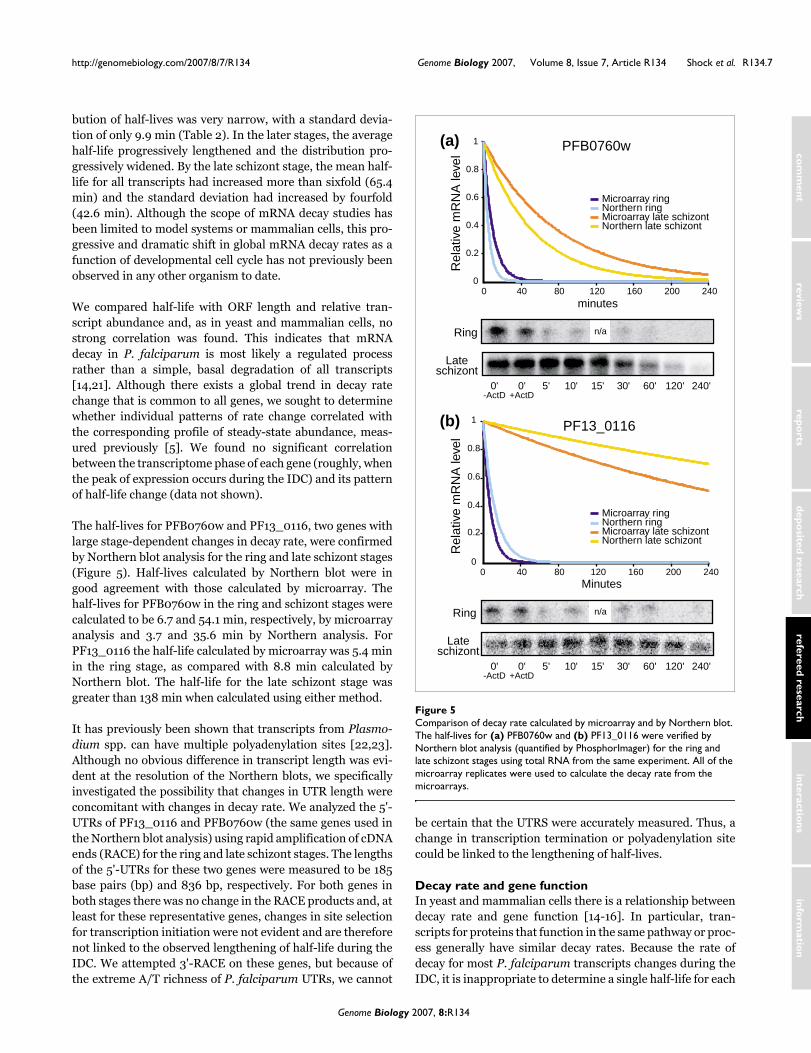
The half-lives for PFB0760w and PF13_0116, two genes withlarge stage-dependent changes in decay rate, were confirmedby Northern blot analysis for the ring and late schizont stages(Figure 5). Half-lives calculated by Northern blot were ingood agreement with those calculated by microarray. Thehalf-lives for PFB0760w in the ring and schizont stages werecalculated to be 6.7 and 54.1 min, respectively, by microarrayanalysis and 3.7 and 35.6 min by Northern analysis. ForPF13_0116 the half-life calculated by microarray was 5.4 minin the ring stage, as compared with 8.8 min calculated byNorthern blot. The half-life for the late schizont stage wasgreater than 138 min when calculated using either method.
It has previously been shown that transcripts from Plasmo-dium spp. can have multiple polyadenylation sites [22,23].Although no obvious difference in transcript length was evi-dent at the resolution of the Northern blots, we specificallyinvestigated the possibility that changes in UTR length wereconcomitant with changes in decay rate. We analyzed the 5'-UTRs of PF13_0116 and PFB0760w (the same genes used inthe Northern blot analysis) using rapid amplification of cDNAends (RACE) for the ring and late schizont stages. The lengthsof the 5'-UTRs for these two genes were measured to be 185base pairs (bp) and 836 bp, respectively. For both genes inboth stages there was no change in the RACE products and, atleast for these representative genes, changes in site selectionfor transcription initiation were not evident and are thereforenot linked to the observed lengthening of half-life during theIDC. We attempted 3'-RACE on these genes, but because ofthe extreme A/T richness of P. falciparum UTRs, we cannot
be certain that the UTRS were accurately measured. Thus, achange in transcription termination or polyadenylation sitecould be linked to the lengthening of half-lives.
Decay rate and gene functionIn yeast and mammalian cells there is a relationship betweendecay rate and gene function [14-16]. In particular, tran-scripts for proteins that function in the same pathway or proc-ess generally have similar decay rates. Because the rate ofdecay for most P. falciparum transcripts changes during theIDC, it is inappropriate to determine a single half-life for each
Comparison of decay rate calculated by microarray and by Northern blotFigure 5Comparison of decay rate calculated by microarray and by Northern blot. The half-lives for (a) PFB0760w and (b) PF13_0116 were verified by Northern blot analysis (quantified by PhosphorImager) for the ring and late schizont stages using total RNA from the same experiment. All of the microarray replicates were used to calculate the decay rate from the microarrays.
Ring
Lateschizont
minutes
PFB0760w(a)
0
0.2
0.4
0.6
0.8
1
0 40 80 120 160 200 240
Microarray ringNorthern ringMicroarray late schizontNorthern late schizont
PF13_0116
0
0.2
0.4
0.6
0.8
1
0 40 80 120 160 200 240Minutes
Ring
Lateschizont
(b)
Rel
ativ
e m
RN
A le
vel
Rel
ativ
e m
RN
A le
vel
Microarray ringNorthern ringMicroarray late schizontNorthern late schizont
n/a
n/a
5'0'+ActD-ActD
0' 10' 15' 30' 60' 120' 240'
5'0'+ActD-ActD
0' 10' 15' 30' 60' 120' 240'
Genome Biology 2007, 8:R134

R134.8 Genome Biology 2007, Volume 8, Issue 7, Article R134 Shock et al. http://genomebiology.com/2007/8/7/R134
transcript. However, we wished to investigate the possibilitythat the pattern of decay rate change could be used to parti-tion the dataset into distinct groups. We used k-means clus-tering of the half-lives for all four stages into ten groupsfollowed by Gene Ontology (GO) term analysis (GoStat) todetect enrichment of gene function or process (Figure 6) [24].We tested several different numbers of groups, and dividingthe data into ten groups best matches the natural structure ofthe data, and gives the lowest P values for the GO term analy-sis. To ensure that the clusters were not an artifact of thecyclic nature of steady-state expression in P. falciparum, wecompared the distributions of transcriptome phases, which
represent the stage of peak expression, for each group andfound no significant correlation (data not shown).
Although all ten groups have a pattern of increasing half-livesin which the late stage half-lives are longer than the ring stagehalf-lives, there are differences in the pattern and scale ofhalf-life increase. These differences are illustrated in the plotsshowing the average half-lives for each group and the increasein half-life from the ring to late schizont stage in Figure 6. Thedecay rate progressively decreases in each stage for six of theten groups. Of the four remaining groups, groups 8 and 9have trophozoite stage half-lives that are shorter than their
K-means clusters of the half-life data for each stageFigure 6K-means clusters of the half-life data for each stage. Genes were clustered into 10 k-means clusters using the log2 transformed half-life (t1/2; minutes) in each stage. The average half-life was used for genes represented by more than one oligo (see Materials and methods). In the plot to the right of each k-means cluster, the average decay profile for each group is displayed (red line) with the average decay profile for the entire dataset (gray line filled down). The x-axis represents the four stages progressing through the life cycle from rings to late schizonts. The y-axis represents half-life from 0 to 100 min. Δt1/
2 represents the average half-life difference between the late schizont stage and the ring stage for that group (late schizont half-life - ring half-life). On the right are the top two most significant Gene Ontology terms for each k-means cluster (GoStat was used for this analysis).
0 8
log2(half-life)
Δt1/2
31'1
2
3
4
5
6
7
8
9
10
66'
88'
72'
30'
46'
86'
34'
63'
54'
ribosome 1.28 x 10⁻¹⁶
protein biosynthesis 1.20 x 10⁻⁸
GO term P value
small ribosomal subunit 6.54 x 10⁻⁴
mutualism through parasitism 8.67 x 10⁻⁴
response to chemical stimulus 3.56 x 10⁻³
interaction with host 9.32 x 10⁻³
generation of precursor metabolites and energy 4.65 x 10⁻⁴
nucleolus 3.67 x 10⁻⁵
rRNA metabolism 1.89 x 10⁻⁴
RNA elongation 4.10 x 10⁻³
endopeptidase Clp activity 4.10 x 10⁻³
protein kinase activity 4.56 x 10⁻³
chromatin remodeling 4.58 x 10⁻³
potassium ion transport 2.18 x 10⁻³
none
host 3.28 x 10⁻⁵
antigenic variation 1.47 x 10⁻⁴
Ring Troph Schiz Late n=323
n=239
n=367
n=519
n=500
n=569
n=322
n=461
n=316
n=83
Genome Biology 2007, 8:R134
http://genomebiology.com/2007/8/7/R134 Genome Biology 2007, Volume 8, Issue 7, Article R134 Shock et al. R134.9
com
ment
reviews
reports
refereed researchdepo
sited researchinteractio
nsinfo
rmatio
n
ring stage half-lives, group 5 has late stage half-lives shorterthan its schizont stage half-lives, and group 10 has a uniquedecay pattern with transcripts being most stable in the tro-phozoite stage.
Nine of the ten groups are associated with significantly over-represented GO terms, and the complete list of significantterms and corresponding P values can be found in Additionaldata file 3. A range of GO terms was represented among thedifferent groups, and in general over-represented terms inthe same group were involved in similar processes. Listedbelow are the four groups with the most significant GO terms(lowest P value).
Transcripts clustered in group 1 exhibit a relatively stable pat-tern of decay, with an increase in half-life of 31 min betweenthe ring and late schizont stages, as compared with a genome-wide average increase of 56 min. Group 1 also has the longestaverage half-life in the ring stage. This group has severalhighly over-represented terms, including ribosome, ribonu-cleoprotein complex, cytoskeleton organization and biogen-esis and mitochondrion. Given that all of these termsrepresent proteins involved in processes that are activethroughout the life cycle, it is not surprising to see them in thecluster with the lowest half-life variability across the IDC.Although group 4 also has over-represented GO terms forprocesses needed throughout the life cycle, the genes in thisgroup have a pattern of decay that most closely matches theaverage half-life increase seen across the genome. Terms forthe generation of metabolites and energy, cellular catabolism,and tricarboxylic acid cycle metabolism were all found in thisgroup. Wang and colleagues [14] found that, in yeast, genesinvolved in energy metabolism had similar, very long half-lives. Instead, our data suggest that the rate of decay in P. fal-ciparum might be matched to the energy requirements of thegrowing cell. Group 5 also has a relatively stable pattern ofdecay, but it does not have longer than average half-lives inthe ring stage. This group is enriched in terms involved inRNA processing, including nucleolus, rRNA metabolism, andnuclear mRNA splicing, via spliceosome. Group 10 has themost unusual profile, with a short average half-life in the ringand schizont stages and a long average half-life in the tropho-zoite and late schizont stages. This group has terms involvedin pathogenesis overrepresented, such as host and antigenicvariation.
In a separate analysis, we were able to find over-representa-tion for two sample groups that could be easily annotated byhand using the lexical analysis tool LACK [25]. Plastidencoded genes and tRNAs, which both lack associated GOterms, were over-represented in group 7 (P < 3.25 × 10⁻³ and4.50 × 10-5, respectively).
DiscussionIn this study we showed that the overall rates of decay changeduring the developmental cycle, beginning with relativelyshort half-lives in the ring stage and ultimately ending withdramatically longer half-lives in the schizont stage. The abun-dance of any given mRNA species is the result of transcrip-tional production offset by the rate of degradation. Thus, achange in transcriptional output without a correspondingchange in abundance implies a necessary alteration in therate of degradation. It has previously been noted that thequantity of mRNA that can be isolated per infected erythro-cyte increases dramatically over the course of the IDC [26].There is also evidence, through previously reportedradioisotope pulse labeling experiments and our own unpub-lished observations, that transcription increases steadilyfrom invasion until around 36 hours and then drops off in latestage parasites [27,28]. Therefore, the observed mRNA accu-mulation after schizogony appears to be largely a function ofenhanced mRNA stability rather than increasing levels oftranscription.
This global stabilization may be a mechanism to regulate geneexpression in late stage parasites, when the process of pack-aging multiple nuclei into developing merozoites may compli-cate coordinate regulation of transcription. Stabilized mRNAmay also be important for the merozoite, and represent acarefully regulated 'starting package' that would allow rapidactivation of the IDC following the next round of invasion.Furthermore, the data are consistent with a process by whichthe low level transcriptional accumulation in early stage par-asite development features rapid mRNA turnover, perhapsindicative of the dynamic remodeling process that immedi-ately follows invasion. Future experiments using a pulsechase system, such as was developed for Toxoplasma gondiito measure newly synthesized mRNA and its degradation,could also help to elucidate whether this model is correct [29].
The mechanism for the genome-wide increase in mRNA half-lives remains unclear. Similar to yeast and mammalian cells,the rate of decay could not be correlated to transcript length,abundance, or transcriptome phase [14,21].
A straightforward mechanism that could explain the globallengthening of half-lives would include the developmentalregulation of the decay components themselves. Indeed, all ofthe decay components measured by our previous transcrip-tome profiling efforts exhibit clear patterns of phase-specificexpression, with most profiles indicating peak mRNAabundance in rings and trophozoites [4]. Although the mRNAabundance profiles of the decay components are consistentwith a model in which the most rapid turnover of mRNAoccurs early in the IDC, the actual protein expression profilesof these components remain to be measured. Furthermore,the expression of the proteins themselves may not be coordi-nated with their activation, and so the actual biochemicalactivities must also be assessed. For example, a progressive
Genome Biology 2007, 8:R134
R134.10 Genome Biology 2007, Volume 8, Issue 7, Article R134 Shock et al. http://genomebiology.com/2007/8/7/R134
decrease in deadenylation, decapping, or exonuclease activitycould account for the observed lengthening of half-lives inde-pendent of when the proteins are produced. Given the currentdata, it remains an open question as to whether the observedincreases in mRNA half-life are a direct result of limitingquantities of critical decay components or whether additionalregulatory factors or physical sequestration limit entry ofmRNAs into the decay pathway.
Numerous studies in other organisms have shown thatsequence elements in the 3'-UTR are important in determin-ing decay rate for many genes [10]. The extreme A/T richnessof the P. falciparum genome, combined with a lack of func-tionally characterized UTRs, has made identification of puta-tive decay motifs, which are also generally A/T rich, ratherchallenging. However, Coulson and coworkers [6] found pro-teins with sequence similarity to RNA binding proteins, inparticular the CCCH-type zinc finger proteins that areinvolved in regulating mRNA stability, to be over-representedin P. falciparum.
In addition to the global change in decay rate, we also showedthat genes grouped by their pattern of decay exhibit signifi-cant enrichment of GO terms, suggesting that genes function-ing in the same pathway or process have similar decay ratesover the life cycle. This type of coherence in mRNA decayrates for functional groups has also been observed in yeastand mammals [14,16], and at least two separate factors - RNApolymerase II subunit Rpb4p and Pub1p - have been linked todifferential decay of mRNAs encoding protein biogenesiscomponents [30,31]. In their study of changes in transcrip-tion rate and decay rate during the shift from glucose to galac-tose in yeast, Garcia-Martinez and colleagues [16] identifiedseveral GO categories that have coordinately regulated decaypatterns. Interestingly, many of these categories are the sameas those identified in this study, including ribosomal proteins,proteins involved in energy metabolism, and proteinsinvolved in rRNA processing. These authors also measured ageneral increase in mRNA stability during the shift from glu-cose to galactose. An analogous mechanism may be responsi-ble for the observed increase in mRNA stability during the P.falciparum developmental cycle.
ConclusionIn this study we have measured the mRNA decay rate in P.falciparum for more than 4,000 genes during the 48-hourintra-erythrocytic life cycle. The characterization of mRNAdecay rates on a genome-wide scale during the P. falciparumIDC offers insights into the unique biology of the malaria par-asite and the unique manner in which gene expression is reg-ulated throughout the IDC. This study provides a foundationfor continued investigations into the molecular mechanism ofPlasmodium mRNA decay and its role in parasitedevelopment.
Materials and methodsCell cultureP. falciparum parasite cells (3D7) were cultured as describedpreviously [19]. Cells were synchronized by two consecutivesorbitol treatments during two consecutive cell cycles (a totalof four treatments), and the mRNA decay experiments wereconducted at 12-hour intervals starting in the ring stage (10 to12 hours after invasion). To stop transcription actD (Amer-sham, Piscataway, NJ, USA) was added at 20 μg/ml, and sam-ples were collected 0, 5, 10 15, 30, 60, 120, and 240 min later.For each mRNA decay experiment, a sample was also takendirectly before addition of drug. The cells were harvested bycentrifugation at 1,500 g for 5 min, washed in phosphate-buffered saline (PBS), and pelleted at 1,500 g for 5 min. Cellpellets were rapidly frozen in liquid nitrogen and stored at -80°C.
RNA preparation and microarray hybridizationTotal RNA was prepared directly from the frozen pellets ofparasitized erythrocytes, in which approximately 1 ml of cellpellet was lysed in 10 ml Trizol (Invitrogen, Carlsbad, CA,USA). For the hybridization experiments, 8 μg total RNA wasused for amino-allyl cDNA synthesis, as previously described[19]. A pool of amino-allyl labeled cDNAs representing stagesthroughout the IDC was assembled and used as a reference.For DNA microarray hybridization, the pool cDNA wasalways coupled to Cy3 dye as reference, whereas cDNA froman individual time point was coupled to Cy5 dye.
The DNA microarray used in this study contains 8,182 70-mer oligos. Of these, 6,652 are unique and map to an anno-tated ORF, as listed in PlasmoDB release 4.4. DNA microar-rays were printed and postprocessed as described previously[19].
For the trophozoite, schizont, and late schizont decay experi-ments, the individual time points were hybridized in tripli-cate. For the ring decay experiment, the time points werehybridized in duplicate because of limiting quantities of RNA.In all cases, all time points for a single replicate were hybrid-ized on the same day and included two replicates of the sam-ple collected before addition of actD.
DNA microarrays were scanned using an Axon 4000B scan-ner and images analyzed using Axon GenePix software(Molecular Devices, Union City, CA, USA). Microarray datawere stored using NOMAD database software [32]. All micro-array data are available at the Gene Expression Omnibus [33](series accession number GSE8099).
For normalization among time points, an internal control wasprepared with a pool of in vitro transcribed S. cerevisiaeRNAs. Oligos Y_IBX1991, Y_ICX1881, Y_IFX1541, andY_IHX3161, representing four intergenic S. cerevisiaesequences, were printed 16 times each onto the P. falciparumDNA microarrays [34]. RNA transcripts of each of these S.
Genome Biology 2007, 8:R134

http://genomebiology.com/2007/8/7/R134 Genome Biology 2007, Volume 8, Issue 7, Article R134 Shock et al. R134.11
com
ment
reviews
reports
refereed researchdepo
sited researchinteractio
nsinfo
rmatio
n
cerevisiae DNAs were prepared in vitro and pooled. Thisinternal control mix was added to each total RNA sample ana-lyzed in the decay time course, as well as to the total RNA usedas pool, at a final concentration of 1 ng of each S. cerevisiaeRNA per 8 μg of total RNA.
Data analysisDecay rates for every transcript for which decay was observedwere determined by fitting all observations with a three-parameter first order decay model, A = (A0 - B)e-ln(0.5)/t1/2 × t +B, using the Levenberg-Marquardt algorithm implemented inMINPACK [35]. Using this model, fits of half-life (t1/2) areinsensitive to zero order kinetic contributions, such as contin-ued low levels of transcription. Formally, a zero order contri-bution to a first order process affects only the final steadystate ratio, B in our model, and has no impact on the decayconstant or half-life. To ensure that contributions from resid-ual transcription were minimized, all measurements for timesunder 10 min were excluded from the analysis if no decay hadbeen observed for the transcript in question.
All arrays were normalized using the average median intensi-ties of the in vitro transcribed S. cerevisiae RNA internal con-trols. The ratio of median intensities for unflagged spots witha median intensity of greater than 300 in either channel wasused for further analysis. Several quality control checks wereemployed before any fits were included in downstream anal-ysis, as summarized in Additional data file 2. Each decay pro-file had to pass two sets of filters. First, before any fitting wasperformed, a set of raw data filters (group A; Additional datafile 2) was applied. The profile had to include measurementsfrom at least eight data points, the observed amplitude had tobe at least 0.1, the first time point not later than 10 min, andthe last observation not earlier than 60 min. Second, thedecay profiles that passed all of the group A tests were fit tothe decay model. Fits with systematic residuals were elimi-nated by filtering out fits in several classes (group B; Addi-tional data file 2). Each fit had to have an amplitude (A0 - B)of at least 0.1 but not more than 10.0, with B between -1.0 andA0, and the fit half-life had to be greater than 1 min. Whenunder 70% of the fit amplitude was experimentally observedover the time course, we report the half-life as greater than138 min.
Oligos that were excluded from the final analysis are listed foreach stage in Additional data file 2. Values for each modelparameter, initial ratio (A0), final ratio (B), and t1/2, as well asthe asymptotic standard errors for all fits that satisfy thosecriteria, are given in Additional data file 1.
K-means clusters were generated using log-transformed half-lives for each gene in each stage. For genes with more thanone oligo, the half-lives were averaged if the standard devia-tion was less than the average standard deviation for all geneswith multiple oligos in that stage. The clustering was doneonly on genes with data present for at least three out of the
four stages. K-means clusters were generated using uncen-tered mean correlation in Cluster 3.0 and visualized usingJava Treeview [36]. GO analysis was done using the GoStattool with the following parameters: minimal length of consid-ered GO paths = 5, maximal P value = 0.01, cluster GOs = -1,and correct for multiple testing = none.
Nuclear run-on analysisSynchronous cultures in either the ring or late schizont stagewere treated with 20 μg/ml actD. Time points were thentaken at 0, 7.5, and 15 min after addition of drug. Each samplewas pelleted and washed once with 1 × PBS before lysis with 1volume 0.2% saponin. Lysed parasites were washed twice in 1× PBS and resuspended in 1.5 ml buffer A (20 mmol/l PIPES,15 mmol/l NaCl, 60 mmol/l KCl, 14 mmol/l 2-mercaptoetha-nol, 0.5 mmol/l EGTA, 4 mmol/l EDTA, 0.5 mmol/l spermi-dine, and 0.125 mmol/l PMSF). The parasites weretransferred to a Dounce homogenizer with a type B pestle. Avolume of 100 μl 10% NP-40 was added and ten strokes wereapplied. Nuclei were pelleted by centrifugation for 3 min at6,000 g, washed in buffer A, and pelleted again. Each samplewas resuspended in 200 μl buffer B (50 mmol/l HEPES [pH7.9], 50 mmol/l NaCl, 10 mmol/l MgCl2 1.2 mmol/l DTT, 1mmol/l GTP, 1 mmol/l CTP, 4 mmol/l ATP, 20% glycerol, 25U/mL RNasin). Then, 0.5 μmol/l [α-32P]UTP (3000 Ci/mmol) was added to all samples and transcription wasallowed to proceed at 37°C for 30 min. RNA was isolatedusing Trizol, as per the manufacturer's instructions. The RNAwas hybridized to a dot blot spotted with 500 ng total cDNAin Rapid Hyb buffer (Amersham) at 55°C and washed inaccordance with the manufacturer's instructions. Spot inten-sity was measured using a Storm PhosphorImager (GEHealthcare Biosciences, Piscataway, NJ, USA).
Rapid amplification of cDNA ends5'-RACE was done using the First Choice RLM-RACE kit(Ambion, Austin, TX, USA), in accordance with the manufac-turer's instructions. Nested polymerase chain reaction (PCR)was used and the following primers were employed with theprimers provided with the kit: 5'-TGATTTTACGCTTAAAC-CAGAGG-3' for the PFB0760w 5'-RACE outer primer; 5'-CTCTTGTTACTATTATTATTTTGCCCCTCA-3' for thePFB0760w 5'-RACE inner primer; 5'-TGACCAAAAAGATTT-TACTGAA-3' for the PF13_0116 5'-RACE outer primer; 5'-AAAACTTTCCAAACTTTCACAA-3' for the PF13_0116 5'-RACE inner primer. Herculase (Stratagene, La Jolla, CA,USA) was used for all PCRs using the following cycling condi-tions: 3 min at 94°C followed by 35 rounds of 94°C for 30 s,55°C for 30 s, and 60°C for 1 min. All PCR products were con-firmed by sequencing.
Northern analysisNorthern blots were performed as described previously [37].Total RNA (10 μg) was used for each sample. The probes weregenerated using the following PCR primers: 5'-CCAAAGGAG-GAGACATCCAA-3' and 5'-GGGAAACACAATCGCTGAAT-3'
Genome Biology 2007, 8:R134
R134.12 Genome Biology 2007, Volume 8, Issue 7, Article R134 Shock et al. http://genomebiology.com/2007/8/7/R134
for PFB0760w, and 5'-AGAATGCTTTCCCACGACAC-3' and5'-TGAATCGTTAAAAGACGGATGA-3' for PF13_0116. ThePCR products were labeled with [α-32P]dATP using the DEC-Aprime™ II kit (Ambion). The RNA used for the Northernswas the same as that used for the cDNA synthesis.
Additional data filesThe following additional data are available with the onlineversion of this paper. Additional date file 1 provides the com-plete dataset, containing initial ratio (A0), final ratio (B), andhalf-life (t1/2), as well as the asymptotic standard errors foreach of these parameters. Additional data file 1 provides Thecomplete dataset containing a list of oligos that did not passthe quality control filters in each stage. Additional data file 1provides a complete list of all of the significant GO terms andassociated P values found in each of the k-means clusters.Additional data file 1Complete dataset containing initial ratio (A0), final ratio (B) and half-life (t1/2)Presented is the complete dataset containing initial ratio (A0), final ratio (B) and half-life (t1/2) as well as the asymptotic standard errors for each of these parameters.Click here for fileAdditional data file 2Complete dataset containing a list of oligos that did not pass the quality control filters in each stagePresented is the complete dataset containing a list of oligos that did not pass the quality control filters in each stage. The specific filter or filters these oligos did not pass are listed.Click here for fileAdditional data file 3Gene Ontology terms and associated P values found in each of the k-means clustersPresented is a complete list of all the significant Gene Ontology terms and associated P values found in each of the k-means clusters.Click here for file
AcknowledgementsWe would like to thank members of the DeRisi laboratory for helpfuladvice. We would also like to thank Teresa Shock, Megan Bergkessel, BradZuchero, Julie Hollien, Manuel Llinás, and Ashwini Jambhekar for helpfuldiscussion and critical comments on the manuscript. This work and JLSwere supported by a grant from the National Institute of Allergy and Infec-tious Disease (U01 AI53862), the Packard Foundation, and the HowardHughes Medical Institute (HHMI). JDR is supported by HHMI. KFF is sup-ported by a grant from the Doris Duke Foundation.
References1. Snow RW, Guerra CA, Noor AM, Myint HY, Hay SI: The global dis-
tribution of clinical episodes of Plasmodium falciparummalaria. Nature 2005, 434:214-217.
2. Yamey G: Roll Back Malaria: a failing global health campaign.BMJ 2004, 328:1086-1087.
3. Kooij TW, Janse CJ, Waters AP: Plasmodium post-genomics: bet-ter the bug you know? Nat Rev Microbiol 2006, 4:344-357.
4. Bozdech Z, Llinas M, Pulliam BL, Wong ED, Zhu J, DeRisi JL: Thetranscriptome of the intraerythrocytic developmental cycleof Plasmodium falciparum. PLoS Biol 2003, 1:E5.
5. Llinas M, Bozdech Z, Wong ED, Adai AT, DeRisi JL: Comparativewhole genome transcriptome analysis of three Plasmodiumfalciparum strains. Nucleic Acids Res 2006, 34:1166-1173.
6. Coulson RM, Hall N, Ouzounis CA: Comparative genomics oftranscriptional control in the human malaria parasite Plas-modium falciparum. Genome Res 2004, 14:1548-1554.
7. Garneau NL, Wilusz J, Wilusz CJ: The highways and byways ofmRNA decay. Nat Rev Mol Cell Biol 2007, 8:113-126.
8. Cao D, Parker R: Computational modeling of eukaryoticmRNA turnover. Rna 2001, 7:1192-1212.
9. Collart MA: Global control of gene expression in yeast by theCcr4-Not complex. Gene 2003, 313:1-16.
10. Meyer S, Temme C, Wahle E: Messenger RNA turnover ineukaryotes: pathways and enzymes. Crit Rev Biochem Mol Biol2004, 39:197-216.
11. Estevez AM, Kempf T, Clayton C: The exosome of Trypanosomabrucei. EMBO J 2001, 20:3831-3839.
12. Estevez AM, Lehner B, Sanderson CM, Ruppert T, Clayton C: Theroles of intersubunit interactions in exosome stability. J BiolChem 2003, 278:34943-34951.
13. Newbury SF: Control of mRNA stability in eukaryotes. BiochemSoc Trans 2006, 34:30-34.
14. Wang Y, Liu CL, Storey JD, Tibshirani RJ, Herschlag D, Brown PO:Precision and functional specificity in mRNA decay. Proc NatlAcad Sci USA 2002, 99:5860-5865.
15. Lam LT, Pickeral OK, Peng AC, Rosenwald A, Hurt EM, Giltnane JM,Averett LM, Zhao H, Davis RE, Sathyamoorthy M, et al.: Genomic-scale measurement of mRNA turnover and themechanisms
of action of the anti-cancer drug flavopiridol. Genome Biol2001, 2:RESEARCH0041.
16. Garcia-Martinez J, Aranda A, Perez-Ortin JE: Genomic run-onevaluates transcription rates for all yeast genes and identifiesgene regulatory mechanisms. Mol Cell 2004, 15:303-313.
17. Reich E, Franklin RM, Shatkin AJ, Tatumel : Action of actinomycinD on animal cells and viruses. Proc Natl Acad Sci USA 1962,48:1238-1245.
18. Militello KT, Patel V, Chessler AD, Fisher JK, Kasper JM, GunasekeraA, Wirth DF: RNA polymerase II synthesizes antisense RNA inPlasmodium falciparum. Rna 2005, 11:365-370.
19. Bozdech Z, Zhu J, Joachimiak MP, Cohen FE, Pulliam B, DeRisi JL:Expression profiling of the schizont and trophozoite stagesof Plasmodium falciparum with a long-oligonucleotidemicroarray. Genome Biol 2003, 4:R9.
20. DeRisi Lab Malaria Transcriptome Database [http://malaria.ucsf.edu.]
21. Yang E, van Nimwegen E, Zavolan M, Rajewsky N, Schroeder M, Mag-nasco M, Darnell JE Jr: Decay rates of human mRNAs: correla-tion with functional characteristics and sequence attributes.Genome Res 2003, 13:1863-1872.
22. Ruvolo V, Altszuler R, Levitt A: The transcript encoding the cir-cumsporozoite antigen of Plasmodium berghei utilizes heter-ogeneous polyadenylation sites. Mol Biochem Parasitol 1993,57:137-150.
23. Oguariri RM, Dunn JM, Golightly LM: 3' gene regulatory elementsrequired for expression of the Plasmodium falciparum devel-opmental protein, Pfs25. Mol Biochem Parasitol 2006,146:163-172.
24. Beissbarth T, Speed TP: GOstat: find statistically overrepre-sented Gene Ontologies within a group of genes. Bioinformatics2004, 20:1464-1465.
25. Kim CC, Falkow S: Significance analysis of lexical bias in micro-array data. BMC Bioinformatics 2003, 4:12.
26. Martin RE, Henry RI, Abbey JL, Clements JD, Kirk K: The 'perme-ome' of the malaria parasite: an overview of the membranetransport proteins of Plasmodium falciparum. Genome Biol2005, 6:R26.
27. de Rojas MO, Wasserman M: Temporal relationships on macro-molecular synthesis during the asexual cell cycle of Plasmo-dium falciparum. Trans R Soc Trop Med Hyg 1985, 79:792-796.
28. Gritzmacher CA, Reese RT: Protein and nucleic acid synthesisduring synchronized growth of Plasmodium falciparum. JBacteriol 1984, 160:1165-1167.
29. Cleary MD, Meiering CD, Jan E, Guymon R, Boothroyd JC: Biosyn-thetic labeling of RNA with uracil phosphoribosyltransferaseallows cell-specific microarray analysis of mRNA synthesisand decay. Nat Biotechnol 2005, 23:232-237.
30. Lotan R, Bar-On VG, Harel-Sharvit L, Duek L, Melamed D, ChoderM: The RNA polymerase II subunit Rpb4p mediates decay ofa specific class of mRNAs. Genes Dev 2005, 19:3004-3016.
31. Duttagupta R, Tian B, Wilusz CJ, Khounh DT, Soteropoulos P,Ouyang M, Dougherty JP, Peltz SW: Global analysis of Pub1p tar-gets reveals a coordinate control of gene expression throughmodulation of binding and stability. Mol Cell Biol 2005,25:5499-5513.
32. UCSF Nomad [http://ucsf-nomad.sourceforge.net/]33. Gene Expression Omnibus [http://www.ncbi.nlm.nih.gov/geo/]34. Web supplement for Expression Profiling the Schizont and
Trophozoite Stages of Plasmodium falciparum with a LongOligonucleotide Microarray [http://derisilab.ucsf.edu/data/falciparum]
35. Mor'e J, (editor): The Levenberg-Marquardt Algorithm: Implementationand Theory Berlin, Heidelberg, New York: Springer-Verlag; 1978.
36. Eisen MB, Spellman PT, Brown PO, Botstein D: Cluster analysisand display of genome-wide expression patterns. Proc NatlAcad Sci USA 1998, 95:14863-14868.
37. Sambrook J, Fritsch EF, Maniatis T: Molecular cloning, a Laboratory Man-ual 2nd edition. Cold Spring Harbor, NY: Cold Spring Harbor Press;1989.
Genome Biology 2007, 8:R134