whole genome sequencing for staphylococcus · pdf filewhole genome sequencing for...
TRANSCRIPT

WHOLE GENOME SEQUENCING FOR STAPHYLOCOCCUS AUREUS
Claire Gordon MRC clinical research fellow
Nuffield Department of Medicine, University of Oxford
Staphylococcus aureus
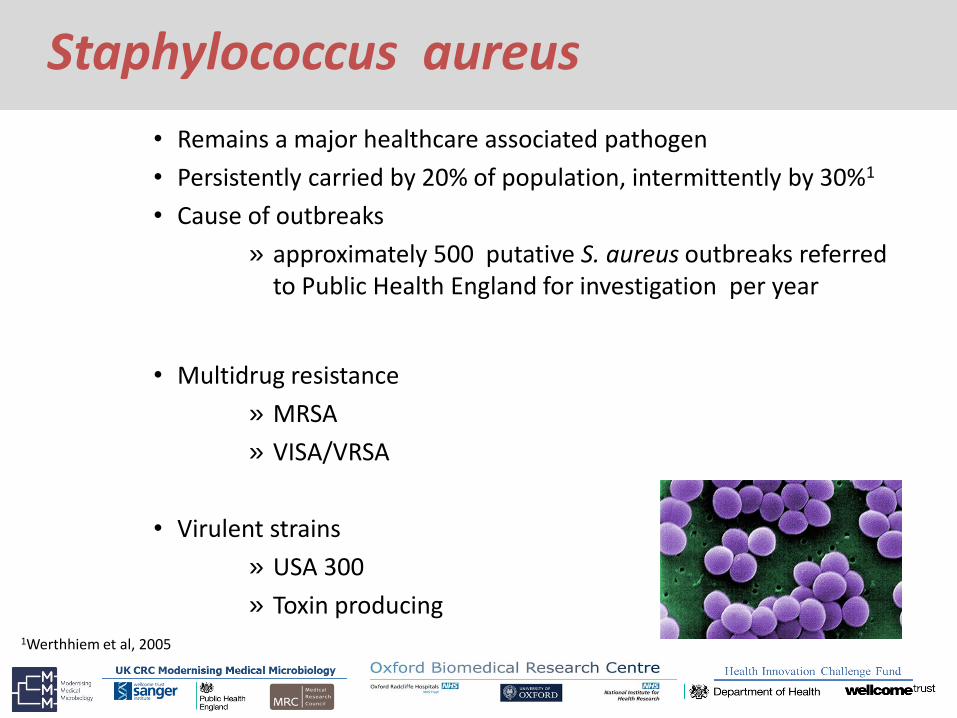
• Remains a major healthcare associated pathogen
• Persistently carried by 20% of population, intermittently by 30%1
• Cause of outbreaks
» approximately 500 putative S. aureus outbreaks referred to Public Health England for investigation per year
• Multidrug resistance
» MRSA
» VISA/VRSA
• Virulent strains
» USA 300
» Toxin producing
1Werthhiem et al, 2005
Whole Genome Sequencing
• Hypothesis: whole genome sequencing (WGS) can give us all the information we need to diagnose, treat and investigate illness due to S. aureus
• To date we have used WGS to • study outbreaks / person to person spread
• predict antimicrobial resistance
• look for virulence factors
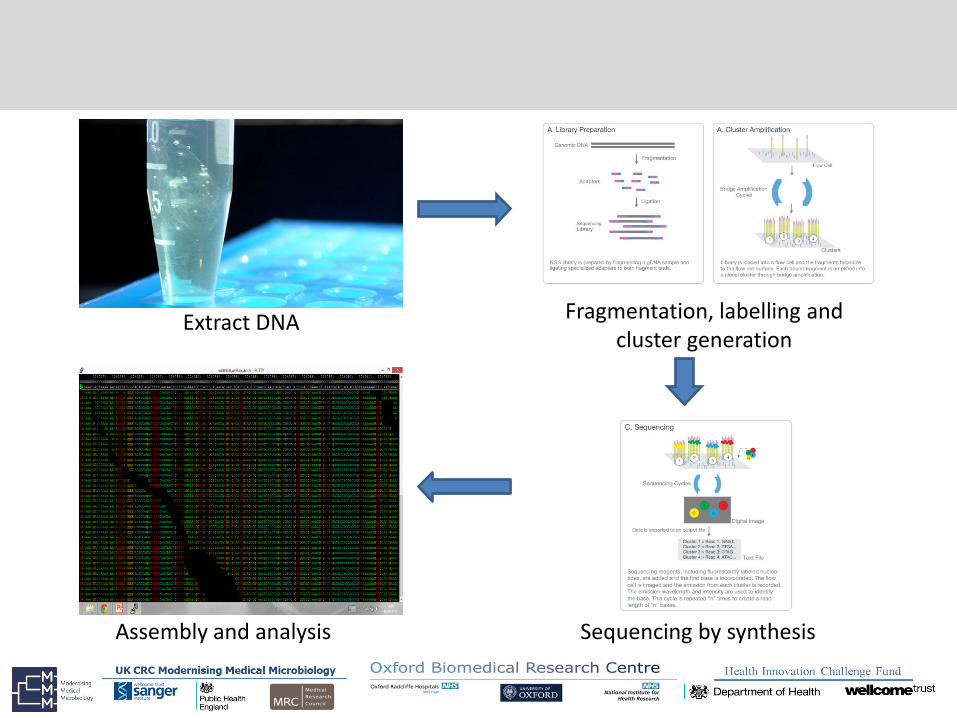
Extract DNA Fragmentation, labelling and cluster generation
Sequencing by synthesis Assembly and analysis

OUTBREAKS
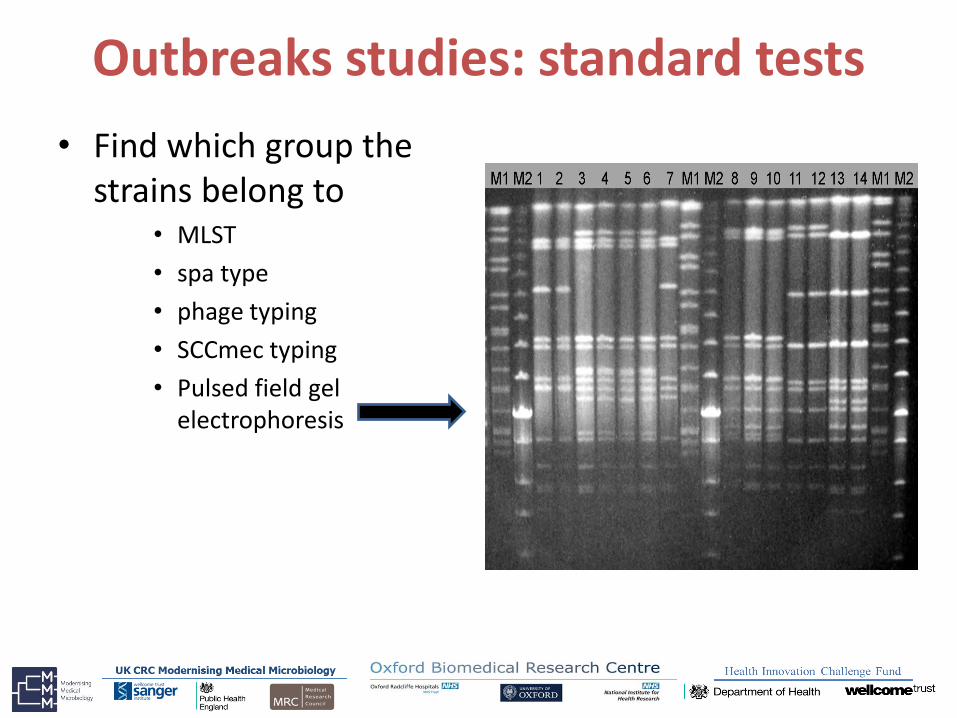
Outbreaks studies: standard tests
• Find which group the strains belong to
• MLST
• spa type
• phage typing
• SCCmec typing
• Pulsed field gel electrophoresis

PFGE : gold standard?
Kazakova SV et al. N Engl J Med 2005;352:468-475.
Why use WGS?
• Single platform
• Better resolution
• Turnaround times approaching those of standard techniques
• May give additional information
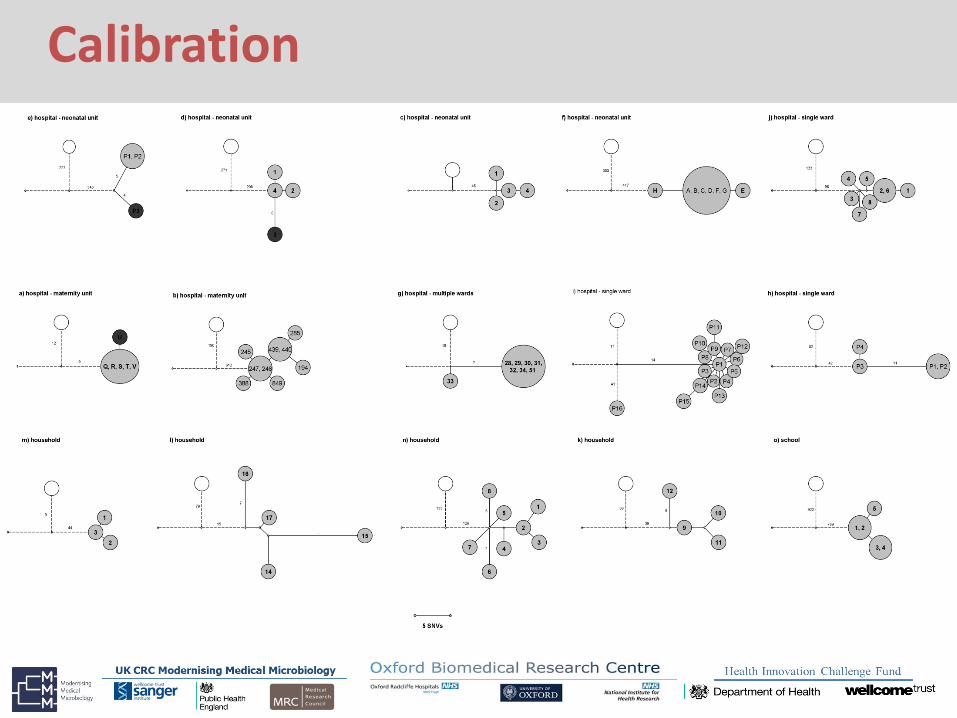
Calibration

Setting No of pairs Mean pairwise
difference (SNVs) 95% CI
Hospital 363 2.96 2.72-3.19
Community 53 7.30 5.79-8.82
P=0.00
05
10
15
20
25
Pair
wis
e d
iffe
rence
, S
NV
s
Community Hospital
Distribution of pairwise differences for community and hospital outbreaks

SNV threshold
% o
f is
ola
tes
incl
ud
ed b
y ea
ch S
NV
dis
tan
ce
Percentage of isolates included by SNV threshold
0
10
20
30
40
50
60
70
80
90
100
0 1 2 3 4 5 6 7 8 9 10 11 12
Distance from nearest neighbour
Distance from index

Case study: MRSA on ITU
4 9 14 19 24 29 34 39 44 49 54
Patient A (bay 1)
Patient B (bay 1)
Patient C (bay 2)
Nurse1
Nurse2
air sample
Dr
x
x
x
x
xx
x
Days

Using epidemiology
4 9 14 19 24 29 34 39 44 49 54
Patient A (bay 1)
Patient B (bay 1)
Patient C (bay 2)
Nurse1
Nurse2
air sample
Dr
x
x
x
x
xx
x
Days
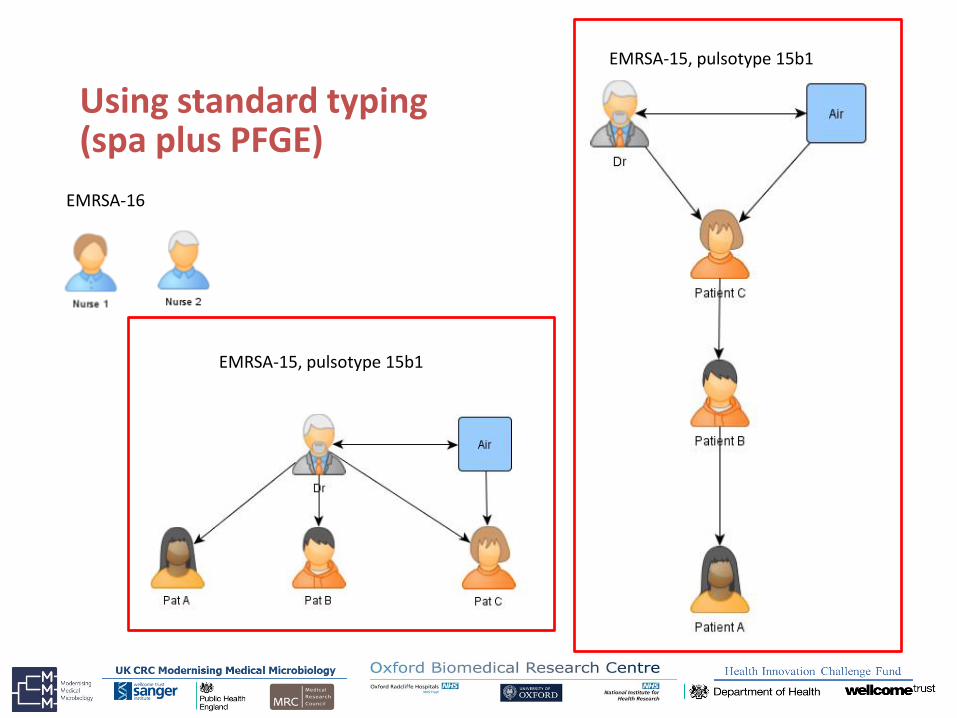
Using standard typing (spa plus PFGE)
EMRSA-16
EMRSA-15, pulsotype 15b1
EMRSA-15, pulsotype 15b1
69
20
9
13 35
43
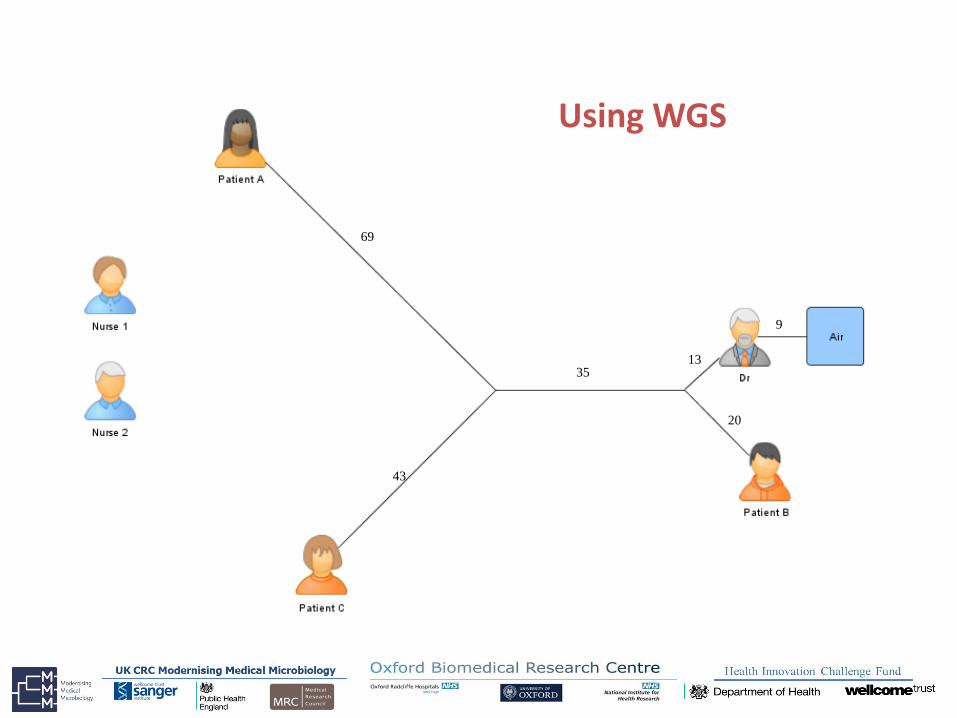
Using WGS
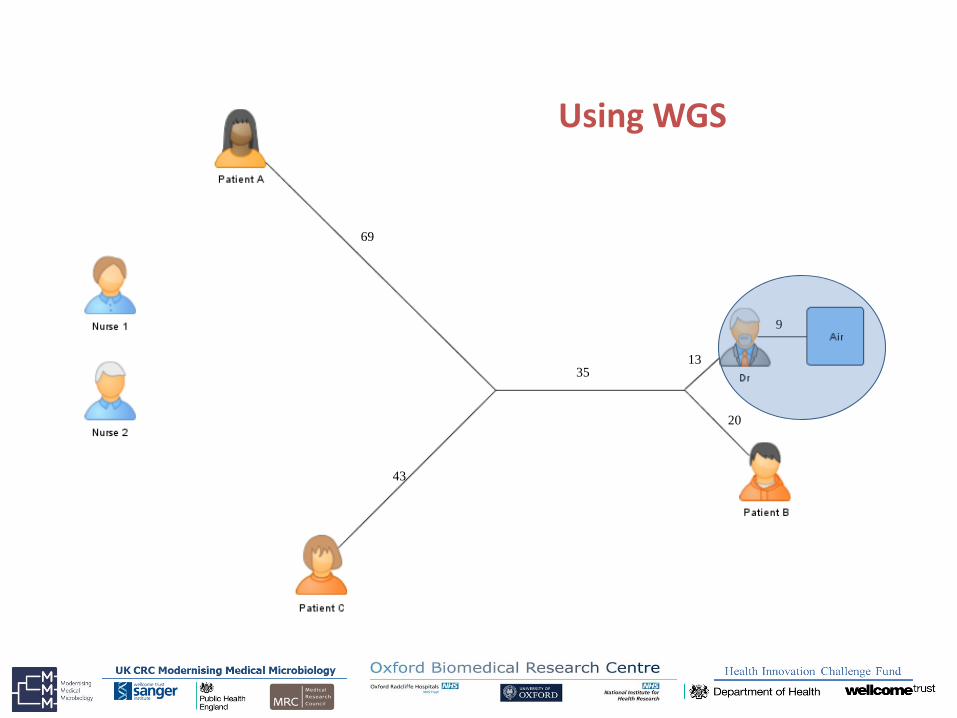
69
20
9
13 35
43
Using WGS

• First “broken” S. aureus outbreak
• Demonstrates diversity within same PFGE pulsotype
• Unidentified source of MRSA for patient A
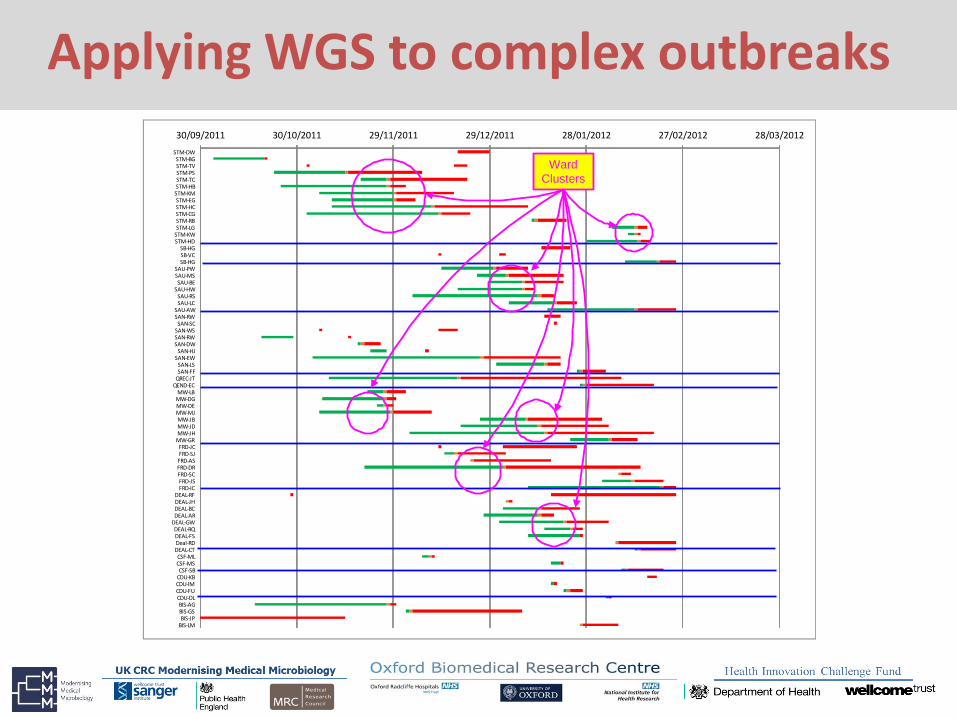
Applying WGS to complex outbreaks 30/09/2011 30/10/2011 29/11/2011 29/12/2011 28/01/2012 27/02/2012 28/03/2012
STM-DWSTM-BGSTM-TVSTM-PSSTM-TCSTM-HBSTM-KMSTM-EGSTM-HCSTM-CGSTM-RBSTM-LG
STM-KWSTM-HD
SB-HGSB-VCSB-HG
SAU-PWSAU-MSSAU-BE
SAU-HWSAU-RSSAU-LC
SAU-AWSAN-RWSAN-SC
SAN-WSSAN-RWSAN-DW
SAN-HJSAN-EW
SAN-LSSAN-FF
QREC-JTQEND-EC
MW-LBMW-DGMW-DEMW-MJMW-JBMW-JDMW-JHMW-GRFRD-JCFRD-SJ
FRD-ASFRD-DRFRD-SCFRD-JSFRD-IC
DEAL-RFDEAL-JHDEAL-BCDEAL-AR
DEAL-GWDEAL-RQDEAL-FSDeal-RDDEAL-CTCSF-MLCSF-MSCSF-SB
CDU-KBCDU-IMCDU-FUCDU-DLBIS-AGBIS-GSBIS-JP
BIS-LM
Ward
Clusters
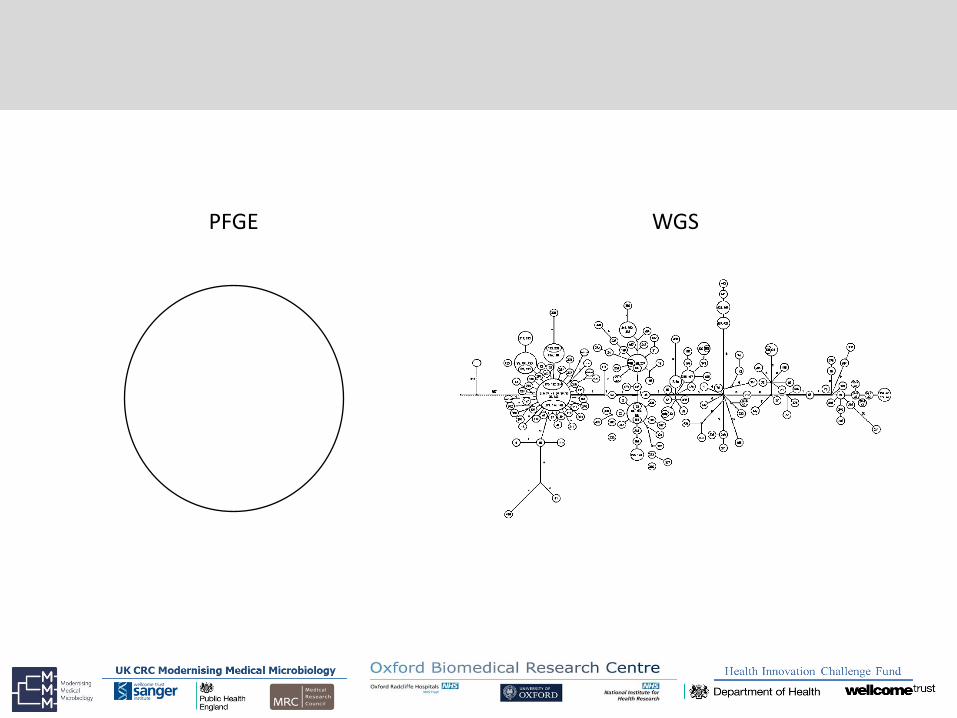
PFGE WGS
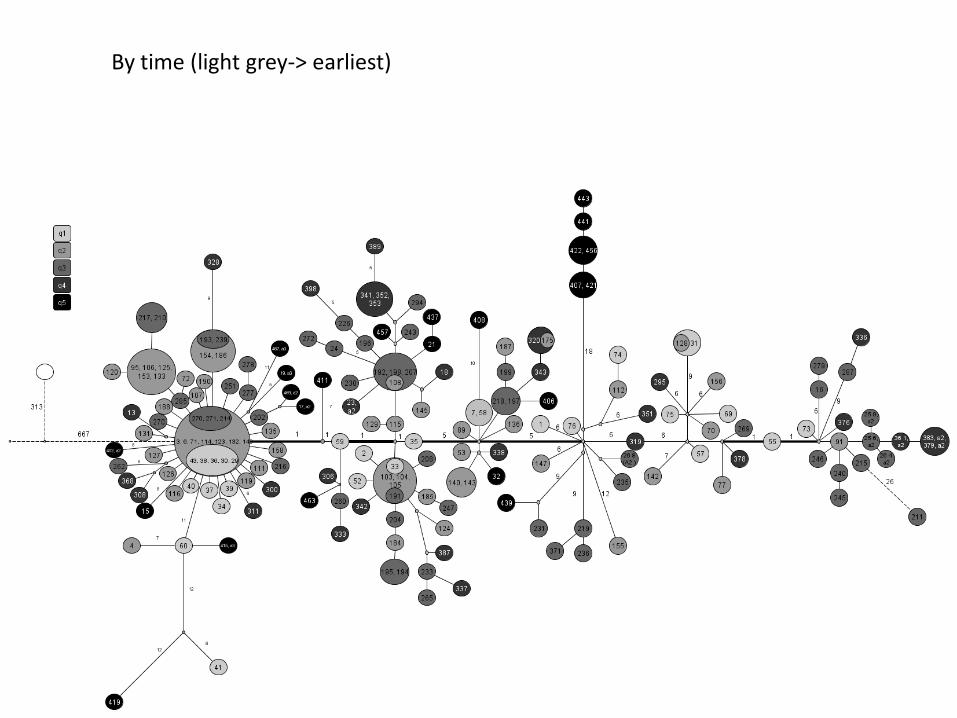
By time (light grey-> earliest)
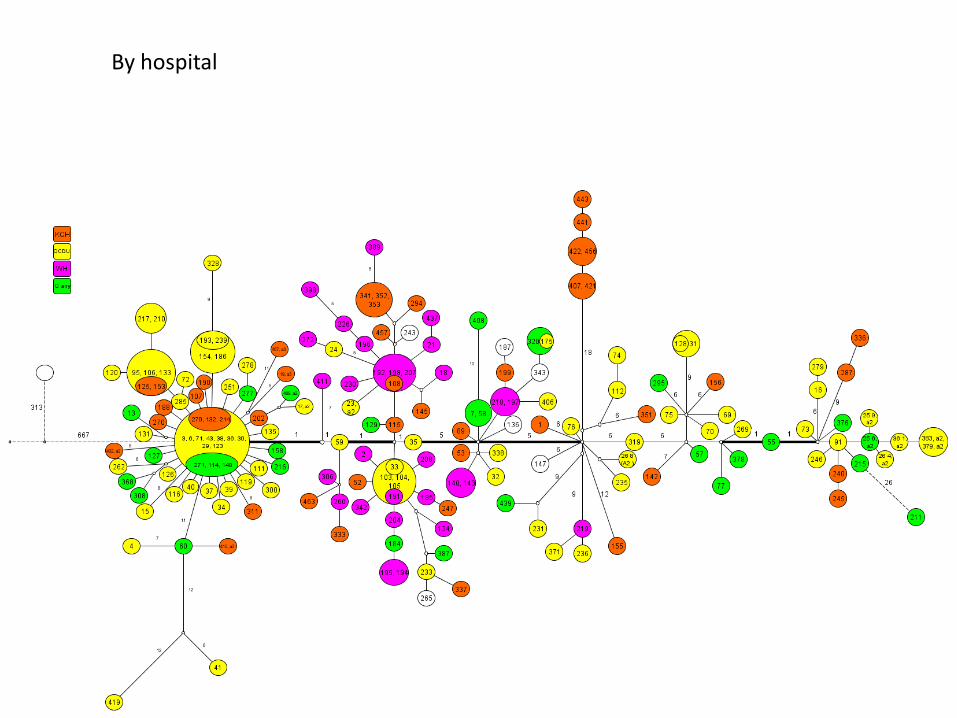
By hospital
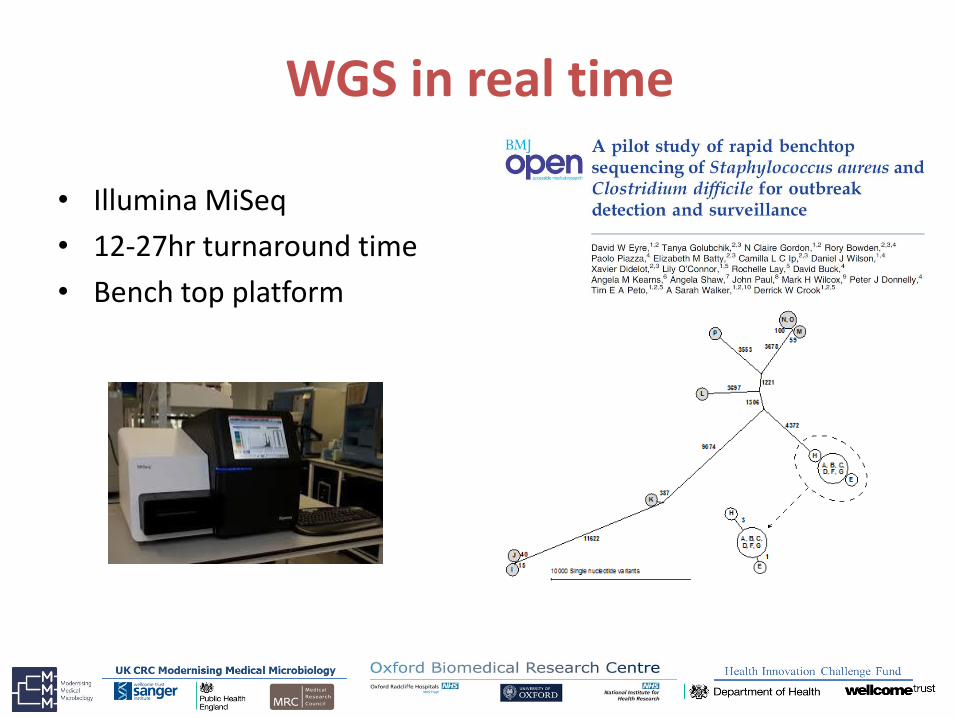
WGS in real time
• Illumina MiSeq
• 12-27hr turnaround time
• Bench top platform
RESISTOTYPING
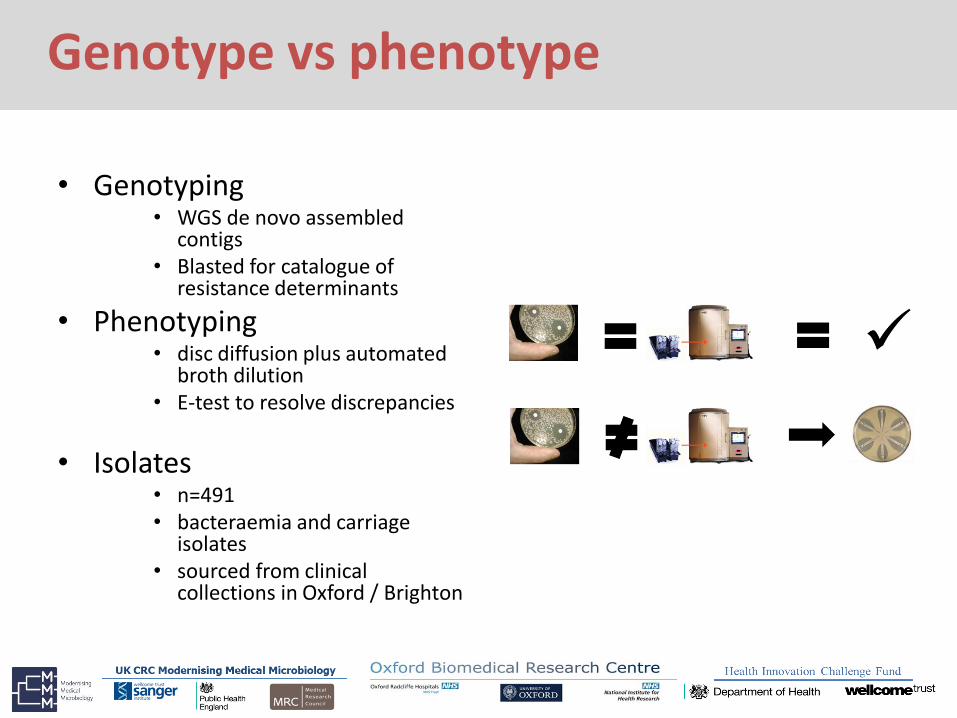
Genotype vs phenotype
• Genotyping • WGS de novo assembled
contigs • Blasted for catalogue of
resistance determinants
• Phenotyping • disc diffusion plus automated
broth dilution • E-test to resolve discrepancies
• Isolates • n=491 • bacteraemia and carriage
isolates • sourced from clinical
collections in Oxford / Brighton

• Overall categorical agreement >99%
• Total of 11 cryptic genotype / phenotype mismatches
• Rapid identification of novel variants
• non-synonymous mutations in fusA
• Penicillin • Deletions / insertions in blaZ
causing frameshift mutations
DNA sequence alignments showing single base blaZ deletions in 4
penicillin susceptible isolates
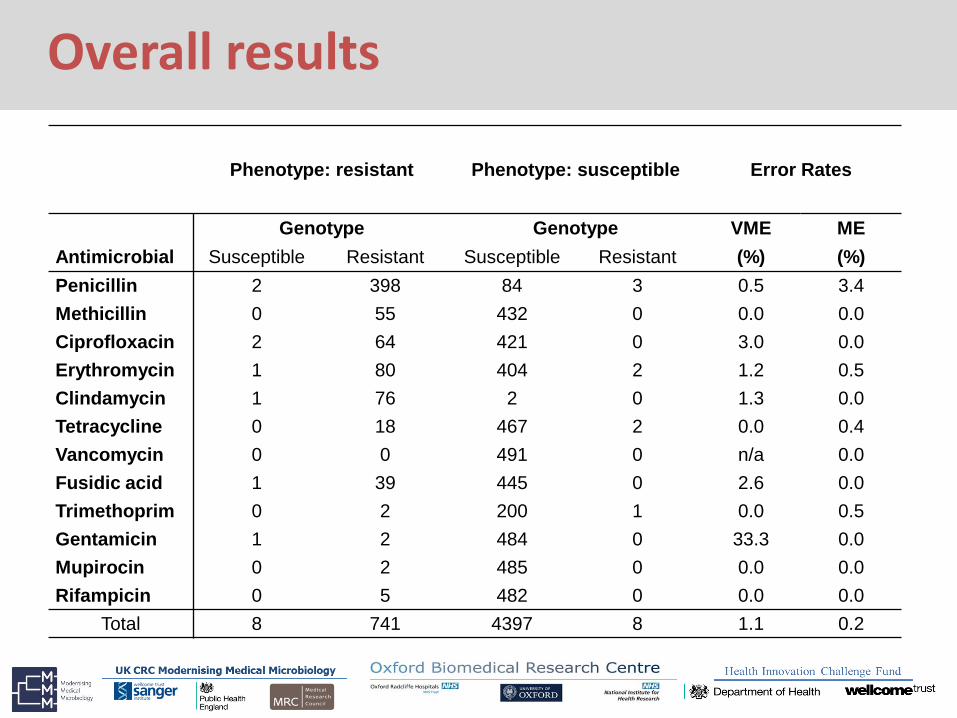
Overall results
Phenotype: resistant Phenotype: susceptible Error Rates
Genotype Genotype VME ME
Antimicrobial Susceptible Resistant Susceptible Resistant (%) (%)
Penicillin 2 398 84 3 0.5 3.4
Methicillin 0 55 432 0 0.0 0.0
Ciprofloxacin 2 64 421 0 3.0 0.0
Erythromycin 1 80 404 2 1.2 0.5
Clindamycin 1 76 2 0 1.3 0.0
Tetracycline 0 18 467 2 0.0 0.4
Vancomycin 0 0 491 0 n/a 0.0
Fusidic acid 1 39 445 0 2.6 0.0
Trimethoprim 0 2 200 1 0.0 0.5
Gentamicin 1 2 484 0 33.3 0.0
Mupirocin 0 2 485 0 0.0 0.0
Rifampicin 0 5 482 0 0.0 0.0
Total 8 741 4397 8 1.1 0.2

Previous phenotyping studies
Study Comparison no of
isolates
Categorical
agreement
(%)
ME rate
(%)
VME rate
(%)
Ligozzi 2002 Vitek 2 vs agar dilution 100 94-100 0 0
Fahr 2003 BD Phoenix vs broth dilution
plus mecA PCR 116 97.6 1.2 1.7
Nonhoff 2005 Vitek 2 vs agar dilution 273 - 1.5 0.7
Carroll 2006 BD Phoenix vs agar dilution 232 98.2 0.3 0.4
Giani 2012 BD Phoenix vs broth dilution 95 98 1.3 2.1
Bobenchik 2014 Vitek 2 vs broth dilution 134 98.9 0.1 1.4
This study WGS vs combined disc
diffusion / BD Phoenix 491 98.8 0.2 1.1
Problems
• low frequency of resistance for some antimicrobials leading to inaccurate estimates of specificity
• Needs further testing with “rare” resistance determinants
• reflects resistance patterns in local population • No VISA / daptomycin / linezolid resistance
• unknown / emerging resistance determinants
VIRULENCE
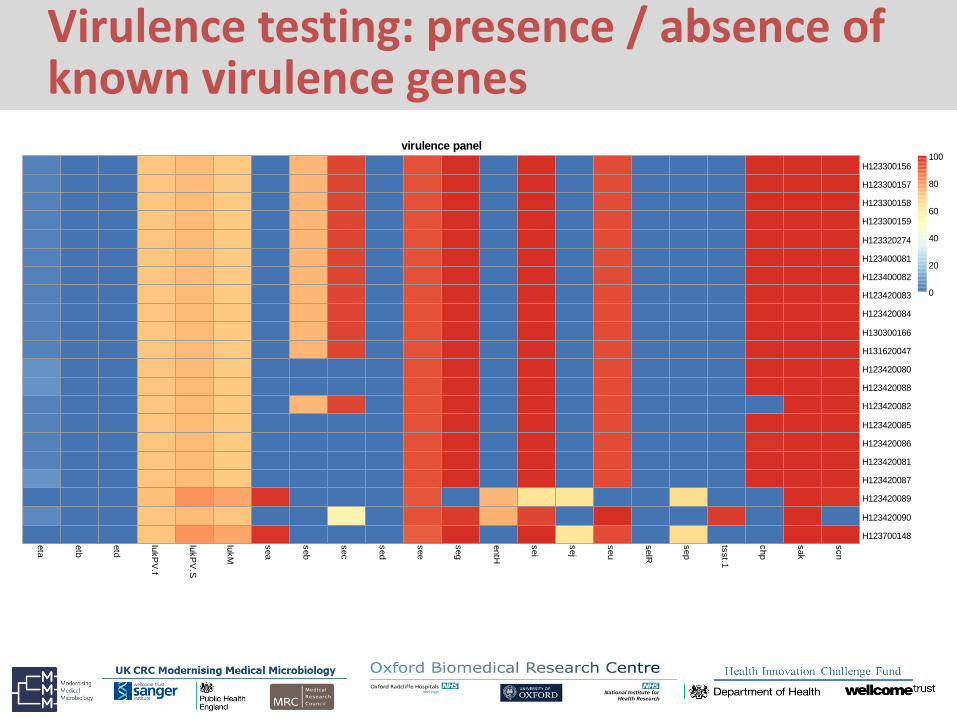
Virulence testing: presence / absence of known virulence genes
virulence panel
eta
etb
etd
lukP
V.f
lukP
V.S
lukM
sea
seb
sec
sed
see
seg
entH
sei
sej
seu
selR
sep
tsst.1
chp
sak
scn
H123300156
H123300157
H123300158
H123300159
H123320274
H123400081
H123400082
H123420083
H123420084
H130300166
H131620047
H123420080
H123420088
H123420082
H123420085
H123420086
H123420081
H123420087
H123420089
H123420090
H123700148
0
20
40
60
80
100
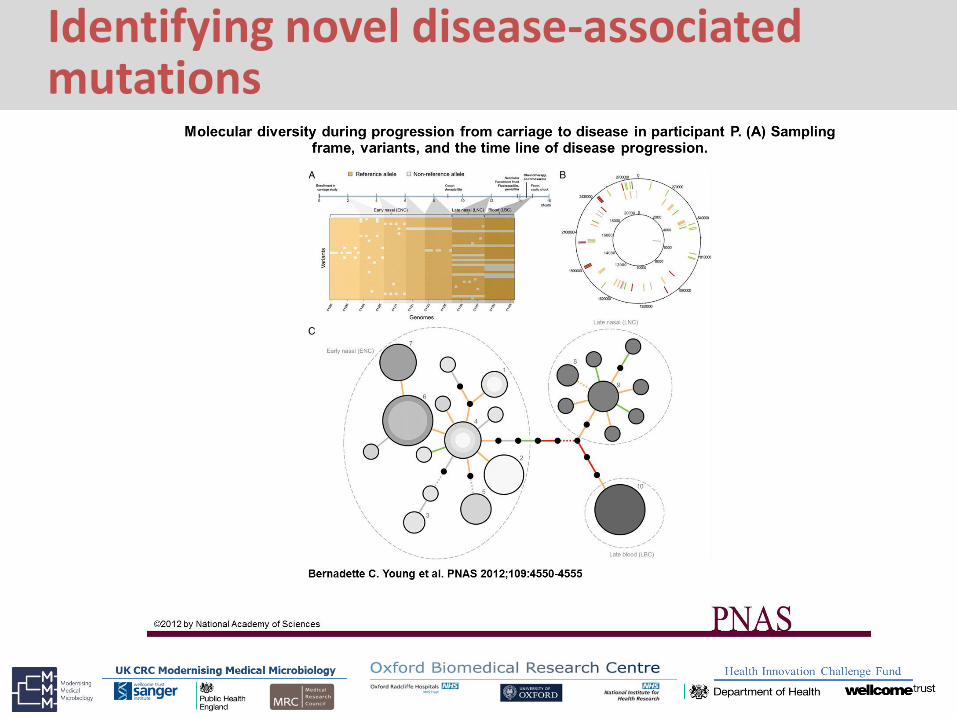
Identifying novel disease-associated mutations

Comparison of methods
Manual Automated PCR In silico
Platforms Disc diffusion,
broth dilution
Vitek, Phoenix,
Microscan
GeneXpert,
IDI-MRSA,
Nuclisens
Easy-Q
MiSeq,
Ion Torrent
Type of test
Phenotypic
Phenotypic
Genotypic
Genotypic
No of samples
Single
Batch
(approx 20)
Single
or batch
Batch
(currently 16)
No of anti-
microbials
4-6 per plate
Approx 20
1-2
Potentially
unlimited
Turnaround
time 18-24 hrs 4-24hrs 2-4hrs 27hrs

Current processing
Resistance profile
Speciation
Rapid ID / MRSA
Virulence profile, spa type
PFGE for outbreaks
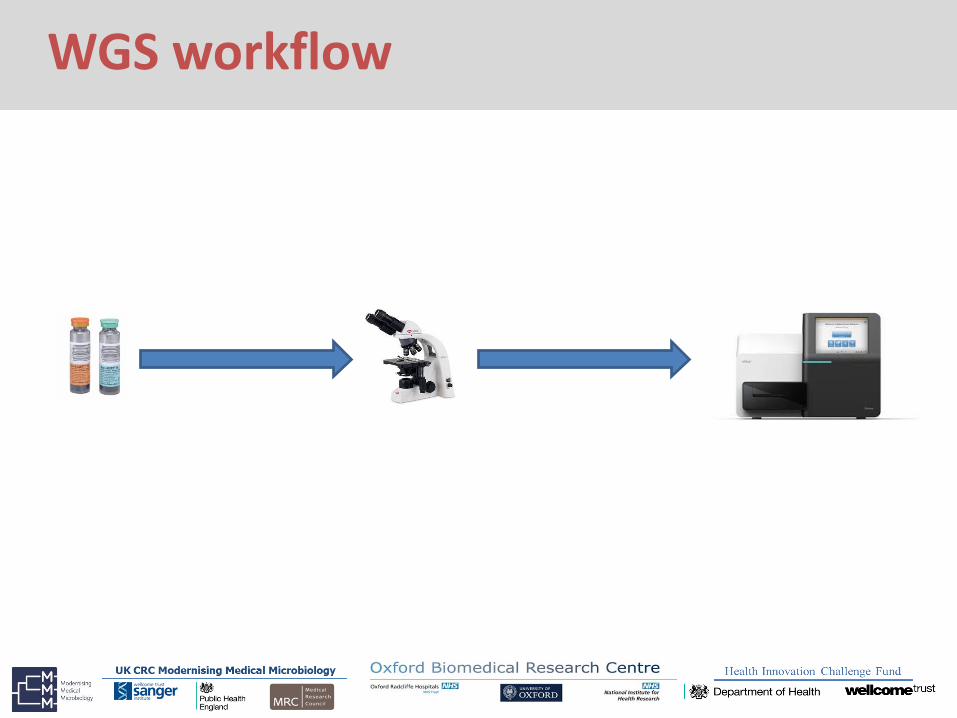
WGS workflow

Too expensive?
• Standard investigation • Culture
• Resistance testing
• Virulence testing
• Spa typing, PFGE
• WGS • Culture?
• Resistance profile
• Virulence profile
• Typing
~£20 per isolate
~£40 per isolate

Equipment
High throughput
Benchtop
Palm top

Sequencing on your laptop?

Processing / bioinformatics
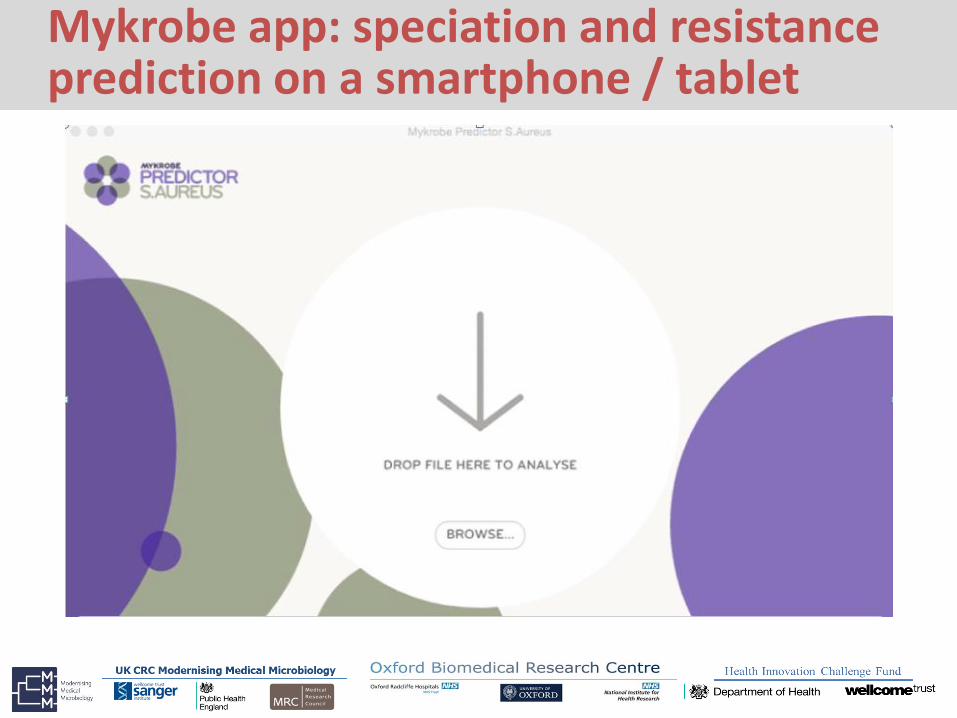
Mykrobe app: speciation and resistance prediction on a smartphone / tablet

Drag and drop raw data
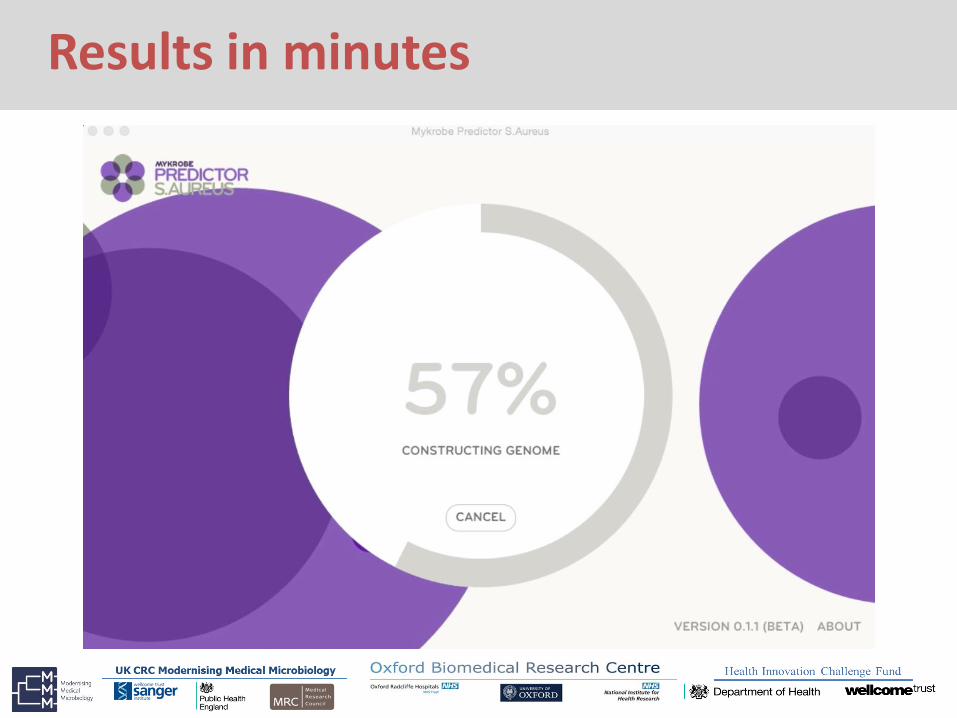
Results in minutes

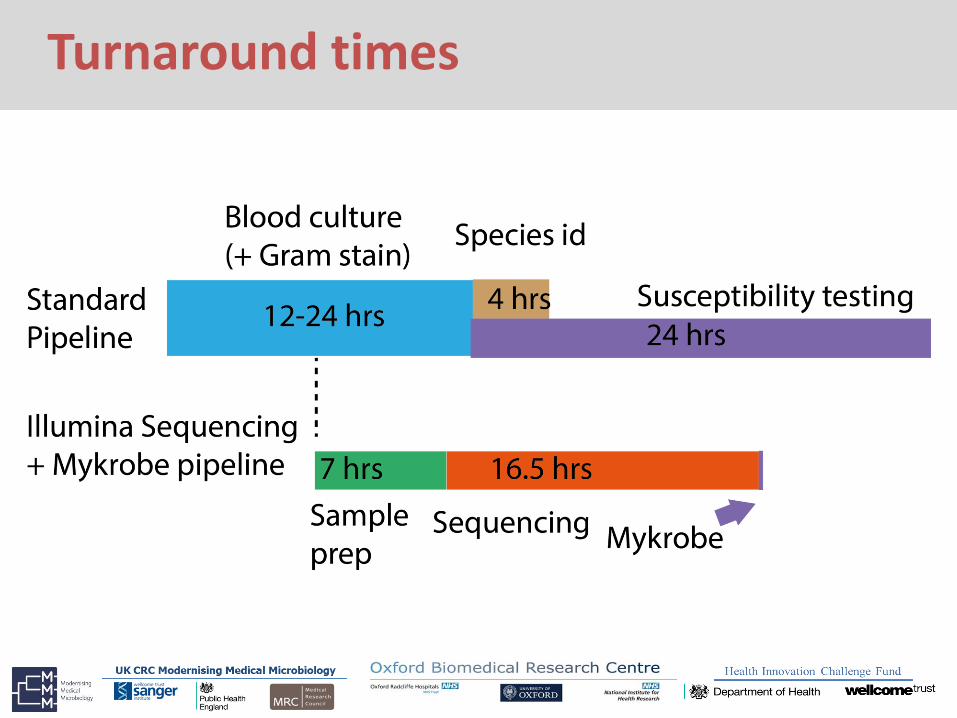
Turnaround times

Conclusions
• For S. aureus • WGS has greater resolution than current standard typing for
outbreak investigation
• WGS data reliably predicted antimicrobial resistance for majority
of isolates tested, with overall error rates equivalent to current phenotyping tests
• Cost / turnaround time for WGS approaching those of standard
typing

Other organisms
• Enterobacteriacea, C. difficile
• TB
• Viruses
• Fastidious organisms mykrobe.com

Acknowledgements
Oxford Dr Tanya Golubchik
Dr Richard Everitt
John Finney
Prof Tim Peto
Prof Derrick Crook
Prof Sarah Walker
Marcus Morgan
Dr David Eyre
Mykrobe Phelim Bradley
Dr Zam Iqbal
Brighton Dr James Price
Kevin Cole
Dr John Paul
Public Heath England Dr Bruno Pichon
Prof Angela Kearns
Prof Barry Cookson
Outbreaks Dr Ginny Moore
Dr Peter Wilson
Dr James Nash