wholesale banks & asset managers: winning under pressure€¦ · executive summary the contrast...
TRANSCRIPT

Wholesale Banks & Asset Managers
Winning Under Pressure
Pressures on Asset Managers are reshaping the securities industry. To emerge a winner, Asset Managers must cut costs & enhance investment processes, requiring tech investment. Banks must focus on faster growing corporate
wallet & innovate to unlock growth. Act now before market appreciation slows.

Authors
Betsy L. Graseck, CFA1
Magdalena L Stoklosa, CFA2
Michael J. Cyprys, CFA, CPA1
Bruce Hamilton2
Anil Sharma, CFA2
Manan Gosalia1
Giulia Aurora Miotto, CFA2
Ryan Kenny1
MORGAN STANLEY OLIVER WYMAN
James Davis
Christian Edelmann, CFA
Mariya Rosberg
Ben Holroyd
Julian Gorski
Oliver Lambert
1 Morgan Stanley & Co. LLC2 Morgan Stanley & Co. International plc

Contents Executive Summary
Asset Managers
Wholesale Banks

Executive SummaryThe contrast between winners and losers should be stark as Wholesale Banks and Asset Managers battle for near-term growth while positioning themselves to benefit from powerful longer-term shifts.
10 years since the financial crisis, the focus is back on growth. Rising rates, robust economic tailwinds and tax stimulus in the US promise a more favorable trading and investment environment that should provide near-term relief for both Banks and Asset Managers.
At the same time a confluence of factors creates conditions for a new wave of strategic shifts that will define the future industry structure:
Investors challenging value-for-money in active asset man-agement, pressuring revenue pools across buy- and sell-side A race to apply new technologies and approaches from Big Tech to reinvent core processes and value propositionsAn easing of capital pressures on Wholesale Banks, and an abundance of growth capital for challengersNew regulations that increase transparency across the buy- and sell-side, eroding some traditional bank advantages and putting new obligations on the buy-side
These fundamental trends will drive a reorientation of market share. We expect profit pools for both Wholesale Banks and Asset Man-agers will be under pressure after a robust 2018. Yet these structural changes also create opportunities to build new propositions and business models. The winners will be those that can both capture the near-term growth and invest in building innovative capabilities that will create the next set of competitive advantages.
Priorities for the C-Suite
Revenue pools are pressured and their mix is changing – how to capi-talize:
Asset Managers
Don’t be fooled by rising markets: while AuM grew by 13% last year, revenue growth lagged by 4ppt with the gap widening. Address costs now: costs have not been contained, implying margins are vulnerable. We think outsourcing, automation and changing compensation structures can address 40% of total costs.Re-invent core activities: apply data science to distribution and embed in the investment process.
Wholesale Banks
Innovate in new models to serve institutional clients as growth slows to 2% CAGR in that segment.Increase focus on the expanding corporate wallet, growing 4% in the medium term.Invest in automation and integrated services to win CFO-down corporate business.Focus on areas of strength to capture market share. New Active Solutions can add $15-20bn to revenue pools.

Asset Managers
Continued cost challenges could reach a critical level. In 2017, Asset Managers did not deliver positive operating leverage despite strong AuM growth. Industry revenues grew 4ppt slower than AuM in 2017, while absolute costs increased by 8%. Fee pressure is not evenly spread. Firms with capacity-constrained strategies have been more resilient. For others we do not expect pressure to abate. In our base case, we project industry-wide AuM growth of 10% from 2017 to 2020 to be offset by 13% in fee pressure and the continued shift to passive. Lower market returns combined with fee pressure will force the industry to evolve its stubborn cost structure. A bear case could force much more significant restructuring.
Disruption in the distribution layer is a key risk. In the most extreme case, distribution would move to an Amazon-type market-place meaning funds directly provided to end investors, eroding Asset Managers’ control significantly. We estimate that up to 50% of fees would be at risk in this scenario as the industry would face a mag-netic pull to Vanguard-like pricing for actively managed products, which we reflect in our new bear case. At the same time the growth of OCIO (outsourced chief investment officers who source high con-viction active strategies and cheap beta portfolios) offers the oppor-tunity for Asset Managers to capture value in advisory – and the risk of being pushed out of this space by third parties.
How to win under pressure? In the near term, data and technology efforts should be focused on tangible cost and efficiency gains. We estimate automation can reduce costs by ~20% on average and out-sourcing by a further ~10%. Data management still represents 10-20% of costs. Many managers have attempted large scale re-plat-forming but have achieved only mediocre savings, struggled with future-proofing and hampered their front-end agility. The use of data aggregation software can more effectively support near-term growth initiatives.
Data science and artificial intelligence can help streamline the investment and distribution processes – but this will only be a source of real alpha for a few. Building an edge around proprietary data and analytics is increasingly difficult as publicly available data and algorithms proliferate. While technology offers great potential to streamline the investment process, we think only a handful of managers with truly distinctive talent models or sources of proprie-tary data/analytics will be able to use this to drive alpha. Applying these techniques to better hone and target distribution may have a more immediate impact.

In our view, these factors will shift revenue capture away from tradi-tional product providers and towards other providers in adjacent parts of the value chain:
New services that transform costs from pressured mid-size and smaller firms into revenues for service providers.Revenue capture by the sources of proprietary data as they take a slice of the alpha they create. Polarization of distribution between high-touch solutions (such as OCIO) and low-frill distribution platforms, forcing traditional product providers to concede on fees. The biggest shift may yet be in product provision itself with cheap beta and Alternatives or capacity-constrained alpha products squeezing the rest.
The biggest are better positioned. Cost as a proportion of AuM for large firms is on average half that of smaller peers. Meanwhile, active outflows for Asset Managers with <$100 billion in AuM have been twice the industry average despite the ability of many to outperform their larger peers. This indicates growing economies of scale in distri-bution. Larger firms have also proven to be better positioned to shift the business towards growth opportunities, such as Alternatives, and to fund innovation.
Wholesale Banks
Short-term rebound, but muted longer-term revenue growth. We estimate industry revenues will grow ~5% in 2018, driven by a rebound in volatility and robust macroeconomic growth. Wholesale banks with a broader perimeter will also benefit from the positive impact of rate rises on adjacent deposit-taking businesses. We take a more cautious view on the longer-term outlook, expecting industry revenues to slow to ~3% per annum to 2020, due to structural pres-sure on the institutional wallet. Our bull/bear range is +5%
versus our 2020 base case estimate.
Winning market share will be key to individual banks’ RoE out-performance. Banks delivered an average 10% RoE in 2017, and while US tax changes (worth up to +2ppt to RoE), capital and regulatory relief will be positives, we expect performance across banks will be skewed. The spread between top and bottom quartile RoEs is already more than 5ppt, but we believe the fight for share could widen this significantly.
There will be a material shift from institutional to corporate wal-lets. We estimate the institutional wallet faces $15-25 billion of structural pressure, limiting growth in our 2017-20 base case sce-nario to 2% CAGR. In contrast, we estimate the corporate wallet will grow at 4% CAGR and will be more resilient. However, corporates are expensive to cover – including lending costs, the industry earned less than its cost of equity in 2017. Wholesale Banks with a broader perim-eter will benefit from rising rates and a better ability to monetize fixed lending and infrastructure costs across broad product offer-ings.

Scope of business model and client mix will drive further skews.For the institutional pool, new technology and increasing transpar-ency drive value to the largest players and technology-driven special-ists. Capital remains a source of advantage but margins will be pressured as banks swarm around the same opportunities. For corpo-rates, banks skewed towards the IBD-driven “CFO-up” activity set should achieve higher but more volatile returns. Banks focused on the “CFO-down” activity set, including debt and transaction banking, are likely to see lower returns but more stable growth. Rising rates will contribute to an expected uplift of $10 billion for these products. Leaders will invest this incremental revenue in building the tech-nology to create new competitive advantages and defend against Fin-Tech disruption.
The race is on to develop Active Solutions with growth poten-tially worth $15-20 billion in revenues. Efforts by banks to mone-tize data have had mixed results to date. Banks should learn from Big Tech to design propositions that bind together data and function, and tackle broader client problems. Examples include outsourced execu-tion or risk analytics for institutional clients, and integrated treasury solutions for corporates. But this revenue will be competed for not just by banks, but also tech providers, funds and market infrastruc-ture firms.
The effectiveness of innovation and technology spend should be the key focus. We estimate the leading players are outspending mid-tier rivals on innovation by as much as 3 to 1. Yet it is not all about the amount of spend – focus and disciplined execution are vital to drive initiatives to scale. And with total technology spend now worth $30 billion across the industry (15-20% of industry cost-base), managing the transition to a modular platform architecture and to an agile delivery model will also be critical.
Scale players, broad-based corporate franchises and specialist players are well placed, while regional skews are increasingly stark. Large US banks have gained 8ppt of revenue share over the last 5 years, and tax reform adds to their advantages. This raises pro-found questions for EU banks and policymakers over the future shape of the wholesale sector in Europe. Policy on Brexit and cross-border consolidation are key debate points.
The war for talent will separate the diamonds from the rough. As banks reimagine the business around technology and data, they will need to manage a transition in the talent model – including a ~20% shift in spend away from traditional roles and towards technologists and quants. Positioning for this shift in talent and operating model will be vital to win in the long run. And it must be delivered while also winning the near-term hunt for share and earnings advantage.

1. Growing pressure points
Buoyant global markets have bought time for Asset Managers.Industry AuM grew 13% in 2017, with strong markets accounting for ~70% of this, and pushing revenues up 9%. The removal of central bank liquidity from markets has been a significant driver of more con-ducive conditions for active managers and – at an industry level – outflows from active strategies halted in 2017. Yet structural pres-sures did not abate – the gap between AuM and revenue growth is increasing, effectively taking 4ppt off industry revenue pools. Flows into passive have reached all-time highs, growing by almost 20% over a two-year period. Our discussions with investors suggest a deep shift in their perception of value-for-money that is unlikely to reverse. Our base case for 2020 anticipates a further 13% structural drag on industry revenues, implying modestly declining industry-wide revenue pools.
Asset Managers
Pressure is most acute within equities. Active equities saw net out-flows through 2016 and 2017 despite the supportive market back-drop. Asset Managers will need a demonstrable improvement in their ability to generate alpha in 2018 to stem further flows to pas-sive. Yet, industry-level averages disguise growing dispersion across firms. In US equities, 53% of total industry AuM in managed products sits in low performance / low fee strategies. Yet we find the strongest flows for high performance / high fee strategies, which are mainly strategies with capacity constraints. This bucket also shows signifi-cantly lower fee pressure, as managers can hold the line on fees for capacity-constrained offerings.

Active fixed income products grew AuM, albeit at less than half the rate of their passive siblings. We are seeing fast-growing acceptance of passive structures in fixed income as a portfolio (hedging) tool and as an investment class, and we expect further growth. Passive accounts for only 19% of fixed income AuM today, compared to 39% in equities.
Cost management is an increasingly important value driver. The industry made little progress on the cost agenda in 2017. Growing compensation pay-outs (often for beta), new investments and regu-latory costs offset any cost saving initiatives, pushing absolute costs up 8%. In addition, firms are anticipating MiFID II driven cost increases as they begin to bear the cost of sell-side research, upgrade risk, reporting and trading systems among other elements. The lack of more positive operating leverage (i.e. revenue growth in excess of cost growth) in a year of stellar AuM growth is a major source for concern. Managers able to instil stronger cost discipline will be at an advantage when the cycle turns.
A bear scenario could trigger much deeper restructuring. Our base case is for solid asset growth, with the gradual adjustment of interest rates and their knock-on effect weighing on equity valua-tions. This translates into 10% AuM growth by 2020 versus 2017, and revenues slightly down. Our bull case would see a stronger recovery, buying the industry time. Our bear scenario factors in a sharp asset price correction, which when combined with greater fee pressure could see industry revenues fall by nearly 30%.

A bear market is likely to have a more sustained impact than in the past. In prior cycles, it has taken AuM less than ~3 years to recover, hence limiting the need to structurally address the cost problem. We believe that in the current environment of increased regulatory scrutiny and a growing demand for value-for-money the next bear market may have a more sustained impact by triggering a shift in pricing levels on the back of distribution models where Asset Managers will become more of a price taker.
Shifts in distribution dynamics will be a key determinant of how far and how fast the industry moves. Current distribution models come with some control for Asset Managers, supporting higher fee structures. In an extreme case, we could see the emergence of an Amazon-like marketplace – distribution largely disintermediated (i.e. directly provided to end investors) and unbundled from advice. This is the exact opposite from how most markets are structured today where advice remains bundled and intermediated, for example via bank distributors, independent financial advisers (IFAs) or invest-ment consultants. Such an outcome would lead to significantly more price transparency and a magnetic pull to a Vanguard-like pricing for active management. We estimate this could eliminate up to 50% of industry revenues. While an outlying scenario and subject to geo-graphic variation, we believe this has the potential to be pioneered in large EM markets such as China.
We believe that a change in distribution dynamics and the associ-ated fee pressure is the far more likely outcome of a bear market than an accelerated shift to new pricing models. Indeed, pricing models such as fulcrum fees (which adjust up or down based on benchmark outperformance / underperformance) are already being tested in the market. Yet investors we have spoken to almost unani-mously raise as a major concern the inherent conflicts of interest that occur in more performance-driven fee structures. We also note that most Asset Managers lack the required capitalization levels for a large-scale shift in pricing models to be feasible.
In the US, the growth of OCIO creates a further distribution headache for Asset Managers. We see growing potential for Asset Managers to be disintermediated as the value in portfolio composi-tion and creation is increasingly captured by OCIOs (outsourced chief investment officers) who look to serve asset owners by sourcing high conviction active strategies and cheap beta portfolios. Asset
anagers face a challenging question: whether to build in-house OCIO capabilities, but possibly dilute a more distinct value proposition as an alpha or beta manufacturer, or treat third-party OCIOs as a growing distribution channel with a strong value-for-money emphasis in asset sourcing. Moderating this view, we observe evi-dence of the opposite, primarily in Continental Europe, as even smaller asset owners look to keep more capabilities in-house.

2. The role of technology and data:efficiency first
Cost reduction is the most tangible outcome of technology and data in the short term. We believe technology and data will trans-form the industry in three ways, by:
Significantly lowering the cost structure, Offering enhanced ways to create alpha, and Reshaping the existing workforce.
While some of these are already under way, changes are unlikely to be uniform nor are they likely to occur at the same pace or magnitude. We view the cost opportunity to be the most material and tangible in the short term. In contrast, most traditional firms are at an experi-mental stage in terms of applying new data-sets and AI in the invest-ment process. The impact on the workforce of the future is often neglected but should be an emerging top 3 item on the agenda of CEOs.
Cost
The biggest potential cost lever is automation and better use of data and analytics. Firms typically spend 10-20% of their cost base on data management and are now thinking hard about how to increase the impact of their spend. Many have viewed this as a re-platforming challenge requiring large scale rationalization via multi-year programs. However, mediocre savings, the difficulty of future-proofing, and the negative impact on front-end agility have forced a change in mindset. Use of data aggregation software presents a more immediate solution, while rationalization (internally and of vendors) can continue behind the scenes. In our view, success in data aggregation is a much higher priority than distributed ledger technology – a space a few Asset Managers have been experimenting with. We expect it will be the vendors who will likely drive change in distributed ledger technology rather than Asset Managers.
More radical outsourcing can offer significant savings that are as yet unrealized. We estimate ~40% of processing and administration costs are personnel, despite the high potential for automation. The battle is on among provider companies (trust banks, infrastructure firms, and some Asset Managers themselves looking to bring more scale on their proprietary platforms) to develop the winning proposi-tion, with the goal to deliver a more robust, scalable technology-driven solution compared to prior waves of lift-outs. In addition, deploying these as a service hosted on vendor platforms can strip out further IT infrastructure costs. Together, these can offer material
savings in the middle and back office – we estimate up to 10% for the average Asset Manager. The maturing vendor landscape will increase potential savings in existing outsourced functions, but also increase the scope for outsourcing. This will spread more into front office activities, for example execution and order management in liquid asset classes.
Economies of scale in the middle and back office are likely to be undermined. Mid-sized and smaller firms will increasingly be able to buy scale rather than having to build it, eroding the advantage of larger peers. Bargaining power will still allow large players to access best-in-class vendors at lower cost, but this advantage is receding. Rising regulatory overheads will preserve economies of scale for large players, though activities like reporting will also be outsource-able. We also see indirect regulatory impacts: as Asset Managers begin to bear the cost of research and make additional infrastructure changes (e.g. reporting/audit) due to MiFID II, we expect smaller firms to have less latitude to bring research in-house or negotiate lower prices with providers.
We see scope to reimagine the operating model using ‘green-field’ builds. Many Asset Managers still rely on infrastructure and technology dating back decades. We see a strong case for ‘greenfield’ builds. Under this approach, technology firms, working in partner-ship with Asset Managers, could launch a platform-based offering with a core data integration and orchestration layer, combined with a strong analytics environment, and an open application program-ming interface (API) front-end. The speed of transformation for Asset Managers migrating to such a platform could be rapid.

Alpha Generation
The near-term impact of artificial intelligence (AI) on the invest-ment function is over-estimated. Although alternative data has been utilized by some Asset Managers for years, the fear of falling behind has recently prompted most firms to act. Specialist alterna-tive data teams are being created and data scientists are being hired. The current number of job openings for data scientists is comparable to the current stock already employed by Asset Managers. But it is often unclear how they fit into the investment process: in our experi-ence many analysts and portfolio managers are unclear on the role data scientists should play. Few firms have managed to build the required bridges.
Proliferation may already threaten the opportunity. Over 100 alternative data vendors have emerged, and the number of alterna-tive data types continues to grow. Some hedge funds are now looking for exclusive access but the half-life of proprietary data is likely to shorten as the creation and provision of data accelerates. There is also a growing number of publicly available libraries of machine-learning algorithms. We see leaders in this space working with a hybrid approach, developing proprietary capabilities in conjunction with vendor-provided or publicly available components. However, when proliferated broadly, inherent alpha decay will occur.
In our view, this will be an arms race but not necessarily all about scale. Spend on data, data scientists and technology will naturally favor deep pockets. But we believe that success in this space will go beyond financial firepower. We see four components of success in data and AI; only one or two of these are ultimately scale driven.
Cultural integration: need to define upfront how new data-driven insights are embedded in the investment process and what KPIs are used to measure success. Technical expertise: primarily driven by the level of sophis-tication of data analytics, but having a rapid feedback loop to test and improve is critical. Financial firepower: ability to hire the best talent and acquire or generate proprietary data. Risk management: ability to understand new risks such as data protection laws or potential infringement on patent rights.

The power of data may be greater in distribution. While the long-term battle may indeed be in investment management, leveraging data effectively can yield more short-term results in distribution. In the institutional space, few firms systematically mine customer rela-tionship management (CRM) and other internal information and combine it with readily available third-party information on clients’ or prospects’ asset allocation and mandate performance. Client cohort analysis with behavior flags and predictive analytics for assets at risk are other areas where we see leaders building capabilities quickly. In wholesale distribution, we believe managers with access to data collected from distributors can derive differentiated insights on product needs and usage.
Workforce
The long-term impact of technology will be a fundamental shift in the workforce. We expect headcount to reduce due to automa-tion and externalization of the skill-set. We also estimate that up to 40% of the workforce will require fundamental re-training. This will be most significant in portfolio management and asset administra-tion roles where the use of better data and analytics will transform roles. As a result, compensation structures will shift. Investment management will continue to demand the lion’s share of compensa-tion spend. Technology and Data Management’s share of compensa-
tion will grow fourfold whereas relative spend on automated back office functions will decrease. The share of Distribution will remain largely flat but we expect this role to shift most fundamentally as data and technology will be increasingly important at the interface to customers.

Overseeing this transition should be a CEO role. The depth and speed of change required far exceeds the traditional change manage-ment process handled by HR departments. We believe that the work-force of the future is a CEO topic, requiring strong top-down guidance and a clear understanding of how the organizational setup and glue will have to change. However, we view this as a 5-7 year journey requiring many boards to also adjust incentives for the C-suite.
3. The power of scale and scope
The biggest Asset Managers are still best positioned. Large man-agers have traditionally benefited from scale advantages in their cost structures. They are also proving more resilient in terms of outflows in active management. Firms with less than $100 billion in AuM expe-rienced outflows on their active funds of ~6% per annum, compared to 2% for their larger counterparts in the last three years, despite comparable overall performance results. In our view, this reflects growing economies of scale in distribution. In retail, we observe a culling of some Asset Managers from platforms and a more institu-tional-style selection process. The dynamics are similar in the institu-tional space as more asset owners look for strategic partnerships.
Larger players have recently been more effective in shifting their business models to Alternatives. Alternatives currently account for ~10% of industry AuM and 30% of industry revenues. We believe the revenue share could grow to ~40% by 2025, making the ability to compete effectively in this space ever more important. We find that over the period of 2012 to 2017, diversified Asset Managers have seen stronger flows than their stand-alone Alternatives peers. We also observe that larger firms originally missed this trend but recent attention has increased, with ground often recovered through M&A.
Uncertainty on the future of distribution will also benefit scale players. Large players that can diversify their bets will be better placed. As regulators look to bring down total costs for end inves-tors, the end state is unclear. In particular, the full impact of MiFID II is not yet known. We see evidence that, in contrast to expectations of more openness, more integrated models are gaining traction and third-party funds are being cut off from distribution platforms. Leaders are already able to diversify their bets by launching direct distribution in test markets, or acquiring IFA/RIA advisor platforms that can ultimately be turned into direct-to-customer propositions.

This importance of scale will force clearer choices on business models. Asset Managers with over $0.5 trillion in AuM are on average 2x more efficient than smaller peers in terms of cost as a proportion of AuM. Complexity of business model is a major driver of bloated costs. For example, we estimate multi-jurisdictional Euro-pean managers’ costs are 10-20% higher than equivalent US-only peers. Yet even among groups of similar-size Asset Managers we see a high dispersion in costs. This is particularly acute among smaller firms where leaders are able to drastically outperform peers through a combination of focused business models and strong cost discipline. We believe that clearer choices will be required on where and how to compete, including significant clean-up of the international footprint for many. MiFID II may accelerate this journey as absorbing research costs may impact the profitability of smaller firms to a much larger extent.
Cost-driven M&A fades in attractiveness. Traditional M&A tends to exacerbate the challenge of layered and knotted infrastructure. Technology developments are now moving at such speed that multi-year programs to overhaul infrastructure will be outdated by the time of launch. As a result, savings targets can be hard to meet and, critically, management bandwidth is focused inwardly and on existing processes, rather than outwardly and on future approaches. We expect M&A to be increasingly focused on skills, particularly in the areas of quantitative and systematic investing, and on access to distribution channels
It is not only a scale game: forces of scale differ significantly across the value chain. We see five business models emerging ( ). These are non-mutually exclusive and come with dis-tinct success factors and varied forces of scale.
Asset managers traditionally occupy the role of ‘product providers’. Many have aimed to expand their offering by also providing Solu-tions, such as OCIO, yet the skill set is a very different one and few have figured out how to play effectively across both dimensions. Clarity on where and how to compete will also be critical for strengthening brand propositions, which remain fairly weak for most.
In addition, many firms, particularly in Europe, manage in-house dis-tribution and fund adminstration platforms, typically out of their back office. With the recent growth of independent platforms and the associated interest of private equity firms in this business, man-agers will be forced to make strategic choices: opening up to third parties or selling to private equity firms or a consolidator.
Likewise, a growing number of firms are looking to replicate the suc-cess of some Asset Managers by offering in-house infrastructure to third parties. Again, the skill set to succeed is markedly different from managers’ traditional core competencies. Moreover, scale benefits are evident: we are likely to see industry consolidation after an initial period of fragmentation.
Finally, we see a growing role for capital providers to bridge cus-tomers’ cash flow needs. Guaranteeing certain outcomes, even if they come at the expense of capping upside, is in growing demand, particularly in the affluent and mass market. This creates a role for capital providers beyond the traditional offering of life insurance products.

We expect a significant value shift over 5 years. Today value is highly concentrated in the product provider bucket. In the medium-term we expect significant shifts across and, importantly, within these buckets – the most meaningful being:
As outsourcing accelerates, infrastructure / data providers will accrue value but also release costs in the bucket of the product providers. Proprietary data providers will take a larger share of the available pie, for example by demanding a share of the alpha achieved. As distribution models further polarize towards high-touch solutions and low-frill platform approaches, providers in these buckets will benefit to the detriment of traditional distribution channels and product providers who will have to concede on fees in order to get access and ultimately distribution success in a more transparent world.
The biggest shift is likely to happen between the product providers where those with cheap beta or capacity-con-strained alpha products will win to the detriment of those losing out based on scale or capability.
These value shifts may appear radical at first glance, but we already see pockets of evidence for them. Strong management action is required to be among the winners.

Messages from Our Proprietary Survey
Key takeaways from our meetings with senior executives of Asset Managers with ~$11 trillion of combined assets under management.
Various levels of urgency.
The need to restructure is widely accepted but some firms do not yet feel the urgency: if they are delivering excellent returns, then they are still making good money even if their back/middle offices are inefficient, making this less of a focus for them.
Leveraging tech to reshape the model is critical, but tough to execute.
A few firms noted that IT transformation is quite difficult and requires intense focus from management, while others seemed confident about their IT positioning.
Data’s transformation of the investment function is a never-ending race. Asset managers want more data to keep an edge on quant investing – once a signal is understood by the market, it loses its utility. This creates a never-ending quest for data and analytics to create insights from the data.
Most firms do not feel threatened by Big Tech. They point out that Silicon Valley is not used to the money business or the heavy regulations that come along with it. Among those Asset Managers concerned, the expected threat is bigger on the distribution than on the manufacturing side.
Culture matters. Data scientists have a fundamentally different skill set, so firms must have a culture that trusts data scientists in order to foster effective innovation and experimentation.
Outsourcing could gather pace.
Most firms had positive views on outsourcing, especially in the middle office and in investment tools. Giving up control to a third party is not much of a concern as long as it is clear who owns the data.
A few Asset Managers were more skeptical of outsourcing – if you use one provider you become stuck with what they offer, and if you use multiple providers it becomes too complicated.
Artificial Intelligence is on the horizon.
There is a lot of discussion around AI. However, executives said that it takes time to implement, with various pilots and testing needed before it can actually be deployed. A key challenge they cited is always being ready to explain ‘what the machine does.’
The biggest immediate value the Asset Managers see in automation comes from removing cost from the middle office, where there is the most low-hanging fruit. Some firms have already capitalized on this, others have not.
Benefits from blockchain/distributed ledgers are distant, but could drive lower costs, better data management and cleaner data recording. Some firms expect blockchain to impact the industry significantly within 3 years, but most think it will take longer.
Executives are starting to understand the ramifications of pricing pressure.
Most firms we talked to indicated that continued fee pressure is a risk. Many executives said the increased transparency from MiFID II makes it hard for them to argue that prices will not go down.
New pricing models have come forward, but none has been clearly successful yet. Large Asset Managers are keeping their eye out, and selectively experimenting with new structures, but they expect change to be gradual.
Some commentary in the industry predicts fees could go down by as much as 40%.
We would like to thank the firms and individuals who took the time to meet with us.

1. Hunt for earnings advantage
The prospect of recovering fee pools and the easing of capital pressures is attracting a new focus on growth, and building new competitive advantages. As the industry emerges from 10 years of post-crisis restructuring, incumbents and challengers are now focused on driving earnings advantage. Revenues in 2018 look set to recover from a poor 2017, but, over a longer term, offer more muted growth. Structural changes in the client base and the adoption of new technologies by the industry will weigh on fee pools, as well as shift the basis for competition. Winners will be able to deploy both capital and talent to capture near-term growth opportunities as well as invest in the technologies and capabilities that will build new com-petitive advantages over the medium term.
Wholesale BanksWinning battle for market share will be a key determinant of RoE outperformance. The top quartile of banks achieved returns ~2x the bottom quartile in 2017. Underlying this is a stark divergence between US banks and European banks. Since 2013 large US banks as a group have gained 8ppt of market share in revenue terms, while the Europeans have lost share. Critically, this has driven an 11ppt divergence in profit generation, giving them deeper pockets to invest in the franchise and build new capabilities. In Economic Value Added (EVA) terms, after the cost of capital, US banks have grown four-fold while European banks have slid further into negative territory. Man-agement-driven levers around efficiency gains and, crucially, market share will be critical to individual results.
Capital pressures are easing across the board, but US tax reforms look set to underscore the advantage of US banks. Our estimates based on bank disclosures to date suggest that the US tax reforms can generate around ~200bp of additional RoE uplift for US banks’ wholesale divisions starting this year. The spoils of this will be split among shareholder returns, business investment, hiring and philan-thropy. US banks will also benefit from regulatory easing now antici-pated in 2018 for leverage, stress testing and liquidity, which will free up financial resources and increase balance sheet velocity.

European and Asian Banks have less to gain from US tax and regula-tory reform – we estimate 25-50bp. Furthermore, there is a risk that the Base Erosion and Anti-Abuse Tax (BEAT), which taxes some pay-ments between US and international affiliates, could have a negative impact. More broadly, however, most European banks now indicatethat they are in a much stronger capital position, and expect this to improve further. With returns in retail banking still relatively low, many will look to redeploy towards wholesale banking. Asian banks and a range of strategic investors and challengers are also looking to deploy more capital to the industry.
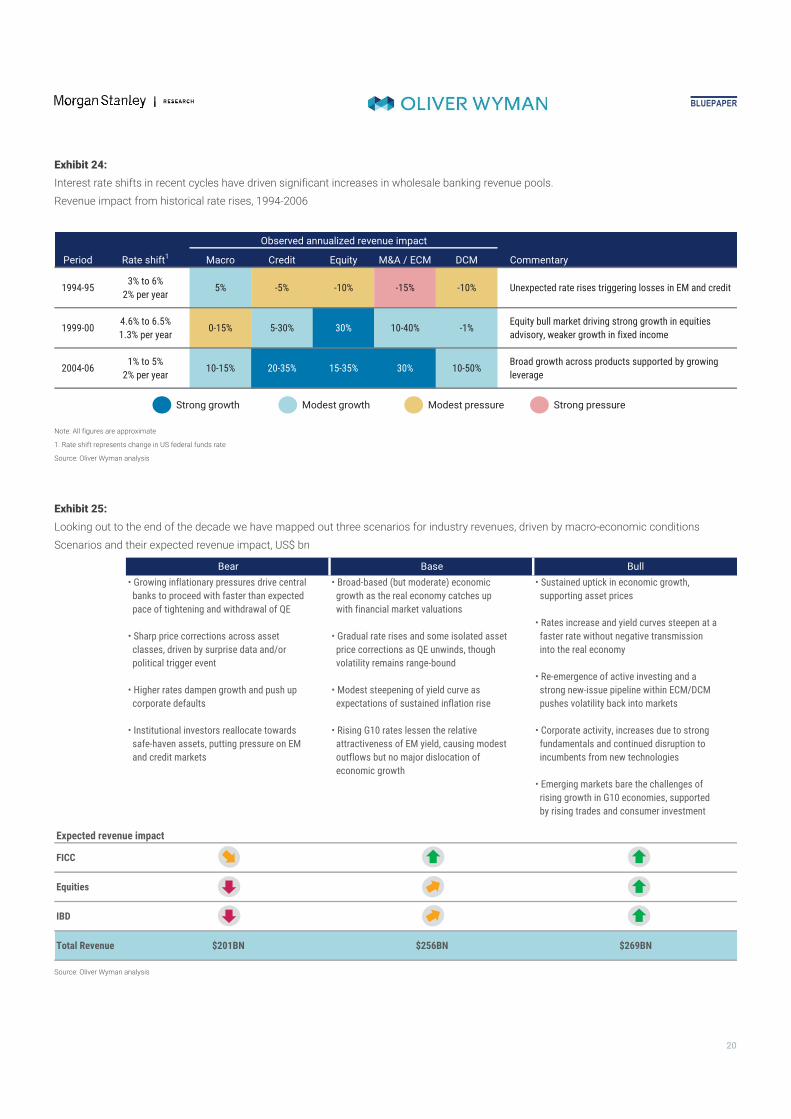
We expect industry revenues to recover by ~5% in 2018. Our base case is for broad-based economic growth accompanied by rising rates and the gradual unwinding of quantitative easing, driving more client activity in the sales and trading business compared to a subdued 2017, and continued healthy deal-making in investment banking. Our analysis of historical periods of rate rises suggests they deliver growth at the industry level, though the extent of the impact on the equity and advisory businesses is variable.
Yet, we remain cautious on the medium-term revenue outlook.Underlying this is a material shift in the revenue pool away from insti-tutional clients, and we expect a slowing in fee pool growth from 2018 onwards to ~2% CAGR. This results from three structural drivers weighing on institutional wallets, together a 15-25% drag on revenues in this segment:
further shifts to passive trading and data and quant-driven trading strategies; consolidation among mid-size Asset Managers and Banks; and market structure shifts – including continued electronifica-tion in fixed income and the unbundling of execution and research commissions in equities.

Corporate & Investment Banks (CIB) with broader business port-folios will benefit from rising rates and the ability to offer Active Client Solutions. Higher rates can benefit the net interest income associated with the deposit taking activities of wholesale transaction banking and securities services business lines. We estimate these adjacent activities could deliver incremental revenue growth of ~5% and ~4%, respectively. These businesses are relatively stable and are characterized by ‘sticky’ client relationships built around embedded operational activities. In addition to cyclically driven upside, these businesses offer scope for collaboration across divisions and the development of Active Client Solutions that can enhance client acquisition and retention.
Risks are skewed to the downside, but a bull scenario would add another 1ppt to RoE. Our bull case is anchored in sustained asset price increases, more favorable conditions for active investing and strong corporate finance activity, with broad-based revenue growth across products. This is reinforced by lower US corporate taxes. Our bear case assumes rising rates trigger corporate defaults, and sharp asset price corrections. Revenues in investment banking, equities, credit and EM fall rapidly, while macro trading revenues perform well.
Structural changes and technology are pressuring the tradi-tional value drivers for the industry. Sell-side value propositions have been based around Connectivity, Content or Capital (the ‘3 Cs’). All of these are pressured today, threatening $20-40 billion in reve-nues:
Connectivity – enabling access and proprietary networks – is threatened by increasing electronification and transpar-ency around client interactions. ‘Modular’ operating models also break down linkages to other banking prod-ucts, shifting revenue to FinTechs and infrastructures.Content – competition is intensifying from specialists such as boutiques in investment banking and trading firms using advanced analytics. Meanwhile, banks are struggling to develop a standalone commercial model for the develop-ment and distribution of Content such as research or indices.Capital clearly remains a strong competitive advantage
banks, though we see risks of over-competition pressuring margins as banks crowd into areas like repo and prime, as well as cyclical risks. Adoption of alternative sources of capital such as debt funds and peer-to-peer networks is also growing.

We estimate new “Active Solutions” for wholesale banking cli-ents could unlock $15-20 billion in future growth potential. But this will be fought over by tech firms, banks, funds and market infra-structure players. Active Solutions address unmet client needs, com-bining Connectivity, Content and Capital through the integration of previously separate activities, underpinned by analytics. Such offer-ings are geared to avoiding the commoditization of individual activi-ties and enhancing client retention. Active Solutions currently drive <15% of revenues, but significant new revenue opportunities can be unlocked as wholesale banking learns from Big Tech and expands offerings to meet client needs previously not typically addressed by banks (see Lessons from Big Tech). Near-term examples of Active Solutions include:
Helping institutional clients meet regulatory obligations and reduce their operating expenses with new services and broader insourcing propositions; and Helping corporate clients deliver more efficient, trans-parent and integrated management of treasury operations, linking working capital management with other core activi-ties such as procurement, invoicing and supply chain man-agement.
Many Active Solutions will need to bridge organizational divides: across securities services and markets, or across transaction banking and the rest of the corporate franchise.

Lessons from Big Tech – broadening of the sell-side approach to client needs
Banks’ success in using technology to win new business has been mixed. Electronic execution and single-dealer platforms have fundamentally reshaped the industry, but other initiatives have been less successful. For example, custodians have to date struggled to get commercial traction with products based on analysis of static custody data. Efforts by exchanges and trading venues to sell data have also seen limited success, with most value being captured by the distributors who own the standardization and enrichment processes, and real-time distribution networks.
Looking to Big Tech, the process to win new business starts with a customer’s problem and seeks to use data and technology to meet these needs. It binds function (“this is useful”) with user experience (“this is satisfying to use”). Big Tech actively seeks to link its products into a range of data sources and other providers. Propositions get built over time with a “flywheel” effect: initial client participation drives improvements, which drives more insightful data, which drives better improvements and so on. Solutions are “active” in the sense that users provide data while using the product, which is then used to improve the proposition for all users. This increases both the stickiness of the relationship and value generation for the provider.
Underpinning this is a broad view of customers and the problems a provider can solve. In the 'Financial Needs Hexagon for Wholesale Banking' ( Exhibit ), we identify six distinct areas in which clients could expect to be served. Wholesale banks have traditionally focused on a subset of their clients’ needs: “Borrow,” “Transfer”, “Safeguard” and “Grow.” Competition for incumbents is growing, particularly in "Transfer", where a range of alternative providers is pushing down margins (e.g. payments, trading venues), and in “Borrow”, where disruptive models of raising capital may emerge (e.g. peer-to-peer financing). The scope of wholesale offerings can also be broadened into two other categories of client needs: “Earn”, optimizing revenue streams from core business activities (e.g. through research or analytics), and “Spend”, delivering a product or service via outsourcing or enabling optimization of spend (e.g. through fund services or procurement solutions). Active Solutions in development now address some of these “Earn” and “Spend” categories, while also integrating previously separate activities across the hexagon. Some banks and third-party providers are even beginning to expand solutions to incorporate service elements from well outside of financial services.
Exhibit
We see six core financial needs for CIB clients. Share of CIB revenues, 2017
Note: Includes Wholesale, Wholesale Transaction banking and Securities services revenues
Source: Oliver Wyman analysis

2. Institutional clients: structural pressure
Pressure on institutional clients is challenging traditional value drivers for Wholesale Banks, but also opening up new growth potential. By 2020 we expect the balance of the wholesale wallet to shift away from institutions (from ~57% to ~55% of wallet) to cor-porates. This will be driven by the continued shift to passive trading, consolidation for mid-size Asset Managers and banks, and increased transparency across asset classes. Firms are responding to these challenges as well as the propositions being offered by new entrants and FinTechs by coalescing around four archetypal business models. Each plays to different traditional advantages and has a distinct growth outlook.
Own the liquidity graph. The most attractive economics in market making are possible where a bank is able to establish a dominant posi-tion at the centre of price formation in a market, rather than simply connecting a client to a venue. The source of competitive advantage is essentially information that can form the basis of a proprietary data set – the best view of market liquidity at any given point in time. We estimate banks today generate $40-45 billion of revenues in this way, primarily in flow OTC fixed income and equity derivative trading.
Banks are investing in tools to better codify, analyze and use data cap-tured through both “voice” and electronic channels, and maximize the value of their own client network. But this is a scale game, and there are strong network effects. Larger client networks drive richer datasets on demand, enabling better pricing and liquidity, and in turn attract more clients.
Regulatory obligations to publish pre- and post-trade prices are chal-lenging this model, as data advantages are eroded. These effects have largely played out in the US, but are likely to accelerate in Europe with the introduction of MiFID II in January this year. This is likely to accentuate scale effects, as smaller players find it harder to manage and warehouse risk.
At the same time, FinTech players, exchanges and other third parties will look to challenge the bank’s central role in price formation by connecting disparate buyers and sellers, for example with new elec-tronic trading venues. We see revenues associated with this business model declining, with returns highly skewed towards the largest players in any given market.

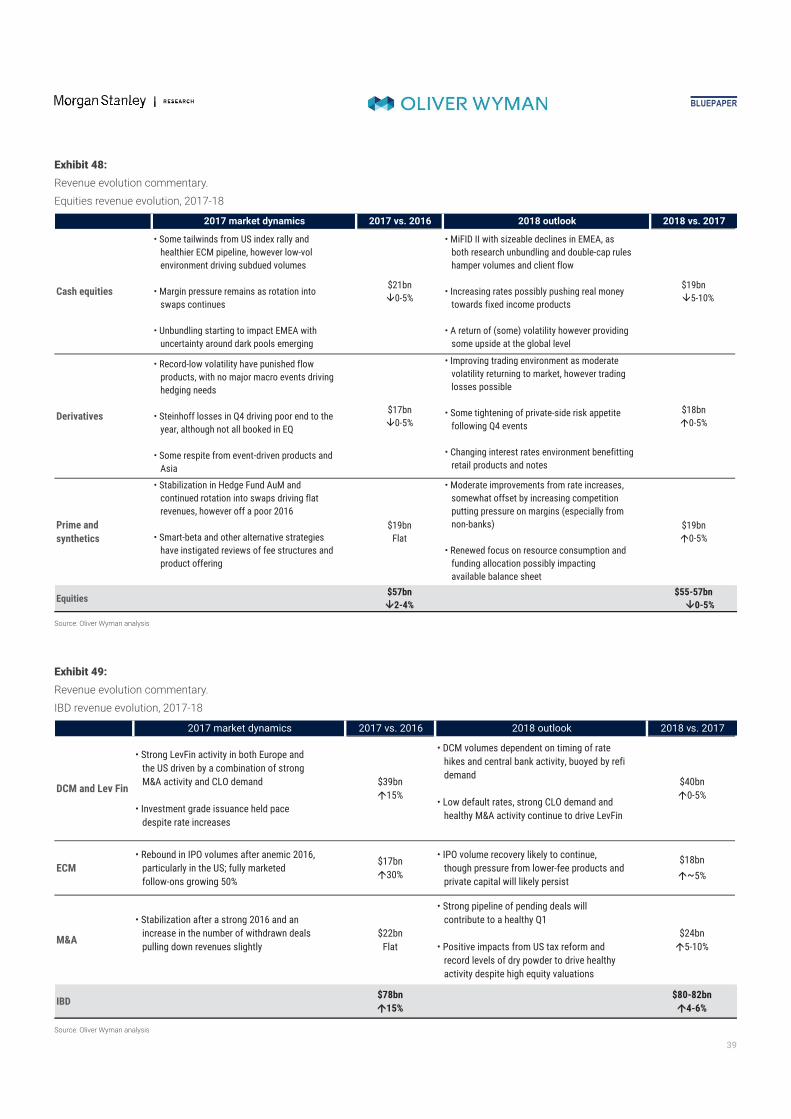
Lead with content and analytics. Competitive advantage in this model is driven not by owning proprietary data and client networks, but rather by the insightful analysis of primarily public data sources. As an ideas business, talent is the key. We expect content to remain an important potential source of value, but expect to see a shift away from traditional content and towards data-driven analytics, and for banks to face heightened competition from boutiques and special-ists. Regulation can accelerate this shift – we estimate MiFID II research unbundling will knock around $2 billion off cash equities revenue pools (10% off global cash equity pool of ~$20 billion), as the commissions paid for research through “high touch” pools are compressed.
More fundamentally, the continued growth of passive investing, and the broadening adoption of advanced analytics to inform investing strategies on the buy-side, are likely to further depress demand for traditional research and some aspects of high touch sales activity across asset classes. These changes are likely to favour the largest players who can offer “all you can eat” contracts that provide wide coverage across sectors and regions, and the best boutiques who can offer independence and specialist expertise in a chosen area. Those in the middle will be squeezed further.
At the same time, superior analysis of public data-sets is being used to find an edge in trading, especially market-making in liquid markets. Competitive advantage is based on talent: the best data scientists, programmers and technologists. Non-bank liquidity providers are finding success by offering a differentiated employee value proposi-tion. Their operating model is also in stark contrast to banks’. Fit-for-purpose technology and use of algorithmic trading allow trading volumes that are comparable to banks’, but at a significantly higher productivity per head. The cost structure is also notably different, with “front office” costs skewed towards technologists and quants rather than sales and traders, and with far lighter operations and finance costs. This throws down the gauntlet to banks to change from within to compete on these terms or to seek partnership or greenfield build options.

Provide financing and risk warehousing. This has been and con-tinues to be an important source of growth for Wholesale Banks. Intrinsic capital and funding advantages, coupled with risk manage-ment and structuring capabilities, remain core advantages for Wholesale Banks. The improving economic environment and rising rates of our base case should provide further opportunities for banks to provide financing and structuring solutions to institutional clients.
The danger is that as other sources of value come under pressure, banks swarm around the same opportunities in more capital inten-sive areas. We already see signs of margin pressure in some areas such as prime brokerage, as banks look to deploy marginal capital and balance sheet in the hunt for growth. At the same time there are growing concerns around the risk of a turn in the credit cycle, which could catch out risk warehousing activities in businesses such as EM and credit.
Build Active Solutions for clients. This means finding new cus-tomer problems and developing products and services to meet their needs. Institutional clients have pressing strategic needs in the ‘Spend’ category: reducing operational costs, meeting regulatory obligations and improving their own workflow. Where prior business models have tended towards process insourcing, with relatively poor economics as a result, the next generation is aiming to build more scalable technology-driven propositions. Emerging offerings include:
best execution agency trading models that allow the com-plete insourcing of buy-side desks for FX and Fixed Income;offering proprietary tools such as risk analytics engines; andbuilding broader operational insourcing platforms for the buy-side.
Asset Managers today have a total cost base of ~$210 billion, of which 20-25% is currently outsourced, and a further 15-25% could potentially be moved to that model. Many banks are already active in this market through their fund services activities, currently worth ~$10 billion. A range of exchanges, technology firms, trust banks, fund managers, hedge funds and broker-dealers are building proposi-tions here – the race is on to own the critical parts of this ecosystem and to position themselves as platform providers.

3. Corporate clients: tailwinds, despitesome longer term challenges
Cyclical tailwinds are set to drive revenue growth in the corpo-rate segment, but with very different dynamics between “CFO-down” and “CFO-up” relationships. We expect revenues to grow 4% annually through 2020 across the corporate segment. The CFO-down set of activities, encompassing products and services delivered mainly to CFO and Treasury functions, are more stable in nature but look set to benefit from rising interest rates. The risks to this business are more long term in nature, and would be driven by technology dis-ruption. The CFO-up set of activities, those encompassing advice and products delivered directly to the C-suite by high touch coverage, are highly cyclically geared and look set to continue to grow strongly in our base case. Risks to the business come from the rise of boutiques, and a potential tail-off in leveraged finance activity as rates rise, although not from technology disruption. Most major Wholesale Banks operate a blend of CFO-up and CFO-down business models.
In our view, growth through 2020 will be driven by:
Rate rises feeding buoyant net interest income (NII) growth in the deposit-taking activities of wholesale transaction banking and higher NII on lending activities;Some offset from fee compression that continues apace across payments, cash management and trade finance;Robust corporate activity will benefit M&A and ECM (+7% CAGR);DCM and leveraged finance revenues roughly flat as financing costs are set to rise; Corporate FX will increase with volatility in 2018, and other markets activity will correlate to issuance and acqui-sitions; and Lower taxes can reinforce economic growth with accompa-nying higher loan growth, supported by lower loan losses as corporate cash flows improve.
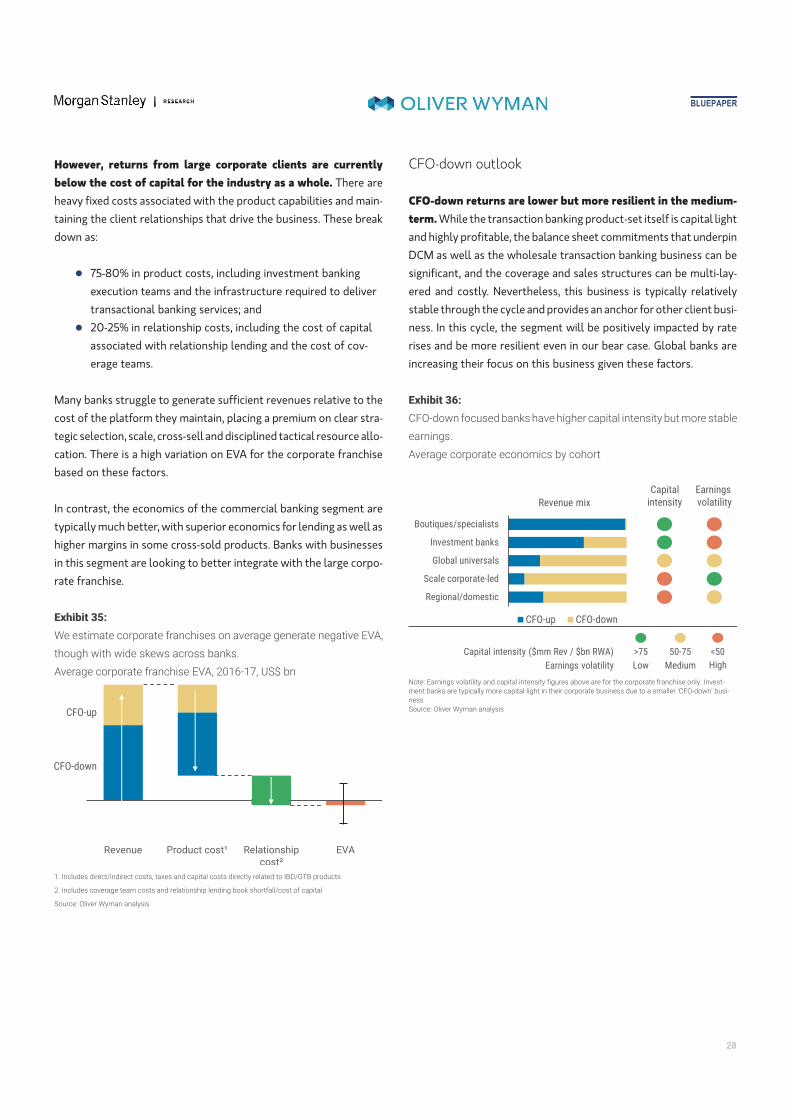
However, returns from large corporate clients are currently below the cost of capital for the industry as a whole. There are heavy fixed costs associated with the product capabilities and main-taining the client relationships that drive the business. These break down as:
75-80% in product costs, including investment banking execution teams and the infrastructure required to deliver transactional banking services; and20-25% in relationship costs, including the cost of capital associated with relationship lending and the cost of cov-erage teams.
Many banks struggle to generate sufficient revenues relative to the cost of the platform they maintain, placing a premium on clear stra-tegic selection, scale, cross-sell and disciplined tactical resource allo-cation. There is a high variation on EVA for the corporate franchise based on these factors.
In contrast, the economics of the commercial banking segment are typically much better, with superior economics for lending as well as higher margins in some cross-sold products. Banks with businesses in this segment are looking to better integrate with the large corpo-rate franchise.
CFO-down outlook
CFO-down returns are lower but more resilient in the medium-term. While the transaction banking product-set itself is capital light and highly profitable, the balance sheet commitments that underpin DCM as well as the wholesale transaction banking business can be significant, and the coverage and sales structures can be multi-lay-ered and costly. Nevertheless, this business is typically relatively stable through the cycle and provides an anchor for other client busi-ness. In this cycle, the segment will be positively impacted by rate rises and be more resilient even in our bear case. Global banks are increasing their focus on this business given these factors.

CFO-down models facing longer term disruption, an opportunity for leaders. Up to a third of CFO-down revenues could be challenged by market structure and buying behaviour changes over the next decade. We see pressure but also opportunities in five areas:
Fee compression in payments as alternative providers pro-liferate and transparency increases. This is happening now in the SME segment but over time can encroach on the large corporate segment as well. In FX trading, volumes more than quadrupled after the emergence of electronic platforms, with margins ticking down 10% CAGR in the ensuing decade;Bank net interest income associated with deposit-taking activities becoming vulnerable as corporate cash-flow man-agement becomes more efficient and fewer excess deposits are held with banks. Down the line, there is also the potential for traditional lending to be disrupted by working capital solutions provided by new firms within supply chainsOpen banking (e.g. PSD2 in Europe) enabling multi-bank account overviews, third party client interfaces and tools is unlikely to threaten large corporate space, largely a func-tion of product sophistication/complexity and geographical reach. Although we will be watching commercial banking disruption for signs of emergence of credible competition.Elements of the investment grade issuance process being automated, as well as potential peer-to-peer offerings that enable direct corporate to investor distribution, although now confined to smaller issues, and The transformation of core market infrastructure, with the need to incorporate real-time payments in dozens of geo-graphies, and potentially disruptive new platforms. This is a longer term threat, as for now, the lack of national har-monization has erected barriers to entry still in favor of existing, global platforms.
In response, leading CFO-down firms are investing heavily for the future. Most firms are already increasing automation and pre-paring for a lower fee environment. Payments hubs, either in the form of orchestration layers or full re-platforming, are being rolled out by many global banks. And initiatives including market-specific connec-tivity, consortium participation, and internal distributed ledger tech-nology solutions are emerging to build connectivity into new payments systems worldwide. Cost take-out opportunities from these activities could have a significant impact on CFO-down returns – and provide opportunities to pass lower fees on to clients.
CFO-up outlook
Returns for CFO-up focused players will be higher but more vola-tile. Pure CFO-up models, as adopted by specialist advisory bou-tiques, are very capital light but carry a higher cost structure, driven by more expensive specialist staff. Returns are high but volatile – both across firms and through the cycle. Investment banking and uni-versal banking models tend to drive higher returns on average, but with wider dispersion particularly for more CFO-up focused invest-ment banks. Low returning players tend to carry the costs of a broad franchise without sufficient penetration and market share to deliver attractive economics.
Boutiques are likely to take further share from the major Whole-sale Banks, with second order impacts on the franchise. Within M&A top tier investment banks have consolidated share, gaining 5-6ppt of market share globally since the crisis. At the same time advisory-focused boutiques have gained 7ppt of share, partly bene-fiting from shifts in industry volumes and deal sizes. Boutiques may be challenged in a bear scenario, but in our base case we expect three factors to support further growth in share:
Autonomy: clients are attracted by their clear statement of independence and confidentiality.Talent migration: strong growth tends to support migra-tion of talent into boutiques, and we continue to see that playing out today. Research unbundling: some banks are paring back their equity research propositions as a response to reduced sec-ondary market commissions, eroding one of their competi-tive assets.
More corporates are now seeking one-off support from boutiques, with revenues from M&A mandates won by advisors with no corpo-rate deal history over a prior five year period up ~40% since 2014 to 45% of M&A revenues. When an investment bank loses all or part of an M&A mandate to a boutique, it can be harder to win attractive roles in the financing and derivatives aspects of a deal, pushing them into a “product provider” role in competition with a wider range of CFO-down-focused financing banks.
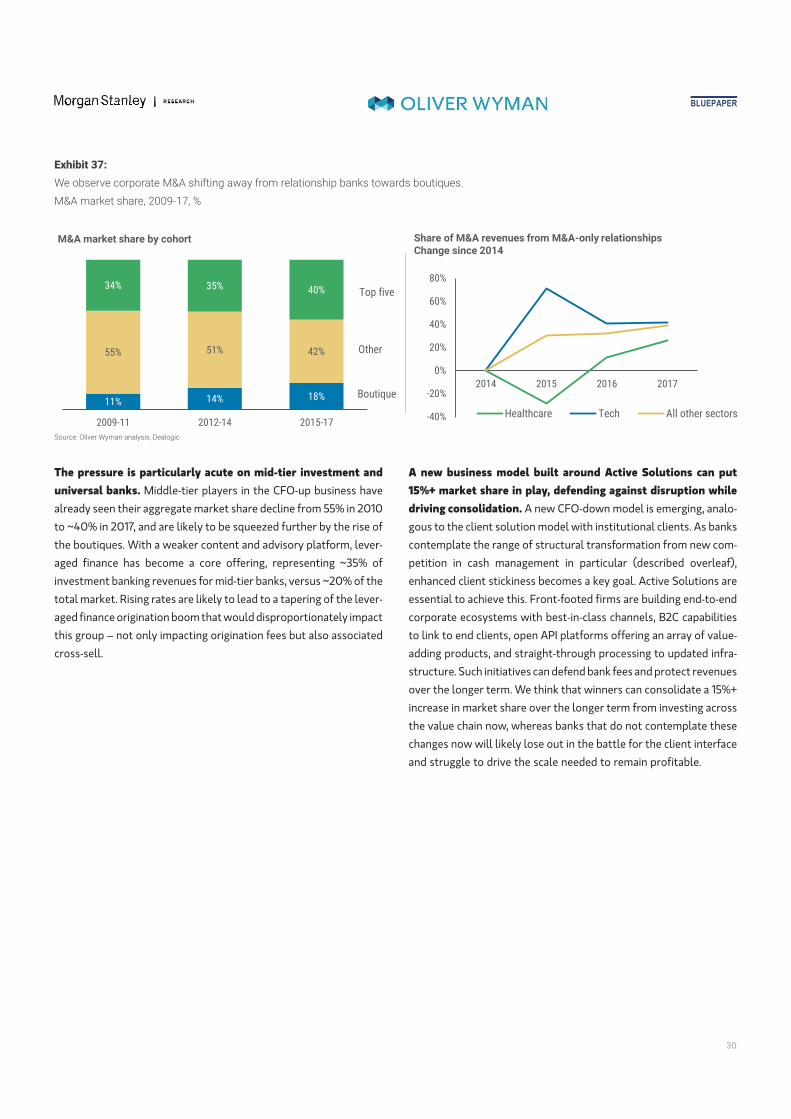
The pressure is particularly acute on mid-tier investment and universal banks. Middle-tier players in the CFO-up business have already seen their aggregate market share decline from 55% in 2010 to ~40% in 2017, and are likely to be squeezed further by the rise of the boutiques. With a weaker content and advisory platform, lever-aged finance has become a core offering, representing ~35% of investment banking revenues for mid-tier banks, versus ~20% of the total market. Rising rates are likely to lead to a tapering of the lever-aged finance origination boom that would disproportionately impact this group – not only impacting origination fees but also associated cross-sell.
A new business model built around Active Solutions can put 15%+ market share in play, defending against disruption while driving consolidation. A new CFO-down model is emerging, analo-gous to the client solution model with institutional clients. As banks contemplate the range of structural transformation from new com-petition in cash management in particular (described overleaf), enhanced client stickiness becomes a key goal. Active Solutions are essential to achieve this. Front-footed firms are building end-to-end corporate ecosystems with best-in-class channels, B2C capabilities to link to end clients, open API platforms offering an array of value-adding products, and straight-through processing to updated infra-structure. Such initiatives can defend bank fees and protect revenues over the longer term. We think that winners can consolidate a 15%+ increase in market share over the longer term from investing across the value chain now, whereas banks that do not contemplate these changes now will likely lose out in the battle for the client interface and struggle to drive the scale needed to remain profitable.

New Battlegrounds in Cash Management
Disruption from multiple quarters demands a long view. Wholesale cash management includes payments, liquidity management and corporate cards, with revenues from transaction fees as well as net interest income associated with client balances. A transformation is at play driven by changes in local and regional regulations, technology and client expectations, and new entrants. These forces will play out over the longer term but with potentially seismic impacts. Banks must have a game plan across all of these forces to chart a course forward. Those who take a long-term view on market structure change now are investing to create the building blocks of future winning models.
Spread of national and regulator action is wide. In some markets, governments are driving the innovation agenda. Real time payments are now live or planned in dozens of countries; early adopters (such as Mexico and the UK) have seen volume rapidly increase whereas others (like the US) are now following suit, introducing the first upgrades to payments infrastructure in decades. Some (e.g. Hong Kong) are also experimenting with central bank digital currencies to further streamline payments. And the Payments Systems Directive 2 (PSD2) in the Eurozone mandates that banks allow third-party providers to have access to payments data, opening the door for new aggregators of client flow. While this initially impacts the SME segment primarily, the introduction of new entrants at the client interface can lead to disruption and opportunity in the large corporate segment too. A lack of national harmonization presents challenges, as well as opportunities for banks to address client cost and service issues.
New technologies transform the potential. On the front end, the digitalization of retail payments with alternative networks (like Alipay and Venmo) and mobile wallets is beginning to inform corporate user expectations for digitalized channels. APIs enable open platforms that integrate external data and analytics and value-added services. On the back end, streamlining through re-platforming or middleware layers can bring efficiency to what can be hundreds of distinct payments rails inside global banks. Further out, distributed ledger technology has the potential to transform market structure in cross-border payments, providing transparency, security and instantaneous settlement, and disrupting the incumbent correspondent banking network
Clients expect lower costs and more and better services. User experience, real time visualization and security concerns are key for corporate clients. Increasingly, treasurers also expect integrated workflow management solutions that link payments to accounting, procurement, liquidity management and other activities. Lower costs are essential as some markets mandate greater transparency.
The competitive field is fragmenting. Banks must increasingly compete not only against each other, but also against new entrants and technology players who potentially offer better client interface, aggregation of bank services, peer-to-peer solutions and analytics. National payments initiatives, and domestic and global consortia can be co-opted or potentially disruptive to the banks' role in ‘plumbing’. And other financial services providers (like Cards) and Big Tech with established merchant networks and the wherewithal to drive a revolution in infrastructure are also on the radar as potential future threats.

4. Winning in the new world
Structural advantages remain entrenched – with universals best positioned for growth. The largest universals, already among the most profitable, are likely to see returns improve as they benefit from cyclical factors in securities services and wholesale transaction banking with these deposit-taking activities making up to 20% of their revenues. Some consolidation of share for the largest banks is also possible in these adjacent areas as they pick up share from mid-tier players who lack resources to fund infrastructure streamlining and innovation in these businesses. In our base case, the largest uni-versals pick up an additional $2.5 billion in revenue in 2020. Invest-ment banks will be more challenged as a group given exposure to the institutional fee pool and boutiques and specialists continuing to pick up share. Regionals will benefit from increased rates and have the potential to outperform, but still see a relatively low RoE overall, reflecting a heavier skew to capital intensive, lower volatility CFO-down business.
Broader franchises are also more resilient in a bear scenario. There are downside risks to the sector from lower GDP growth, and global non-financial corporate debt growing 15ppt in the past 6 years accentuates the default risk in any significant downturn. Losses asso-ciated with relationship lending in a down market can flow through to the bottom line. Yet even in our bear case we anticipate that rate increases will drive net interest income sufficiently to offset some of these pressures. Investment banking and corporate markets activi-ties contract 7% in our bear case whereas the full corporate perim-eter including wholesale transaction banking contracts only 5%. A bull scenario would favour investment banks and universal banks.
Yet returns skews within models are likely to remain high. Despite entrenched advantages for some models, firms within each model can still deliver good returns. Wide skews remain among the investment banks and global universals, and under-performers in these segments face a steep hill to climb given significantly lower returns in recent years, with challenges particularly keen for Euro-pean banks. Revenue growth is likely to be insufficient to plug the gap in the base case and many will struggle to get returns above 10%. Without large-scale M&A we see limited catalysts pressuring these firms and low likelihood of a big competitive shakeout. Regional banks have the largest returns skew. The top performers here deliv-ered the highest RoE among the peer set in 2017, driven by niche offerings by some standout regional banks that are becoming more highly competed by both global banks and new entrants. But firms at the lower end are well below hurdle rates, and with fewer resources to deploy for reinvestment and innovation, they may struggle to remain competitive.

The future competitive structure in Europe is a key strategic question mark. US banks in Europe have gained 8ppt in share over 2012-17, picking up share across the board, but particularly in invest-ment banking and in fixed income as EU players have restructured. Conversely, European banks in the US have faced tough new regula-tions and struggled to crack the lucrative domestic market, losing 7ppt of market share over the same period. Europe faces the prospect of having no truly global wholesale banking players who can compete on an equal footing with the US banks.
Yet the prospects for the European economy are improving, and Brexit could provide an opportunity for EU policymakers to redress the balance vs the US banks. For now, Brexit is pushing banks to put a relatively small share of their activity into EU locations. Over time that is likely to ramp up, as regulators may demand more onshore presence. Depending on the exact nature of the regulatory regime, this could introduce capital and funding inefficiencies for interna-tional banks, making the economics of serving some EU clients more expensive. This could benefit the local EU players, especially regional and corporate-focused banks.
There is also growing debate about the prospects for inorganic con-solidation in EMEA. In our view, while there is a strategic logic, at present the conditions are not in place to support major cross-border M&A. However, this could change over the medium term, should poli-cymakers put in place closer regulatory alignment. The thorniest issues are consumer protection, such as deposit insurance, and finan-cial resource requirements, such as the calculation of G-SIB buffers. These present a material legislative task.


Asia is growing rapidly but locals are dominating – their next horizon will be international markets. Local Asian banks have picked up the vast majority of recent market growth and are consoli-dating share while foreign banks have seen a decline of 17% since 2010. Lower RoEs due to competition, FDI loss and lower NII are dis-couraging global firms from expanding. The market remains corpo-rate driven, and exposed to a high degree of innovation and disruption as payment systems and supply chains are digitalized. Lib-eralization of local markets, coupled with rapid growth and financial deepening, is creating significant revenue opportunities. Local banks are investing heavily and could gain advantages through the better use of data, the emergence of innovative open API platforms, and participation in trade and supply chain ecosystems. Chinese banks could look to make more aggressive moves into global markets. Large global banks committed to the region will need to sustain investment in their global platforms to succeed against this back-drop.
Funds available for innovation set to embed mid-term competi-tive advantages. Major differences have emerged in investment levels on change and innovation. We estimate Wholesale Banks are spending 6-12% of revenues, allocated from three sources: IT bud-gets (with around half channeled into “change the bank” initiatives), investment budgets within the business line and back office func-tions, and dedicated funding for innovation labs, units, and accelera-tors. Many banks are still playing catch-up, dedicating much of their investment budget on regulatory response, remediation and sys-tems rationalization. Group budgets have also typically prioritized spend on retail. Leaders are focused now on improving digital inter-faces, value-adding tools for clients, data analytics, process digitaliza-tion, and investment in frontier technologies. As a result the change spend allocated to real innovation varies even more widely. The larger and more profitable banks will inevitably have deeper pockets to fund innovation and US banks likely have more room given the benefit from lower taxes. We estimate mid-tier institutions are potentially being outspent ~3 to 1 by the largest players, while still competing across a similar waterfront of businesses.

Spend will not solely determine the winners. Even with much smaller overall budgets, banks can make big, bold plays in specific areas if these are well targeted and there is a good discipline around spend. Most banks have a proliferation of initiatives across various hubs, innovation centers, FinTech partnerships as well as within the business lines and functions. Yet the return on this investment to date is unclear. The banks that will succeed will encourage a culture of innovation, but also adopt a disciplined approach to manage the portfolio of initiatives, applying a test-and-learn mindset to direct spend towards the most impactful areas.
The most successful will focus spend and effort on scaling potentially transformative initiatives. Looking across our four “zones” of innovation, we observe some common challenges in effec-tively prioritizing and managing the portfolio of initiatives:
Incubation – most banks have considerable spend and time allocated to frontier initiatives in the “incubation” zone, for instance experimentation with blockchain, or various Fin-Tech partnerships. But this is often too disparate with
many initiatives that consume management bandwidth and investment dollars. More aggressive pruning is required to focus on the big initiatives that can move the dial. Performance – a natural focus area for management teams to make incremental improvements (e.g. upgrading trading systems and client portals) – much of it vital, but can lead to “me too” activity with limited benefits for competitive outperformance.Productivity – huge potential for cost release and effi-ciency across front, middle and back office, but requires a genuinely cross-functional approach to unlock the biggest prizes with executive sponsorship and collegiate working across the bank.Transformation – not enough ideas are scaling up to be truly transformative for Wholesale Banks today; we see leaders taking a top-down portfolio view, picking areas of high strategic importance and applying a test and learn mentality to filter down and funnel effort and investment into the most promising areas.

Getting more from the $30 billion banks spend on technology will be key. Technology has grown to become 15-20% of the whole-sale banking cost base. While technology supports all core business functions and support areas, most banks have limited flexibility working across fragmented legacy infrastructure and governed by rigid project management. To rapidly meet client needs with new products, tools and services, two major transitions are needed:
a shift to modular platform architecture, using APIs, cloud based data, ability to easily integrate third-party tech-nology; and a shift to agile delivery models, using smaller multidisci-plinary teams with closer integration with functional, busi-ness and client users, with a mandate to challenge and work across organizational boundaries.
The wholesale banking workforce of the future will look very different. As banks adopt new technologies and build new busi-nesses, the talent model will need to shift profoundly. In the front office, demand for quants will increase significantly, while tech-nology experts such as user experience (UX) specialists will need to be aligned with business teams to enable agile proposition develop-ment. We estimate these two roles will grow to represent 25% of compensation from <5% today. In the back office, IT will make up ~60% of future compensation, driven by higher salaries for more specialized, in-demand technology skill-sets such as user interface (UI) developers.
Winners will step up their fight for talent. Employee value propo-sitions offered by non-banks are compelling, either around compen-sation or working style. Wholesale banks will need to evolve their talent models to compete, with culture the most important dimen-sion. For banks with low returns, compensation will remain a difficult battleground. It will be hard to both invest in the talent required to drive near-term market share capture and earnings growth, while also investing to build the capabilities needed to win in the future. The battle for talent will be as important as the battle for clients in determining the winners.

Product-level market outlooks


Other Important Disclosures from Oliver WymanCopyright © 2018 Oliver Wyman. All rights reserved. This report may not be reproduced or redistributed, in whole or in part, without the written permission of Oliver Wyman and Oliver Wyman accepts no liability whatsoever for the actions of third parties in this respect.
This report is not a substitute for tailored professional advice on how a specific financial institution should execute its strategy. This report is not investment advice and should not be relied on for such advice or as a substitute for consultation with professional accountants, tax, legal or financial advisers. Oliver Wyman has made every effort to use reliable, up-to-date and comprehensive information and analysis, but all information is provided without warranty of any kind, express or implied. Oliver Wyman disclaims any responsibility to update the information or conclusions in this report.
Oliver Wyman accepts no liability for any loss arising from any action taken or refrained from as a result of information contained in this report or any reports or sources of information referred to herein, or for any consequential, special or similar damages even if advised of the possibility of such damages.
This report may not be sold without the written consent of Oliver Wyman.
The Oliver Wyman employees that contributed to this report are neither FCA nor FINRA registered.
Oliver Wyman is not authorised or regulated by the Financial Conduct Authority or the Prudential Regulatory Authority. As a consultancy firm it may have business relationships with companies mentioned in this report and as such may receive fees for executing this business.
Please refer to www.oliverwyman.com for further details.

Disclosure SectionThe information and opinions in Morgan Stanley Research were prepared or are disseminated by Morgan Stanley & Co. LLC and/or Morgan Stanley C.T.V.M. S.A. and/or Morgan Stanley México, Casa de Bolsa, S.A. de C.V. and/or Morgan Stanley Canada Limited and/or Morgan Stanley & Co. International plc and/or RMB Morgan Stanley Proprietary Limited and/or Morgan Stanley MUFG Securities Co., Ltd. and/or Morgan Stanley Capital Group Japan Co., Ltd. and/or Morgan Stanley Asia Limited and/or Morgan Stanley Asia (Singapore) Pte. (Registration number 199206298Z) and/or Morgan Stanley Asia (Singapore) Securities Pte Ltd (Registration number 200008434H), regulated by the Monetary Authority of Singapore (which accepts legal responsibility for its contents and should be contacted with respect to any matters arising from, or in connection with, Morgan Stanley Research) and/or Morgan Stanley Taiwan Limited and/or Morgan Stanley & Co International plc, Seoul Branch, and/or Morgan Stanley Australia Limited (A.B.N. 67 003 734 576, holder of Australian financial services license No. 233742, which accepts responsibility for its contents), and/or Morgan Stanley Wealth Management Australia Pty Ltd (A.B.N. 19 009 145 555, holder of Australian financial services license No. 240813, which accepts responsibility for its contents), and/or Morgan Stanley India Company Private Limited, regulated by the Securities and Exchange Board of India (“SEBI”) and holder of licenses as a Research Analyst (SEBI Registration No. INH000001105), Stock Broker (BSE Registration No. INB011054237 and NSE Registration No. INB/INF231054231), Merchant Banker (SEBI Registration No. INM000011203), and depository participant with National Securities Depository Limited (SEBI Registration No. IN-DP-NSDL-372-2014) which accepts the responsibility for its contents and should be contacted with respect to any matters arising from, or in connection with, Morgan Stanley Research, and/or PT. Morgan Stanley Sekuritas Indonesia and their affiliates (collectively, "Morgan Stanley").
For important disclosures, stock price charts and equity rating histories regarding companies that are the subject of this report, please see the Morgan Stanley Research Disclosure Website at www.morganstanley.com/researchdisclosures, or contact your investment representative or Morgan Stanley Research at 1585 Broadway, (Attention: Research Management), New York, NY, 10036 USA.
For valuation methodology and risks associated with any recommendation, rating or price target referenced in this research report, please contact the Client Support Team as follows: US/Canada +1 800 303-2495; Hong Kong +852 2848-5999; Latin America +1 718 754-5444 (U.S.); London +44 (0)20-7425-8169; Singapore +65 6834-6860; Sydney +61 (0)2-9770-1505; Tokyo +81 (0)3-6836-9000. Alternatively you may contact your investment representative or Morgan Stanley Research at 1585 Broadway, (Attention: Research Management), New York, NY 10036 USA.
Analyst Certification
The following analysts hereby certify that their views about the companies and their securities discussed in this report are accurately expressed and that they have not received and will not receive direct or indirect compensation in exchange for expressing specific recommendations or views in this report: Anil Agarwal; Michael J. Cyprys, CFA, CPA; Manan Gosalia; Betsy L. Graseck, CFA; Bruce Hamilton; Toni Kaplan; Giulia Aurora Miotto, CFA; Adedapo O Oguntade, CFA; Alvaro Serrano; Anil Sharma, CFA; Andrei Stadnik, FIAA; Magdalena L Stoklosa, CFA; Alice Timperley, CFA.
Unless otherwise stated, the individuals listed on the cover page of this report are research analysts.
Global Research Conflict Management Policy
Morgan Stanley Research has been published in accordance with our conflict management policy, which is available at www.morganstanley.com/institutional/research/conflictpolicies.
Important US Regulatory Disclosures on Subject Companies
The following analyst or strategist (or a household member) owns securities (or related derivatives) in a company that he or she covers or recommends in Morgan Stanley Research: Michael J. Cyprys, CFA, CPA - Bank of America(common or preferred stock).
As of February 28, 2018, Morgan Stanley beneficially owned 1% or more of a class of common equity securities of the following companies covered in Morgan Stanley Research: BlackRock Inc., BNP Paribas, Citigroup Inc., Deutsche Bank, J.P.Morgan Chase & Co..
Within the last 12 months, Morgan Stanley managed or co-managed a public offering (or 144A offering) of securities of AMUNDI SA, BlackRock Inc., Citigroup Inc., Deutsche Bank, HSBC.
Within the last 12 months, Morgan Stanley has received compensation for investment banking services from AMUNDI SA, BlackRock Inc., BNP Paribas, Citigroup Inc., Deutsche Bank, Franklin Resources Inc., HSBC, J.P.Morgan Chase & Co..
In the next 3 months, Morgan Stanley expects to receive or intends to seek compensation for investment banking services from AMUNDI SA, Bank of America, BlackRock Inc., BNP Paribas, Citigroup Inc., Deutsche Bank, Franklin Resources Inc., HSBC, J.P.Morgan Chase & Co., Legg Mason Inc., Waddell & Reed Financial Inc.
Within the last 12 months, Morgan Stanley has received compensation for products and services other than investment banking services from AMUNDI SA, Bank of America, BlackRock Inc., BNP Paribas, Citigroup Inc., Deutsche Bank, Franklin Resources Inc., HSBC, J.P.Morgan Chase & Co., Legg Mason Inc., Waddell & Reed Financial Inc.
Within the last 12 months, Morgan Stanley has provided or is providing investment banking services to, or has an investment banking client relationship with, the following company: AMUNDI SA, Bank of America, BlackRock Inc., BNP Paribas, Citigroup Inc., Deutsche Bank, Franklin Resources Inc., HSBC, J.P.Morgan Chase & Co., Legg Mason Inc., Waddell & Reed Financial Inc.
Within the last 12 months, Morgan Stanley has either provided or is providing non-investment banking, securities-related services to and/or in the past has entered into an agreement to provide services or has a client relationship with the following company: AMUNDI SA, Bank of America, BlackRock Inc., BNP Paribas, Citigroup Inc., Deutsche Bank, Franklin Resources Inc., HSBC, J.P.Morgan Chase & Co., Legg Mason Inc., Waddell & Reed Financial Inc.
Morgan Stanley & Co. LLC makes a market in the securities of Bank of America, BlackRock Inc., Citigroup Inc., Deutsche Bank, Franklin Resources Inc., HSBC, J.P.Morgan Chase & Co., Legg Mason Inc., Waddell & Reed Financial Inc.
The equity research analysts or strategists principally responsible for the preparation of Morgan Stanley Research have received compensation based upon various factors, including quality of research, investor client feedback, stock picking, competitive factors, firm revenues and overall investment banking revenues. Equity Research analysts' or strategists' compensation is not linked to investment banking or capital markets transactions performed by Morgan Stanley or the profitability or revenues of particular trading desks.

Morgan Stanley and its affiliates do business that relates to companies/instruments covered in Morgan Stanley Research, including market making, providing liquidity, fund management, commercial banking, extension of credit, investment services and investment banking. Morgan Stanley sells to and buys from customers the securities/instruments of companies covered in Morgan Stanley Research on a principal basis. Morgan Stanley may have a position in the debt of the Company or instruments discussed in this report. Morgan Stanley trades or may trade as principal in the debt securities (or in related derivatives) that are the subject of the debt research report.
Certain disclosures listed above are also for compliance with applicable regulations in non-US jurisdictions.
STOCK RATINGS
Morgan Stanley uses a relative rating system using terms such as Overweight, Equal-weight, Not-Rated or Underweight (see definitions below). Morgan Stanley does not assign ratings of Buy, Hold or Sell to the stocks we cover. Overweight, Equal-weight, Not-Rated and Underweight are not the equivalent of buy, hold and sell. Investors should carefully read the definitions of all ratings used in Morgan Stanley Research. In addition, since Morgan Stanley Research contains more complete information concerning the analyst's views, investors should carefully read Morgan Stanley Research, in its entirety, and not infer the contents from the rating alone. In any case, ratings (or research) should not be used or relied upon as investment advice. An investor's decision to buy or sell a stock should depend on individual circumstances (such as the investor's existing holdings) and other considerations.
Global Stock Ratings Distribution
(as of February 28, 2018)
The Stock Ratings described below apply to Morgan Stanley's Fundamental Equity Research and do not apply to Debt Research produced by the Firm.
For disclosure purposes only (in accordance with NASD and NYSE requirements), we include the category headings of Buy, Hold, and Sell alongside our ratings of Overweight, Equal-weight, Not-Rated and Underweight. Morgan Stanley does not assign ratings of Buy, Hold or Sell to the stocks we cover. Overweight, Equal-weight, Not-Rated and Underweight are not the equivalent of buy, hold, and sell but represent recommended relative weightings (see definitions below). To satisfy regulatory requirements, we correspond Overweight, our most positive stock rating, with a buy recommendation; we correspond Equal-weight and Not-Rated to hold and Underweight to sell recommendations, respectively.
Data include common stock and ADRs currently assigned ratings. Investment Banking Clients are companies from whom Morgan Stanley received investment banking compensation in the last 12 months. Due to rounding off of decimals, the percentages provided in the "% of total" column may not add up to exactly 100 percent.
Analyst Stock Ratings
Overweight (O or Over) - The stock's total return is expected to exceed the total return of the relevant country MSCI Index or the average total return of the analyst's industry (or industry team's) coverage universe, on a risk-adjusted basis over the next 12-18 months.
Equal-weight (E or Equal) - The stock's total return is expected to be in line with the total return of the relevant country MSCI Index or the average total return of the analyst's industry (or industry team's) coverage universe, on a risk-adjusted basis over the next 12-18 months.
Not-Rated (NR) - Currently the analyst does not have adequate conviction about the stock's total return relative to the relevant country MSCI Index or the average total return of the analyst's industry (or industry team's) coverage universe, on a risk-adjusted basis, over the next 12-18 months.
Underweight (U or Under) - The stock's total return is expected to be below the total return of the relevant country MSCI Index or the average total return of the analyst's industry (or industry team's) coverage universe, on a risk-adjusted basis, over the next 12-18 months.
Unless otherwise specified, the time frame for price targets included in Morgan Stanley Research is 12 to 18 months.
Analyst Industry Views
Attractive (A): The analyst expects the performance of his or her industry coverage universe over the next 12-18 months to be attractive vs. the relevant broad market benchmark, as indicated below.
In-Line (I): The analyst expects the performance of his or her industry coverage universe over the next 12-18 months to be in line with the relevant broad market benchmark, as indicated below.
Cautious (C): The analyst views the performance of his or her industry coverage universe over the next 12-18 months with caution vs. the relevant broad market benchmark, as indicated below.
Benchmarks for each region are as follows: North America - S&P 500; Latin America - relevant MSCI country index or MSCI Latin America Index; Europe - MSCI Europe; Japan - TOPIX; Asia - relevant MSCI country index or MSCI sub-regional index or MSCI AC Asia Pacific ex Japan Index.

Important Disclosures for Morgan Stanley Smith Barney LLC Customers
Important disclosures regarding the relationship between the companies that are the subject of Morgan Stanley Research and Morgan Stanley Smith Barney LLC or Morgan Stanley or any of their affiliates, are available on the Morgan Stanley Wealth Management disclosure website at www.morganstanley.com/online/researchdisclosures. For Morgan Stanley specific disclosures, you may refer to www.morganstanley.com/researchdisclosures.
Each Morgan Stanley Equity Research report is reviewed and approved on behalf of Morgan Stanley Smith Barney LLC. This review and approval is conducted by the same person who reviews the Equity Research report on behalf of Morgan Stanley. This could create a conflict of interest.
Other Important Disclosures
Morgan Stanley & Co. International PLC and its affiliates have a significant financial interest in the debt securities of Bank of America, BlackRock Inc., BNP Paribas, Citigroup Inc., Deutsche Bank, Franklin Resources Inc., HSBC, J.P.Morgan Chase & Co., Legg Mason Inc..
As of March 14, 2018, BlackRock Inc. beneficially owned 5% or more of a class of common equity securities of Morgan Stanley.
Morgan Stanley Research policy is to update research reports as and when the Research Analyst and Research Management deem appropriate, based on developments with the issuer, the sector, or the market that may have a material impact on the research views or opinions stated therein. In addition, certain Research publications are intended to be updated on a regular periodic basis (weekly/monthly/quarterly/annual) and will ordinarily be updated with that frequency, unless the Research Analyst and Research Management determine that a different publication schedule is appropriate based on current conditions.
Morgan Stanley is not acting as a municipal advisor and the opinions or views contained herein are not intended to be, and do not constitute, advice within the meaning of Section 975 of the Dodd-Frank Wall Street Reform and Consumer Protection Act.
Morgan Stanley produces an equity research product called a "Tactical Idea." Views contained in a "Tactical Idea" on a particular stock may be contrary to the recommendations or views expressed in research on the same stock. This may be the result of differing time horizons, methodologies, market events, or other factors. For all research available on a particular stock, please contact your sales representative or go to Matrix at http://www.morganstanley.com/matrix.
Morgan Stanley Research is provided to our clients through our proprietary research portal on Matrix and also distributed electronically by Morgan Stanley to clients. Certain, but not all, Morgan Stanley Research products are also made available to clients through third-party vendors or redistributed to clients through alternate electronic means as a convenience. For access to all available Morgan Stanley Research, please contact your sales representative or go to Matrix at http://www.morganstanley.com/matrix.
Any access and/or use of Morgan Stanley Research is subject to Morgan Stanley's Terms of Use (http://www.morganstanley.com/terms.html). By accessing and/or using Morgan Stanley Research, you are indicating that you have read and agree to be bound by our Terms of Use (http://www.morganstanley.com/terms.html). In addition you consent to Morgan Stanley processing your personal data and using cookies in accordance with our Privacy Policy and our Global Cookies Policy (http://www.morganstanley.com/privacy_pledge.html), including for the purposes of setting your preferences and to collect readership data so that we can deliver better and more personalized service and products to you. To find out more information about how Morgan Stanley processes personal data, how we use cookies and how to reject cookies see our Privacy Policy and our Global Cookies Policy (http://www.morganstanley.com/privacy_pledge.html).
If you do not agree to our Terms of Use and/or if you do not wish to provide your consent to Morgan Stanley processing your personal data or using cookies please do not access our research.
Morgan Stanley Research does not provide individually tailored investment advice. Morgan Stanley Research has been prepared without regard to the circumstances and objectives of those who receive it. Morgan Stanley recommends that investors independently evaluate particular investments and strategies, and encourages investors to seek the advice of a financial adviser. The appropriateness of an investment or strategy will depend on an investor's circumstances and objectives. The securities, instruments, or strategies discussed in Morgan Stanley Research may not be suitable for all investors, and certain investors may not be eligible to purchase or participate in some or all of them. Morgan Stanley Research is not an offer to buy or sell or the solicitation of an offer to buy or sell any security/instrument or to participate in any particular trading strategy. The value of and income from your investments may vary because of changes in interest rates, foreign exchange rates, default rates, prepayment rates, securities/instruments prices, market indexes, operational or financial conditions of companies or other factors. There may be time limitations on the exercise of options or other rights in securities/instruments transactions. Past performance is not necessarily a guide to future performance. Estimates of future performance are based on assumptions that may not be realized. If provided, and unless otherwise stated, the closing price on the cover page is that of the primary exchange for the subject company's securities/instruments.
The fixed income research analysts, strategists or economists principally responsible for the preparation of Morgan Stanley Research have received compensation based upon various factors, including quality, accuracy and value of research, firm profitability or revenues (which include fixed income trading and capital markets profitability or revenues), client feedback and competitive factors. Fixed Income Research analysts', strategists' or economists' compensation is not linked to investment banking or capital markets transactions performed by Morgan Stanley or the profitability or revenues of particular trading desks.
The "Important US Regulatory Disclosures on Subject Companies" section in Morgan Stanley Research lists all companies mentioned where Morgan Stanley owns 1% or more of a class of common equity securities of the companies. For all other companies mentioned in Morgan Stanley Research, Morgan Stanley may have an investment of less than 1% in securities/instruments or derivatives of securities/instruments of companies and may trade them in ways different from those discussed in Morgan Stanley Research. Employees of Morgan Stanley not involved in the preparation of Morgan Stanley Research may have investments in securities/instruments or derivatives of securities/instruments of companies mentioned and may trade them in ways different from those discussed in Morgan Stanley Research. Derivatives may be issued by Morgan Stanley or associated persons.
With the exception of information regarding Morgan Stanley, Morgan Stanley Research is based on public information. Morgan Stanley makes every effort to use reliable, comprehensive information, but we make no representation that it is accurate or complete. We have no obligation to tell you when opinions or information in Morgan Stanley Research change apart from when we intend to discontinue equity research coverage of a subject company. Facts and views presented in Morgan Stanley Research have not been reviewed by, and may not reflect information known to, professionals in other Morgan Stanley business areas, including investment banking personnel.

Morgan Stanley Research personnel may participate in company events such as site visits and are generally prohibited from accepting payment by the company of associated expenses unless pre-approved by authorized members of Research management.
Morgan Stanley may make investment decisions that are inconsistent with the recommendations or views in this report.
To our readers based in Taiwan or trading in Taiwan securities/instruments: Information on securities/instruments that trade in Taiwan is distributed by Morgan Stanley Taiwan Limited ("MSTL"). Such information is for your reference only. The reader should independently evaluate the investment risks and is solely responsible for their investment decisions. Morgan Stanley Research may not be distributed to the public media or quoted or used by the public media without the express written consent of Morgan Stanley. Any non-customer reader within the scope of Article 7-1 of the Taiwan Stock Exchange Recommendation Regulations accessing and/or receiving Morgan Stanley Research is not permitted to provide Morgan Stanley Research to any third party (including but not limited to related parties, affiliated companies and any other third parties) or engage in any activities regarding Morgan Stanley Research which may create or give the appearance of creating a conflict of interest. Information on securities/instruments that do not trade in Taiwan is for informational purposes only and is not to be construed as a recommendation or a solicitation to trade in such securities/instruments. MSTL may not execute transactions for clients in these securities/instruments.
Certain information in Morgan Stanley Research was sourced by employees of the Shanghai Representative Office of Morgan Stanley Asia Limited for the use of Morgan Stanley Asia Limited.
Morgan Stanley is not incorporated under PRC law and the research in relation to this report is conducted outside the PRC. Morgan Stanley Research does not constitute an offer to sell or the solicitation of an offer to buy any securities in the PRC. PRC investors shall have the relevant qualifications to invest in such securities and shall be responsible for obtaining all relevant approvals, licenses, verifications and/or registrations from the relevant governmental authorities themselves. Neither this report nor any part of it is intended as, or shall constitute, provision of any consultancy or advisory service of securities investment as defined under PRC law. Such information is provided for your reference only.
Morgan Stanley Research is disseminated in Brazil by Morgan Stanley C.T.V.M. S.A.; in Mexico by Morgan Stanley México, Casa de Bolsa, S.A. de C.V which is regulated by Comision Nacional Bancaria y de Valores. Paseo de los Tamarindos 90, Torre 1, Col. Bosques de las Lomas Floor 29, 05120 Mexico City; in Japan by Morgan Stanley MUFG Securities Co., Ltd. and, for Commodities related research reports only, Morgan Stanley Capital Group Japan Co., Ltd; in Hong Kong by Morgan Stanley Asia Limited (which accepts responsibility for its contents) and by Morgan Stanley Asia International Limited, Hong Kong Branch; in Singapore by Morgan Stanley Asia (Singapore) Pte. (Registration number 199206298Z) and/or Morgan Stanley Asia (Singapore) Securities Pte Ltd (Registration number 200008434H), regulated by the Monetary Authority of Singapore (which accepts legal responsibility for its contents and should be contacted with respect to any matters arising from, or in connection with, Morgan Stanley Research) and by Morgan Stanley Asia International Limited, Singapore Branch (Registration number T11FC0207F); in Australia to "wholesale clients" within the meaning of the Australian Corporations Act by Morgan Stanley Australia Limited A.B.N. 67 003 734 576, holder of Australian financial services license No. 233742, which accepts responsibility for its contents; in Australia to "wholesale clients" and "retail clients" within the meaning of the Australian Corporations Act by Morgan Stanley Wealth Management Australia Pty Ltd (A.B.N. 19 009 145 555, holder of Australian financial services license No. 240813, which accepts responsibility for its contents; in Korea by Morgan Stanley & Co International plc, Seoul Branch; in India by Morgan Stanley India Company Private Limited; in Indonesia by PT. Morgan Stanley Sekuritas Indonesia; in Canada by Morgan Stanley Canada Limited, which has approved of and takes responsibility for its contents in Canada; in Germany by Morgan Stanley Bank AG, Frankfurt am Main and Morgan Stanley Private Wealth Management Limited, Niederlas-sung Deutschland, regulated by Bundesanstalt fuer Finanzdienstleistungsaufsicht (BaFin); in Spain by Morgan Stanley, S.V., S.A., a Morgan Stanley group company, which is supervised by the Spanish Securities Markets Commission (CNMV) and states that Morgan Stanley Research has been written and distributed in accordance with the rules of conduct applicable to financial research as established under Spanish regulations; in the US by Morgan Stanley & Co. LLC, which accepts responsibility for its contents. Morgan Stanley & Co. International plc, authorized by the Prudential Regulatory Authority and regulated by the Financial Conduct Authority and the Prudential Regulatory Authority, disseminates in the UK research that it has prepared, and approves solely for the purposes of section 21 of the Financial Services and Markets Act 2000, research which has been prepared by any of its affiliates. RMB Morgan Stanley Proprietary Limited is a member of the JSE Limited and regulated by the Financial Services Board in South Africa. RMB Morgan Stanley Proprietary Limited is a joint venture owned equally by Morgan Stanley Interna-tional Holdings Inc. and RMB Investment Advisory (Proprietary) Limited, which is wholly owned by FirstRand Limited. The information in Morgan Stanley Research is being disseminated by Morgan Stanley Saudi Arabia, regulated by the Capital Market Authority in the Kingdom of Saudi Arabia , and is directed at Sophisticated investors only.
Morgan Stanley Hong Kong Securities Limited is the liquidity provider/market maker for securities of HSBC listed on the Stock Exchange of Hong Kong Limited. An updated list can be found on HKEx website: http://www.hkex.com.hk.
The information in Morgan Stanley Research is being communicated by Morgan Stanley & Co. International plc (DIFC Branch), regulated by the Dubai Financial Services Authority (the DFSA), and is directed at Professional Clients only, as defined by the DFSA. The financial products or financial services to which this research relates will only be made available to a customer who we are satisfied meets the regulatory criteria to be a Professional Client.
The information in Morgan Stanley Research is being communicated by Morgan Stanley & Co. International plc (QFC Branch), regulated by the Qatar Financial Centre Regulatory Authority (the QFCRA), and is directed at business customers and market counterparties only and is not intended for Retail Customers as defined by the QFCRA.
As required by the Capital Markets Board of Turkey, investment information, comments and recommendations stated here, are not within the scope of investment advisory activity. Investment advisory service is provided exclusively to persons based on their risk and income preferences by the authorized firms. Comments and recommendations stated here are general in nature. These opinions may not fit to your financial status, risk and return preferences. For this reason, to make an investment decision by relying solely to this information stated here may not bring about outcomes that fit your expectations.
The trademarks and service marks contained in Morgan Stanley Research are the property of their respective owners. Third-party data providers make no warranties or representations relating to the accuracy, completeness, or timeliness of the data they provide and shall not have liability for any damages relating to such data. The Global Industry Classification Standard (GICS) was developed by and is the exclusive property of MSCI and S&P.
Morgan Stanley Research, or any portion thereof may not be reprinted, sold or redistributed without the written consent of Morgan Stanley.

© Morgan Stanley 2018
The Americas
1585 Broadway
New York, NY 10036-8293
United States
Tel: +1 (1) 212 761 4000
Europe
20 Bank Street, Canary Wharf
London E14 4AD
United Kingdom
Tel: +44 (0) 20 7 425 8000
Japan
1-9-7 Otemachi, Chiyoda-ku
Tokyo 100-8104
Japan
Tel: +81 (0) 3 6836 5000
Asia/Pacific
1 Austin Road West
Kowloon
Hong Kong
Tel: +852 2848 5200
EMEA Americas Asia Pacific
55 Baker Street 1166 Avenue of the Americas 8 Marina View
London 29th Floor #09-07 Asia Square
W1U 8EW New York, NY 10036 Tower 1 018960
United Kingdom United States Singapore
Tel: +44 20 7333 8333 Tel: +1 212 345 8000 Tel: +65 6510 9700