wholesale market operations · pdf filewholesale market operations update john dumas director...
TRANSCRIPT

Wholesale Market Operations Update
John DumasDirector of Wholesale Market Operations
December 12-13, 2011
Board of Directors Meeting
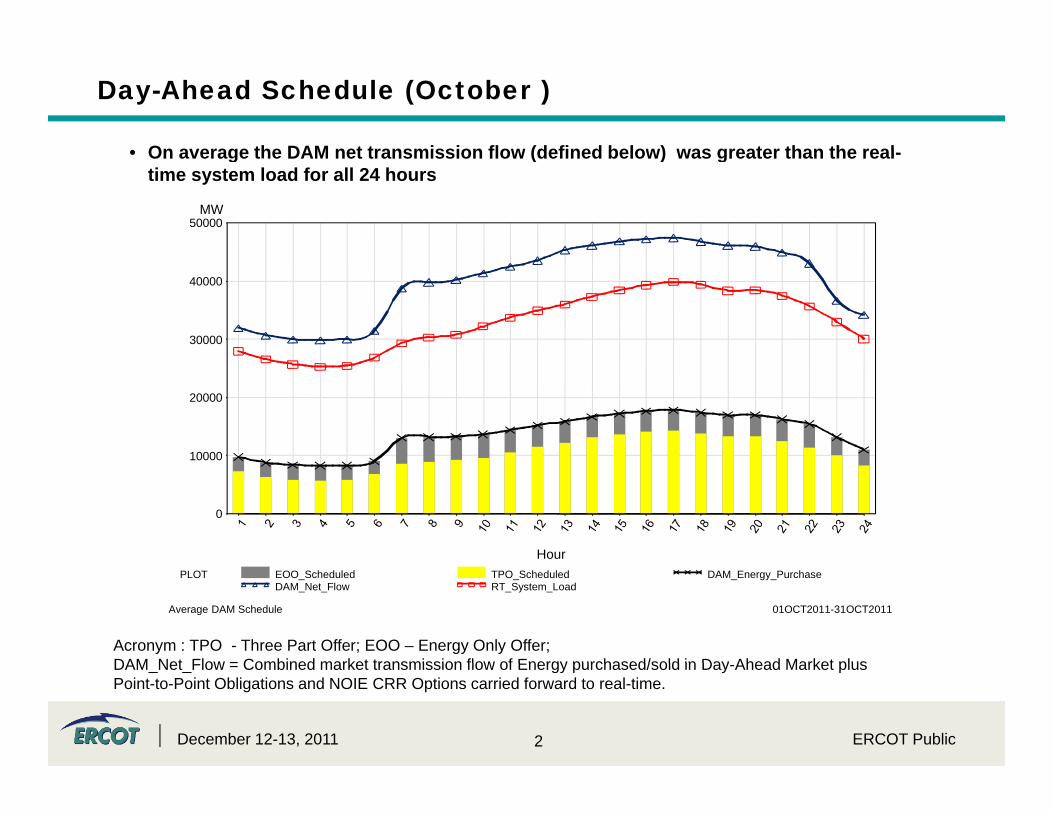
Day-Ahead Schedule (October )
• On average the DAM net transmission flow (defined below) was greater than the real• On average the DAM net transmission flow (defined below) was greater than the real-time system load for all 24 hours
MW50000
30000
40000
10000
20000
0
10000
Hour
Acronym : TPO - Three Part Offer; EOO – Energy Only Offer; DAM Net Flow = Combined market transmission flow of Energy purchased/sold in Day Ahead Market plus
Average DAM Schedule 01OCT2011-31OCT2011
PLOT EOO_Scheduled TPO_Scheduled DAM_Energy_PurchaseDAM_Net_Flow RT_System_Load
2
DAM_Net_Flow = Combined market transmission flow of Energy purchased/sold in Day-Ahead Market plus Point-to-Point Obligations and NOIE CRR Options carried forward to real-time.
December 12-13, 2011 ERCOT Public

Day-Ahead Schedule (November)
• On average the DAM net transmission flow (defined below) was greater than the real• On average the DAM net transmission flow (defined below) was greater than the real-time system load for all 24 hours
MW50000
30000
40000
10000
20000
0
10000
Hour
Acronym : TPO - Three Part Offer; EOO – Energy Only Offer; DAM Net Flow = Combined market transmission flow of Energy purchased/sold in Day Ahead Market plus
Average DAM Schedule 01NOV2011-30NOV2011
PLOT EOO_Scheduled TPO_Scheduled DAM_Energy_PurchaseDAM_Net_Flow RT_System_Load
3
DAM_Net_Flow = Combined market transmission flow of Energy purchased/sold in Day-Ahead Market plus Point-to-Point Obligations and NOIE CRR Options carried forward to real-time.
December 12-13, 2011 ERCOT Public

Day-Ahead Electricity And Ancillary Service Hourly Average Prices (October )
50$/
MW
h) 30
40
Pric
e ($
10
20
0
Hour
• Both Energy and AS prices followed the trend of load profile on average.
Day-Ahead Electricity and Ancillary Service Hourly Average Prices 01OCT2011-31OCT2011
PLOT System_lambda Reg_Up Reg_DownResponsive_Reserve Non_Spin
4
gy p p g• In some hours, Responsive Reserve prices were higher than Regulation Up prices.
ERCOT PublicDecember 12-13, 2011

Day-Ahead Electricity And Ancillary Service Hourly Average Prices (November)
40$/
MW
h)
20
30
Pric
e ($
10
20
0
Hour
• Both Energy and AS prices followed the trend of load profile on average.
Day-Ahead Electricity and Ancillary Service Hourly Average Prices 01NOV2011-30NOV2011
PLOT System_lambda Reg_Up Reg_DownResponsive_Reserve Non_Spin
5
gy p p g• In all hours, Responsive Reserve prices were lower than or close to Regulation Up prices.
ERCOT PublicDecember 12-13, 2011

Day-Ahead Vs Real-Time Load Zone SPP(Hourly Average) (October )
8090
100
8090
100Load Zone West Prices Load Zone North Prices
Pric
e ($
/MW
h)
01020304050607080
Pric
e ($
/MW
h)
01020304050607080
0
Hour
0
Hour
8090
100
8090
100
Average_of_DASPP Average_of_RTSPP Average_of_DASPP Average_of_RTSPPLoad Zone South Prices Load Zone Houston Prices
Pric
e ($
/MW
h)
1020304050607080
Pric
e ($
/MW
h)1020304050607080
0
Hour
0
HourDA Vs RT Hourly Average SPP Load Zone Summary 01OCT2011-31OCT2011
6 ERCOT PublicDecember 12-13, 2011

Day-Ahead Vs Real-Time Load Zone SPP(Hourly Average) (November)
8090
100
8090
100Load Zone West Prices Load Zone North Prices
Pric
e ($
/MW
h)
01020304050607080
Pric
e ($
/MW
h)
01020304050607080
0
Hour
0
Hour
8090
100
8090
100
Average_of_DASPP Average_of_RTSPP Average_of_DASPP Average_of_RTSPPLoad Zone South Prices Load Zone Houston Prices
Pric
e ($
/MW
h)
1020304050607080
Pric
e ($
/MW
h)1020304050607080
0
Hour
0
HourDA Vs RT Hourly Average SPP Load Zone Summary 01NOV2011-30NOV2011
7 ERCOT PublicDecember 12-13, 2011

Day-Ahead vs Real-Time HUB SPP (Hourly Average) (October )
8090
100
8090
100Hub West Prices Hub North Prices
Pric
e ($
/MW
h)
01020304050607080
Pric
e ($
/MW
h)
01020304050607080
0
Hour
0
Hour
8090
100
8090
100
Average_of_DASPP Average_of_RTSPP Average_of_DASPP Average_of_RTSPPHub South Prices Hub Houston Prices
Pric
e ($
/MW
h)
1020304050607080
Pric
e ($
/MW
h)1020304050607080
0
Hour
0
HourDA Vs RT Hourly Average SPP Hub Summary 01OCT2011-31OCT2011
8 ERCOT PublicDecember 12-13, 2011

Day-Ahead vs Real-Time HUB SPP (Hourly Average) (November)
8090
100
8090
100Hub West Prices Hub North Prices
Pric
e ($
/MW
h)
01020304050607080
Pric
e ($
/MW
h)
01020304050607080
0
Hour
0
Hour
8090
100
8090
100
Average_of_DASPP Average_of_RTSPP Average_of_DASPP Average_of_RTSPPHub South Prices Hub Houston Prices
Pric
e ($
/MW
h)
1020304050607080
Pric
e ($
/MW
h)1020304050607080
0
Hour
0
HourDA Vs RT Hourly Average SPP Hub Summary 01NOV2011-30NOV2011
9 ERCOT PublicDecember 12-13, 2011
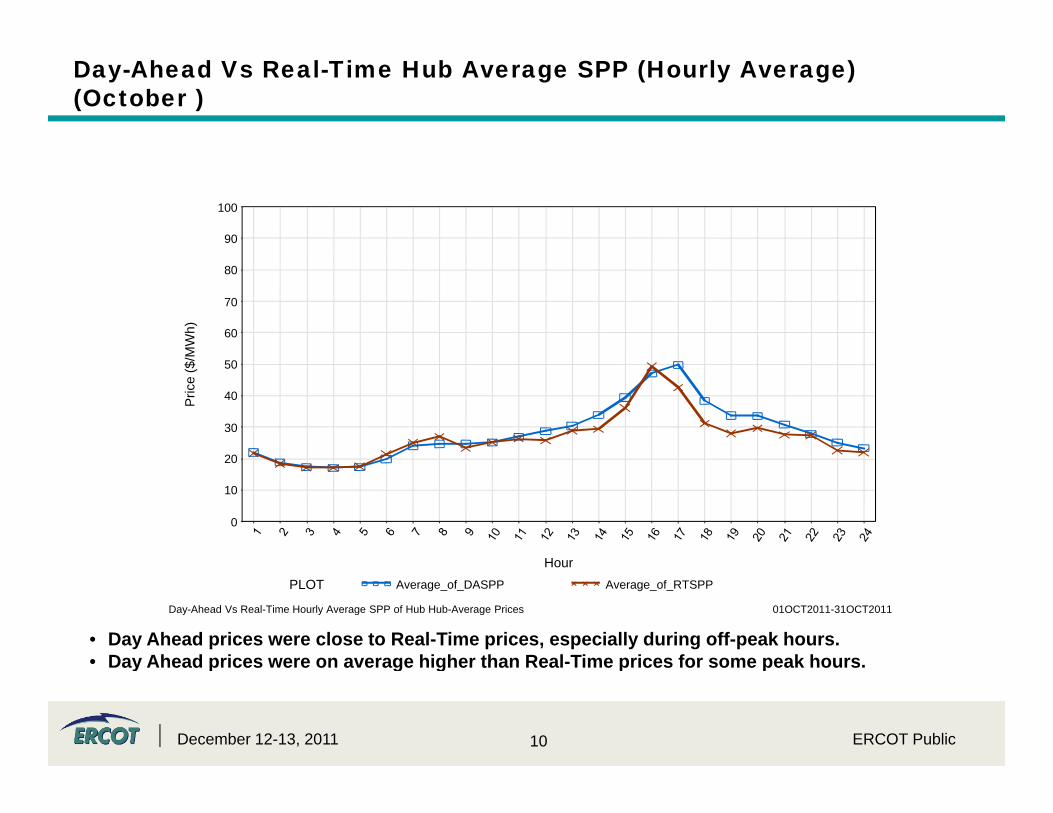
Day-Ahead Vs Real-Time Hub Average SPP (Hourly Average) (October )
90
100M
Wh) 60
70
80
Pric
e ($
/M
20
30
40
50
0
10
20
Hour
• Day Ahead prices were close to Real-Time prices, especially during off-peak hours.• Day Ahead prices were on average higher than Real-Time prices for some peak hours
Hour
Day-Ahead Vs Real-Time Hourly Average SPP of Hub Hub-Average Prices 01OCT2011-31OCT2011
PLOT Average_of_DASPP Average_of_RTSPP
10 ERCOT Public
• Day Ahead prices were on average higher than Real-Time prices for some peak hours.
December 12-13, 2011

Day-Ahead Vs Real-Time Hub Average SPP (Hourly Average) (November)
90
100M
Wh) 60
70
80
Pric
e ($
/M
20
30
40
50
0
10
20
Hour
• Day Ahead prices were close to Real-Time prices, especially during off-peak hours.• Day Ahead prices were on average higher than Real-Time prices for most peak hours
Hour
Day-Ahead Vs Real-Time Hourly Average SPP of Hub Hub-Average Prices 01NOV2011-30NOV2011
PLOT Average_of_DASPP Average_of_RTSPP
11 ERCOT Public
• Day Ahead prices were on average higher than Real-Time prices for most peak hours.
December 12-13, 2011

Day-Ahead Vs Real-Time Cumulative Average SPP (October )
40M
Wh)
20
30
SP
P ($
/M
0
10
-20
-10
Date
• The cumulative Real Time prices were typically more volatile than the Day-Ahead prices i O t b b t th diff d i th th
Date
Day-Ahead Vs Real-Time Cumulative Average SPP for Simple Average Prices 01OCT2011-31OCT2011
PLOT AVG_DAM AVG_RT AVG_DAM-AVG_RT
12
in October but the difference was decreasing over the month
ERCOT PublicDecember 12-13, 2011

Day-Ahead Vs Real-Time Cumulative Average SPP (November)
40M
Wh)
20
30
SP
P ($
/M
0
10
-20
-10
Date
• The cumulative Real Time prices were more volatile than the Day-Ahead prices
Date
Day-Ahead Vs Real-Time Cumulative Average SPP for Simple Average Prices 01NOV2011-30NOV2011
PLOT AVG_DAM AVG_RT AVG_DAM-AVG_RT
13 ERCOT PublicDecember 12-13, 2011

Load Weighted Average SPP (October )
Day-AheadReal-Time
40
33 5
37.9
35.132 9
e SP
P ($
/MW
h)
30
31.829.9
33.531.8
30.6 30.328.8
30.232.4
30.328.6
32.9
27.826.2
eigh
ted
Ave
rage
20
Load
W
0
10
• The load weighted average RT SPPs were slightly higher than the load weighted average
Load Weighted Average SPP for Each Zone 01OCT2011-31OCT2011
0LZ_1
AEN2
CPS3
LCRA4
RAYBN5
HOUSTON6
NORTH7
SOUTH8
WEST
14 ERCOT Public
DAM SPPs in 2 load zones and lower in the other 6 load zones.
December 12-13, 2011
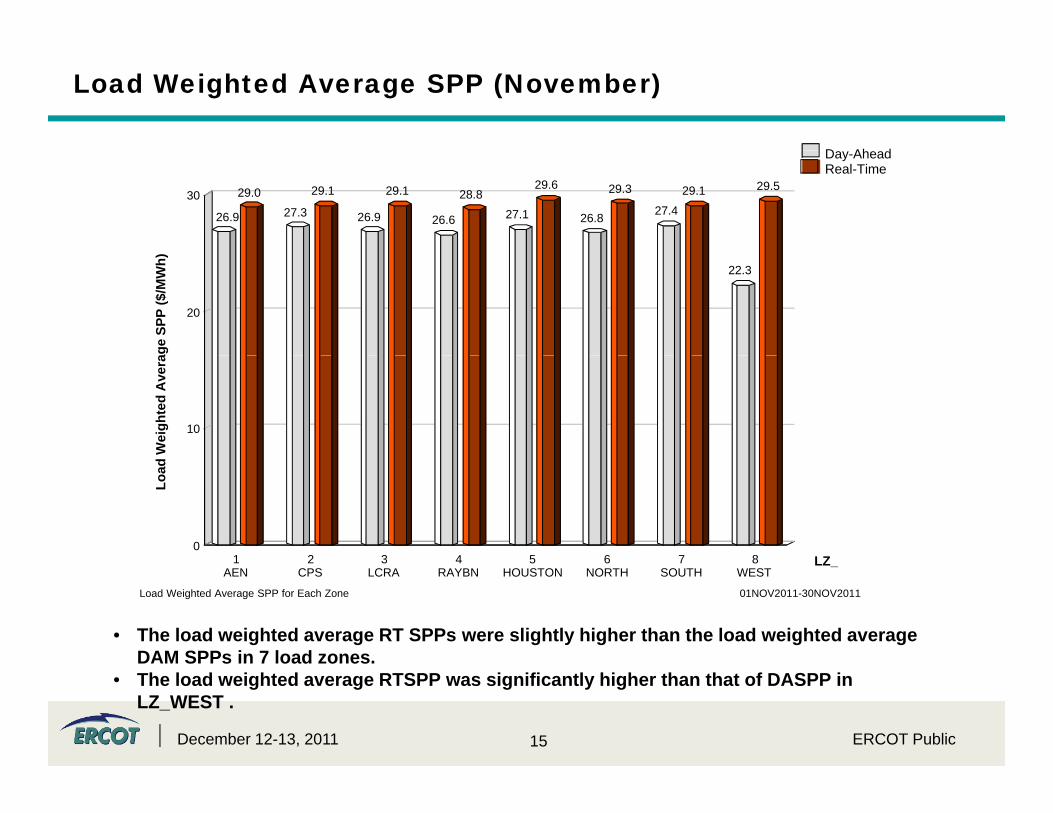
Load Weighted Average SPP (November)
D Ah dDay-AheadReal-Time
30
26.9
29.027.3
29.1
26.9
29.1
26.6
28.827.1 26.8
29.3 29.1
27.4
29.529.6
age
SPP
($/M
Wh)
20
22.3
Wei
ghte
d A
vera
10
Load
0LZ1 2 3 4 5 6 7 8
• The load weighted average RT SPPs were slightly higher than the load weighted average DAM SPPs in 7 load zones.
Load Weighted Average SPP for Each Zone 01NOV2011-30NOV2011
LZ_1AEN
2CPS
3LCRA
4RAYBN
5HOUSTON
6NORTH
7SOUTH
8WEST
15 ERCOT Public
DAM SPPs in 7 load zones.• The load weighted average RTSPP was significantly higher than that of DASPP in
LZ_WEST .
December 12-13, 2011

DRUC Monthly Summary (October )
45000
31 Executions (0 Missed) 9.90-Min Average Execution Time1 Published after 1600; 0 Published after 1800 0 MWh Committed (0 Resources for 0 Hours)
Fore
cast
(MW
)
3700038000390004000041000420004300044000
ge S
ched
ule/
Load
290003000031000320003300034000350003600037000
DR
UC
Ave
rag
2500026000270002800029000
Hour
DRUC Average QSE Scheduled Capacity/Load Forecast 01OCT2011-31OCT2011
PLOT LD_FCST_MW DRUC_INPUT_HSL_MWSCHED_HASL_MW DRUC_OUTPUT_HSL_MW
16 ERCOT PublicDecember 12-13, 2011
DRUC didn’t commit any Resource and hence input and output HSL MW is the same

DRUC Monthly Summary (November)
30 Executions (0 Missed)0 Published after 1600; 0 Published after 1800Note: Colors Indicate Individual Resources
41000
6.50-Min Average Execution Time71940 MWh Committed (5 Resources for 555 Hours)
acity
(MW
)
3000
4000
Fore
cast
(MW
)
34000350003600037000380003900040000
et C
omm
itted
Cap
a
2000
ge S
ched
ule/
Load
28000290003000031000320003300034000
DR
UC
Ne
0
1000
DR
UC
Ave
rag
24000250002600027000
Hour
Net Committed Capacity in DRUC 01NOV2011-30NOV2011 DRUC Average QSE Scheduled Capacity/Load Forecast 01NOV2011-30NOV2011
PLOT LD_FCST_MW DRUC_INPUT_HSL_MWSCHED_HASL_MW DRUC_OUTPUT_HSL_MW
17 ERCOT PublicDecember 12-13, 2011

HRUC Monthly Summary (October )
742 Executions (2 Missed)7.70-Min Average Execution TimeNote: Colors Indicate Individual Resources
p. (M
W)
20000
30000
Net
Com
mitt
ed C
ap
10000
20000
HR
UC
0
10000
Net Committed Capacity in HRUC 01OCT2011-31OCT2011
18 ERCOT PublicDecember 12-13, 2011

HRUC Monthly Summary (November)
719 Executions (1 Missed)5.20-Min Average Execution TimeNote: Colors Indicate Individual Resources
p. (M
W)
1000
1100
1200
1300
1400
Net
Com
mitt
ed C
ap
500
600
700
800
900
HR
UC
0
100
200
300
400
Net Committed Capacity in HRUC 01NOV2011-30NOV2011
19 ERCOT PublicDecember 12-13, 2011

Supplemental Ancillary Service Market (SASM) Summary(October )
17 SASMs in 01OCT2011-31OCT2011For AS Failure to Provide
8
0 SASMs in 01OCT2011-31OCT2011For AS Undeliverability
8
o P
rovi
de
6
7
8
erab
ility
6
7
8
ASM
s fo
r Fai
lure
to
3
4
5
ASM
s fo
r Und
eliv
e
3
4
5
Cou
nt o
f SA
1
2
3
Cou
nt o
f SA
1
2
3
0Hour
0Hour
20 ERCOT PublicDecember 12-13, 2011

Supplemental Ancillary Service Market (SASM) Summary(November)
7 SASMs in 01NOV2011-30NOV2011For AS Failure to Provide
6
0 SASMs in 01NOV2011-30NOV2011For AS Undeliverability
6
o P
rovi
de
5
6
erab
ility 5
6
ASM
s fo
r Fai
lure
to
3
4
ASM
s fo
r Und
eliv
e
3
4
Cou
nt o
f SA
1
2
Cou
nt o
f SA
1
2
0Hour
0Hour
21 ERCOT PublicDecember 12-13, 2011
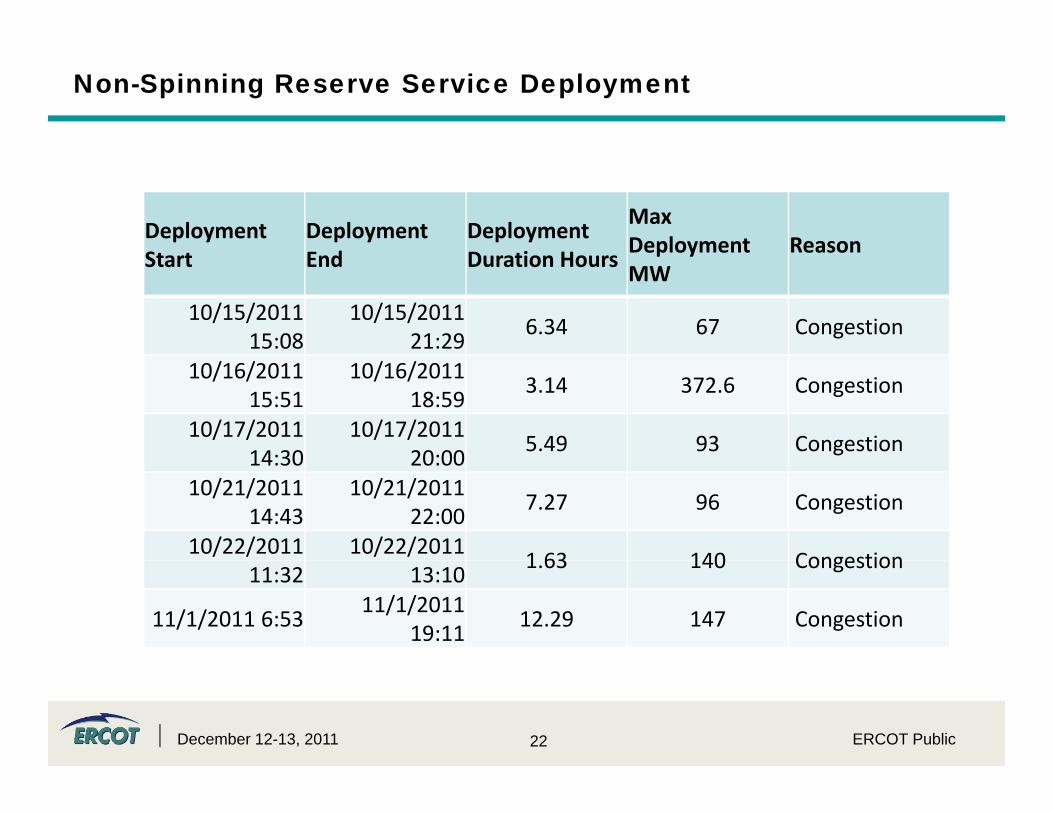
Non-Spinning Reserve Service Deployment
Deployment St t
Deployment E d
Deployment D ti H
Max Deployment Reason
Start End Duration Hoursp y
MW
10/15/2011 15:08
10/15/2011 21:29
6.34 67 Congestion
10/16/2011 15:51
10/16/2011 18:59
3.14 372.6 Congestion
10/17/2011 14:30
10/17/2011 20:00
5.49 93 Congestion14:30 20:00
10/21/2011 14:43
10/21/2011 22:00
7.27 96 Congestion
10/22/2011 10/22/2011 1 63 140 Congestion
11:32 13:101.63 140 Congestion
11/1/2011 6:5311/1/2011
19:1112.29 147 Congestion
22 ERCOT PublicDecember 12-13, 2011

CRR Auction for Operating Month November 2011
127 442 Bid /Off• 127,442 Bids/Offers• 13,284 Auction Awards
• 136 144 MW Total• 136,144 MW Total• 49,747 Peak WD• 47,022 Peak WE• 39,373 Off-peak
• Total Auction/Allocation Revenue = $ 8.35 M
23December 12-13, 2011 ERCOT Public

CRR Auction for Operating Month December 2011
118 448 Bid /Off• 118,448 Bids/Offers• 11,594 Auction Awards
• 140 441 MW total• 140,441 MW total• 51,675 Peak WD• 47,166 Peak WE• 41,600 Off-peak
• Total Auction/Allocation Revenue = $ 12.92 M
24December 12-13, 2011 ERCOT Public

CRR Price Convergence*
*C t l l ti th d f litti t b t th i lti th ti P i th d th l ith th CRR A ti R
25December 12-13, 2011 ERCOT Public
*Cost calculation uses a new method of splitting costs between months in multi-month auctions. Previous months used the same algorithm as the CRR Auction Revenue Distribution.

Annual CRR Auction for 2012/2013
2012 Annual Auction (55% of system capacity)2012 Annual Auction (55% of system capacity)• 90,620 Bids/Offers• 25,514 Auction Awards
• 1,008,660 MW• 370,880 Peak WD• 350,418 Peak WE• 287,362 Off-peak
• Total Auction/Allocation Revenue = $ 167 5 MTotal Auction/Allocation Revenue $ 167.5 M• Credit Allocation = $1,210,000,000
2013 Annual Auction (15% of system capacity)• 190,359 Bids/Offers• 27,292 Auction Awards
• 309,475 MW114 096 P k WD• 114,096 Peak WD
• 105,745 Peak WE• 89,634 Off-peak
• Total Auction/Allocation Revenue = $ 60.65 M
26
• Credit Allocation = $442,000,000
December 12-13, 2011 ERCOT Public

Both years of Auction published on time (completed execution between Oct31 Nov16)
Annual CRR Auction for 2012/2013
– Both years of Auction published on time (completed execution between Oct31- Nov16)– Lessons learned:
• Credit- Significant market credit hold of $1.6 billion for 2 weeks, so team to propose changes to timing and sequence to alleviate coinciding credit collateral posting (next bullet).
• Sequence/timing considering with market changes to execute 2 year auction in separate bid and• Sequence/timing- considering with market changes to execute 2-year auction in separate bid and credit windows for each year to relieve market credit and improve analysis of results.
• Technical- 2013 PeakWeekDay auction executed for 194 hours, so evaluating performance improvement options for next year’s auction (software, servers, configuration).
• Bid Limit of 200 000- Market was oversubscribed for 2012 so looking at alternative minimum bidsBid Limit of 200,000- Market was oversubscribed for 2012 so looking at alternative minimum bids prices or curtailment of least value bids prior to running auctions.
27 ERCOT PublicDecember 12-13, 2011

Market Enhancements Under Consideration
• Three NPRRs were submitted on Nov 9th and approved by TAC on Dec 1st to cover discussion at PUCT Open Meeting on October 27
– NPRR426 Standing Non-Spin Deployment in the Operating Hour for Resources Providing On-Line Non-Spin– NPRR427 Energy Offer Curve Requirements for Generation Resources Assigned Reg-Up and RRS– NPRR428 Energy Offer Curve Requirements for Generation Resources Assigned Non-Spin Responsibility
• Evaluating market design improvement proposals– Moving 500MW from Non-spin to RRS– Putting offer floor for RUC committed resources– Changing Power Balance penalty cost.
• Evaluating feasibility of implementing Pilots for– Fast response regulation service– 30 min EILS service– Active deployment of Load Resources participating in Non-Spin based on forecasted pricep y p p g p p
• Demand Response– EILS Proposed Rule Enhancements
• Option to renew contract after deployment obligations are met early in a contract period• Adding Distributed Generation could potentially add an additional 50 – 100MW by summer• 30 minute EILS response could potentially add an additional 80 – 100 MW by summer
• Look-Ahead SCED functions framed for market consideration – Workshop held on November 28th to begin detail discussions of whitepaper and implementation– NPRR351 will represent Phase I of Implementation (indicative future prices and ramping)
28
p p ( p p g)
ERCOT PublicDecember 12-13, 2011

Look-Ahead SCED
• Key milestonesKey milestones– Jan –Oct 2012: Work with market on Look-Ahead SCED whitepaper and scope– Summer 2012: Implement non-binding Phase I / NPRR351 (future prices)– October 2012 : Market approval of protocols for subsequent Phase(s) – Summer 2013: Potential implementation of Phase 2 (binding prices and commitment)
Phase Timeline Feature Implemented Comment
Phase 1 Summer Short Term future Advisory/Indicative Base Will initially run in Open LoopPhase -1 Summer 2012
Short-Term future Advisory/Indicative Base Points and LMPs using basic version of RTD.
Will initially run in Open-Loop i.e outputs (Base Points,LMPs) are Advisory/Indicative. i.e. non-binding.
Phase-2 Summer 2013
Commitment for QSGR and Load Resources with intra-hour temporal constraints using basic version of RTC.
Will initially run in Open-Loop i.e. outputs (Commitment instructions) are Advisory/Indicative. i.e. non-bi dibinding.
Phase-3 Spring2014
Real-Time Ancillary Service and Energy Co-optimization using RTC.
Phase-4 Fall 2015 Transmission constraints for future intervals
29 ERCOT PublicDecember 12-13, 2011
Phase-4 Fall 2015 Transmission constraints for future intervals