why a jobs turnaround despite slowing growth?
TRANSCRIPT

Santosh Mehrotra
Sharmistha Sinha
Jajati K. Parida
Ankita Gandhi
Why a Jobs Turnaround Despite Slowing Growth?
IAMR Occasional Paper 1/2014
Institute of Applied Manpower Research Planning Commission, Government of India
2014

Planning Commission
2014
All rights reserved . No Part of this publication may be reproduced, stored in a retrieval system, or transmitted, in any form or by any means, without the prior permission in writing
of Planning Commission
: 978-93-83133-35-2

Why a jobs turnaround despite Slowing growth?
Santosh Mehrotr, Sharmistha Sinha Jajati K. Parida, Ankita Gandhi
Institute of Applied Manpower Research Planning Commission, Government of India

Dr.Santosh Mehrotra is Director-General, Institute of Applied Manpower Research, Planning Commission (intherank of Secretary,GovernmentofIndia).
He has an MAin Economics from the New School for Social Research, New School University, New York (1981) and Ph.Din Economics from Cambridge (1985).
Dr. Mehrotra has over 30yearso fex perience of work in ginacademia and public systems. Of this 30- year period, over 10 have been in the Indian public system, including seven years directly in the Government of India (Planning Commission), and over five years in academia in government-funded research institutions and university (Jawaharlal Nehru University, NewDelhi, where he was Associate Professorfrom1988-1991).
From 1991to2006, hespent 15 years with two UN agencies–UNICEF and UNDP. He was chief economist of UNDP's global Human Development Report (2002-05), New York. Healsoled the research programme on developing countries at UNICEF's global research institute, the Innocenti Research Centre, Florence, Italy(1999-2002).
In September 2006 he joined as head, Rural Development Division, Planning Commission, when he was also Economic Adviser, Social Sectors. He was thenhead, Development Policy Division, Planning Commission (till August 2009). During this period he was an author of several chapters in India's 11thFive Year Plan(2007-2012),and most recently of several chapters in the12th Five Year Plan (including the one on Skill Development and on Employment). He led the team that wrote the second national Human Development Report(OxfordUniversityPress,2011).
He was alsoa Parkin Visiting Professorat the Centre for International Development in the Faculty of Social Sciences, Bath University, UK(2010-13).
Sharmistha Sinhais Deputy Director, Institute of Applied Manpower Research. She is an economist and gender specialist working on labour and changing employment patterns, gender based discrimination, wage inequality, poverty and other development issues. She is finishing Ph.Din economics from Jawaharlal Nehru University, New Delhi.
JajatiK.Parida is Deputy Director, Institute of Applied Manpower Research. He is an economist working on employment, labour migration, regional development and holds a Ph. Din Economics from the Institute of Social and Economic Change, Bangalore.
AnkitaGandhi is an economist working on issues of Human Development, Employment and Skills. She is currently engaged with UNDP and working on G20 issues in the Department of Economic Affairs, Ministry of Finance. She is also pursuing a Ph.D. in Economics at Jawaharlal Nehru University, New Delhi.

Contents
Section Page No.
Introduction 1
1 Employment Trends in India 2
2 Jobs: who gained or lost? 7
3 Towards an understanding of employment trends since 1993-94
13
4 Policy implications: Sustaining the Lewis-ian transition of workers into non-agricultural employment
23

iv
List of Tables
Table 1 Size of Labour Force, Workforce (by sectors), Unemployed and Employment Elasticity of Output, 1994 to 2012
3
Table 2 Absolute Employment by Principal and Subsidiary Status, Sector wise, 2000 to 2012
4
Table 3 AbsoluteEmployment and Change in Manufacturing, Non-manufacturing and Service Sectors Employment (PS+SS) in India, 2000 to 2012
6
Table 4 Sector-wise employment by sex and types of employment 9 Table 5 Employment and Change in employment during the decade, by sector
and type of employment (PS+SS) 10
Table 6 Sector-wise distribution of workers by organised-unorganised enterprises and formal-informal employment, 2004-2012 (% figures in parentheses)
11
Table 7 Number of workers by size of enterprise in Industry and services sectors in India
13
Table 8 Relationship between Demographic Trends, the Workforce and Participation in Educational Institutions
14
Table 9 Manufacturing Integration and Trade balance (with and without POL exports)
20
Table 10 Capital intensity of output in organized manufacturing 21 Table 11 Trends of Rural and Urban Real wages by Occupation in India, 1994-
2012 21
Table 12 Percentage Distribution of Factories by Size of Employment (all sectors)
26
List of figures
Figure 1 Absolute Changes in employment by gender (million) 7 Figure 2 Trends of Real wage rates (at 2001-02 prices) in Rural and Urban India
1994-2012 16
Figure 3 Trends of Merchandise Exports of India,1996-2013 19 Figure 4 Employment, Productivity and Working Conditions, by Size of
Enterprises 27
Bibliography
30

v
Executive Summary
The paper identifies key trends in employment over 2000-2012, and attempts an
explanation of the trends.
A shift away from agriculture to non-agricultural employment has gained
momentum. Prior to 2004-05, only the share of agriculture in the workforce was
falling (from 60 to 49 percent between 1999-2000 and 2011-12). For the first time in
India’s post-independence economic history, there has been an absolute fall in the
numbers employed in agriculture – by 36.7 million during 2004-05 to 2011-12 –
because the number of non-agricultural jobs is growing.
Non-agricultural employment grew by 52 million to reach 242.3 million in 2011-12
as against 190 million in 2004-05. While non-agricultural employment grew by 7.5
million per year over 1999-2000 to 2004-5, it also grew by 7.5 mn. pa over 2004-5 and
2001-12. However, the numbers joining the labour force during 2000-2005 was 12
million pa., but fell to 5.5 million between 2004-05 to 2011-12. The result was that
the rate of open unemployment fell.
Increase in employment in construction sector along with increased infrastructure
investment gave a major boost to total employment attracting agricultural workers,
contributing to a rise in rural wages. The biggest increase in non-agricultural
employment has been in construction, both rural and urban, from a total of 17
million in 2000 to 50 million in 2011-12, with a doubling in total employment in a
matter of seven years since 2004-05.
Employment in manufacturing sector increased by 9 million during 2010 to 2012,
even though it had fallen by 3 million between 2005 and 2010. There has been a
recent rise in employment elasticity of manufacturing output, which may well be
sustained, since rural consumption has risen significantly over the last decade.
The paper identifies the factors underlying the trends:
a) It finds that with increasing female education, fall in girl child labour,
mechanization in agriculture, and increase in household income, girls and women
withdrew from the labour force. The withdrawal by women is a major contributor
to employment trends since 2004-05 just as their joining the labour force at a time
of stagnant agriculture (1999-2000 to 2004-05) had been a reason for the apparent
rise in 20 million ‘jobs’ in agriculture in the first half of the decade (when in fact it
was distress employment).
b) Fewer people were available to join the workforce due to rising enrolments in school
and continuing into education, including for boys and men. This trend significantly
intensified after 2004-5, although it had begun earlier.
c) Rise in wages, mechanization in agriculture, and increased investment in
infrastructure and housing were the reasons for the shift of workers away from
agriculture to non-agriculture.
d) The decline in manufacturing employment during 2005-2010 was a result of three
sets of factors: falling demand for manufacturing exports, rising import-intensity of
manufacturing output; and rising wages, with the latter two raising capital intensity.
However, just as manufacturing employment grew by 11 million between 2000
and 2005, it grew again most recently between 2009-10 and 2011-12. In fact,
it grew much more sharply in these two years (by 9 million) than it had between
2000 and 2005.

vi
e) Decline in poverty and rise in consumption, as an outcome of the rise in real
wages, has driven demand for simple consumer goods at the bottom of the pyramid,
driving manufacturing employment in the low-productivity small scale enterprises.
Based on these trends, the paper makes the following policy suggestions to increase non-
agricultural employment.
Fluctuations in total employment in the past decade can in part be attributed to
women joining and withdrawing from the workforce. If women are voluntarily
withdrawing from work to continue their education, policy-makers should be concerned
about providing jobs to these educated girls and women who will join the workforce in
coming years.
Women often do not have access to quality training, especially in rural areas on
account of very few training centres (ITIs), infrastructure bottlenecks (safe
transportation), and lack of female instructors. Skill development will raise the
possibility of increasing women’s labour force participation.
Developing specific policies towards developing a supportive care economy and
women friendly/oriented jobs in and around the village/city will help women to join the
labour force.
Young men too face employability issues that derive from their poor level of skills
and need adequate training.
India has millions of micro-enterprises, and a small number of large enterprises by size of
employment. Thus, there is a missing middle among Indian non-agricultural firms. To
address the missing middle there is a need to minimize the disincentives for growth of
firms.
There is an inbuilt disincentive system facing the micro and small enterprises (MSEs) to
invest in capital and expand. The criterion of investment in plant and machinery is used
to determine whether it is a MSME. There are both financial and non-financial
incentives and benefits from the various government schemes for the first two
categories: micro and small enterprises. These incentives disappear, and the enterprise
loses all the benefits if it grows (increases its investment) beyond Rs.5 crore.
Indian firms have been exposed to labour laws for over three decades, and have learnt to survive with them and have adjusted their operations in line with the requirements of various labour regulations; hence, in enterprise surveys conducted by the World Bank, firms say that labour laws are 4th or 5th in the constraints faced by firms. However, firms face over 50 central government and several dozen state laws in addition. Moreover, firms tend to operate in smaller sizes or hire contract labour rather than permanent labour to stay out of the ambit of the Industrial Disputes Act. Factories employing less than 99 workers are about two thirds of all factories surveyed under ASI. There is a cliff at 100+ workers; a visible fall in the percentage of factories with over 100 workers. Concerted efforts are needed to support transition of smaller enterprises to medium ones with government support or tax incentives.

1
Why a jobs turnaround despite slowing growth?
Introduction
The new millennium has seen a marked increase in India’s GDP growth rateaccompanied by a slowshift in the structure of both output and employment.The contributions to GDP over 2000-01 to 2011-12changed foragriculture from 24 to 14 per cent, for industry from 27 to 28 per cent, and for services from 49 to 58 per cent.Similarly the structure of employment for the same period also changed: for agriculture from 61 to 49 per cent, for industry from 15.5 to 24.3 per cent and for services from 22.5 to 26.7 per cent.
What is clear from the changes in relative shares is that structural change in employment is taking place more slowly than in output. The diverging trend between the structure of output on the one hand, and the structure of employment on the other, in the last decade since GDP growth rate increased in the new millennium remains a matter of concern for policy makers. This is more so, since the share of the working age population in total population has been growing – the so-called demographic dividend.
Inclusive growth, a goal of the 11th Five Year Plan and a stated goal of the 12th Five Year Plan (2012-17), will not be achieved without generating more non-agricultural employment. This paper argues that since 2004-05 the structural shifts in employment and the significant increase in rural wages have initiated an underlying process that has promoted inclusive growth. If that had not been the case we would not have seen the significant increase in consumption expenditure per capita since 2004-05 as demonstrated by the National Sample Surveys of 2009-10 and 2011-12. Sharp upward movement in consumption expenditure since 2004-05 is the reason behind the decline in absolute numbers of the poor on a scale unprecedented in the post-independent history of India. Post 2004-05, when a revised (Tendulkar) poverty line raised the absolute and relative poverty estimates, the absolute number of poor in 2004-05 was 407 million. That number had fallen by over 50 million to 356 million in 2009-101and further to 269 million in 2011 (a total fall of 138 million)2. This significant decline in the number of absolute poor was driven by a sharp rise in wage rates after 2004-05, accompanied by some significant positive shifts in the structure of employment, which are discussed in this paper.
The paper also discussesmajorsources of concern in both quantity and quality of employment (especially agricultural). In terms of quantity, the concern arises from the falling employment-elasticity of output, the relatively slow growth rate of manufacturing employment in the second half of the decade, even though there has been a turn around since
1The fall between 2004-5 and 2009-10 seems misleadingly low because 2009-10 was a drought year, and hence, despite rapid agricultural and overall GDP growth, incomes/consumption expenditure could not have increased much. Meanwhile, by 2011-12 agricultural and GDP growth had bounced back up. 2 The incidence of poverty in this period declined from 37.2 percent in 2004-05 to 21.9 percent in 2011-12.
2
2009-2010, and the rising manufacturing sector import ratio that has been accompanied by growing capital-intensity of manufacturing output. In terms of the quality of jobs, the concerns arise from the rising share of informal employment even while the level and share of organized enterprises employment has been rising in absolute terms, the continuing predominance of small enterprises, and the missing-middle in the distribution of enterprises by size-class.
This paper is organized as follows. Section 1 describes the trends in employment and its structure (i.e. its sectoral composition and the sub-sectors that drove the trends) since the start of the millennium. Section 2 attempts to explain the employment trends by discussing who gained and who lost in the labour market: men or women; the self-employed, casual or regular workers; the organized or the unorganized segment workers, especially in the non-agricultural sectors; and finally, which types of enterprises saw a rise in employment in terms of size. Section 3 goes on toanalyse the reasons for the underlying employmenttrends by sector. Section 4 draws policy implications from the findings reported in the previous three sections.
1. Employment trends in India
Size of Labour Force, Workforce and Unemployment rate
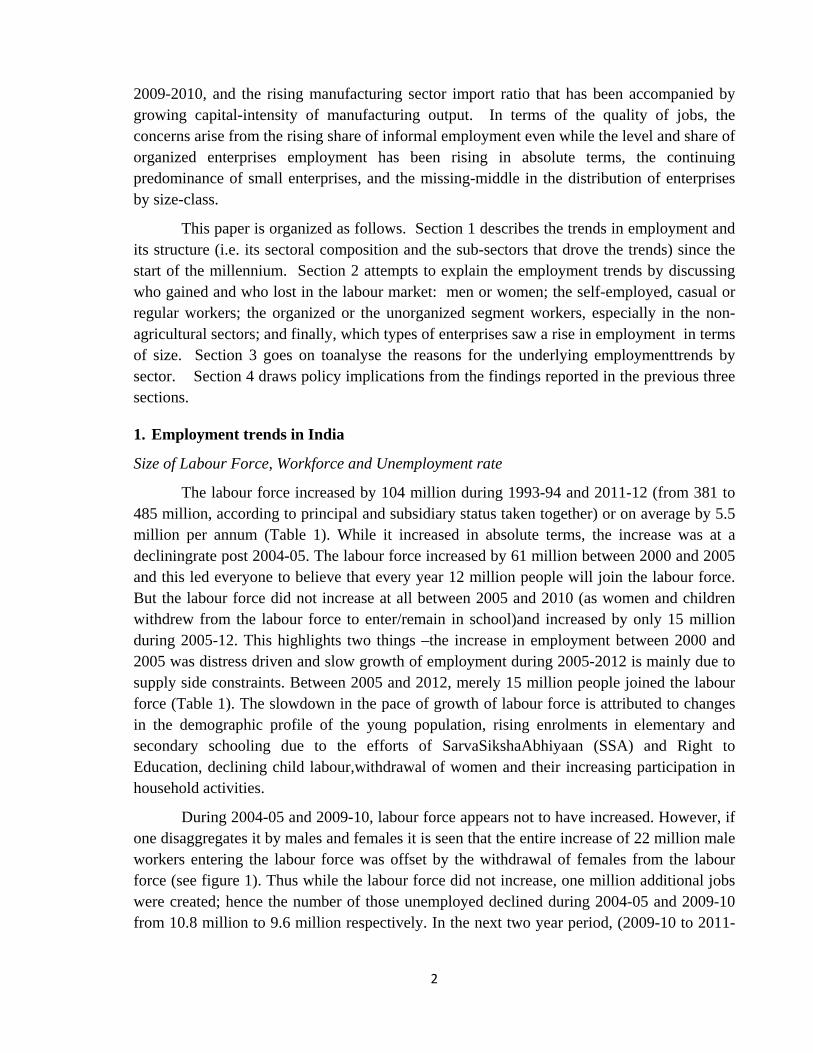
The labour force increased by 104 million during 1993-94 and 2011-12 (from 381 to 485 million, according to principal and subsidiary status taken together) or on average by 5.5 million per annum (Table 1). While it increased in absolute terms, the increase was at a decliningrate post 2004-05. The labour force increased by 61 million between 2000 and 2005 and this led everyone to believe that every year 12 million people will join the labour force. But the labour force did not increase at all between 2005 and 2010 (as women and children withdrew from the labour force to enter/remain in school)and increased by only 15 million during 2005-12. This highlights two things –the increase in employment between 2000 and 2005 was distress driven and slow growth of employment during 2005-2012 is mainly due to supply side constraints. Between 2005 and 2012, merely 15 million people joined the labour force (Table 1). The slowdown in the pace of growth of labour force is attributed to changes in the demographic profile of the young population, rising enrolments in elementary and secondary schooling due to the efforts of SarvaSikshaAbhiyaan (SSA) and Right to Education, declining child labour,withdrawal of women and their increasing participation in household activities.
During 2004-05 and 2009-10, labour force appears not to have increased. However, if one disaggregates it by males and females it is seen that the entire increase of 22 million male workers entering the labour force was offset by the withdrawal of females from the labour force (see figure 1). Thus while the labour force did not increase, one million additional jobs were created; hence the number of those unemployed declined during 2004-05 and 2009-10 from 10.8 million to 9.6 million respectively. In the next two year period, (2009-10 to 2011-
3
12) while 15 million people joined the labour force, 14 million found employment; hence the number of unemployed increased by one million (to 10.6 million) again (Table 1).
Table 1: Size of Labour force, Workforce (by sectors), Unemployed and Employment Elasticity of output in India, 1994-2012
Work force, Labour force and Unemployed
Absolute Volume (in million)
Employment Elasticity of output
1993-94
1999-2000
2004-05
2009-10
2011-12
1999-00
2004-05
2009-10
2011-12
Tota
l em
ploy
men
t by
sect
ors Agriculture 241.5 246.6 268.6 244.9 231.9 0.12 1.09 -0.67 -0.53
Mfg 38.9 42.8 53.9 50.7 59.8 0.27 0.81 -0.17 1.35
Non-Mfg 15.8 20.4 29.4 48.3 55.3 0.74 1.03 1.26 1.07
Services 77.7 89.8 107.3 116.3 127.3 0.35 0.55 0.20 0.55
Total work force 374.0 399.5 459.1 460.2 474.2 0.20 0.53 0.01 0.21
Total Labour force 381.2 408.5 469.9 469.9 484.8
Unemployed (open) 7.2 9.0 10.8 9.6 10.6
LFPR Female (age 15 to 59) 45.2 41.7 45.4 34.5 33.1
LFPR Male(age 15 to 59) 88.0 86.6 87.1 83.7 82.7
Source: Authors’ estimates based on CSO and NSS unit level data Note: The numbers in the table are based on the principal + subsidiary status employment.
Structural shift in employment beginning 2004-5
Total employment increased by 25.5million between 1993-4 and 1999-2000 (a six-year period), of which 5.1million was in agriculture. Increasing employment in agriculture is the opposite of the structural shift envisaged by Arthur Lewis (Lewis, 1954) that normally should accompany economic growth. Over the five-year period 1999-2000,total employment increased byan unprecedented 60 million, but again 22 million of that increase was in agriculture – clearly a retrograde development, especially at a time when agricultural output was growingslowly. Therefore, employment growthin agriculture during the period 1999-2000 to 2004-05 is mainly distress driven. Workers are engaged in the agriculture either as self-employed or as casual labourers. And later on huge number of these categories of workers left agriculture and that is reflected through an absolute decline in agriculture employment during post 2004-05 periods.

4
During 2004-05 to 2009-10 growth rate of employment dropped severely to 0.05 percent with only a meager 1.1 million increase in the number of workers.Surprisingly, the size of labour force has also not grown during this period. This does not mean nobody has joined the labour force. But we know that very few numberof people have joined the labour force due to larger participation (both boys and girls)in education (see Table 8). And also large numbers of female workers have withdrawn from the labor force because of mechanization in agriculture.This is reflected in an absolute fall in jobs in agriculture,for the first time in India’s post-independence economic history, – as many as 23.7 million of India’s agricultural workforce abandoned agriculture, or nearly 10 per cent of the total workforce in agriculture (see Table 1). In fact, non-agricultural employment grew by 25 million over 2004-05 – 2009-10, which is how total employment grew only by 1.1 million. Non-agricultural employment since 2010 increased sharply; as a result total employment grew at 1.51 per cent during the period 2010-2012 – a27 million increase in absolute terms in non-agricultural employment, while at the same time the numbers in agriculture fell by 13 million in a matter of two years.
Table 2: Absolute Employment by Principal and Subsidiary Status, Sector wise, 2000 to 2012
1999-2000 2004-05 2009-10 2011-12 PS SS PS SS PS SS PS SS Agriculture 220.6 26.0 232.9 35.7 221.0 23.8 204.6 27.3 Mfg 39.9 2.8 49.1 4.7 47.6 3.2 54.7 5.0 Non-Mfg 20.1 0.2 28.9 0.5 45.8 2.5 51.5 3.7 Services 87.4 2.4 103.9 3.3 114.0 2.4 124.1 3.2 Total 368 31.4 414.8 44.2 428.4 31.9 434.9 39.2
Source: Authors’ estimates based on NSS unit level data
This increase in employment is also coupled with a structural shiftthat any developing economy desires – decline in the share of agriculture in output and employment over time, and corresponding rise in share of industry and services. About 37.5 million employment opportunities increased in the non-agricultural sector in the five-year period 1999-2000 to 2004-05 (Table 1). Since mid-decade the number of non-agricultural jobs rose by 52 million over the seven-year period 2004-05 to 2011-12. In other words non-agricultural jobs grew by 7.5 million per annum on average bothduring 1999-2000 to 2004-5, as well as between 2004-05 and 2011-12.In the recent two year period (2009-10 to 2011-12), employment in manufacturing and non-manufacturing taken together grew by 16.1 million in a matter of two years vis-a-vis an increment of 15.7 million over a five year period (during 2004-05 and 2009-10). The manufacturing sector alone has witnessed an increase in employment by 9 million during 2009-10 to 2011-12; the employment growth rate in this sector at 8.6 percent surpasses the employment growth rate in all other sectors. Employment in the service sector too has witnessed an overwhelming increase in these two years with 11 million more jobs

5
being created post 2009-10, much higher than the 9 million increaseduring the five years to 2009-10. The real question is: can the Indian economy’s expected growth be employment-intensive enough to generate employment in non-agriculture to absorb both those entering the labour force as well as those leaving agriculture for non-agricultural jobs?
The non-agricultural sectors are showing rapid growth in terms of employment generation, with a 27million increase in principal3 status during 2005-2010and another 23 million increase post 2010, in the next two years– which is consistent with regular employment and growing organized sector jobs(Table 3). Ghani et al (2011) show that there is growing sophistication of modern services, however it has more implications in terms of GDP rather than employment,since traditional services require more face-to-face delivery.Retail has evolved from its traditional mom-and-pop stores to e-retailing; financial services, courier services, tourism services, R&D services, and legal services have developed. Teledensity, which is an important indicatorof telecom penetration, increased from 18.2 per cent in March 2007 to 73.3 per cent as on 31 December 2012, with urban teledensity at 149.5 per cent and rural at 39.9 per cent (Economic Survey 2012-13), and hence has beenan important source of job growth.
Sub-Sectors driving employment trends
This shift in the employment structure in the economy is very significant with sharp changes within sub-sectors. The structural shift is well evident from the employment elasticity (Table 1) of output by major economic sectors.
Increase in non-agricultural employment is due to the expansion of labour intensive subsectors (see Table 3). Employment in construction sector increased by 8.5 million between 1999-2000 and 2004-05, but by over twice as much in the next five years (18.5 million); it increased by a further 6 million in two years (2009-10 to 2011-12). As we will discuss further in section 2, this has been a very important source driving up both wages/consumption, and thus the fall in poverty. It is construction sector employment that has attracted workers away from agriculture in such large numbers that employment in agriculture has been falling in absolute terms – a historically unprecedented development in India’s economic history.
Within the manufacturing sector, wearing apparel, textiles, furniture, non-metallic mineral products and wood products, mostly all labour-intensive sectors are the subsectors that really reflect the fluctuations in employment in this sector. However, even though value-added has grown in these sectors, in terms of share of output in these sectors in total manufacturing value-added, it has not grown much; in fact it is stagnant. This implies that it is the low-productivity small scale enterprises that are driving employment in these sectors. Small scale enterprises produce low end products which are consumed by the lower income
3Principal status work is defined as that which involves at least 182 days of work in the preceding 365 day period. Subsidiary status work is defined as that involving >30 days but < 182 days of work.

6
quintiles of the population. There is a remarkable change in the consumption basket with increasing share in clothing and bedding, footwear and miscellaneous (which includes education and medical care) among the 4 bottom fractiles in a total of 124.
Table 3: Absolute Employment and Change in Manufacturing, Non-manufacturing and Service sectors employment (PS+SS) in India, 2000-2012
Subsectors
Absolute volume of Employment (in million)
Absolute change in employment (in million)
1999-2000
2004-05
2009-10
2011-12
2000 -2005
2005 -2010
2010 -2012
Food products and beverages 5.8 5.5 5.5 6.4 -0.3 0 0.9 Tobacco products 4.4 4.7 4.1 4.9 0.3 -0.6 0.8 Textiles 7.6 9.7 8.4 9.2 2.1 -1.3 0.8 Wearing apparel 2.5 7.2 7.3 9.6 4.7 0.1 2.3 Leather products 1 1.3 0.9 1.3 0.3 -0.4 0.4 Wood and wood products 4.5 5.2 3.6 3.9 0.7 -1.6 0.3 Paper and printing etc. 1.2 1.5 1.6 1.1 0.3 0.1 -0.5 Rubber & petroleum products 1.1 0.9 0.8 1.3 -0.2 -0.1 0.5 Chemical products 1.7 2 1.7 2 0.3 -0.3 0.3 non-metallic mineral products 3.4 4.5 4.3 5 1.1 -0.2 0.7 Machinery and metal products 5.8 6 6.6 6.9 0.2 0.6 0.3 Transport Equipments 0.6 1 1.5 1.5 0.4 0.5 0 Furniture manufacturing 3.1 4.4 4.3 6.6 1.3 -0.1 2.3 Sub-total Manufacturing 42.8 53.9 50.7 59.8 11.1 -3.2 9.1 Mining & quarrying 2.2 2.6 3 2.6 0.4 0.4 -0.4 Electricity, gas & water supply 1.1 1.2 1.3 2.5 0.1 0.1 1.2 Construction 17.1 25.6 44.1 50.3 8.5 18.5 6.2 Sub-total Non-manufacturing 20.4 29.4 48.3 55.3 9 18.9 7 Trade 34.8 41.2 43.5 44.2 6.4 2.3 0.7 Hotels and restaurants 4.4 5.8 6.1 7.8 1.4 0.3 1.7 Transport & communication 14 17.6 20 22.9 3.6 2.4 2.9 Banking and insurance 2.1 2.9 3.8 4.3 0.8 0.9 0.5 Real estate, renting business 2.5 4.3 5.8 6.7 1.8 1.5 0.9 Public admin.&defence 9.9 8.3 9.5 7.9 -1.6 1.2 -1.6 Education 8.2 11.1 11.8 14.1 2.9 0.7 2.3 Health 2.7 3.5 3.6 4.4 0.8 0.1 0.8 Other Services 11.3 12.7 12.2 15.1 1.4 -0.5 2.9 Sub-total Services 89.8 107.3 116.3 127.3 17.5 9 11
Source: Authors’ estimates based on NSS unit level data
Every sub-sector within services has seen an increase in employment over the period 1999-2000 to 2011-12 (except public administration and defence). The services sector has
4For the 4 bottom fractiles, share of clothing increased from 17% in 2004-05 to 26% in 2011-12; footwear increased from 18% to 30%, medical expenditure increased from 27 to 33% in the above mentioned period in rural areas. In urban India too, share of clothing, footwear, medical expenditures have increased during this period.
7
emerged as a major contributor to economic growth since the mid-eighties, with its share in total GDP constantly increasing from 38 per cent in 1980–81 to nearly 58 per cent in 2011-12. The service sector is highly heterogeneous in terms of its range of services, the size of value added, capital investment, composition and level of employment.
The next section aims to explain the trends in employment and the structural transformation in more detail.
2.Jobs: who gained or lost?
This section is an attempt to explain the trends in employment from 1999-2000 to 2011-12in each of main economic sectors: agriculture, manufacturing, non-manufacturing and services. We begin by examining the gainers and losers – first by gender, then by type of employment (self-employed, casual workers and regular workers) and finally by organized versus unorganized segments. In the following section, we piece together the components of the analysis to present an overall picture of trends in each economic sector, as well as the underlying economic dynamics.
2.1 The gainers and losers: Men or Women?
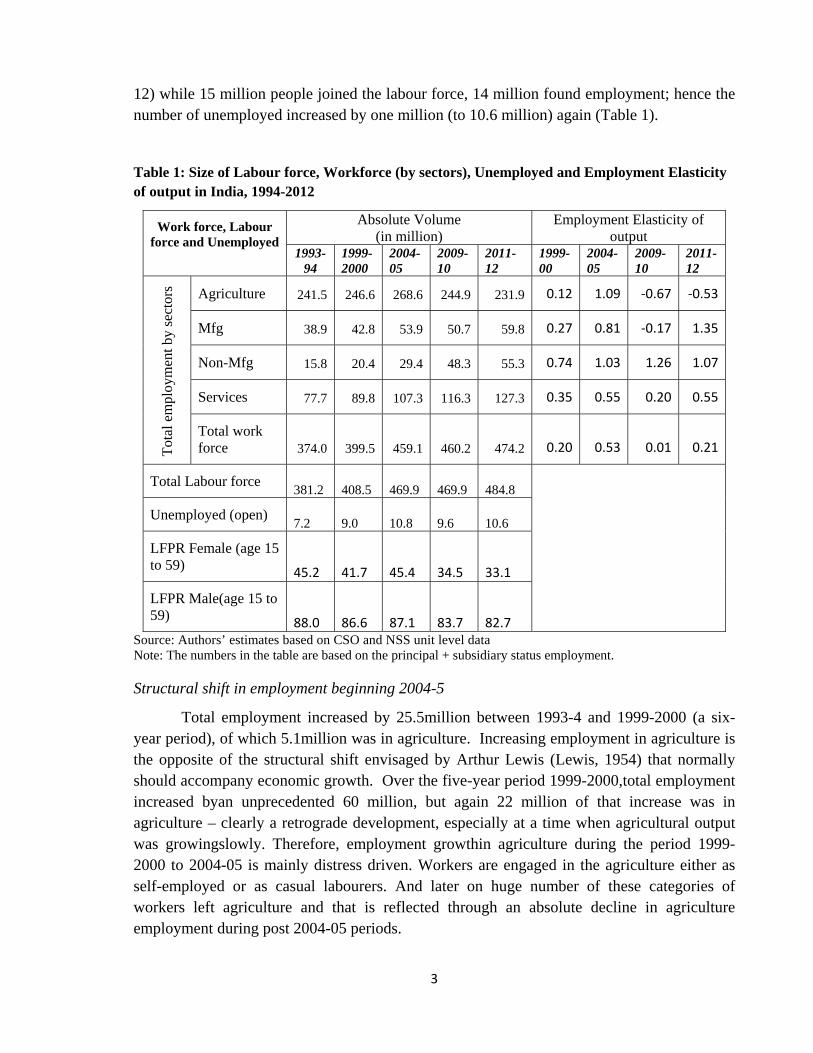
Figure 1:Absolute Changes in Employment by Gender (million)
Source: Authors’ estimates based on NSS, various rounds Note: PS=Principal status; SS= subsidiary status
India, like other South Asian countries5, has lowfemale labour force participation rate (LFPR). Since 2005 there had been a steep decline in the female labour force participation rates (age group 15 to 59), from 45.4 percent to 34.5 percent in 2009-10. This declining trend continued further to reach 33.1 percent in 2011-12. However, in the first part of the decade (the 2000s), employment of women rose significantly (see Figure 1) – 14 million on account 5The female LFPR is below 40 per cent in all countries in the region except inthe Maldives and Nepal.
31.523.5
12.4 13.9
-10.7-5.5
2.0
-1.2 -0.2
10.2
-10.7
7.3
-20.0
-10.0
0.0
10.0
20.0
30.0
40.0
2000-05 2005-10 2010-12 2000-05 2005-10 2010-12
Male Female
PS SS

8
of principal status and 10 million on subsidiary status. But the real issue is whether this increase was due to real new jobs or distress employment? It is rural women who accounted for 18 million of this increase. In fact, in the previous section we had noted that there was a 22 million increase in agricultural employment between 2000 and 2005 – the exact opposite of the Lewisian shift out of agriculture that one might expect as per capita income grows, most of whom were women.
In complete contrast to the first half of the decade, during 2005-2010 there was an absolute withdrawal of around 21 million women workers (19.8 million from rural areas), thus contributing significantly to the decline in the agricultural and the aggregate work force in the period 2005-2010. The fall in women workers in rural India continued even during 2010 to 20126. Various factors have contributed to this decline. From the demand side, there was shrinkage in labour demand mainly due to increasing rural wages, growing mechanisation in agriculture and high capital intensity in the manufacturing sector (Himanshu, 2011; Thomas, 2012; and World Bank, 2012). On the supply side, factors like attending educational institutions (Kannan and Raveendran, 2012; and Rangarajan et al., 2011; and Thomas, 2012) and increasing incomes are factors contributing to this decline.
Further, of the 60 million increase in employment in the first half of the decade (2000 to 2005), 46 million additional workers were employed for majority of the reference period. Of this 74 per cent (32 million) were male workers. In case of 12 million subsidiary status employment- females accounted for 10 million, thus working for a shorter duration. That is, in the 60 million increase in jobs during 2000-2005, male employment increased by 35 million, almost all due to increase in principal status employment; and female employment increased by 25 million, 40 per cent of which was due to increase in subsidiary status work. This reflects gender gaps in access to quality employment (longer term principal status employment). The resurgence of aggregate employment growth during 2009-10 to 2011-12 has notbeen translated into equal distribution of employment opportunities among men and women.
Who gained and lost jobs: the self-employed, regular or casual workers?
Increase in employment during the period 2000-2005 after stagnating during the late ninetieswas mainly in the rural sector where the slowdown had been sharper earlier. About 30 million rural workers (women comprising 60 percent of it) joined the workforce as self-employed in agriculture. Abraham (2008) has indicated this employment generation during 2000-2005 was distress-driven,suggested mainly by increased participation of women, aged population in the workforce (owing to declining earnings capacity of the usual income earners), andproductivity stagnation in the agriculture sector.
6The decline was among women who considered such rural unemployment as their principal work (while women’s engagement in subsidiary status employment rose i.e. on a part-time basis, or fewer number of days i.e. less than 180 days though more than 30 days in the year). Between 2005-10 women’s engagement in agricultural activity even as subsidiary work had fallen, but such work rose between 2009-10 and 2011-12.

9
Nevertheless, casual work for rural males boomed during 2004-05 and 2009-10, creating 16 million new jobs for them (see Table 4), clearly non-farm jobs, mainly driven by construction activities. Similarly urban females saw an increase in casual work, most of which would be in construction as we noted earlier.
Table 4: Sector-wise Employment by Sex and Type of Employment
Type of Employment
Absolute volume of employment (million) Rural Male Rural Female
1999-2000
2004-05
2009-10
2011-12
1999-2000
2004-05
2009-10
2011-12
Self-employed 109.4 127.6 123.9 127.8 60.8 79.1 58.2 60.3 Regular workers 17.6 19.7 19.8 23.6 3.3 4.6 4.6 5.7 Casual workers 72.2 72.2 88.1 83.3 42.0 40.5 41.7 35.8 Total 199.1 219.5 231.9 234.6 106.1 124.3 104.5 101.8 Urban Male Urban Female Self-employed 31.8 40.2 41.0 45.5 8.4 11.7 9.4 11.7 Regular workers 31.9 36.5 41.8 47.4 6.2 8.7 9.0 11.7 Casual workers 12.9 13.1 17.0 16.2 4.0 4.1 4.5 3.9 Total 76.6 89.8 99.8 109.2 18.5 24.5 22.8 27.3
Source: Authors’ estimates based on NSS various Rounds
As we noted earlier, employment in agriculture decreased by as much as 24 million during 2005 and 2010, and further by 13 million during 2010-12. The decline in agricultural employment during 2005-10 was guided by decline in self-employed workers (most because of withdrawal by almost 21 million rural self-employed females). This might have happened due to the nation-wide drought in 2009 that could have forced the self-employed, smallest and marginal farmers to migrate out for sustenance. Moreover, the presence of alternative employment opportunities in construction at relatively higher wages also induced a move out of agriculture, which shows itself in an increase in casual labour (see Table 4 and 5).
The rise in construction employment has resulted from largeprivate and public investments in infrastructure sector both in real estate, housing and development projects likeIndira AwaasYojana, PradhanMantri Gram SadakYojana andMahatma Gandhi National Rural Employment Guarantee Act (MGNREGA).
Around 10 million new workers found regular salaried employment in the non-agricultural sector during 2000 and 2005; and another 7 million did during 2005-10 (see Table 5). This trend has been rising since then with 12.8 million more workers getting regular wage/salaried employment during 2010 and 2012. Two-fifths (20 million) were regular workers in sectors like education, healthcare, communication, banking and insurance which certainly have played a contributing role within services, but manufacturing has also generated regular jobs.

10
Table 5: Employment and Change in Employment during the Decade, by Sector and Type of Employment (PS+SS)
Sectors Absolute volume of employment (million) 1999-2000 2004-05 2009-10 2011-12 SE RE CL SE RE CL SE RE CL SE RE CL
Agri 142.4 3.5 100.6 172.3 2.9 93.3 147.1 2.1 95.6 151 1.9 78.9 Mfg 22.2 13.0 7.6 28.6 15.9 9.3 24.6 16.4 9.8 29.3 20.5 9.9 Non-Mfg 3.2 2.6 14.5 4.8 3.0 21.6 5.3 4.1 38.9 5.7 5.3 44.3 Services 43.2 36.8 9.8 55.4 43.6 8.2 57.5 49.1 9.7 61.6 56.9 8.8 Total 211.1 55.9 132.5 261.2 65.4 132.5 234.6 71.7 153.9 247.7 84.7 141.9
Source: Authors’ estimates based on NSS various Rounds
Along with slowdown in employment growth, there had been a rising trend in casualisation during 2005 to 2010 observed particularly among rural men and women. This trend has reversed since 2009-10 with the decline of casual workers by about 12 million by 2011-12, mainly with declining agricultural employment. Most of the salaried, regular work in India is in urban areas (Table 4). The number of regular jobs has been rising through the 2000s and beyond. Men account for some 80 per cent of all regular workers. The fact that organized sector work has been rising throughout the period of rapid economic growth is also reflected in the continuous increase in regular work. Such work increased for urban males from 32 million by 2011-12. Even the number of urban females who had secured regular work doubled between 2000 and 2012 from 6.2 million to 11.7 million (Table 4).
Employment trends in manufacturing were cyclical in nature, with employment dropping as the global economic crisis began to have effect – a rise in the first half of the decade to reach 53.9million in 2005, a fall by 3 million during 2005 to 2010 and then showing a recovery to reach 59.8 million in just two years by 2011-12. The fluctuation has been driven to a large extent by trends in the self-employed and regular work in manufacturing (Table5). Since 2005 when employment in manufacturing declined, the fall was seen mainly among self-employed women within manufacturing activities,at the bottom of the production chain, typically in low productivity and low paid work that usually reflects the absence of other viable income earning opportunities. It is also a reflection of the fact that unorganized segment employment fell during 2005-2012 in manufacturing.
Who gained or lost jobs:organized or unorganized segment enterprises?
The key driver of the increase in employment during 2000 to 2005 had been the unorganized sectorenterprises (as per NCEUS definition7). Of the 60 million new jobs generated during that period, 52 million were created in the unorganized segment of enterprises (Mehrotra et al 2013). Agriculture accounted for nearly 40 per cent of this increase, since 22 million people joined agriculture.
7“The informal sector consists of all unincorporated private enterprises owned by individuals or households engaged in the sale and production of goods and services operated on a proprietary or partnership basis and with less than ten total workers”
11
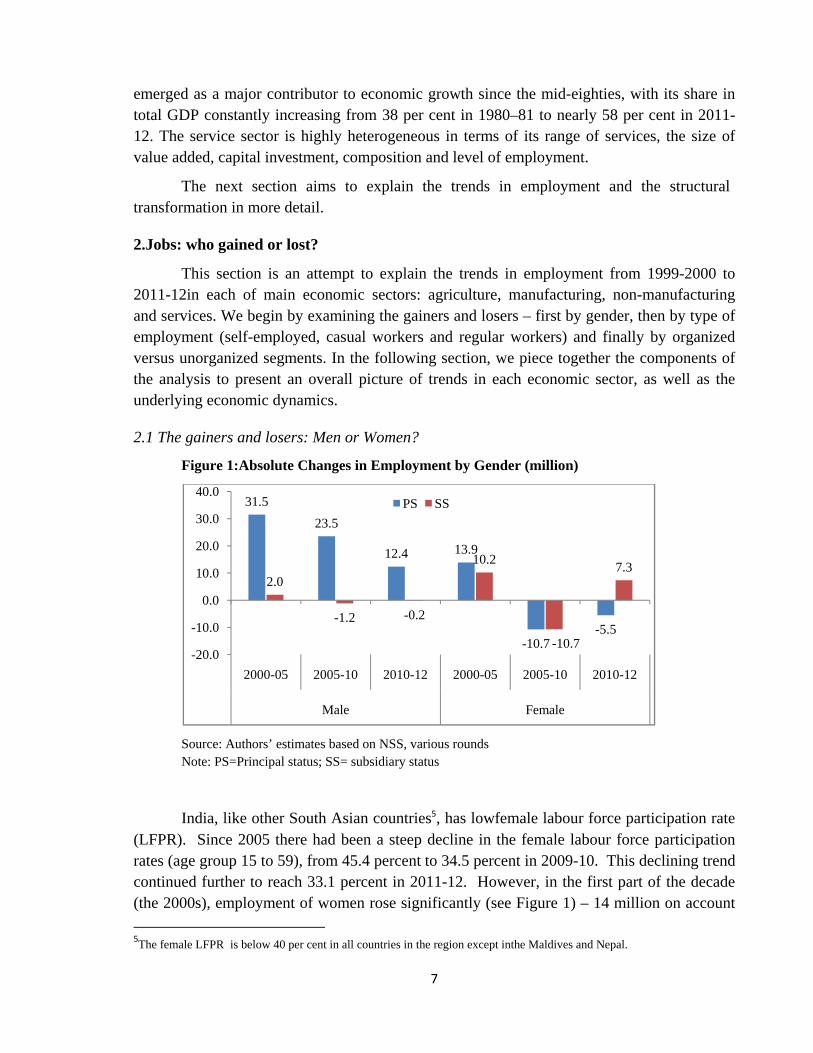
Table 6: Sector-wise distribution of workers by organised-unorganisedenterprises and formal-informal employment, 2004-2012 (% figures in parentheses)
Sectors Organized Unorganized Total Formal Informal Formal Informal Formal Informal
2004-05
Agriculture 0.2
(5.3) 4.1
(94.7) 0.1
(0.03) 264.2 (99.9)
0.3 (0.12)
268.2 (99.9)
Manufacturing 5.0 (32.9)
10.3 (67.09)
0.6 (1.43)
38.0 (98.6)
5.6 (10.4)
48.3 (89.6)
Non- manufacturing
2.0 (21.4)
7.2 (78.56)
0.1 (0.72)
20.1 (99.28)
2.1 (7.19)
27.3 (92.8)
Services 19.5 (66.2)
10.0 (33.79)
1.1 (1.37)
76.8 (98.63)
20.6 (19.2)
86.7 (80.8)
Total 26.7 (45.9)
31.5 (54.1)
1.9 (0.5)
399.0 (99.5)
28.6 (6.2)
430.5 (93.8)
2009-10
Agriculture 0.3 (2.6)
13.0 (97.5)
0.1 (0.03)
231.5 (99.97)
0.4 (0.2)
244.5 (99.8)
Manufacturing 5.3 (32.5)
11.1 (67.6)
0.4 (1.2)
33.9 (98.8)
5.7 (11.3)
45.0 (88.7)
Non- manufacturing
2.5 (13.6)
15.8 (86.4)
0.4 (1.4)
29.6 (98.7)
2.9 (6.0)
45.4 (94.0)
Services 22.7 (62.7)
13.5 (37.3)
1.4 (1.7)
78.7 (98.3)
24.1 (20.7)
92.2 (79.3)
Total 30.9 (36.6)
53.5 (63.4)
2.3 (0.6)
373.7 (99.4)
33.1 (7.2)
427.1 (92.8)
2011-12
Agriculture 0.5 (3.0)
17.7 (97.0)
0.1 (0.03)
213.6 (99.97)
0.6 (0.03)
231.3 (99.97)
Manufacturing 6.1 (29.7)
14.6 (70.3)
0.4 (0.9)
38.7 (99.1)
6.5 (10.9)
53.3 (89.1)
Non- manufacturing
2.7 (11.9)
19.7 (88.1)
0.3 (0.8)
32.7 (99.2)
2.9 (5.3)
52.3 (94.7)
Services 24.2 (60.0)
16.1 (40.0)
1.2 (1.4)
85.8 (98.6)
25.4 (19.9)
101.9 (80.1)
Total 33.5 (33.0)
68.1 (67.0)
1.9 (0.5)
370.8 (99.5)
35.4 (7.5)
438.9 (92.5)
Source: Authors’ estimates based on NSS various Rounds
The unorganized manufacturing sector added 9 million jobs during the periodfrom 1999-2000 to 2004-05 (Mehrotra et al 2012). The unorganized services sector also created 16 million jobs between 2000 and 2005, which drove employment increase in the first half of the decade. The major sub-sectors within unorganized services which accounted for the increase were wholesale and retail trade (7 million) and transport and communication (3.6 million). Unorganized segments of real estate and business activities as well as hotels and restaurants also added 2.5 million jobs. Such increases in unorganized sectors also reflect the rising numbers of those engaged as self-employed. Within non-manufacturing, unorganized construction accounted for an increase of 6.7 million workers. In organized services, 2 million increasein education sector is also noteworthy.This is primarily contributed by the SarvaShikshaAbhiyan of the Government of India.

12
Between 2004-05 and 2009-10 while organized sector employment increased by 16 million in non-manufacturing and services sector taken together, there was an absolute decline by 25 million in unorganized sector employment. Since agriculture sector is almost entirely unorganized, fall in employment in the unorganized sector in the economyis largely attributed to reduction in employment in the agriculture sector (Mehrotra et al 2013).
In 2011-12, employment in the unorganized sector accounted for 78 percent of all employment(see Table 6). This is a 10 percentage pointfall since 1999-2000. Apart from regular employment in manufacturing and services, it is remarkable that even construction saw a sharp rise in organized segment employment, given theincrease in infrastructure (airports, national highways) investment by the public as well as private sector.
What type of employment was generated:Formal or informal?
Total organized segment employment in services increased between 2004-05 and 2011-12 by one-third (from 30 to 40 million). Unorganized segment jobs also grew, but only by about 12 percent over the same period. This is the reason that the share of organized segment employment has fallen to 78 per cent from 88 per cent of total employment in the economy (including agriculture) over the period.
Though there had been increase in employment opportunities in the organized sector, it is mainly the informal8 workerswhich have increased during 2010 to 2012. The share of informal employment in total organized sector employment has, in fact, been increasing over the years(Table 6). It has risen from 32 per cent in 1999-2000 to 54 per cent in 2004-05 to 67 per cent in 2011-12.
Workers are more vulnerable in the unorganized sector with more probability of retrenchment. Since employment generation in the organized segments of non-agriculture is largely among informal workers, there is a higher probability that with slightest economic shock, there would be a fall in employment. Services sector which shows increase in employment since 2004-05 is also witness to growing informalization within the sector.
Size class of enterprises by number of workers: the nearly missing middle
The distribution of workers by the size class of enterprises shows that it is highly skewed towards micro and small enterprises (enterprises with employment size less than 10 workers). Post 2010, out of total 27.1 million increase in non-agricultural employment, there had been 24 million increase in employment in the micro and small enterprises(Table 7). Further, micro enterprise (employing less than 6 workers) alonehad contributed a huge (17 million) chunk of this increase in employment. About 70 per cent (almost constant since 2004-05) of the total non-agriculture workers are employed by the micro and small enterprises, of which about 58 percentage are employed by micro enterprises in 2011-12 (see Table 7).There is, however, a miniscule middle (medium size enterprises that employed 10 and more but less than 20 workers), whose share is increasing but at a very slow pace (from 8Workers do not enjoying any social security benefits

13
6.4 to 7.8 per cent during 2005 to 1012). In absolute terms, there had been an increase in employmentby 2 million during 2005-10 and 4.7 million during 2010-12 in medium size enterprises. The share of employment in the enterprises that employed more than 20 workers, however, increased from 15.4 per cent to 17.1 percent (8.5 million) during 2010-12.
Table 7: Number of workers by size of enterprise in Industry and services sectors in India
Size class of enterprises
2004-05 2009-10 2011-12
No. of workers (mn)
share in %
No. of workers (mn)
share in %
No. of workers (mn)
share in %
less than 6 119.1 63.8 121.7 57.6 138.6 57.7 6 and above but less than 10 14.4 7.7 21.6 10.2 28.5 11.9
10 and above but less than 20 11.9 6.4 13.9 6.6 18.6 7.8
20 and above 25.1 13.5 32.6 15.4 41.1 17.1 Not known 16.2 8.7 21.6 10.2 13.3 5.5 Total 186.7 100 211.4 100 240.1 100
Source: Authors’ estimate based on National Sample Surveys, various rounds.
There are people moving out of low-productivity agricultural sector. To reap the benefits of this structural shift it is essential that this ‘missing middle’ is begun to be filled. The National Manufacturing Policy 2011 seeks to increase the share of manufacturing in GDP to 25% within a decade and create 100 million jobs by 2025. This would be possible if, along with other measures, this missing middle is addressed. Further, the productivity (and wage) gap between the two extreme size groups is much larger in India than in other Asian economies. A policy that raises the manufacturing sector’s share in GDP by eliminating the policy constraints that have limited it is needed. This kind of bi-modal distribution increases wage inequality which can then impede the growth of skilled labour, entrepreneurship, and allocative efficiency which in turn can affect growth.
3. Towards an Understanding of Employment trends since 1993-94
In the previous section we have tried to understand trends by examining the data from different aspects, to determine who gained/lost in terms of employment generation. In this section we delve into the underlying trends in the economy and society that drove these trends, demographic, education and other social forces, and the economic forces that were impacting the primary, secondary and tertiary sectors.

14
Demographic Reasons
There were also demographic factors that underlie the differing trends in employment in the first half compared to the second half of the 2000s. Fewer people joined the labour force in the second half of the decade compared to the first half. Workforce in the age cohort below 15 and between 15 and 24 is decreasing consistently. Fewer people were available to join the workforce due to rising enrolments in school and continuing into education. That is, while in 2004-05, 208 million children in the relevant age group (less than 15 years) were attending educational institutions and therefore were not part of labour force, the number stood at 238 million in 2011-12 (See Panel B, Table 8). This figure increased significantly for the youth (15 to 24 years), where 60 million were in educational institutions and therefore out of the labour force, but in 2011-12, it increased to 97 million. For women increase was significant for both - children and the youth.
Table 8: Relationship between Demographic Trends, the Workforce and Participation in Educational Institutions
A. Size of Work Force by age Cohort Age groups 1993-94 1999-00 2004-05 2009-10 2011-12 below 15 13.3 10.6 8.5 5.0 3.7 15 to 24 83.8 82.9 95.0 79.2 76.5 25-59 251.6 279.0 324.7 341.4 356.9 60 & above 25.3 27.0 30.9 34.6 37.1 All ages 374.0 399.5 459.1 460.2 474.2 B. Attending Educational Institutions – Male and Female Age groups 1993-94 1999-00 2004-05 2009-10 2011-12 below 15 144.9 180.6 208.2 225.7 238.3 15 to 24 37.5 47.2 55.9 84.6 97.0 25-59 0.8 1.0 1.0 1.7 2.2 60 & above 0.1 0.1 0.1 0.2 0.1 All ages 183.3 228.8 265.1 312.1 337.5 C. Attending Educational Institutions, Female Age groups 1993-94 1999-00 2004-05 2009-10 2011-12 below 15 61.0 79.4 94.8 101.9 109.4 15 to 24 12.7 17.6 22.1 34.0 40.0 25-59 0.2 0.3 0.3 0.7 0.7 60 & above 0.1 0.1 0.0 0.0 0.0 All ages 74.0 97.3 117.3 136.5 150.2
Source: Authors’ estimates based on NSS unit level data

15
Women joining and then withdrawing from the labour force: a major contributor to employment trends
As mentioned earlier, some 24million women joined the labour force, particularly in rural areas, between 1999-2000 and 2004-5. This rise in female employment was distress-driven (Abraham, 2008). The distress partly showed itself in growing farmer suicides (Gill and Singh, 2006; Jeromi, 2007; and Shroff and Mitra, 2007) during that period. Due to lack of alternate employment opportunities a large number of women joined the workforce asreserve family labour. Most of them found work as self-employed in agriculture. However, between 2005 and2012 there was a sharp decline in female employment, particularly for rural females. There are important reasons for the decline in female labour force participation rates between 2005 and 2010.
First is education. There had been a significant increase in enrolment, higher for girls both in the age-groupbelow 15 years, as well as 15-19 years. There was a similar increase from 20 to 24 year children: from 14.9 per cent for boys and 7.6 per cent for girls in 2004-05 to 22.5 and 12.8 per cent in 2009-10 (as noted in the Approach Paper to the 12th Plan,Planning Commission, 2012).Panel C, Table 8 reinforces the argument showing the increasing number of women attending educational institutions and therefore out of the labour force.
Second, the incidence of childlabour fell consistently from 13.3million in 1993-94 3.7 million in 2011-12.
Third, there was a withdrawal of over 25 year olds from the labour force, which resulted from a growth in mechanisation in agriculture(Himanshu, 2011). This mechanization, which was quite normal in relatively more developed states in south, west and northern states of Punjab and Haryana till now, spread to other northern and eastern states of UP, Bihar, Jharkhand, Chhattisgarh and West Bengal as well.
A fourth reason for the decline in female LFPR was that, with older girls going to school (they were earlier responsible for the care of younger siblings) and increased male out-migration from rural areas, adult women face a serious time constraint forcing them to withdraw from the workforce.
A final reason for a continuation in the fall of female LFPR is a decline in household level dairying. Fewer households with small marginal farms have grazing land; women earlier undertook dairying, now less so (which affects subsidiary status employment). Common property resources also fell, and as most of the small household level dairying was carried out by women, it has systematically declined and thus led to a fall in such subsidiary status work by women9.
9The total number of dairy cattle was rising in India, but fewer small/marginal farmers could keep cattle (except for home consumption of dairy products).

16
Agriculture: a Lewisian structural change is occurring
A set of push and pull factors caused this Lewisian structural change in India. The rural distress caused by lower agricultural growth and constant low wages during 2004-5 and growing mechanization in agriculture post 2004-05 periods are supposed to be the major push factors driving people out of agriculture. On the other hand, rising demand for labour in the construction sectors with relatively higher wagespulled a huge segment of worker from agriculture.
The rise in the number of workers in agriculture during 2004-05 led to a stagnation of rural wages. However, the second half of the decade saw a remarkable and historic shift in rural wages.The rural wages begun to rise since 2006-07 (see figure 2).This rise in wages would be partly due to the spillover effect of MGNREGA, on the one hand, and shortage of labourpartlydue to higher participation in education (Thomas, 2012), that forced the farmers to start using machines10. This mechanisation in agriculture caused a further decline in agricultural workforce during 2010 to 2012 as well. This might be an important push factor explaining the absolute fall in agricultural employment post-2005 – a trend that had never before been seen in India’s post-independence history.
Figure 2: Trends of Real wage rates (at 2001-02 prices) in Rural and Urban India, 1994-2012
Source: Authors’ estimates based on NSS unit level data, various rounds
Mechanization in agriculture was itself the knock-on effect of farm wages rising after MGNREGA was introduced in 2006. Rural wages were stagnant before MGNREGA was launched. MGNREGA not only raised wages in public works, but it offered an alternative to working on the landlord’s farm for landless labourers for the first time in India’s history on a scale not quite observed before. There had been public work-related employment since the early 1970s for over a 40-year period in India, but the number of person-days of work generated under MGNREGA was much higher than ever before (Mehrotra, 2008). The
10Wages also rose because the Government of India raised the minimum support prices of cereals (rice and wheat) purchased by the Food Corporation of India from farmers.
22.4550.83 59.38 64.62 70.24 86.0779.45
132.74 141.90164.10
181.19 193.35
0.00
50.00
100.00
150.00
200.00
250.00
1993-94 1999-00 2004-05 2007-08 2009-10 2011-12
Rural wage Urban Wage

17
additional work available within the village also had the effect of shifting the labour supply curve to the left, locally but also in areas where surplus labourwould hitherto migrate in search of work.Labour contractors highlight that a combination of improved governance and a sharp pick-up in GDP growth in traditional labour-supplier states such as Bihar and Chhattisgarh has resulted in increased demand for labour in these states, leading to a decline in labour availability in states such as Maharashtra, Karnataka and Punjab, which have historically relied on labour-supplier states for their requirements (Mukherjee, 2013).
As wages rose there has been a steep reduction in poverty rate in India, more remarkable in rural areas. The percentage of rural persons below the poverty line as estimated by the Planning Commission had fallen to 25.7% in 2011-12 as against 41.8% in 2004-05. As per NSS11 the share of food expenditure (in both rural and urban areas) is declining, whereas the share of non-food expenditure is increasing at a much faster rate recently. Increase in real wages in rural areas is related to the new surge in consumption whichincludes products such as processed foods and beverages, clothing, bedding, durable goods, mobiles, as well as education and health. In rural areas, the share of expenditure on processed foods and beverages increased from 4.5% to 5.8%,on clothing and bedding increased from 4.5% to 6.3%, on durable goods increased from 3.4% to 6.1% and on footwear also increased form 0.8% to 1.3% during 2005-2012.
In the period of high economic growth, salaries in urban India increased steadily, because of the sixth Pay Commission, which has also a knock-on effect on private sector wages, particularly in the upper quintile of the wage distribution. This is reflected by the high rise in wages among professionals,personnel in administration and also among plant and machine operators (see Table 11). In urban areas, the share of expenditure on processed foods and beverages increased form 6.2% to 7.1%, on clothing and bedding increased form 4% to 5.3%, on durable goods increased form 4.1% to 6.3% and on footwear also increased form 0.7% to 1.2% during 2005-2012.
The rise of employment in construction
Yet another factor was driving labour out of agriculture – the growing demand for labour in construction activity from both rural and urban areas. Construction sector’s demand for labour was driven by real estate investments, and also by the $ 500 billion of investment in infrastructure during the 11th Plan period 2007-12, which raised this investment’s share in GDP from 4 percent to 7 percent. What is equally heartening is that infrastructure investment is scheduled to rise during the 12th Five Year Plan period (2012-17) to $ 1 trillion, raising its share in GDP to 9-10 percent by the end of the 12th Plan. In other words, employment in construction, which had doubled from its 2004-5 level of 25 million to 50 million in 2011-12, is likely to go on increasing over the next five years as well.
11 See NSS KI(68/1.0): Key Indicators of Household Consumer Expenditure in India (Page no. 20)

18
While most of the employment in the housing/real estate business has been unorganized (though of course all big builders/developers will have a regular workforce as well), large infrastructure related projects generated organised segment jobs along with sub-contracted work to smaller players who are usually unorganized segment operators.
Manufacturing employment: an outcome of exports, import-intensity and wages.
Employment in manufacturing increased by 11 million during 2000 to 2005 (from 44 to 55 million) and then declined by 3 million in the next five years. It made a significant recovery between 2010 and 2012 to reach 59.8 million with an increase of 9 million in two years. However, the point remains that manufacturing employment has increased slowly. We now explore the reasons for the trend.
Rising import-intensity of manufacturing output; rising wages and to some extent falling demand for manufacturing exportsduring 2007 to 2009 explains decline in manufacturing employment during 2005-2010, with the firsttwo raising capital intensity.
There was a sharp decline in merchandise exports, particularly labour intensive manufacturing exportsof India during 2007 to 2009 (Part A and B, Figure 3).The Economic Survey 2012-13 also points to this fact that the drastic fall in the share of manufacturing exports is mainly due to the fall in the shares of traditional items like textiles, leather and gems and jewelry which are labour-intensive activities. To sustain the improvement of 9 million workers in the manufacturing sector that occurred over 2009-10 to 2011-12, it is essential that domestic production as well as exports need to be improved in traditional sectors. The RBI’s Annual Report (2011-12) mentions that capital goods production also contracted sharply and this was partly on account of substitution by imported capital goods (especially from China). Hence, investment decelerated faster than other components of domestic demand.
Post-crisis in 2008, a recovery in manufacturing employment was experienced with 9.1 million increase in absolute terms. This is partly explained by the rise in exports of commodities, particularly labour intensive manufacturing goods; exports of food and beverages, wearing apparel, textiles increased significantly. It shot up after the global downturn. This then raised demand for such goods, thereby increasing their production, which then increased employment in these sectors.

19
Figure 3: Trends of Merchandise Exports of India, 1996-2013
Part A: Total Commodity Exports from India, 1996-2013 ($ million)
Part B: Exports of selected labour intensive manufacturing goods from India, 1996-2013 ($ million)
Source: Compiled from UN-Comrade database
However, there are two other structural trends in place that explain falling employment in manufacturing in the second half of the 2005.
Rising import-intensity of manufacturing:
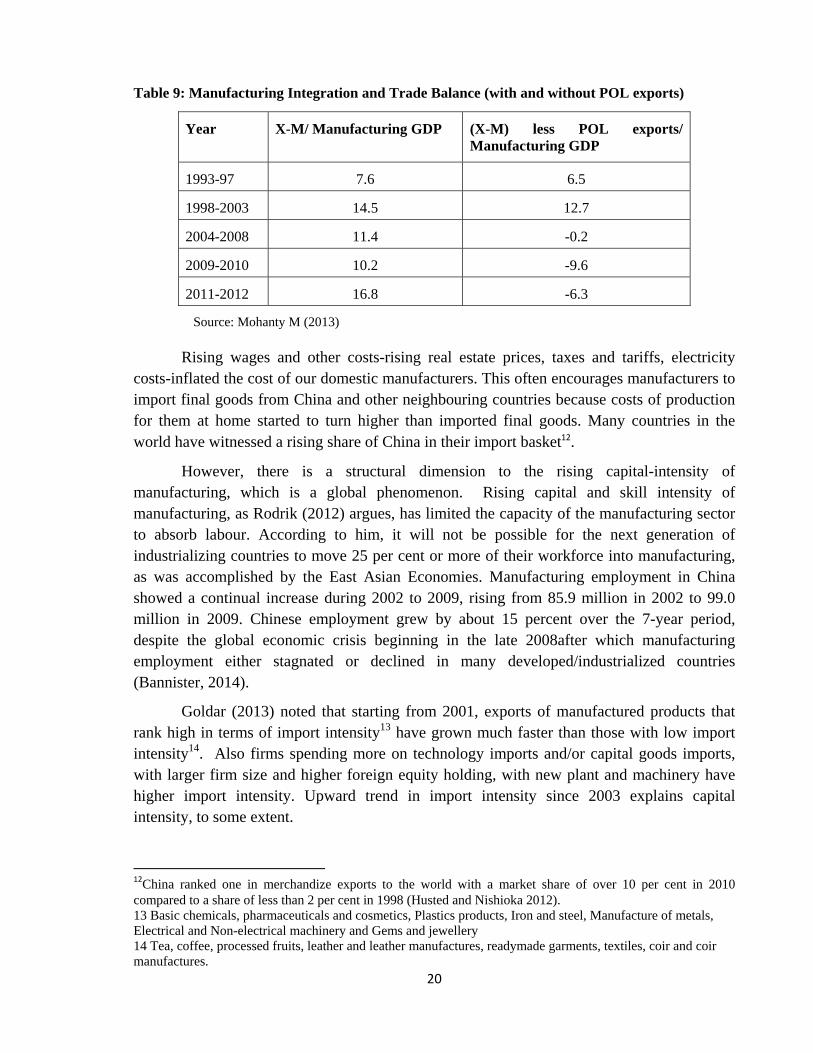
One of the structural trends visible in the manufacturing sector is the rising import ratio in output. The manufacturing sector is intrinsically integrated into the global economy with an average trade ratio for the period 2008/9 to 2010/11 of 180 percent. This is a huge increment from 92 percent in 1994/95. The integration is, however, asymmetric with import penetration almost doubling whereas exports increased by only 20 percent (Mohanty, 2013). If Petroleum, Oil and Lubricants (POL) exports are excluded, the ratio which was actually showing a trade surplus till 2003 turns into a deficit post 2003/04 (Table 9). Non-oil trade deficit increased sharply in the slowdown. Further, in the period of the slowdown, import competition has displaced domestic production to a huge extent (Mohanty 2013).
33468.6
181860.9176765.0
336611.4
0.0
100000.0
200000.0
300000.0
400000.0
1996
1997
1998
1999
2000
2001
2002
2003
2004
2005
2006
2007
2008
2009
2010
2011
2012
2013
total comodity export
0.0
10000.0
20000.0
30000.0
40000.0
1996
1997
1998
1999
2000
2001
2002
2003
2004
2005
2006
2007
2008
2009
2010
2011
2012
2013
Food and Bevarages leather and fotwear Textiles Apparel
20
Table 9: Manufacturing Integration and Trade Balance (with and without POL exports)
Year X-M/ Manufacturing GDP (X-M) less POL exports/ Manufacturing GDP
1993-97 7.6 6.5
1998-2003 14.5 12.7
2004-2008 11.4 -0.2
2009-2010 10.2 -9.6
2011-2012 16.8 -6.3
Source: Mohanty M (2013)
Rising wages and other costs-rising real estate prices, taxes and tariffs, electricity costs-inflated the cost of our domestic manufacturers. This often encourages manufacturers to import final goods from China and other neighbouring countries because costs of production for them at home started to turn higher than imported final goods. Many countries in the world have witnessed a rising share of China in their import basket12.
However, there is a structural dimension to the rising capital-intensity of manufacturing, which is a global phenomenon. Rising capital and skill intensity of manufacturing, as Rodrik (2012) argues, has limited the capacity of the manufacturing sector to absorb labour. According to him, it will not be possible for the next generation of industrializing countries to move 25 per cent or more of their workforce into manufacturing, as was accomplished by the East Asian Economies. Manufacturing employment in China showed a continual increase during 2002 to 2009, rising from 85.9 million in 2002 to 99.0 million in 2009. Chinese employment grew by about 15 percent over the 7-year period, despite the global economic crisis beginning in the late 2008after which manufacturing employment either stagnated or declined in many developed/industrialized countries (Bannister, 2014).
Goldar (2013) noted that starting from 2001, exports of manufactured products that rank high in terms of import intensity13 have grown much faster than those with low import intensity14. Also firms spending more on technology imports and/or capital goods imports, with larger firm size and higher foreign equity holding, with new plant and machinery have higher import intensity. Upward trend in import intensity since 2003 explains capital intensity, to some extent.
12China ranked one in merchandize exports to the world with a market share of over 10 per cent in 2010 compared to a share of less than 2 per cent in 1998 (Husted and Nishioka 2012). 13 Basic chemicals, pharmaceuticals and cosmetics, Plastics products, Iron and steel, Manufacture of metals, Electrical and Non-electrical machinery and Gems and jewellery 14 Tea, coffee, processed fruits, leather and leather manufactures, readymade garments, textiles, coir and coir manufactures.

21
In India, asobserved from the Annual Survey of India (ASI) data on organized manufacturing,labour to capital ratio has declined from 0.179 in 2001-02 to 0.165 in 2004-05 and further to 0.087 in 2009-10 and even further to 0.0789 in 2011-12(Table10). The pace of decline accentuated in the second half of the decade. Also, for manufacturing as a whole as well as for most of the sub-sectors, capital-output ratio declined in the first half of the decade, while it rose during 2005-10 according to ASI data.
Table 10: Capital Intensity of Output in Organized Manufacturing
Manufacturing 2001-2 2004-5 2009-10 2010-11 Labour to Capital ratio 0.179 0.165 0.087 0.0789 Capital-output ratio 0.449 0.307 0.362 0.344
Source: Authors’estimates based on Annual Survey of Industries, various years
Rising wages have raised capital intensity of manufacturing:
Rising capital intensity of output was often cited as being driven by rising real and nominal wages in the second half of the decade. The increase of wages at the lower quintile has two-fold effects: first, the price effect and secondly, the volume effect. The price of labour was ratcheted up in the open market in rural areas leading to increase in the labour cost of production in manufacturing sector. The landless labour that would otherwise migrate to richer rural areas (e.g. Punjab, Haryana, Tamil Nadu) or to urban areas were encouraged to stay and work locally in MGNREGA. This results a shrink in the volume of the unskilled labour available for the manufacturing sector. This combination of the price and quantity (of labour) effect in the labour market combined to raise the capital intensity in manufacturing sector.
While this was the situation for workers at the lower end of the wage and skill distribution, a similar development was occurring at the higher end of the salary/skill distribution. During the 1990s the growth rate of the economy had been 6.4 and had not moved up very much until 2002-3. However, between 2003-4 and 2010-11 GDP growth increased to 8.4 percent per annum. Since it was both industrial (manufacturing and non-manufacturing) and services growth that was driving the GDP (at a time when agriculture also began growing faster than in the period 1995-96 to 2003-4), skill shortages emerged at the higher end of the salary/skill distribution as well. Skilled and highly skilled engineers, managers and IT professionals began commanding higher salaries, with job attrition increasing.
These two dual sets of forces that were driving wages for the unskilled as well as salaries for the skilled/highly skilled also were factors driving greater capital-intensity in goods and services production.

22
Table 11: Trends of Rural and Urban Real wages by Occupation in India, 1994-2012
Occupations
Real Daily wage rates (in 2001-02 prices) 1993-
94 1999-
00 2004-
05 2007-
08 2009-
10 2011-
12 Rural Areas
Professional and admin 91.62 167.81 193.95 182.63 211.42 227.34Clerical jobs 99.73 142.11 158.10 173.29 198.36 191.36Sales and services 16.91 70.32 69.25 87.93 102.51 107.18Agriculture and Allied 15.08 34.14 39.79 51.10 56.44 73.11Crafts and trade workers 24.26 54.47 56.69 79.84 79.51 92.31Plant and machine operators 43.26 85.06 92.25 97.99 96.78 107.39Total 22.45 50.83 59.38 64.62 70.24 86.07
Urban Areas Professional and admin 154.90 277.17 317.26 365.04 377.14 390.57Clerical jobs 148.53 186.93 210.34 217.96 245.71 240.08Sales and services 42.22 90.96 88.58 115.42 129.26 135.94Agriculture and Allied 24.07 55.91 50.24 92.57 126.39 110.30Crafts and trade workers 54.13 89.09 85.42 107.19 111.35 121.72Plant and machine operators 81.59 112.21 115.58 133.07 148.54 149.23Total 79.45 132.74 141.90 164.10 181.19 193.35
Source: Authors’ estimate based on National Sample Surveys, various rounds.
Why non-agricultural employment has risen rapidly between 2009-10 and 2011-12?
After 2004-05 the domestic demand for a number of consumer goods has grown sharply. This is reflected in the rise in consumption expenditure in 2009-10 compared to 2004-5, which further rose in the two years to 2011-12. This rise of consumption expenditure has resulted in a decline in the numbers of the poor from 407 million (Tendulkar line, MRP) in 2004-5 to 356 million in 2009-10, and further to 269 million (2011-12). The decline in poverty and rise in consumption was an outcome of the rise in real wages. This rise in real wages caused a behavioral change in the households’ consumption expenditure following Engel’s law. As a resultthe demand for non-food consumer goods increased during 2010 -12.
This rise in consumption expenditure is reflected in rising output and employment in the following manufacturing sectors: food processing (for example biscuits, milk); leather goods (shoes and sandals); furniture (plastic chairs/tables, simple wooden furniture); textiles; and garments and apparel. The newly non-poor are also likely to buy mobile telephones, and as a result telecom services have seen a rise in value added. All these product areas and services have seen a dramatic increase in employment in the two years since 2009-10. We have already noted in the previous section that it was micro-enterprises that are driving the job creation. In other worlds, it is the very workers who are getting jobs who are providing the new demand for the products of these tiny enterprises, just as the new non-poor (the 138
23
million who emerged out of poverty between 2004-5 and 2011-12).However, the increase in employment particularly in theseunorganised sectors is not commensurate with output generation leading to low labour productivity in these sectors. This needs further attention for sustainability of employment in these sectors.
However, there is an inverse relationship (also see Mehrotra et al, 2012) between employment generation and gross value added of firms. The unorganized manufacturing sector absorbs a whopping 65 percent of employment, whereas the unregistered manufacturing (almost equivalent to the unorganized one) generates only 33 percent of total output15of the manufacturing sector in 2011-12. As a result thelabour productivity in unorganized manufacturing sector is very low.
It so happens that it is the smallest non-agricultural enterprises that contributed the most to employment growth between 2009-10 and 2011-12. As Table 7 shows, total non-agricultural employment grew by 27 million in that two-year period. Of that increase as much as 24 million was accounted for by firms that employed less than 10 workers. In fact, 17 of the 24 million jobs created were in enterprises that employed less than 6 workers.
Service sector employment has increased by about 1.8 million per annum during 2005 to 2010. Whereas post 2010, in the next two years, it increased by 5.5 million per annum. The increase in employment prior to 2010 was primarily in traditional services like trade, transport and communications, real estate education and public administration. Post 2010, there is further momentum in communications, real estate, education and other services. Huge increasein public and private investment in infrastructure and telecom sectors, initiatives like SarvaShikshaAbhiyanand Right to Education are responsible for the rise in service sector employment. This rise in employment got further boost with the emergence of newer forms of services likee-retailing, financial services,mobile phone revolution, courier, tourism, R&D, and legal services.
4. Policy implications: Sustaining the Lewis-ian transition of workers into non-agricultural employment
The increase in the labour force was 7.5 million per annum over 2009-10 and 2011-12, much lower than the 12 million that joined the labour force between 1999-2000 and 2004-5. We had noted that there had been a sharp decline in labour force increase (barely 2 million) over 2004-5 to 2009-10 because the numbers of children and youth in education rose very significantly over that period. The important point is that such youth had already begun entering the labour force by 2009-10 – hence, the rise to 7.5 million per annum in the labour force by 2011-12.
We estimate that given current level of education and age-specific labour force participation rates (separately for male and female) that have prevailed in the recent past, we expect the number of youths that will join the labour force will raise the male labour force by 15See National Account Statistics report (2014) of the Central Statistical Organization (CSO)
24
nearly 40 million over the next five years (2012-17), and the female labour force by 11 million16(in other words, a total of 51 million). In other words, approximately 10 million new young people will be looking for work each year. Thus, the number of non-agricultural jobs that will need to grow is at least 10 million per annum (or 50 million in 5 years). If we add the stock of educated unemployed currently (total 10 million), they should be added to the numbers who will look for work in industry and services. In addition will be those leaving agriculture (5 million per annum have left agriculture between 2004-5 and 2011-12). How are all these 17 million jobs per annum to be created in non-agriculture?
The missing middle: minimizing the disincentives for growth of firms
In the previous section we identified the missing middle in India as a problem17. This has also been corroborated by the Economic Survey 2013 which states that in India too many small firms continue to stay small and unproductive and are not allowed to die gracefully. Smaller enterprises prefer to remain under the regulator’s and taxman’s radar, lack competitiveness, suffer from low productivity and are unable to generate productive employment. Meanwhile the large profit-making firms choose to hire temporary contract labour and employ machines rather than train workers for longer-term jobs in order to avoid rigidity on account of labour regulations. This is reflected in rising informalization in organized sector employment. Both these characteristics of firms have implications for employment generation.
The dominance of micro enterprises, both in the registered as well as unregistered segments, seems to be voluntary because that way they can avoid regulations (labour, pollution control) and taxes. Firms employing larger number of contract or temporary workers have little incentive to invest in training and skill upgradation of their employees and improving productivity.
The problem of the missing middle is essentially policy-induced and began in the 1950s with a process of reserving a host of products for small scale industries. It began soon after Industry Policy Resolution of 1956 (128 items were exclusively reserved) which was reinforced by Industry Policy Resolution 1977 (reserving an additional 504 items for SSIs). The process of reservation of products that could only be produced by SSIs continued until the early 1990s, such that as many as 836 products were reserved for SSIs, and could not be produced by larger firms. This process began after 1956, precisely at the same time as the 16The population of age 10 years to 34 years of those who are currently enrolled at secondary and graduate level are expected to join the labour force in the next five years. It is important to note that some, not all of this population will join the labour force. To estimate the labour force size (new entering) over the next five years (2012-17) we have to multiply their current LFPR (assuming it would be constant or slightly higher) with their population increase to determine the volume of the future labour force. Specify here the exacy age-specific LFPRs that you calculated. 17NSS data on non-agricultural workers shows that as many as 64 per cent non-agricultural workers (in 2011-12) are employed in enterprises hiring less than 6 workers. Invariably most of these enterprises are either micro or small enterprises. The data from the Fourth All India Census of Micro, Small and Medium Enterprises (2006-07) shows that of the 1.6 million registered and 19.9 million unregistered enterprises, micro enterprises accounted for 95 per cent and 99 per cent of enterprises respectively.

25
‘heavy-industry first’ strategy of the second five year plan was put in place, based on the Feldman-Mahalanobis model. The flip side of this encouragement of SSI was the strategy of import substituting industrialization, by state-led public enterprises which were going to be large-scale enterprises. Thus, on the one hand, support was given to the SSIs and, on the other, large scale public enterprises in the capital goods sector were promoted. Thus began the dynamic that sheer policy-induced distortions resulted in the missing middle.
It was only after economic reforms began in 1991 that the process of distortion began to be unwound, and increasingly products were taken off the reserved list, and opened up for investment by enterprises other than SSIs. However, it took nearly two decades for the process of de-reservation to be completed so that now only 14 products are reserved for small units. Nevertheless, the reservation list elimination has been replaced by an equally counter-intuitive policy, which actually disincentivises firms from growing.
There is an inbuilt disincentive system facing the micro and small enterprises to invest in capital and expand. The criterion of investment in plant and machinery is used to determine whether a firm belongs to the category of micro, small or medium enterprise (MSME18). There are both financial and non-financial incentives and benefits from the various government schemes for the first two categories: micro and small enterprises (MSEs).
These financial and non-financial incentives for MSEs are such that if a firm decides to grow by investing in plant and machinery so that its total investment rises above Rs.5 crore (i.e. it becomes a medium enterprise), it risks falling off a cliff; it loses almost all these benefits if it makes that ‘mistake’. Similarly, service sector firms are also dis-incentivised from growing. Service tax exemptions for firms with less than Rs 10 lakh revenue, and exemption from central excise duty for firms with an annual turnover of less than Rs 1.5 crore, are examples of some of these schemes which act as a disincentive for service sector firms to grow (Economic Survey 2012-13). In response to this criticism, in 2013 the MSME Ministry (that provides these incentives) decided that the incentives offered micro/small enterprises will continue for three years of their investment increases beyond Rs.5 crore.
Labour regulations: addressing labour laws as a constraint on firm growth
Quite apart from the government’s own financial and non-financial incentives to small firms to remain small, there are other constraints on employment growth, with respect to larger organized sector enterprises. Labourlaws and other regulations have often
18The non-financial incentives consist of assistance aimed at processes, design and technology. In addition, the government needs to procure 20% of annual value of goods and services from MSEs and 358 items are reserved for exclusive procurement by the government from MSEs. Micro and small enterprises are entitled to these benefits which they have to forego if they graduate to medium enterprises, a disincentive structure which has been built into policy to promote and protect small scale enterprises. Also, there are financial incentives for MSEs: a credit guarantee for collateral free loan for loans up to Rs.1 crore; training and technology grant of 75% of projects cost; tangible assets and infrastructure grant of 80% of project cost; reimbursement of 75% for ISO certification expenses up to maximum of Rs.75,000; and the Small Industries Development Bank of Industry (SIDBI) support for NGOs; and micro finance institutions to provide loans to MSEs.

26
hinderedexpansion of employment in organized manufacturing. There are 45 different national and state-level labourlaws in India (Panagariya 2008). Labour laws apply in practice mainly to the organized sector. As the size of a factory grows, it increasingly becomes subject to more legislation. In order to avoid rigidity on account of these regulations, firms often employ casual labour or turn more capital intensive. ASI data has shown rising capital intensity of organized manufacturing sector in the second half of the decade.
Besley and Burgess (2004) find that industrial performance has been weaker in states with pro-worker labour laws. Estimates using plant-level data suggest that firms in labour intensive industries and in states with flexible labour laws have 14 per cent higher Total Factor Productivity than their counterparts in states with more stringent labour laws. Labour laws may also be an important factor responsible for the skewed size distribution of Indian enterprises. Firms in states with more inflexible labour regulations tend to be smaller, especially in the labour-intensive subsectors of manufacturing (Hasanet al., 2012).
Various surveys (World Bank, OECD) have, however, tended to suggest that labour laws rank fifth or sixth in the constraints faced by business enterprises in India. A useful caveat to this observation should be that the Indian firms have been exposed to labour laws for over three decades, and have learnt to survive with them and have adjusted their operations in line with the requirements of various labour regulations. For instance, firms tend to operate in smaller sizes or hire contract labour rather than permanent labour to stay out of the ambit of the Industrial Disputes Act. Chapter 5(B) of this Act (1982) states that firms employing more than 100 workers must take prior permission from the state government before dismissing such workers.
Table 12: Percentage Distribution of Factories by Size of Employment (all sectors)
Employment Range Factories in Operation (%) 0-14 36.71 15-19 10.64 20-29 12.04 30-49 12.54 50-99 12.08 100-199 7.56 200-499 4.97 500-999 1.84 1000-1999 0.94 2000-4999 0.49 5000 & Above 0.20 Total 100.00
Source: Estimated from Annual Survey of Industries, 2010-11
Hence, we have attempted below to establish whether the presence of this legislation for 36 years (the threshold limit of such firms was 300 workers in 1996, which became 100 workers in 1982) has affected industrial structure in the sense that the size, class of enterprise

27
is skewed towards those with fewer than100 workers. We find (table12) that the fact of the missing middle can also be established using ASI data which shows a distinct discontinuity, at the cut-off of firms employing 100 and above workers. The table12shows that factories employing less than 99 workers are about two thirds of all factories surveyed under ASI, of which almost 36 per cent of all factories employ less than 14 workers. A remarkable 84 per cent of all factories employ less than 100 workers. The cliff at 100+ workers is visible with a fall in the percentage of factories with over 100 workers. Concerted efforts are needed to support transition of smaller enterprises to medium ones with government support or tax incentives.
The policy-induced incentive for firms to remain small, producing low technology-based products lasted for 35 years – enough to create the missing middle. These firms provided jobs but operated at low levels of productivity. The international evidence is that there is an inverse relation between the number of jobs created by a firm and productivity, as shown in Figure 4. World Bank (2013) shows that there are significant differences in dispersion of productivity of firms in manufacturing across different countries. Very importantly, the dispersion of productivity among Indian firms is twice as large compared to Chinese firms. The SSIs in India have created jobs but their productivity is poorer compared to Chinese firms, particularly because Chinese firms did not face any such policy-induced constraints.
Figure 4: Employment, Productivity and Working Conditions, by Size of Enterprises
Source: Poschen(2013)
Improving employability: Skill development and the link to raising women’s labour force participation
The fluctuations in total employment in the past decade can in part be attributed to women joining the workforce during 2000 and 2005 and withdrawing post 2005. If women are voluntarily withdrawing from work to continue their education, it is a highly welcome development. Policy-makers should be concerned about providing jobs to these educated girls and women who will join the workforce in coming years. There are three dimensions to their becoming a part of the labour force.
• Large MNCs
• Large Enterprises
• SMEs
• Micro enterprises

28
The first is the need for skill development and training for these women. Women usually find work in low-end jobs/sub-sectors in the unorganized manufacturing (bidi making, agarbatti making) and services (domestic help) sectors. This is often a result of their inability to access quality training, especially in rural areas on account of very few training centres (ITIs) for women. Moreover, infrastructure bottlenecks like lack of safe transportation and hostel facilities, also act as constraints for girls and women to undertake skill training away from their rural households (Mehrotra forthcoming). Another important aspect of women’s skill development, especially for rural females, is that they prefer to be trained by female instructors. In this regard, there is a need to address the skill development challenge for around half of our workforce to be able to tap the demographic dividend.
The other dimension of encouraging the women to participate in the workforce is to provide jobs suitable for them. In this regard, rural non-farm work plays an important role because it opens avenues for women, who are often restricted from travel outside their villages due to family concerns. Workplace safety, working conditions and basic infrastructure (like presence of toilets) are important considerations for increasing female workforce participation rates.
Finally, it is important to recognize the constraints that women often face in joining the labour force (IAMR, 2013). Their responsibilities at home of looking after the elder and caring for children, in addition to domestic duties of cooking and cleaning, take up most of their time. If flexibility and support both at home and workplace are provided, it will be an important push factor for them to be part of the labour force. Therefore, the third aspect concerns developing specific policies towards developing a care economy and women friendly/oriented jobs in and around the village/city (long distance to work is a major pull back factor for women).
However, the issue of skill development goes well beyond making young women employable. Youngmen too face employability issues that derive from their poor level of skills and need adequate training.
Improving competitiveness of our manufacturing sector
One of the concerns that plague our policymakers is that the contribution of manufacturing to the country’s GDP has remained stagnant at less than 16 per cent for the past so many decades. The manufacturing sector’s growth averaged at 7.7 per cent till 2009-10 which peaked at 14.3 per cent in 2007-08 after which it started to decline. Manufacturing GDP growth rate for India is, on average, 7 per cent compared to about 10 per cent for China during 1999 and 2009. It is the decline in manufacturing growth that is responsible for the slowdown in GDP growth in 2011-12 (Planning Commission, 2013). For manufacturing to grow faster than other sectors of the economy, the rate of gross capital formation needs to be higher. Declining investments and capacity additions, in line with business expectations resulted in the decline in manufacturing employment during 2004-05 and 2009-10.

29
The two constraints in India’s development policy which can explain thelowerpotential growth of the manufacturing sector have been the failure to develop power and transport infrastructure in line with the needs of industry along with the absence of an industrial policy with a special focus on manufacturing (Maira 2013). Good physical infrastructure in terms of improved transportation, uninterrupted power supply and adequate land along with flexible regulations (with respect to bureaucratic controls) regarding safety, pollution, inspections, licensing, and labour conditions are needed to improve the competitiveness of our manufacturers.
Industrial policy with a special focus on developing indigenous technology for domestic manufacturers, and higher expenditure on R&D are important prerequisites for expanding our manufacturing sector. The Industry Chapter of the 12th Five Year Plan proposes setting up of a Technology Acquisition and Support Fund. Working in a PPP mode, with some support from the government towards this fund for creating a manufacturing ecosystem (developing standards and improving IP regime, supporting MSMEs through common facilities and Cluster Development, and ensuring availability of skilled human resource) can boost manufacturing growth and employment. To encourage and mobilize the support from the private sector, it is required to address the anomalies in the duty structure and labour regulations that our industrial enterprises are exposed to. Often our domestic manufacturers due to higher raw material costs at home and unfavourable/inverted duty structure (higher duty on intermediate goods compared to final/finished goods often enjoying concessional custom duty under some schemes) suffer on account of loss of competitiveness both in local and global markets. Due to the duty structure, domestic manufacturing units end up importing finished goods from China, Bangladesh and other East Asian countries. On account of these factors, the trade deficit in the case of manufacturing on account of continued global/import competition was 44 per cent of manufacturing GDP during 2008/09–2010-11. Precisely for these reasons economists have warned not to rush into free trade pacts because they have not been able to generate much gain for our local producers. Moreover, interstate movement of goods by local manufacturers adds to their costs on account of central plus interstate sales tax/VAT. Therefore there is a serious need to put in place the GST and review our customs and excise duty structure.
The manufacturing sector is considered to be labour intensive with its multiplier effects for employment generation in other related sectors as well (transportation, trade, communication etc.). Rigidities and costs of complying with labour regulations and the procedures for enforcement of these regulations (inspections, prosecutions and convictions) are quite complex and often create rent seeking behaviour. Our policy makers should take cognizance of these factors and work towards expanding economic growth with employment generation.

30
Bibliography
Abraham (2008) “Employment growth in rural India: Distress driven?” working paper 404, available at http://vinojabraham.ucoz.com/geo_export/0/wp404.pdf, accessed on 21/10/2013.
Banister J. (2014)“China’s manufacturing employment and hourly labor compensation, 2002-2009”, Bureau of Labour Statistics, available at http://www.bls.gov/fls/china_method.htm accessed on 19.03.2014
Besley, T. and R. Burgess (2004) “Can Regulation Hinder Economic Performance? Evidence from India”,Quarterly Journal of Economics, 119 (1): pp.91-134.
Ghani, E., Goswami, A. and K. Homi (2011) “Can services be the next growth escalator?” available at http://www.voxeu.org/article/can-services-be-next-growth-escalator
Gill, A. and L. Singh, (2006) “Farmers' Suicides and Response of Public Policy”, Economic and political Weekly, Vol - XLI No. 26.
Goldar B. (2013), “Determinants of Import Intensity of India’s Manufactured Exports”, presented at the Conference of the Indian Association of Research on National Income and Wealth, held at ISI, Kolkata on 15-16 March, 2013.
Hasan, R., K. Robert, and L. Jandoc (2012) “Labor Regulations and the Firm Size Distribution in Indian Manufacturing”, Columbia Program on Indian Economic Policies, Working Paper No. 20123.
Himanshu (2011) “Employment Trends in India: A Re-examination”, Economic and Political Weekly,Vol. 46, No. 37.
Husted, S. and Nishioka, S.(2012) “China's Fare Share?The Growth of Chinese Exports in World Trade”, Review of World Economics, Vol. 149 (3).
IAMR (2013)“Low Female Employment in a Period of High Growth: Insights from Primary Survey in Uttar Pradesh and Gujarat”, Report No. 9/2013.
Jeromi, P. D. (2007) “Farmers' Indebtedness and Suicides”, Economic and Political Weekly, Vol. XLII No. 31.
Kannan, K.P. and Raveendran G.(2012) “Counting and Profiling the Missing Labour Force”, Economic and Political Weekly, Vol. XLVII No. 06.
Mehrotra, S. (forthcoming), “Seizing the Demographic Dividend – Policies to Achieve Inclusive Growth in India”, Cambridge University Press.
Mehrotra, Santosh, Gandhi Ankita,Sahoo B.K. and Saha P. (2013) “Turnaround in India’s employment story: Silver Lining amidst joblessness and informalization?”Economic and Political Weekly, Vol XLVIII, No 35.

31
Mehrotra, S., Gandhi A., Sahoo B.K., and Saha P. (2012) “Creating Employment during the 12th Plan”, Economic and Political Weekly, Vol. XLVII, No. 19, pp. 63-73.
Mehrotra, S. (2008) “National Rural Employment Guarantee two years on: Where do we go from here?”,Economic and Political Weekly, Vol.43 No. 31.
Ministry of Finance (2013)“Economic Survey of India 2012-13” Government of India, New Delhi.
Ministry of Finance (2011) “Economic Survey of India 2010-11” Government of India, New Delhi.
Mohanty, M. (2013) “Growth and Globalization: An anatomy of the slowdown of the Indian Economy”, presented at the Indian Institute of Management, Calcutta March 2013.
National Sample Survey (2013)“Key Indicators of Household Consumer Expenditure in India”, Report No. NSS KI(68/1.0).
Panagariya, A.(2008) “India: The Emerging Giant,” Oxford University Press, New York.
Planning Commission (2013) “Twelfth Five Year Plan: (2012–2017): Faster, More Inclusive and Sustainable Growth”, Oxford University Press.
Poschen(2013) “Asia Productivity Trends”, Mimeo, ILO conference, Geneva.
Rangarajan C., Padma I. K. and Seema (2011) “Where Is the Missing LabourForce?”,Economic and Political Weekly, Vol. 46, No. 39.
RBI database (various years), Exports of principal commodities, available at http://www.rbi.org.in/scripts/AnnualPublications.aspx?head=Handbook%20of%20Statistics%20on%20Indian%20Economy
RBI (2012) “The Economy Review and Prospect”,Annual Report on the Working of the Reserve Bank of India 2011-12, Part 1 pg. 19, available athttp://rbidocs.rbi.org.in/rdocs/AnnualReport/PDFs/IIECORE230812.pdf
RBI (2010) “Industrial Outlook Survey” 52 round, Mumbai.
Rodrik, D.(2012) “No More Growth Miracles”, Project Syndicate, Cambridge, available athttp://www.project-syndicate.org/commentary/no-more-growth-miracles-by-dani-rodrik, accessed on 20/06/ 2013.
Shroff S. and S. Mitra (2007), "Farmers' Suicides in Maharashtra”, Economic and political Weekly, Vol. XLII, No. 49
Thomas, J. (2012) “India’s Labour Market during the 2000s: Surveying the Changes”, Economic and Political Weekly, Vol. XLVII, No. 51.
World Bank (2013) “Doing Business: Measuring Business Regulations”, Washington DC.
World Bank (2012) “More and Better Jobs in South Asia”, Washington DC.


INSTITUTE OF APPLIED MANPOWER RESEARCHCity Office: 53, Lodhi Estate, New Delhi-110 003
Phone: +91 (0) 11 24697081; 24697082Fax: +91 (0) 11 2778 3467
Web: http://iamrindia.gov.in E-mail: [email protected]
Campus: Sector A-7, Narela Institutional Area, Delhi-110 040Phone: + 91 (0) 11 27787215/6/7
Fax: +91(0) 11 27783467Web: http://iamrindia.gov.in E-mail: [email protected]