why big data and ensembles with r? - togaware · 2014-04-26 · what is r? why a tutorial on r? why...
TRANSCRIPT
An Introductory Tutorial
Data Analytics using R
Senior Director and Data Scientist, AnalyticsAustralian Taxation Office
Adjunct Professor, Australian National UniversityFellow, Institute of Analytics Professionals of Australia
http://datamining.togaware.com
Visit: http://onepager.togaware.com for Tutorial Notes
http: // togaware. com Copyright© 2013, [email protected] 1/7
Tutorial Overview
1 Motivating R – A Language for Data Mining
2 Data Mining in R – Hands-on Rattle GUI
3 Programming Data in R – Scripting our Analyses
4 Disseminate Research in R – Ensembles and wsrf
http: // togaware. com Copyright© 2013, [email protected] 2/7
Motivating R – A Language for Data Mining
Tutorial Overview
1 Motivating R – A Language for Data Mining
2 Data Mining in R – Hands-on Rattle GUI
3 Programming Data in R – Scripting our Analyses
4 Disseminate Research in R – Ensembles and wsrf
http: // togaware. com Copyright© 2013, [email protected] 3/7
What is R? Installing R
Installing R
Instructions on Togaware: http://rattle.togaware.com
Visit CRAN: http://mirrors.ustc.edu.cn/CRAN/
Linux: Install package for your distribution$ wajig install r-recommended (Debian/Ubuntu)
Windows: Download and install from CRAN
MacOSX: Download and install from CRAN
http: // togaware. com Copyright© 2013, [email protected] 4/28
What is R? Why a Tutorial on R?
Why Big Data and Ensembles with R?
Most widely used Data Mining and Machine Learning Package
Machine LearningStatisticsSoftware Engineering and Programming with DataNot the nicest of languages for a computer scientist
Free (Libre) Open Source Statistical Software
. . . all modern statistical approaches
. . . many/most machine learning algorithms
. . . opportunity to readily add new algorithms
That is important for us in the research communityGet our algorithms out there and being used—impact!!!
http: // togaware. com Copyright© 2013, [email protected] 5/28
What is R? Popularity of R?
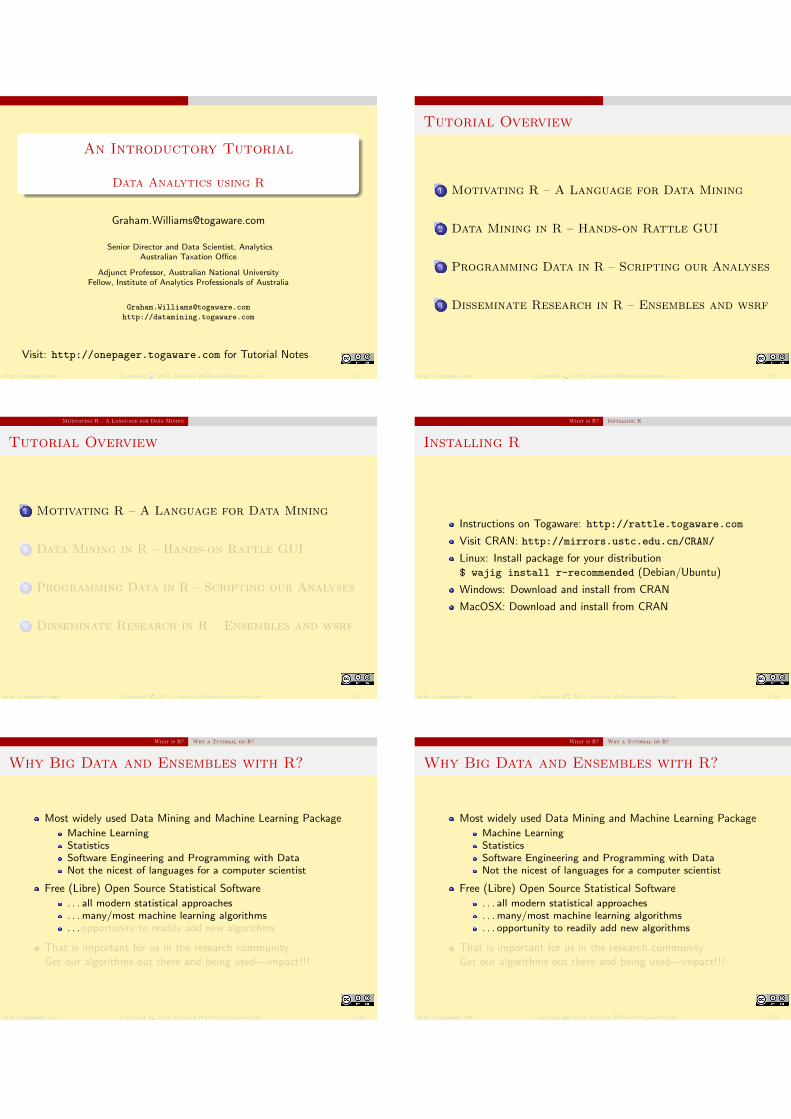
How Popular is R? Discussion List Traffic
Monthly email traffic on software’s main discussion list.
http://r4stats.com/articles/popularity/http: // togaware. com Copyright© 2013, [email protected] 6/28
What is R? Popularity of R?
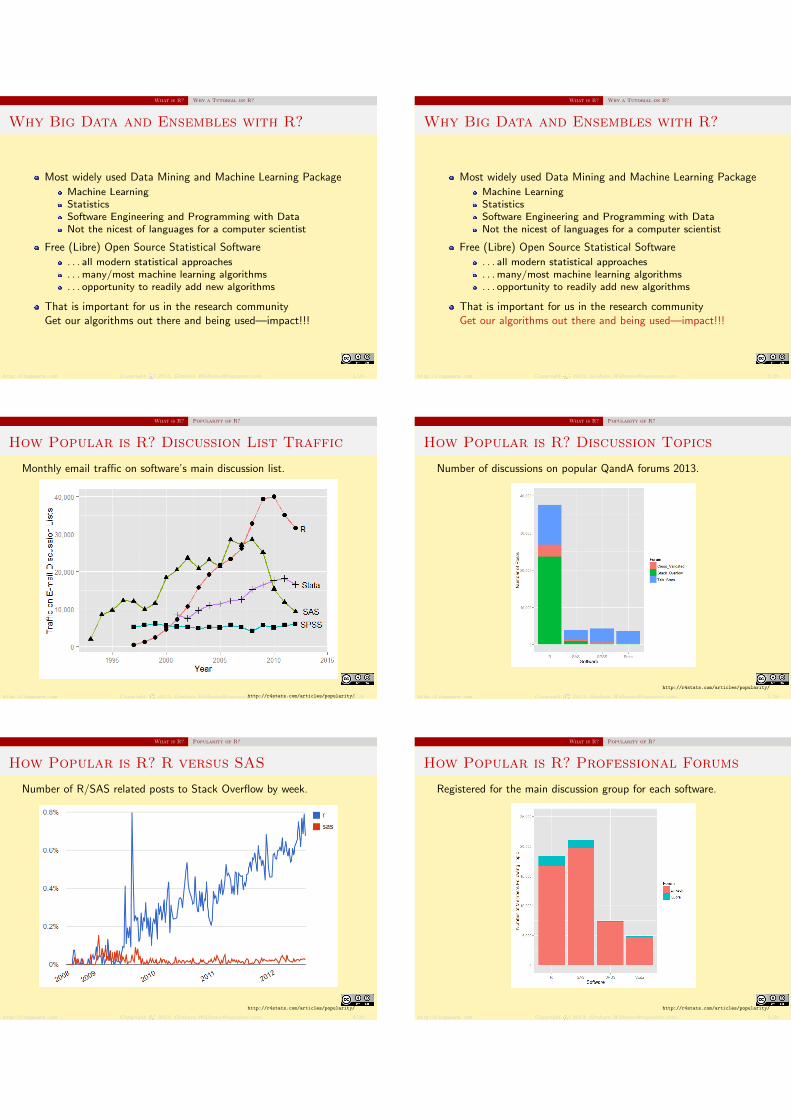
How Popular is R? Discussion Topics
Number of discussions on popular QandA forums 2013.
http://r4stats.com/articles/popularity/
http: // togaware. com Copyright© 2013, [email protected] 7/28
What is R? Popularity of R?
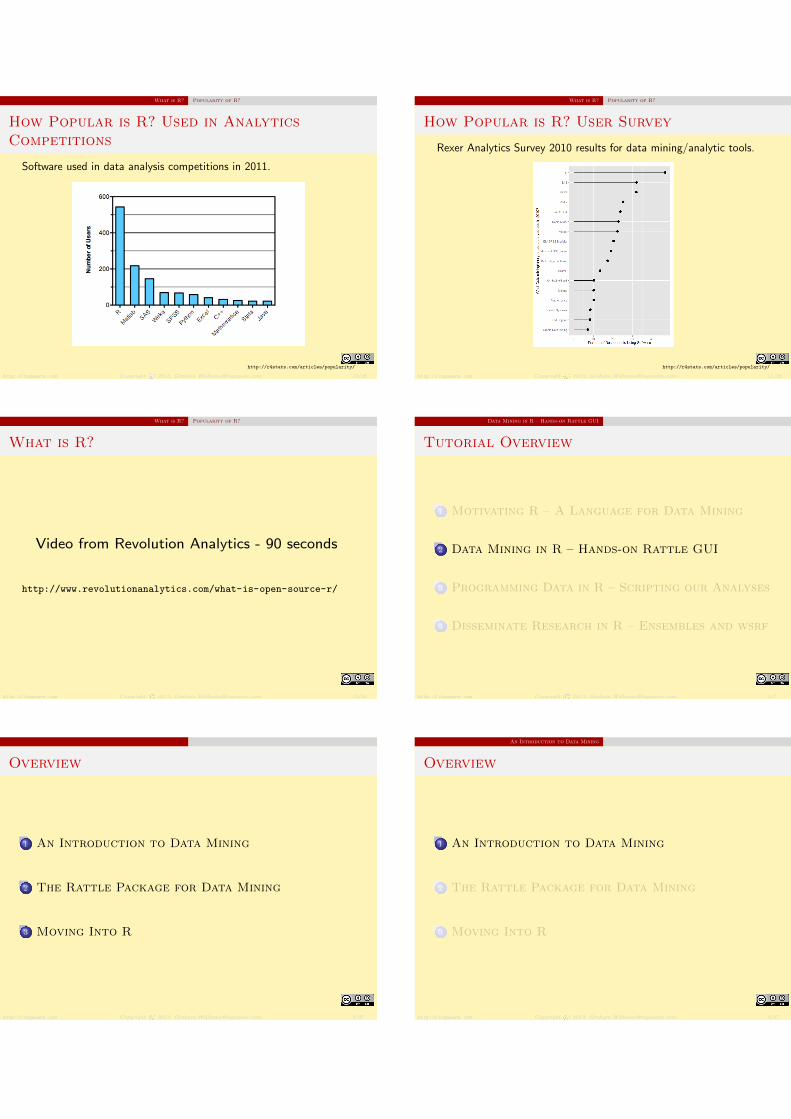
How Popular is R? R versus SAS
Number of R/SAS related posts to Stack Overflow by week.
http://r4stats.com/articles/popularity/
http: // togaware. com Copyright© 2013, [email protected] 8/28
What is R? Popularity of R?
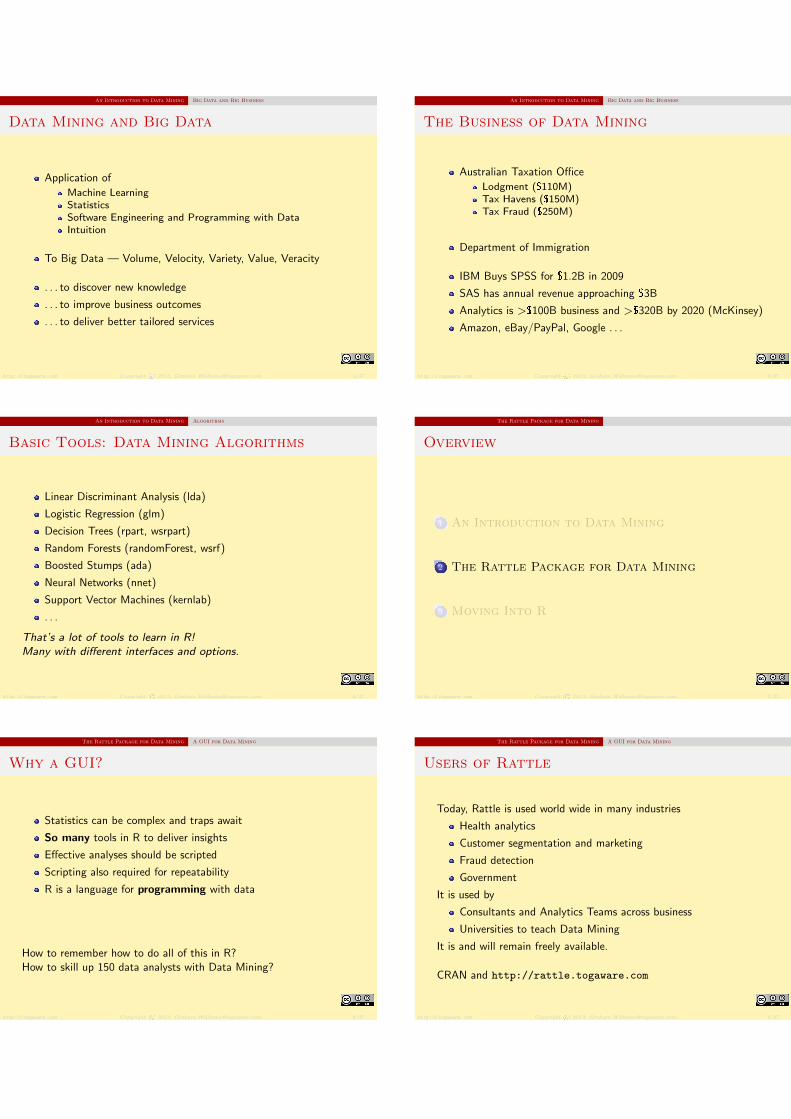
How Popular is R? Professional Forums
Registered for the main discussion group for each software.
http://r4stats.com/articles/popularity/
http: // togaware. com Copyright© 2013, [email protected] 9/28
What is R? Popularity of R?
How Popular is R? Used in Analytics
Competitions
Software used in data analysis competitions in 2011.
http://r4stats.com/articles/popularity/
http: // togaware. com Copyright© 2013, [email protected] 10/28
What is R? Popularity of R?
How Popular is R? User Survey
Rexer Analytics Survey 2010 results for data mining/analytic tools.
http://r4stats.com/articles/popularity/
http: // togaware. com Copyright© 2013, [email protected] 11/28
What is R? Popularity of R?
What is R?
Video from Revolution Analytics - 90 seconds
http://www.revolutionanalytics.com/what-is-open-source-r/
http: // togaware. com Copyright© 2013, [email protected] 12/28
Data Mining in R – Hands-on Rattle GUI
Tutorial Overview
1 Motivating R – A Language for Data Mining
2 Data Mining in R – Hands-on Rattle GUI
3 Programming Data in R – Scripting our Analyses
4 Disseminate Research in R – Ensembles and wsrf
http: // togaware. com Copyright© 2013, [email protected] 4/7
Overview
1 An Introduction to Data Mining
2 The Rattle Package for Data Mining
3 Moving Into R
http: // togaware. com Copyright© 2013, [email protected] 2/37
An Introduction to Data Mining
Overview
1 An Introduction to Data Mining
2 The Rattle Package for Data Mining
3 Moving Into R
http: // togaware. com Copyright© 2013, [email protected] 3/37
An Introduction to Data Mining Big Data and Big Business
Data Mining and Big Data
Application of
Machine LearningStatisticsSoftware Engineering and Programming with DataIntuition
To Big Data — Volume, Velocity, Variety, Value, Veracity
. . . to discover new knowledge
. . . to improve business outcomes
. . . to deliver better tailored services
http: // togaware. com Copyright© 2013, [email protected] 4/37
An Introduction to Data Mining Big Data and Big Business
The Business of Data Mining
Australian Taxation Office
Lodgment ($110M)Tax Havens ($150M)Tax Fraud ($250M)
Department of Immigration
IBM Buys SPSS for $1.2B in 2009
SAS has annual revenue approaching $3B
Analytics is >$100B business and >$320B by 2020 (McKinsey)
Amazon, eBay/PayPal, Google . . .
http: // togaware. com Copyright© 2013, [email protected] 5/37
An Introduction to Data Mining Algorithms
Basic Tools: Data Mining Algorithms
Linear Discriminant Analysis (lda)
Logistic Regression (glm)
Decision Trees (rpart, wsrpart)
Random Forests (randomForest, wsrf)
Boosted Stumps (ada)
Neural Networks (nnet)
Support Vector Machines (kernlab)
. . .
That’s a lot of tools to learn in R!Many with different interfaces and options.
http: // togaware. com Copyright© 2013, [email protected] 6/37
The Rattle Package for Data Mining
Overview
1 An Introduction to Data Mining
2 The Rattle Package for Data Mining
3 Moving Into R
http: // togaware. com Copyright© 2013, [email protected] 7/37
The Rattle Package for Data Mining A GUI for Data Mining
Why a GUI?
Statistics can be complex and traps await
So many tools in R to deliver insights
Effective analyses should be scripted
Scripting also required for repeatability
R is a language for programming with data
How to remember how to do all of this in R?How to skill up 150 data analysts with Data Mining?
http: // togaware. com Copyright© 2013, [email protected] 8/37
The Rattle Package for Data Mining A GUI for Data Mining
Users of Rattle
Today, Rattle is used world wide in many industries
Health analytics
Customer segmentation and marketing
Fraud detection
Government
It is used by
Consultants and Analytics Teams across business
Universities to teach Data Mining
It is and will remain freely available.
CRAN and http://rattle.togaware.com
http: // togaware. com Copyright© 2013, [email protected] 9/37

The Rattle Package for Data Mining Setting Things Up
Installation
Rattle is built using R
Need to download and install R from cran.r-project.org
Recommend also install RStudio from www.rstudio.org
Then start up RStudio and install Rattle:
install.packages("rattle")
Then we can start up Rattle:
rattle()
Required packages are loaded as needed.
http: // togaware. com Copyright© 2013, [email protected] 10/37
The Rattle Package for Data Mining Tour
A Tour Thru Rattle: Startup
http: // togaware. com Copyright© 2013, [email protected] 11/37
The Rattle Package for Data Mining Tour
A Tour Thru Rattle: Loading Data
http: // togaware. com Copyright© 2013, [email protected] 12/37
The Rattle Package for Data Mining Tour
A Tour Thru Rattle: Explore Distribution
http: // togaware. com Copyright© 2013, [email protected] 13/37
The Rattle Package for Data Mining Tour
A Tour Thru Rattle: Explore Correlations
http: // togaware. com Copyright© 2013, [email protected] 14/37
The Rattle Package for Data Mining Tour
A Tour Thru Rattle: Hierarchical Cluster
http: // togaware. com Copyright© 2013, [email protected] 15/37

The Rattle Package for Data Mining Tour
A Tour Thru Rattle: Decision Tree
http: // togaware. com Copyright© 2013, [email protected] 16/37
The Rattle Package for Data Mining Tour
A Tour Thru Rattle: Decision Tree Plot
http: // togaware. com Copyright© 2013, [email protected] 17/37
The Rattle Package for Data Mining Tour
A Tour Thru Rattle: Random Forest
http: // togaware. com Copyright© 2013, [email protected] 18/37
The Rattle Package for Data Mining Tour
A Tour Thru Rattle: Risk Chart
0.10.20.30.40.50.60.70.80.9
Risk Scores
22%
1
2
3
4
LiftLiftLiftLiftLiftLiftLiftLiftLiftLiftLiftLiftLiftLiftLiftLiftLiftLiftLiftLiftLiftLiftLiftLiftLiftLiftLiftLiftLiftLiftLiftLiftLiftLiftLiftLiftLiftLiftLiftLiftLiftLiftLiftLiftLiftLiftLiftLiftLiftLiftLiftLiftLiftLiftLiftLiftLiftLiftLiftLiftLiftLiftLiftLiftLiftLiftLiftLiftLiftLiftLiftLiftLiftLiftLiftLiftLiftLiftLiftLiftLiftLift
0
20
40
60
80
100
0 20 40 60 80 100Caseload (%)
Per
form
ance
(%
)
RainTomorrow (92%)
Rain in MM (97%)
Precision
Risk Chart Random Forest weather.csv [test] RainTomorrow
http: // togaware. com Copyright© 2013, [email protected] 19/37
Moving Into R
Overview
1 An Introduction to Data Mining
2 The Rattle Package for Data Mining
3 Moving Into R
http: // togaware. com Copyright© 2013, [email protected] 20/37
Moving Into R Programming with Data
Data Miners are Programmers of Data
Data miners are programmers of data
A GUI can only do so much
R is a powerful statistical language
Professional data mining
ScriptingTransparencyRepeatability
http: // togaware. com Copyright© 2013, [email protected] 21/37

Moving Into R Programming with Data
From GUI to CLI — Rattle’s Log Tab
http: // togaware. com Copyright© 2013, [email protected] 22/37
Moving Into R Programming with Data
From GUI to CLI — Rattle’s Log Tab
http: // togaware. com Copyright© 2013, [email protected] 23/37
Moving Into R Programming with Data
Step 1: Load the Dataset
dsname <- "weather"
ds <- get(dsname)
dim(ds)
## [1] 366 24
names(ds)
## [1] "Date" "Location" "MinTemp" "...
## [5] "Rainfall" "Evaporation" "Sunshine" "...
## [9] "WindGustSpeed" "WindDir9am" "WindDir3pm" "...
## [13] "WindSpeed3pm" "Humidity9am" "Humidity3pm" "...
....
http: // togaware. com Copyright© 2013, [email protected] 24/37
Moving Into R Programming with Data
Step 2: Observe the Data — Observations
head(ds)
## Date Location MinTemp MaxTemp Rainfall Evapora...
## 1 2007-11-01 Canberra 8.0 24.3 0.0 ...
## 2 2007-11-02 Canberra 14.0 26.9 3.6 ...
## 3 2007-11-03 Canberra 13.7 23.4 3.6 ...
....
tail(ds)
## Date Location MinTemp MaxTemp Rainfall Evapo...
## 361 2008-10-26 Canberra 7.9 26.1 0 ...
## 362 2008-10-27 Canberra 9.0 30.7 0 ...
## 363 2008-10-28 Canberra 7.1 28.4 0 ...
....
http: // togaware. com Copyright© 2013, [email protected] 25/37
Moving Into R Programming with Data
Step 2: Observe the Data — Structure
str(ds)
## 'data.frame': 366 obs. of 24 variables:
## $ Date : Date, format: "2007-11-01" "2007-11-...
## $ Location : Factor w/ 46 levels "Adelaide","Alba...
## $ MinTemp : num 8 14 13.7 13.3 7.6 6.2 6.1 8.3 ...
## $ MaxTemp : num 24.3 26.9 23.4 15.5 16.1 16.9 1...
## $ Rainfall : num 0 3.6 3.6 39.8 2.8 0 0.2 0 0 16...
## $ Evaporation : num 3.4 4.4 5.8 7.2 5.6 5.8 4.2 5.6...
## $ Sunshine : num 6.3 9.7 3.3 9.1 10.6 8.2 8.4 4....
## $ WindGustDir : Ord.factor w/ 16 levels "N"<"NNE"<"N...
## $ WindGustSpeed: num 30 39 85 54 50 44 43 41 48 31 ...
## $ WindDir9am : Ord.factor w/ 16 levels "N"<"NNE"<"N...
## $ WindDir3pm : Ord.factor w/ 16 levels "N"<"NNE"<"N...
....
http: // togaware. com Copyright© 2013, [email protected] 26/37
Moving Into R Programming with Data
Step 2: Observe the Data — Summary
summary(ds)
## Date Location MinTemp ...
## Min. :2007-11-01 Canberra :366 Min. :-5.3...
## 1st Qu.:2008-01-31 Adelaide : 0 1st Qu.: 2.3...
## Median :2008-05-01 Albany : 0 Median : 7.4...
## Mean :2008-05-01 Albury : 0 Mean : 7.2...
## 3rd Qu.:2008-07-31 AliceSprings : 0 3rd Qu.:12.5...
## Max. :2008-10-31 BadgerysCreek: 0 Max. :20.9...
## (Other) : 0 ...
## Rainfall Evaporation Sunshine Wind...
## Min. : 0.00 Min. : 0.20 Min. : 0.00 NW ...
## 1st Qu.: 0.00 1st Qu.: 2.20 1st Qu.: 5.95 NNW ...
## Median : 0.00 Median : 4.20 Median : 8.60 E ...
....
http: // togaware. com Copyright© 2013, [email protected] 27/37
Moving Into R Programming with Data
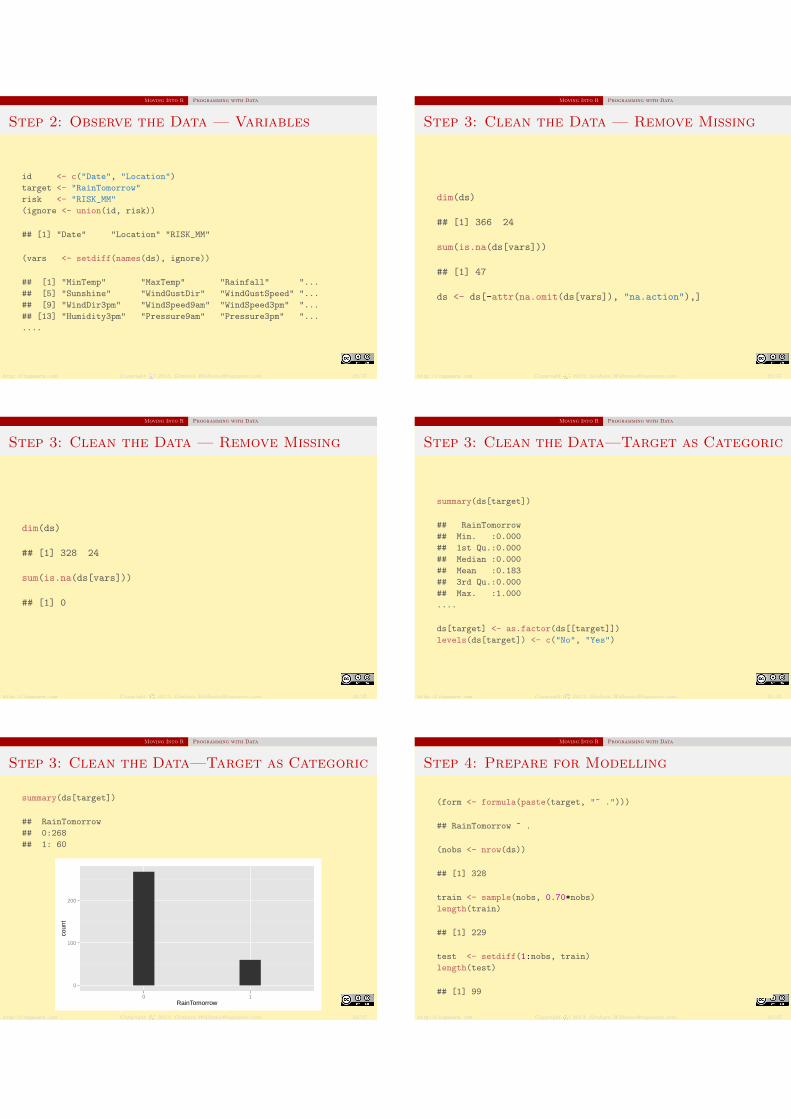
Step 2: Observe the Data — Variables
id <- c("Date", "Location")
target <- "RainTomorrow"
risk <- "RISK_MM"
(ignore <- union(id, risk))
## [1] "Date" "Location" "RISK_MM"
(vars <- setdiff(names(ds), ignore))
## [1] "MinTemp" "MaxTemp" "Rainfall" "...
## [5] "Sunshine" "WindGustDir" "WindGustSpeed" "...
## [9] "WindDir3pm" "WindSpeed9am" "WindSpeed3pm" "...
## [13] "Humidity3pm" "Pressure9am" "Pressure3pm" "...
....
http: // togaware. com Copyright© 2013, [email protected] 28/37
Moving Into R Programming with Data
Step 3: Clean the Data — Remove Missing
dim(ds)
## [1] 366 24
sum(is.na(ds[vars]))
## [1] 47
ds <- ds[-attr(na.omit(ds[vars]), "na.action"),]
http: // togaware. com Copyright© 2013, [email protected] 29/37
Moving Into R Programming with Data
Step 3: Clean the Data — Remove Missing
dim(ds)
## [1] 328 24
sum(is.na(ds[vars]))
## [1] 0
http: // togaware. com Copyright© 2013, [email protected] 30/37
Moving Into R Programming with Data
Step 3: Clean the Data—Target as Categoric
summary(ds[target])
## RainTomorrow
## Min. :0.000
## 1st Qu.:0.000
## Median :0.000
## Mean :0.183
## 3rd Qu.:0.000
## Max. :1.000
....
ds[target] <- as.factor(ds[[target]])
levels(ds[target]) <- c("No", "Yes")
http: // togaware. com Copyright© 2013, [email protected] 31/37
Moving Into R Programming with Data
Step 3: Clean the Data—Target as Categoric
summary(ds[target])
## RainTomorrow
## 0:268
## 1: 60
0
100
200
0 1RainTomorrow
coun
t
http: // togaware. com Copyright© 2013, [email protected] 32/37
Moving Into R Programming with Data
Step 4: Prepare for Modelling
(form <- formula(paste(target, "~ .")))
## RainTomorrow ~ .
(nobs <- nrow(ds))
## [1] 328
train <- sample(nobs, 0.70*nobs)
length(train)
## [1] 229
test <- setdiff(1:nobs, train)
length(test)
## [1] 99
http: // togaware. com Copyright© 2013, [email protected] 33/37
Moving Into R Programming with Data
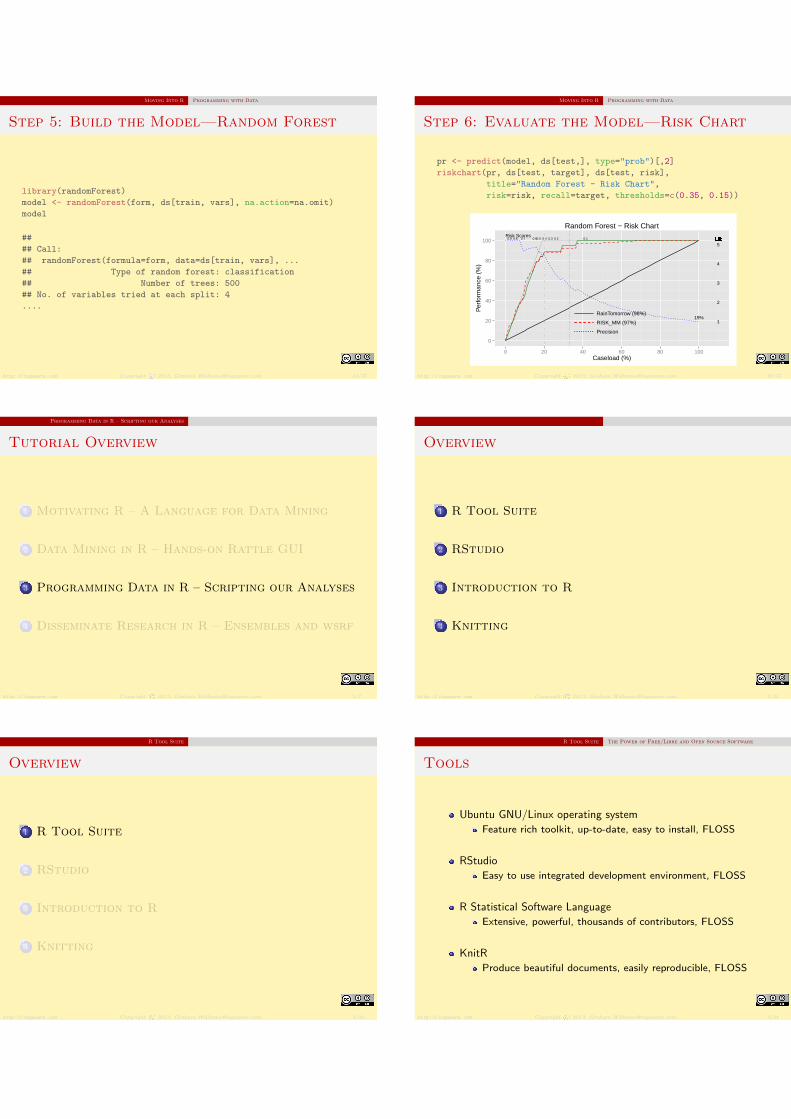
Step 5: Build the Model—Random Forest
library(randomForest)
model <- randomForest(form, ds[train, vars], na.action=na.omit)
model
##
## Call:
## randomForest(formula=form, data=ds[train, vars], ...
## Type of random forest: classification
## Number of trees: 500
## No. of variables tried at each split: 4
....
http: // togaware. com Copyright© 2013, [email protected] 34/37
Moving Into R Programming with Data
Step 6: Evaluate the Model—Risk Chart
pr <- predict(model, ds[test,], type="prob")[,2]
riskchart(pr, ds[test, target], ds[test, risk],
title="Random Forest - Risk Chart",
risk=risk, recall=target, thresholds=c(0.35, 0.15))
0.10.20.30.40.50.60.70.80.9Risk Scores
19%1
2
3
4
5LiftLiftLiftLiftLiftLiftLiftLiftLiftLiftLiftLiftLiftLiftLiftLiftLiftLiftLiftLiftLiftLiftLiftLiftLiftLiftLiftLiftLiftLiftLiftLiftLiftLiftLiftLiftLiftLiftLiftLiftLiftLiftLiftLiftLiftLiftLiftLiftLiftLiftLiftLiftLiftLiftLiftLiftLiftLiftLiftLiftLiftLiftLiftLiftLiftLiftLiftLift
0
20
40
60
80
100
0 20 40 60 80 100Caseload (%)
Per
form
ance
(%
)
RainTomorrow (98%)
RISK_MM (97%)
Precision
Random Forest − Risk Chart
http: // togaware. com Copyright© 2013, [email protected] 35/37
Programming Data in R – Scripting our Analyses
Tutorial Overview
1 Motivating R – A Language for Data Mining
2 Data Mining in R – Hands-on Rattle GUI
3 Programming Data in R – Scripting our Analyses
4 Disseminate Research in R – Ensembles and wsrf
http: // togaware. com Copyright© 2013, [email protected] 5/7
Overview
1 R Tool Suite
2 RStudio
3 Introduction to R
4 Knitting
http: // togaware. com Copyright© 2013, [email protected] 2/34
R Tool Suite
Overview
1 R Tool Suite
2 RStudio
3 Introduction to R
4 Knitting
http: // togaware. com Copyright© 2013, [email protected] 3/34
R Tool Suite The Power of Free/Libre and Open Source Software
Tools
Ubuntu GNU/Linux operating system
Feature rich toolkit, up-to-date, easy to install, FLOSS
RStudio
Easy to use integrated development environment, FLOSS
R Statistical Software Language
Extensive, powerful, thousands of contributors, FLOSS
KnitR
Produce beautiful documents, easily reproducible, FLOSS
http: // togaware. com Copyright© 2013, [email protected] 4/34

R Tool Suite Ubuntu
Using Ubuntu
Desktop Ubuntu
Connecting to Analytics Servers
Using XWinUsing VNC
Start up RStudio from the Dash
http: // togaware. com Copyright© 2013, [email protected] 5/34
RStudio
Overview
1 R Tool Suite
2 RStudio
3 Introduction to R
4 Knitting
http: // togaware. com Copyright© 2013, [email protected] 6/34
RStudio Interface
RStudio—The Default Three Panels
http: // togaware. com Copyright© 2013, [email protected] 7/34
RStudio Interface
RStudio—With R Script File—Editor Panel
http: // togaware. com Copyright© 2013, [email protected] 8/34
Introduction to R
Overview
1 R Tool Suite
2 RStudio
3 Introduction to R
4 Knitting
http: // togaware. com Copyright© 2013, [email protected] 9/34
Introduction to R Simple Plots
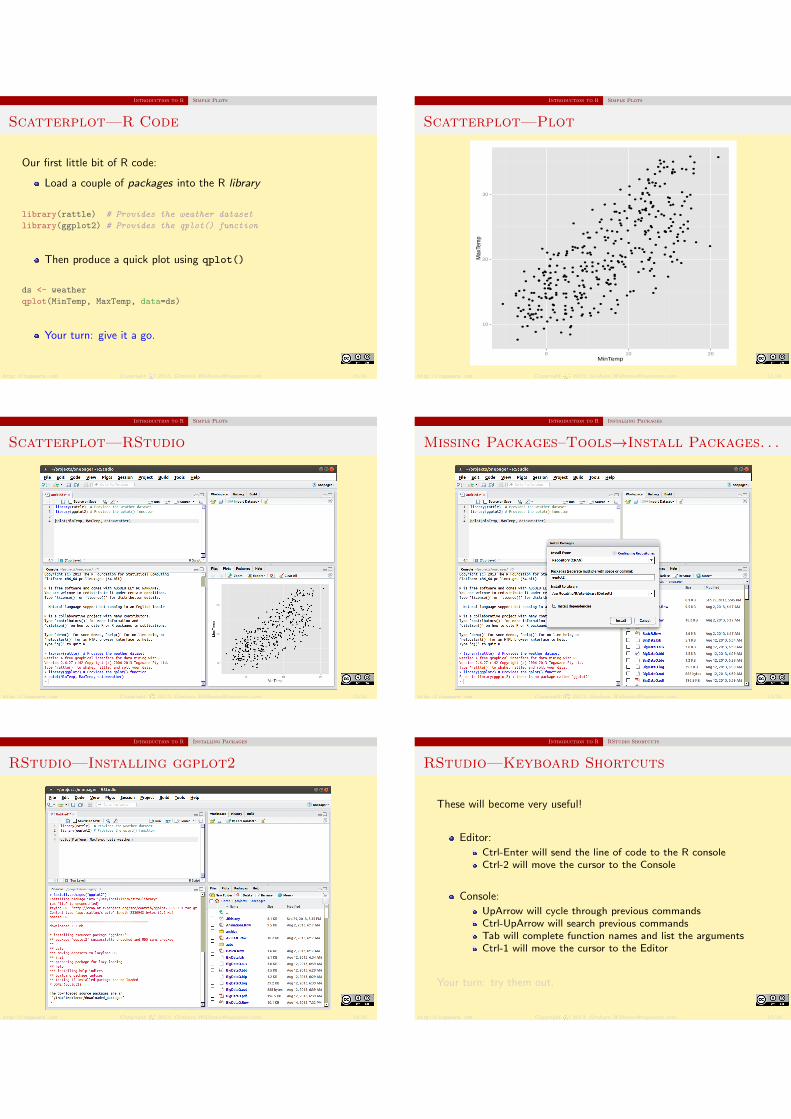
Scatterplot—R Code
Our first little bit of R code:
Load a couple of packages into the R library
library(rattle) # Provides the weather dataset
library(ggplot2) # Provides the qplot() function
Then produce a quick plot using qplot()
ds <- weather
qplot(MinTemp, MaxTemp, data=ds)
Your turn: give it a go.
http: // togaware. com Copyright© 2013, [email protected] 10/34
Introduction to R Simple Plots
Scatterplot—Plot
●
●
●
●
●
●
●
●
●
●
●
●
●
●●
●
●
●
●
●●
●
●
●
●
●
●
●
●●
●
●
●
●
●
●
●
●
●
●
●
●
●
●
●
●
●
● ●
●
●
●
●
●
●
●●
●
●
●
●
●
●
●
●
●
●●
●●
●
● ●
●
●
●
●
●
●
●
●
●
●
●
●
●
●
●
●
●
●
●
●
●
●
●●
●
●
●
●
●
●
●
●
●
●
●
●
●
●
●
●
●
●
●
●
●
●
●
●
●
●
●
●
●
●
●
●●
●
●
●
●
●
●
●
●●
●
●
●
●
●
●
●
●
●●●
● ●
●
●
●
●
●●
●
●
●
●
●
●
●
●
●
●
●
●
●
●
●
● ●
●●
●
●
●
●
●
●
●●
●
●
●
●
●
● ●
●
●●
●
●
●
●
●
●
●●
●●●
●
●●
●
●
●
●
●
●
●
●●
●
●
●
●
●
●
●
●
●
●
●
●●●
●
● ●
●●●
●
●
●
●
●
●
●
●
●
●●
●
●
● ●●
● ●
●
●
●
●
●
●
●
●●●
●
●
●
●
●
●●
●
●
●
●
●
●
●
●
●
●
●
●
●
●
●
●
●
●
●
●
● ●
●
●
●●
●
●●
● ●
●
●
●
●
●
●
●
●
●
●
●
●
●
●
●●
●
●
●
● ●
●
●
●
●
●
●
●
●
●
●
●
●
●
●
●
●
●
●
●
●●
●
●
●
●
●
●
●
●
●
●
●
●
●
●
●
●
●
●
●
●
10
20
30
0 10 20MinTemp
Max
Tem
p
http: // togaware. com Copyright© 2013, [email protected] 11/34
Introduction to R Simple Plots
Scatterplot—RStudio
http: // togaware. com Copyright© 2013, [email protected] 12/34
Introduction to R Installing Packages
Missing Packages–Tools→Install Packages. . .
http: // togaware. com Copyright© 2013, [email protected] 13/34
Introduction to R Installing Packages
RStudio—Installing ggplot2
http: // togaware. com Copyright© 2013, [email protected] 14/34
Introduction to R RStudio Shortcuts
RStudio—Keyboard Shortcuts
These will become very useful!
Editor:
Ctrl-Enter will send the line of code to the R consoleCtrl-2 will move the cursor to the Console
Console:
UpArrow will cycle through previous commandsCtrl-UpArrow will search previous commandsTab will complete function names and list the argumentsCtrl-1 will move the cursor to the Editor
Your turn: try them out.
http: // togaware. com Copyright© 2013, [email protected] 15/34
Introduction to R Basic R Commands
Basic R
library(rattle) # Load the weather dataset.
head(weather) # First 6 observations of the dataset.
## Date Location MinTemp MaxTemp Rainfall Evapora...
## 1 2007-11-01 Canberra 8.0 24.3 0.0 ...
## 2 2007-11-02 Canberra 14.0 26.9 3.6 ...
## 3 2007-11-03 Canberra 13.7 23.4 3.6 ...
....
str(weather) # Struncture of the variables in the dataset.
## 'data.frame': 366 obs. of 24 variables:
## $ Date : Date, format: "2007-11-01" "2007-11-...
## $ Location : Factor w/ 46 levels "Adelaide","Alba...
## $ MinTemp : num 8 14 13.7 13.3 7.6 6.2 6.1 8.3 ...
....
http: // togaware. com Copyright© 2013, [email protected] 16/34
Introduction to R Basic R Commands
Basic R
summary(weather) # Univariate summary of the variables.
## Date Location MinTemp ...
## Min. :2007-11-01 Canberra :366 Min. :-5.30 ...
## 1st Qu.:2008-01-31 Adelaide : 0 1st Qu.: 2.30 ...
## Median :2008-05-01 Albany : 0 Median : 7.45 ...
## Mean :2008-05-01 Albury : 0 Mean : 7.27 ...
## 3rd Qu.:2008-07-31 AliceSprings : 0 3rd Qu.:12.50 ...
## Max. :2008-10-31 BadgerysCreek: 0 Max. :20.90 ...
## (Other) : 0 ...
## Rainfall Evaporation Sunshine WindGust...
## Min. : 0.00 Min. : 0.20 Min. : 0.00 NW : ...
## 1st Qu.: 0.00 1st Qu.: 2.20 1st Qu.: 5.95 NNW : ...
## Median : 0.00 Median : 4.20 Median : 8.60 E : ...
## Mean : 1.43 Mean : 4.52 Mean : 7.91 WNW : ...
## 3rd Qu.: 0.20 3rd Qu.: 6.40 3rd Qu.:10.50 ENE : ...
....
http: // togaware. com Copyright© 2013, [email protected] 17/34
Introduction to R Visualising Data
Visual Summaries—Add A Little Colour
qplot(Humidity3pm, Pressure3pm, colour=RainTomorrow, data=ds)
●
●
●●
●
●●
●
●
●●
●
●
●●
●
●
●●
●
●
●
●
●●
●
●
●
●
●
●
●
●
●
●
●
●●
●
●
●
●●
●
●
●
●
●
●
●
●
●
●●
●
●
●
●
●
●●
●
●
●
●
●
●
●
●
●
●
●
●
●
●
●
●
●
●
●
●
●
●
●
●
●
●
●
●
●
●
●
●
●
●
●
●
●
●
●
●
●●
●
●
●
●
●
●
●
●
●
●
●
●
●
●●
●
●
●
●
●
●
●
●
●
●
●
●
●
●
●●
●●
● ●
● ●
●
●
●
●
●
●
●
●
●
●
●
●
●
●
●
●
●
● ●
●
●
●
●
●
●
●
●●
●
●
●
●
●
●
●
●
●
●
●
●
●
●
●
● ●
●
●
●●
●
●●
●
●
●●
●
●
●
●
●
●
●
●
●
●
●
●
●
●
●
●
●
●
● ●
●
●
●
●
●
●
●
●
●
●
●
●
●
●
●
●●
●
●
●
●
●
●
●
●
●
●
●
●
●
●
●
●
●
●
●
●
●
●
●
●
●
●
●
●
●
●
●
●
●
●
●
●
●
●
●
●
●
●
●
● ●
●
●
●
● ●
●
●
●
●
●
●●
●●
●
●
●
●
●
●
●
●
●●
●
●
●
●
●
●
●
●
●
●
●
●
●
●
●●
●
●
●
●
●
●
●
●
●
●
●
●
●
●
●
●
●
●
●
●
●●
●
●
●
●
●
●
●
●
●
●
●
●
●
●
●
●
●●
●
●●
●
●
●
●
●
995
1005
1015
1025
1035
25 50 75 100Humidity3pm
Pres
sure
3pm
RainTomorrow
●
●
No
Yes
http: // togaware. com Copyright© 2013, [email protected] 18/34
Introduction to R Visualising Data
Visual Summaries—Careful with Categorics
qplot(WindGustDir, Pressure3pm, data=ds)
●
●
●●
●
●●
●
●
●●
●
●
●●
●
●
●●
●
●
●
●
●●
●
●
●
●
●
●
●
●
●
●
●
●●
●
●
●
●●
●
●
●
●
●
●
●
●
●
●●
●
●
●
●
●
●●
●
●
●
●
●
●
●
●
●
●
●
●
●
●
●
●
●
●
●
●
●
●
●
●
●
●
●
●
●
●
●
●
●
●
●
●
●
●
●
●
●●
●
●
●
●
●
●
●
●
●
●
●
●
●
● ●
●
●
●
●
●
●
●
●
●
●
●
●
●
●
●●
●●
●●
●●
●
●
●
●
●
●
●
●
●
●
●
●
●
●
●
●
●
●●
●
●
●
●
●
●
●
●●
●
●
●
●
●
●
●
●
●
●
●
●
●
●
●
● ●
●
●
●●
●
●●
●
●
●●
●
●
●
●
●
●
●
●
●
●
●
●
●
●
●
●
●
●
● ●
●
●
●
●
●
●
●
●
●
●
●
●
●
●
●
●●
●
●
●
●
●
●
●
●
●
●
●
●
●
●
●
●
●
●
●
●
●
●
●
●
●
●
●
●
●
●
●
●
●
●
●
●
●
●
●
●
●
●
●
●●
●
●
●
● ●
●
●
●
●
●
●●
● ●
●
●
●
●
●
●
●
●
●●
●
●
●
●
●
●
●
●
●
●
●
●
●
●
●●
●
●
●
●
●
●
●
●
●
●
●
●
●
●
●
●
●
●
●
●
●●
●
●
●
●
●
●
●
●
●
●
●
●
●
●
●
●
●●
●
●●
●
●
●
●
●
995
1005
1015
1025
1035
N NNE NE ENE E ESE SE SSE S SSW SW WSW W WNW NW NNW NAWindGustDir
Pres
sure
3pm
http: // togaware. com Copyright© 2013, [email protected] 19/34
Introduction to R Visualising Data
Visual Summaries—Add A Little Jitter
qplot(WindGustDir, Pressure3pm, data=ds, geom="jitter")
●
●
●●
●
●●
●
●
●●
●
●
●
●
●
●
●●
●
●
●
●
●●
●
●
●
●
●
●
●
●
●
●
●
●●
●
●
●
●●
●
●
●
●
●
●
●
●
●
●●
●
●
●
●
●
●●
●
●
●
●
●
●
●
●
●
●
●
●
●
●
●
●
●
●
●
●
●
●
●
●
●
●
●
●
●
●
●
●
●
●
●
●
●
●
●
●
●●
●
●
●
●
●
●
●
●
●
●
●
●
●
● ●
●
●
●
●
●
●
●
●
●
●
●
●
●
●
●●
●●
●●
●●
●
●
●
●
●
●
●
●
●
●
●
●
●
●
●
●
●
●●
●
●
●
●
●
●
●
●●
●
●
●
●
●
●
●
●
●
●
●
●
●
●
●
● ●
●
●
●●
●
●●
●
●
●●
●
●
●
●
●
●
●
●
●
●
●
●
●
●
●
●
●
●
● ●
●
●
●
●
●
●
●
●
●
●
●
●
●
●
●
●●
●
●
●
●
●
●
●
●
●
●
●
●
●
●
●
●
●
●
●
●
●
●
●
●
●
●
●
●
●
●
●
●
●
●
●
●
●
●
●
●
●
●
●
●●
●
●
●
● ●
●
●
●
●
●
●●
●●
●
●
●
●
●
●
●
●
●●
●
●
●
●
●
●
●
●
●
●
●
●
●
●
●●
●
●
●
●
●
●
●
●
●
●
●
●
●
●
●
●
●
●
●
●
●●
●
●
●
●
●
●
●
●
●
●
●
●
●
●
●
●
●●
●
●●
●
●
●
●
●
995
1005
1015
1025
N NNE NE ENE E ESE SE SSE S SSW SW WSW W WNW NW NNW NAWindGustDir
Pres
sure
3pm
http: // togaware. com Copyright© 2013, [email protected] 20/34

Introduction to R Visualising Data
Visual Summaries—And Some Colour
qplot(WindGustDir, Pressure3pm, data=ds, colour=WindGustDir, geom="jitter")
●
●
●●
●
●●
●
●
●●
●
●
●
●
●
●
●●
●
●
●
●
●●
●
●
●
●
●
●
●
●
●
●
●
●●
●
●
●
●●
●
●
●
●
●
●
●
●
●
●
●
●
●
●
●
●
●
●
●
●
●
●
●
●
●
●
●
●
●
●
●
●
●
●
●
●
●
●
●
●
●
●
●
●
●
●
●
●
●
●
●
●
●
●
●
●
●
●
●●
●
●
●
●
●
●
●
●
●
●
●
●
●
● ●
●
●
●
●
●
●
●
●
●
●
●
●
●
●
●●
●●
●●
●●
●
●
●
●
●
●
●
●
●
●
●
●
●
●
●
●
●
●●
●
●
●
●
●
●
●
●●
●
●
●
●
●
●
●
●
●
●
●
●
●
●
●
● ●
●
●
●●
●
●●
●
●
●●
●
●
●
●
●
●
●
●
●
●
●
●
●
●
●
●
●
●
● ●
●
●
●
●
●
●
●
●
●
●
●
●
●
●
●
●●
●
●
●
●
●
●
●
●
●
●
●
●
●
●
●
●
●
●
●
●
●
●
●
●
●
●
●
●
●
●
●
●
●
●
●
●
●
●
●
●
●
●
●
●●
●
●
●
● ●
●
●
●
●
●
●●
● ●
●
●
●
●
●
●
●
●
●●
●
●
●
●
●
●
●
●
●
●
●
●
●
●
●●
●
●
●
●
●
●
●
●
●
●
●
●
●
●
●
●
●
●
●
●
●●
●
●
●
●
●
●
●
●
●
●
●
●
●
●
●
●
●●
●
●●
●
●
●
●
●
1005
1015
1025
1035
N NNE NE ENE E ESE SE SSE S SSW SW WSW W WNW NW NNW NAWindGustDir
Pres
sure
3pm
http: // togaware. com Copyright© 2013, [email protected] 21/34
Introduction to R Help
Getting Help—Precede Command with ?
http: // togaware. com Copyright© 2013, [email protected] 22/34
Knitting
Overview
1 R Tool Suite
2 RStudio
3 Introduction to R
4 Knitting
http: // togaware. com Copyright© 2013, [email protected] 23/34
Knitting Our First KnitR Document
Create a KnitR Document: New→R Sweave
http: // togaware. com Copyright© 2013, [email protected] 24/34
Knitting Our First KnitR Document
Setup KnitR
We wish to use KnitR rather than the older Sweave processor
In RStudio we can configure the options to use knitr:
Select Tools→Options
Choose the Sweave group
Choose knitr for Weave Rnw files using:
The remaining defaults should be okay
Click Apply and thenOK
http: // togaware. com Copyright© 2013, [email protected] 25/34
Knitting Our First KnitR Document
Simple KnitR Document
Insert the following into your new KnitR document:
\title{Sample KnitR Document}
\author{Graham Williams}
\maketitle
\section*{My First Section}
This is some text that is automatically typeset
by the LaTeX processor to produce well formatted
quality output as PDF.
Your turn—Click Compile PDF to view the result.
http: // togaware. com Copyright© 2013, [email protected] 26/34
Knitting Our First KnitR Document
Simple KnitR Document
http: // togaware. com Copyright© 2013, [email protected] 27/34
Knitting Our First KnitR Document
Simple KnitR Document—Resulting PDF
Result of Compile PDF
http: // togaware. com Copyright© 2013, [email protected] 28/34
Knitting Including R Commands in KnitR
KnitR: Add R Commands
R code can be used to generate results into the document:
<<echo=FALSE, message=FALSE>>=
library(rattle) # Provides the weather dataset
library(ggplot2) # Provides the qplot() function
ds <- weather
qplot(MinTemp, MaxTemp, data=ds)
@
Your turn—Click Compile PDF to view the result.
http: // togaware. com Copyright© 2013, [email protected] 29/34
Knitting Including R Commands in KnitR
KnitR Document With R Code
http: // togaware. com Copyright© 2013, [email protected] 30/34

Knitting Including R Commands in KnitR
Simple KnitR Document—Resulting PDF with
Plot
Result of Compile PDF
http: // togaware. com Copyright© 2013, [email protected] 31/34
Knitting Basics Cheat Sheet
LaTeX Basics
\subsection*{...} % Introduce a Sub Section
\subsubsection*{...} % Introduce a Sub Sub Section
\textbf{...} % Bold font
\textit{...} % Italic font
\begin{itemize} % A bullet list
\item ...
\item ...
\end{itemize}
Plus an extensive collection of other markup and capabilities.
http: // togaware. com Copyright© 2013, [email protected] 32/34
Knitting Basics Cheat Sheet
KnitR Basics
echo=FALSE # Do not display the R code
eval=TRUE # Evaluate the R code
results="hide" # Hide the results of the R commands
fig.width=10 # Extend figure width from 7 to 10 inches
fig.height=8 # Extend figure height from 7 to 8 inches
out.width="0.8\\textwidth" # Fit figure 80% page width
out.height="0.5\\textheight" # Fit figure 50% page height
Plus an extensive collection of other options.
http: // togaware. com Copyright© 2013, [email protected] 33/34
Disseminate Research in R – Ensembles and wsrf
Tutorial Overview
1 Motivating R – A Language for Data Mining
2 Data Mining in R – Hands-on Rattle GUI
3 Programming Data in R – Scripting our Analyses
4 Disseminate Research in R – Ensembles and wsrf
http: // togaware. com Copyright© 2013, [email protected] 6/7
Publishing Research Through R
Case Study – Ensembles in R
Major advances in Data Mining
The best off-the-shelf technologyincludes random forests, boosting andsupport vector machines?
Available for investigation nowthrough open source solutions, withclosed source tools catching up.
http: // togaware. com Copyright© 2013, [email protected] 16/28
Publishing Research Through R
Introducing Random Forests
Research with Shenzhen Institutes of Advanced Technology,Chinese Academy of Sciences
Random forests are a popular classification method building anensemble of a single type of decision tree.
It is unsurpassed in accuracy among current algorithms.
Algorithmically intuitive and simple.
It is used widely in numerous research domains includingbioinformatics, image classification, text classification.
http: // togaware. com Copyright© 2013, [email protected] 17/28
Publishing Research Through R
Random Forests Algorithm
Build many decision trees (e.g., 500).
For each tree:
Select a random subset of the training set (N);Choose different subsets of features for each node of thedecision tree (m << M);Build the tree without pruning (i.e., overfit)
Classify a new entity using every decision tree:
Each tree “votes” for the entity.The decision with the largest number of votes wins!The proportion of votes is the resulting score.
http: // togaware. com Copyright© 2013, [email protected] 18/28
Publishing Research Through R
Using Weighted Variable Subspaces
Performance of a random forest is improved by
Strengthening each treeReducing correlation between each tree
Problem of large number of variables:
Random selection means too many irrelevant variables
Introduce the concept of weighted subspace random forests
Bias the selection of variables toward most important variables
http: // togaware. com Copyright© 2013, [email protected] 19/28
Publishing Research Through R
Datasets
(From International Journal of Data Warehousing and Mining 2012)
http: // togaware. com Copyright© 2013, [email protected] 20/28
Publishing Research Through R
Comparison of Strength vs Features
(From International Journal of Data Warehousing and Mining 2012)
http: // togaware. com Copyright© 2013, [email protected] 21/28
Publishing Research Through R
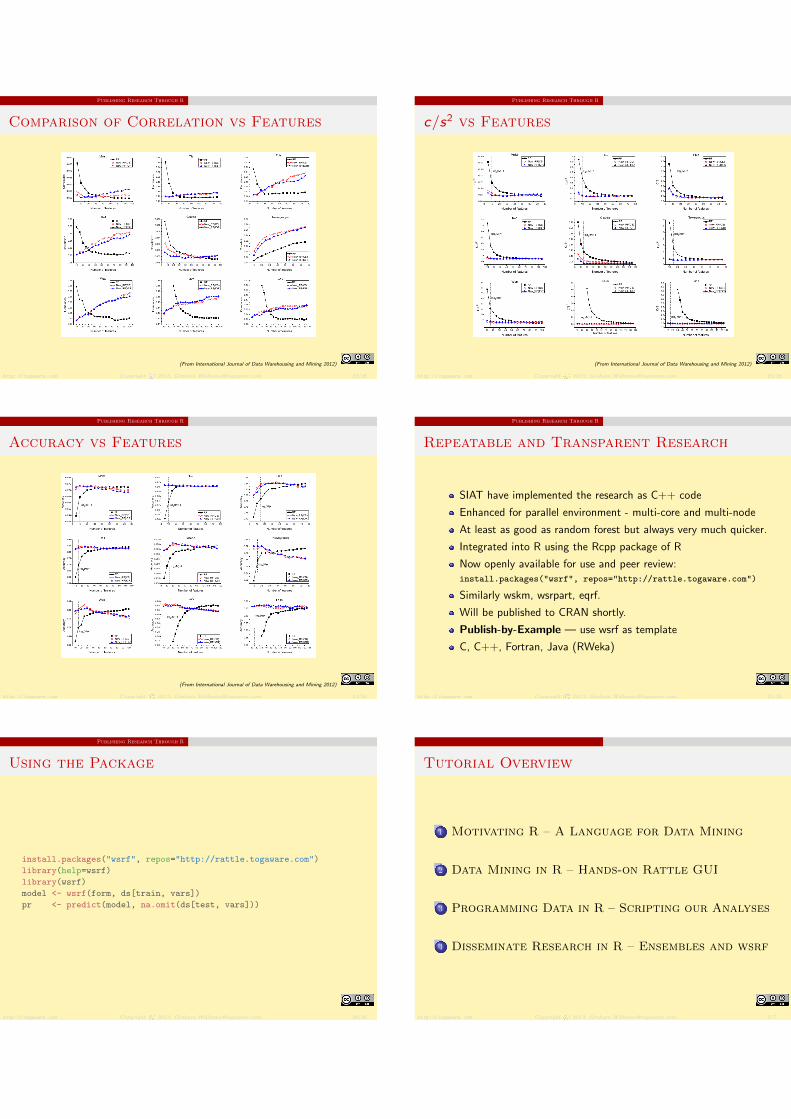
Comparison of Correlation vs Features
(From International Journal of Data Warehousing and Mining 2012)
http: // togaware. com Copyright© 2013, [email protected] 22/28
Publishing Research Through R
c/s2 vs Features
(From International Journal of Data Warehousing and Mining 2012)
http: // togaware. com Copyright© 2013, [email protected] 23/28
Publishing Research Through R
Accuracy vs Features
(From International Journal of Data Warehousing and Mining 2012)
http: // togaware. com Copyright© 2013, [email protected] 24/28
Publishing Research Through R
Repeatable and Transparent Research
SIAT have implemented the research as C++ code
Enhanced for parallel environment - multi-core and multi-node
At least as good as random forest but always very much quicker.
Integrated into R using the Rcpp package of R
Now openly available for use and peer review:install.packages("wsrf", repos="http://rattle.togaware.com")
Similarly wskm, wsrpart, eqrf.
Will be published to CRAN shortly.
Publish-by-Example — use wsrf as template
C, C++, Fortran, Java (RWeka)
http: // togaware. com Copyright© 2013, [email protected] 25/28
Publishing Research Through R
Using the Package
install.packages("wsrf", repos="http://rattle.togaware.com")
library(help=wsrf)
library(wsrf)
model <- wsrf(form, ds[train, vars])
pr <- predict(model, na.omit(ds[test, vars]))
http: // togaware. com Copyright© 2013, [email protected] 26/28
Tutorial Overview
1 Motivating R – A Language for Data Mining
2 Data Mining in R – Hands-on Rattle GUI
3 Programming Data in R – Scripting our Analyses
4 Disseminate Research in R – Ensembles and wsrf
http: // togaware. com Copyright© 2013, [email protected] 2/7
Moving Into R Resources
Resources and References
OnePageR: http://onepager.togaware.com – Tutorial Notes
Rattle: http://rattle.togaware.com
Guides: http://datamining.togaware.com
Practise: http://analystfirst.com
Book: Data Mining using Rattle/R
Chapter: Rattle and Other Tales
Paper: A Data Mining GUI for R — R Journal, Volume 1(2)
http: // togaware. com Copyright© 2013, [email protected] 36/37
That Is All Folks Time For Questions
Thank You
Question Time
This document, sourced from AusDMTutorial.Rnw revision 269, was processed by KnitR version 1.4.9 of 2013-08-10 and took 0.9 seconds toprocess. It was generated by gjw on nyx running Ubuntu 13.10 with Intel(R) Xeon(R) CPU W3520 @ 2.67GHz having 4 cores and 12.3GB of
RAM. It completed the processing 2013-11-12 20:15:52.
http: // togaware. com Copyright© 2013, [email protected] 7/7