why do east asian children perform so well in pisa? an ... · pdf file1 why do east asian...
TRANSCRIPT
1
Why do East Asian children perform so well in
PISA? An investigation of Western-born children of
East Asian descent
John Jerrim
Institute of Education, University of London
October 2014
http://johnjerrim.com/papers/
Abstract
A small group of high-performing East Asian economies dominate the top of the Programme
for International Student Assessment (PISA) rankings. This has caught the attention of Western
policymakers, who want to know why East Asian children obtain such high PISA scores, and
what can be done to replicate their success. In this paper I investigate whether children of East
Asian descent, who were born and raised in a Western country (Australia), also score highly
on the PISA test. I then explore whether their superior performance (relative to children of
Australian heritage) can be explained by reasons often given for East Asian students’
extraordinary educational achievements. My results suggest that second-generation East Asian
immigrants outperform their native Australian peers in mathematics by more than 100 PISA
test points – the equivalent of two and a half years of schooling. Moreover, the magnitude of
this achievement gap has increased substantially over the last ten years. Yet there is no ‘silver
bullet’ that can explain why East Asian children excel academically. Rather a combination of
factors, each making their own independent contribution, seem to be at play. Western
policymakers should therefore appreciate that it may only be possible to catch the leading East
Asian economies in the PISA rankings with widespread cultural change.
Key Words: PISA, East Asia, second-generation immigrants.
Contact Details: John Jerrim ([email protected]) Department of Quantitative Social
Science, Institute of Education, University of London, 20 Bedford Way London, WC1H 0AL
2
1. Introduction
The Programme for International Student Assessment (PISA) is a major cross-national study
of school pupils’ academic achievement. Since its launch in 2000, it has received an
unprecedented amount of academic, media and public policy attention. Countries now
eagerly await the tri-annual update from the Organisation for Economic Co-operation and
Development (OECD) – the survey organisers - with particular interest in whether they have
moved up or slid down the international rankings. Yet it now comes as little surprise when a
small group of high-performing East Asian jurisdictions dominate the top spots, having
consistently out-performed their Western competitors over the last decade and a half (and
longer in other large-scale educational assessments such as the Trends in Mathematics and
Science Study – TIMSS). Indeed, results from PISA 2012 suggest that the achievement gap
between East and West remains as large as ever. This is particularly true in mathematics,
where children in Shanghai, Singapore, South Korea and Hong Kong outscore their
American, British and Australian counterparts by, on average, more than 40 test points
(equivalent to more than one whole year of schooling).
Educational policymakers in the Western world have consequently begun to look East
with an envious glare. Why are children in East Asia so much better at maths than us, and
what can we do to catch up? Unfortunately, due to the sheer number of possible explanations,
these are not straightforward questions to answer. Potential candidates include teacher
selection and quality (OECD 2013), teaching methods (Leung 2006), work ethic (Kim 2005;
Byun and Park 2012), ‘tiger’ parenting (Fu and Markus 2014), extensive out-of-school tuition
(Bray and Kwok 2003), genetics / natural ability (Uttal 1997; Lynn and Meisenberg 2010),
the value East Asian families place upon education (Francis and Archer 2005), the design of
the school curriculum (Wu and Zhang 2006; Department for Education 2012), along with
several others (including suggestions that this is due to foul play in the PISA tests – Time
magazine 2013; The Economist 2014). Teasing out the combination of these factors driving
East Asian educational success is not an easy task, with implications and policy
recommendations for Western governments even less clear. Yet this has not stopped
authoritative figures such as Andreas Schleicher (head of the OECD PISA programme)
making strong suggestions about ‘What Asian schools can teach the rest of the world1’ (CNN
2013) highlighting the explanations that the OECD believe are key.
1 http://edition.cnn.com/2013/12/03/opinion/education-rankings-commentary-schleicher/
3
Difficulties in isolating why East Asian children excel academically perhaps reveal
one of the main limitations of cross-national comparative assessments such as PISA.
Although they are very effective ‘benchmarking’ tools, helping us to understand the
magnitude of the achievement gap between different countries, they are limited in their
ability to inform policymakers as to why this is the case (and what, therefore, should be done
about it). Consequently, most attempts to explain East Asian success in PISA (including
those ventured by the OECD) have relied heavily upon anecdotal evidence, where one simply
tries to identify common patterns across such high-performing jurisdictions. Prominent
examples include reports by Grattan Institute (2012) in Australia, the Department for
Education (2012) in England, and Tucker (2011) in the United States. This is also common
practice by the OECD, which at the release of PISA 2012 pointed towards anecdotal evidence
that selection and training of teachers was a common feature amongst the top performing
countries – implying that this was key to their success:
‘Top performers, notably in Asia, place great emphasis on selecting and training
teachers, encourage them to work together and prioritise investment in teacher quality, not
classroom sizes’ (OECD 2013)
Yet, in reality, evidence in support of such broad statements is often mixed, with few
common patterns actually found across most high-performing jurisdictions (Micklewright et
al 2014). Indeed, such an approach seems doomed to failure, given the limited number of
‘observations’ (countries) available, the large number of potential confounding factors, and
the possibility of encountering the ecological fallacy (making spurious conclusions about
individuals when examining correlations at the group level).
This paper is also concerned with the academic success of East Asian children in
PISA – but takes a rather different approach. Specifically, it provides a case study of second-
generation East Asian immigrants living in Australia. These children are born and raised in a
Western country, and have thus been through its educational system (which scored around the
OECD average in the PISA 2012 tests), curriculum and institutional structures. Yet their
parents originated from a high-performing East Asian jurisdiction – bringing their culture and
values with them. Thus a large part of the home and family environment experienced by these
children will reflect their East Asian heritage (despite them being Australian nationals and
http://oecdinsights.org/2013/12/03/asias-students-storm-pisa-
2012/?utm_source=rss&utm_medium=rss&utm_campaign=asias-students-storm-pisa-2012

4
attending Australian schools). As East Asian educational success is often thought to be linked
to cultural factors (e.g. the value placed upon education, willingness to invest in out-of-school
tuition, instilling a hard-work ethic in their children, high aspirations) one might expect
second-generation East Asian immigrants to outperform their native-Australian peers in the
PISA maths test2. A key aim of this paper is to establish whether this is indeed the case, and
the extent to which such differences in PISA maths performance can be explained by some
reasons frequently given for East Asian students’ high levels of academic achievement.
Australia provides the ideal setting in which to conduct this research. Culturally, it is very
close to the West, sharing economic, political, historical and linguistic ties with Europe
(particularly the United Kingdom) and North America. Moreover, like many Western
countries, its recent PISA performance has been disappointing, with average maths test scores
falling from 524 in 2003 to 504 in 2012. Yet, geographically, Australia sits close to the East,
with it being a prominent destination of East Asian migrants over a prolonged period of time.
This, coupled with the large Australian PISA sample3, ensures a sufficient number of
observations to make research into Western-born children of East Asian descent possible.
My results illustrate how Australian children with East Asian parents outperform their
native Australian peers by an average of more than 100 PISA test points (equivalent to two
and a half years of schooling). Moreover, while PISA test scores of native Australians
declined substantially between 2003 and 2012, the scores of children with East Asian heritage
improved rapidly. Yet there is little evidence that one single factor (a ‘silver bullet’) is able
to explain the exceptionally high PISA test scores obtained by this group. Rather a series of
factors combine, each making their own independent contribution. This includes selection of
high quality schools, the high value placed upon education, willingness to invest in out-of-
school tuition, a hard work ethic and holding high aspirations for the future. Consequently,
Western policymakers should not expect there to be an easy way to replicate East Asian
students’ extraordinary educational success. The reality is that this may only be possible over
the very long-term, requiring a cultural shift where all families instil a strong belief in the
2 We define a child as a ‘native Australian’ if they and both their parents are born in Australia. 3 In most countries, a sample of 150 schools is selected to participate in PISA – with 35 pupils
randomly selected from within each. In PISA 2012, the Australian sample was increased to 775
schools to allow comparisons between the various Australian states.

5
value of education amongst their children (along with the realisation that hard work and
sacrifice may be needed to achieve it).
The paper now proceeds as follows. Section 2 describes the Australian PISA 2012 data,
with section 3 outlining my empirical methodology. Section 4 compares PISA maths test
scores of Australian natives to those of second-generation East Asian immigrants. This
includes a detailed investigation of whether any differences found can be explained by
reasons commonly given for East Asian children’s exceptionally high levels of academic
achievement. Discussion and conclusions follow in section 5.
2. Data
The Programme for International Student Assessment (PISA) is a cross-national study of 15-
yearold children’s academic achievement. Since 2000, it has been conducted every three
years by the OECD, with the 2012 round including approximately half a million children
from 65 economies. This paper focuses upon the Australian data collected as part of PISA
2012 (downloadable from http://www.acer.edu.au/ozpisa/the-australian-pisa-data-files). A
total of 828 Australian schools were selected, with probability proportional to size, to
participate in the study. Within each of these sampled schools, 20 pupils were randomly
selected to sit the PISA test4. School and pupil response rates were 98 percent and 87 percent
respectively. The final Australian sample comprised 14,481 pupils from 775 schools,
including 276 second-generation East Asian immigrants. Survey and Balanced Repeated
Replication (BRR) weights are provided by the survey organisers to adjust for the complex
survey design (e.g. stratification and the clustering of pupils within schools) and to correct
estimates for the small amount of non-random non-response.
The PISA test covers three academic domains (mathematics, reading and science) and
took two hours to complete. All questions and test procedures have been designed with cross-
national comparability in mind, with the survey organisers having strict protocols for
translation, sampling, response rates and testing procedures. The focus of PISA 2012 was
children’s maths skills, and is the domain of interest in this paper. Five ‘plausible values’
have been produced by the survey organisers using a Rasch model, each representing a
4 This represented a change from previous PISA cycles in Australia, where 48 pupils were randomly
selected within each school. All age-eligible Indigenous students were also included in the sample to
ensure a sufficient number of observations to allow analysis by this sub-group.
6
different estimate of children’s ‘true’ proficiency in mathematics. These plausible values all
have a mean of approximately 500 and a standard deviation of approximately 100 across
OECD countries, with 40 PISA points being roughly equal to an additional year of schooling
(OECD 2010: 110). Recommended practice is followed when analysing these data (OECD
2009), with five separate estimates of the statistic of interest produced (once using each of the
plausible values) and then an average of these estimates taken. To aid interpretation of
results, regression model estimates will be presented in terms of international standard
deviations.
As part of PISA, children complete a background questionnaire. This included a question
about the country of birth of the child, their mother and their father. Tick-box options were
provided for the major countries of birth within the Australian population (e.g. Australia,
New Zealand, England, China, the Philippines) with an open text field available for those
who indicated the ‘other’ category. At least 96 percent of respondents provided valid answers
to each of these questions, with specific country of birth provided in the Australian national
dataset5.
A child is defined as an Australian native if they and both their parents were born in
Australia6. In contrast, a child is defined as a second-generation immigrant from a high-
performing East Asian country if they were born in Australia, and at least one of their parents
were born in the following countries7:
Hong Kong
Japan
Singapore
China
5 Such information is not available in the international database provided on the OECD website. It is
also not available for most of the countries that participate in the PISA study (at least at such a fine
level of detail). 6 Indigenous children (who form approximately three percent of the Australian population) have been
excluded from the analysis. My experimentations suggest that this sample restriction has little impact
upon the substantive conclusions reached. 7 Of the children defined as a second-generation immigrant from a high-performing East Asian
jurisdiction, 68 percent reported both of their parents being born in one of the countries listed.
Nineteen percent reported just their mother being born in a high-performing country, and 10 percent
just their father. Around 80 percent of the high-performing second-generation East Asian group have
at least one parent born in China.

7
Republic of Korea (South Korea)
Taiwan
These origin countries have been chosen as they represent the group of high-performing East
Asian nations consistently found at the top of the PISA and TIMSS maths rankings8. Note
that children in both groups were born in Australia and were attending an Australian school at
age 15. It therefore does not seem unreasonable to assume that the majority have been
educated within the Australian schooling system.
My primary concern is differences in PISA maths scores between these two groups.
However, it is important to recognise that migrants are self-selecting (Borjas 1988) and thus
on average ‘more able, ambitious, aggressive, entrepreneurial or otherwise more favourably
selected than similar individuals who chose to remain in their place of origin’ (Chiswick
1999:181). Significantly, the same characteristics are also likely to be associated with their
offsprings’ academic achievement9. One may therefore question: are the high test scores of
second-generation East Asian immigrants simply reflecting the selective nature of this group?
I explore this possibility in two ways. First, I investigate whether large differences in
PISA scores persist after controlling for differences in observable characteristics (e.g. gender,
parental education, social class, wealth, geographic location). This will thus account for the
fact that second-generation East Asian children typically have more educated parents, are
more likely to be male and more likely to live in Victoria than the native Australian group
(see Table 1). Of course, there are a host of other potentially important characteristics of
immigrant families (e.g. drive, determination, aspiration) which are unobserved and cannot
be controlled. I therefore also compare second-generation East Asian immigrants to other
migrant groups. The intuition is that immigrants from other regions/countries will have been
through a similar migration decision-making process and met the same entry requirements (in
8 One might argue that Vietnam could also be included in this group, given this country’s relatively
strong performance in PISA 2012. However, the decision was made to exclude this country from the
‘high-performing’ group as, although its PISA maths score (511) was above that of many Western
countries (including the United Kingdom, Australia and the United States) it remained significantly
below the leading East Asian nations such as Singapore (573), Hong Kong (561), South Korea (554)
and Japan (536).
9 In other words, more able and ambitious individuals are not only more likely to migrate, but are also
more likely to ensure their children works hard and achieves highly in school.

8
terms of the skills needed to enter the country) as immigrants from high-performing East
Asian countries. Consequently, they are also likely to be similar in terms of unobservable
factors driving migrant self-selection (e.g. drive, ambition, motivation). Thus, if PISA scores
of second-generation East Asian immigrants are also high relative to second-generation
immigrants from other countries, it becomes increasingly unlikely that their exceptional
educational performance can be solely attributable to the self-selected nature of this group.
Second-generation immigrants from three other regions/countries are therefore also
considered. The first is formed of children whose parents were born in another (not high-
performing) East Asian country:
Malaysia
Philippines
Indonesia
Thailand
Cambodia
Vietnam
Laos
Democratic People's Republic of Korea (North Korea).
Second-generation immigrants from these countries form a particularly interesting
comparison group due to their similar ethnic and cultural origins. I also consider second-
generation immigrants where at least one parent was born in India or surrounding countries,
due to similar stereotypes often made regarding the value they (like East Asian families)
place upon their children’s education:
India
Pakistan
Nepal
Bangladesh
Finally, I also consider second-generation immigrants from the United Kingdom. This
country has historically been the single biggest source of immigration into Australia
(Australian Bureau of Statistics 2013), and has a Western culture and heritage very similar to
the ‘native’ (two Australian parents) group.

9
Children were asked a range of questions about their attitudes towards mathematics,
out-of-school activities, work ethic, parental attitudes and aspirations for the future as part of
the PISA background questionnaire. However, this part of the survey used a ‘rotated-design’,
where randomly selected sub-samples of children were asked different sets of questions.
Specifically, each child randomly received one of three possible questionnaire booklets.
These included a core component (common to all booklets) and a rotated component (which
differed between booklets). The intuition is that this allows a greater breadth of content to be
covered in the background questionnaire, though at the loss of some statistical power. The
main implication is that certain attitudinal items and scales are Missing Completely At
Random (MCAR) for some children by design10. Throughout the analysis Multiple
Imputation by Chained Equations (MICE) is used to take this aspect of the PISA
questionnaire design into account. This ensures that parameter estimates remain unbiased
while maximising statistical power (uncertainty due to missing data is also incorporated into
the estimation of standard errors). I also perform a complete case analysis (where only
observations with all available data are included in the final sample) and a “missing
dummies” analysis (using dummy variables to maintain the full sample but without imputing
any information) to test the robustness of my results. All substantive findings remain largely
unchanged, with further details provided in Appendix A.
The rotated part of the PISA questionnaire included the following question on the
amount of time children study outside of school:
‘Thinking about all school subjects: on average, how many hours do you spend each week on
the following?’ {When answering, include time spent on the weekend too}
With information gathered for six activities (homework set by teachers, ‘guided’ homework,
personal tuition, classes with a commercial company, study with a family member and
repeating content from school lessons on a computer). This was accompanied by a series of
questions designed to capture children’s work ethic, perseverance, self-efficacy, aspirations,
interest, motivation and subjective norms regarding mathematics (among other things). These
typically took the form:
10 This is one of the few occasions where MCAR is an appropriate assumption; one can have
confidence that data are missing completely at random due to the random assignment of questionnaire
booklets to children (i.e. the missing data mechanism is, by design, random).

10
‘I study hard for mathematics quizzes’
Strongly agree
Agree
Disagree
Strongly disagree
With the above being an example from the battery of questions designed to elicit children’s
work ethic. (Appendix B provides full details on the questions asked as part of each scale).
Children’s responses were converted by the survey organisers into scales using a one-parameter
(Rasch) model. To facilitate interpretation of results, I have re-standardised each scale to have
a mean of 0 and standard deviation of 1 within the Australian population. Ensuring the cross-
cultural validity of such scales is a key feature of PISA, with a thorough and closely monitored
translation process and a range of psychometric techniques applied to test for construct validity.
Further details can be found in the PISA 2012 technical report (see OECD 2014).
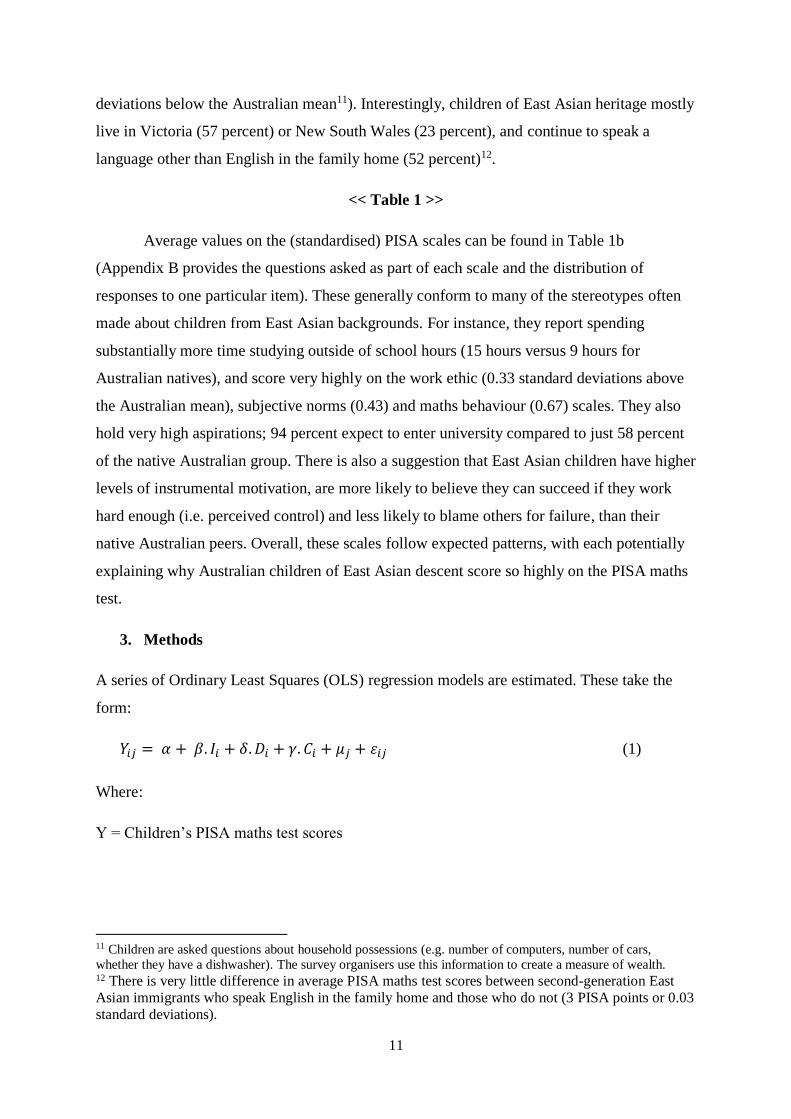
Finally, children were also asked two questions attempting to capture the effort they
put into completing the PISA test. Butler and Adams (2007) describe this ‘effort thermometer’
in detail, with their illustration of the questions asked presented in Figure 1. The intuition is
that, as children and their schools have little riding on the outcome (i.e. PISA is a ‘low-stakes’
assessment), they may not exert maximum effort on the test. The effort thermometer has been
designed to elicit such information from participants. This can then be used to control for
differences in reported test effort between different groups (Australian natives and second-
generation immigrants in this application).
<< Figure 1 >>
Table 1a provides information on the distribution of selected demographic
characteristics for the native and second-generation immigrant samples. There are slightly
more East Asian boys than girls (56 percent) compared to Australian natives (51 percent).
East Asian parents also tend to hold higher levels of education – half of East Asian fathers
hold a university degree compared to just a quarter of Australian natives. Yet there is no
evidence that East Asian parents work in more prestigious occupations (the average of the
International Socio-Economic Index - ISEI - is around 50 for all groups) and actually have
lower levels of the PISA measure of household wealth (their index of wealth is 0.22 standard
11
deviations below the Australian mean11). Interestingly, children of East Asian heritage mostly
live in Victoria (57 percent) or New South Wales (23 percent), and continue to speak a
language other than English in the family home (52 percent)12.
<< Table 1 >>
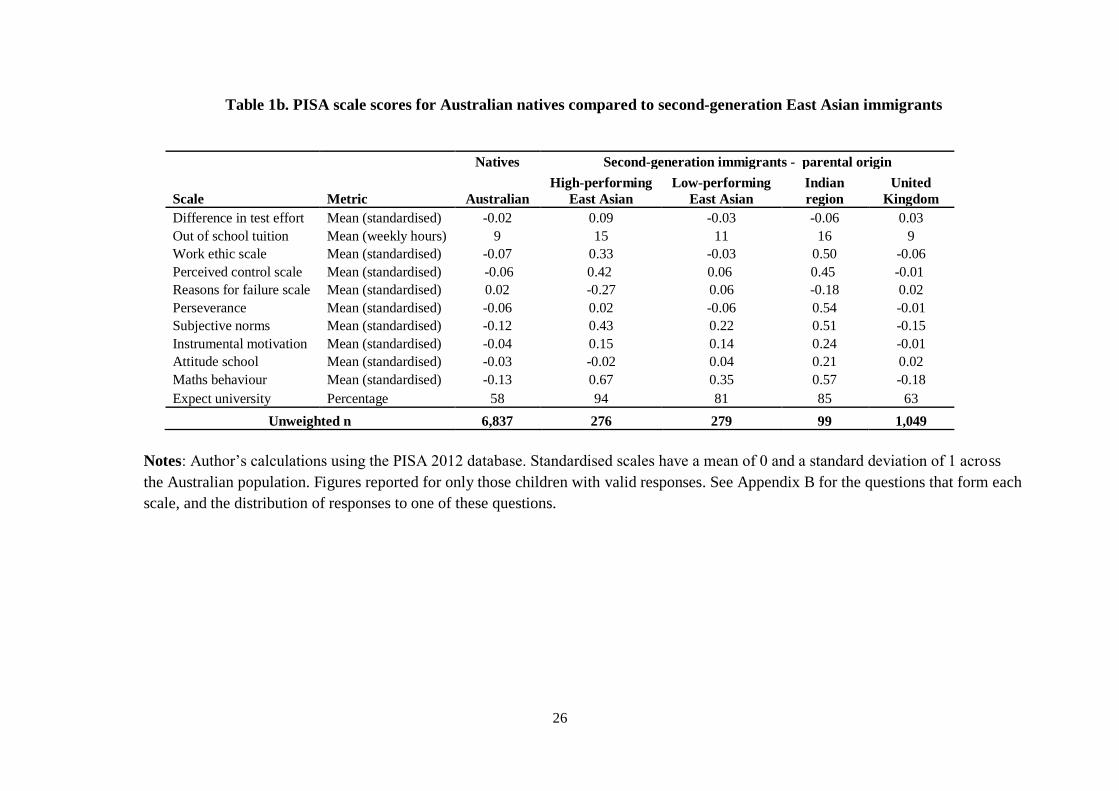
Average values on the (standardised) PISA scales can be found in Table 1b
(Appendix B provides the questions asked as part of each scale and the distribution of
responses to one particular item). These generally conform to many of the stereotypes often
made about children from East Asian backgrounds. For instance, they report spending
substantially more time studying outside of school hours (15 hours versus 9 hours for
Australian natives), and score very highly on the work ethic (0.33 standard deviations above
the Australian mean), subjective norms (0.43) and maths behaviour (0.67) scales. They also
hold very high aspirations; 94 percent expect to enter university compared to just 58 percent
of the native Australian group. There is also a suggestion that East Asian children have higher
levels of instrumental motivation, are more likely to believe they can succeed if they work
hard enough (i.e. perceived control) and less likely to blame others for failure, than their
native Australian peers. Overall, these scales follow expected patterns, with each potentially
explaining why Australian children of East Asian descent score so highly on the PISA maths
test.
3. Methods
A series of Ordinary Least Squares (OLS) regression models are estimated. These take the
form:
𝑌𝑖𝑗 = 𝛼 + 𝛽. 𝐼𝑖 + 𝛿. 𝐷𝑖 + 𝛾. 𝐶𝑖 + 𝜇𝑗 + 휀𝑖𝑗 (1)
Where:
Y = Children’s PISA maths test scores
11 Children are asked questions about household possessions (e.g. number of computers, number of cars,
whether they have a dishwasher). The survey organisers use this information to create a measure of wealth. 12 There is very little difference in average PISA maths test scores between second-generation East
Asian immigrants who speak English in the family home and those who do not (3 PISA points or 0.03
standard deviations).

12
I = A vector of second-generation immigrant dummy variables (reference = Australian-
natives)
D = A vector of demographic characteristics (e.g. age, gender, state, parental education)
C = A series of control variables capturing common explanations for East Asian pupils’
educational success (outlined below)
𝜇 = School-level fixed effects
휀 = Individual random error term
i = Pupil i
j = School j
The following section begins by presenting unconditional differences in PISA maths test
scores between Australian natives and the various second-generation immigrant groups. In
other words, the model presented in (1) is estimated with δ, 𝛾 and µ constrained to 0, and β
the sole parameter of interest.
A series of control variables are then sequentially added to the model, my primary
interest being in how estimates of β change across specifications. First, a vector of
demographic characteristics is included (i.e. δ is now estimated rather than being constrained
to 0). This includes pupil age and gender, maternal and paternal education, occupation and
work status, state of residence, language most often spoken at home and a proxy for
household wealth. Hence β will now capture differences between natives and second-
generation immigrants, having accounted for any possible differences in these basic
demographic characteristics.
A school-level fixed effect is then added in specification 3 (i.e. 𝜇𝑗 is now also
estimated)13. This removes all remaining between-school variation, with β now capturing
differences between Australian natives and second-generation immigrants conditional upon
them attending the same school (as well as having the same demographic characteristics). It
is important to realise that the change in β between the second and third specification will not
13 It is not possible to apply the BRR replicate weights within Stata when a school fixed effect is
included in the model. The clustering of pupils within schools is therefore taken into account via the
application of cluster-robust standard errors.
13
necessarily capture the ‘effect’ of schools (and their contribution to the native-East Asian
achievement gap) per se. Rather it captures a mix of school effects, selection effects (e.g. East
Asian parents choosing higher quality schools for their children) and other previously
unmeasured factors that vary between children attending different schools (e.g.
neighbourhood and peer effects).
From specification 4 onwards, I examine the extent to which a series of factors can
explain within school differences between Australian-natives and second-generation East
Asian children (i.e. reasons why children of East Asian descent outperform children of
Australian heritage, even when they have the same demographic characteristics and attend
the same school). The first of these factors is test effort – are the superior PISA scores of East
Asian children simply a reflection of their determination to perform well on the low-stakes
PISA test? Time spent studying outside of school is then added to the model. This captures
the widely held view that the extra time and money East Asian families invest in out-of-
school tuition is a key reason for their children’s exceptional educational performance.
Alternatively, it is often claimed that East Asian children’s high test scores can partly be
attributed to their work ethic, and a cultural belief that anyone can succeed if they try hard
enough – i.e. that the Western attitude of not being ‘naturally’ good at something (e.g. maths)
is no excuse for failure (Uttal 1997). This possibility is accounted for by controlling the PISA
‘work ethic’, ‘perceived control’, ‘attributions to failure’ and ‘perseverance’ scales14. A
similar intuition holds in subsequent models, where additional variables are added capturing
views that East Asian students’ strong PISA performance is due to their high aspirations,
parental attitudes towards the importance of education (particularly mathematics), children’s
attitudes towards school and their instrumental motivation (that doing well in school is
important for getting a good job). The following section will discuss whether adding these
factors to the model helps to explain differences in maths achievement between children of
Australian versus East Asian descent.
It is important to note that the modelling process outlined above will not necessarily
reveal the causal effect of any given factor. Indeed, in some of the later models, even the
14 These scales were created from children’s responses to statements such as: ‘If I put in enough effort
I can succeed in mathematics’, ‘I do badly in mathematics whether or not I study for my exams’ and
‘Sometimes I am just unlucky’.
14
direction of causation may not be clear (e.g. do East Asian pupils have high test scores
because of their high aspirations, or are their high aspirations driven by their high test
scores)? What the estimates do provide, however, is a detailed decomposition of the native-
East Asian test score gap – examining the extent to which the high PISA test scores of the
latter can indeed be ‘explained’ (in a statistical sense) by many of the common explanations
given for their success.
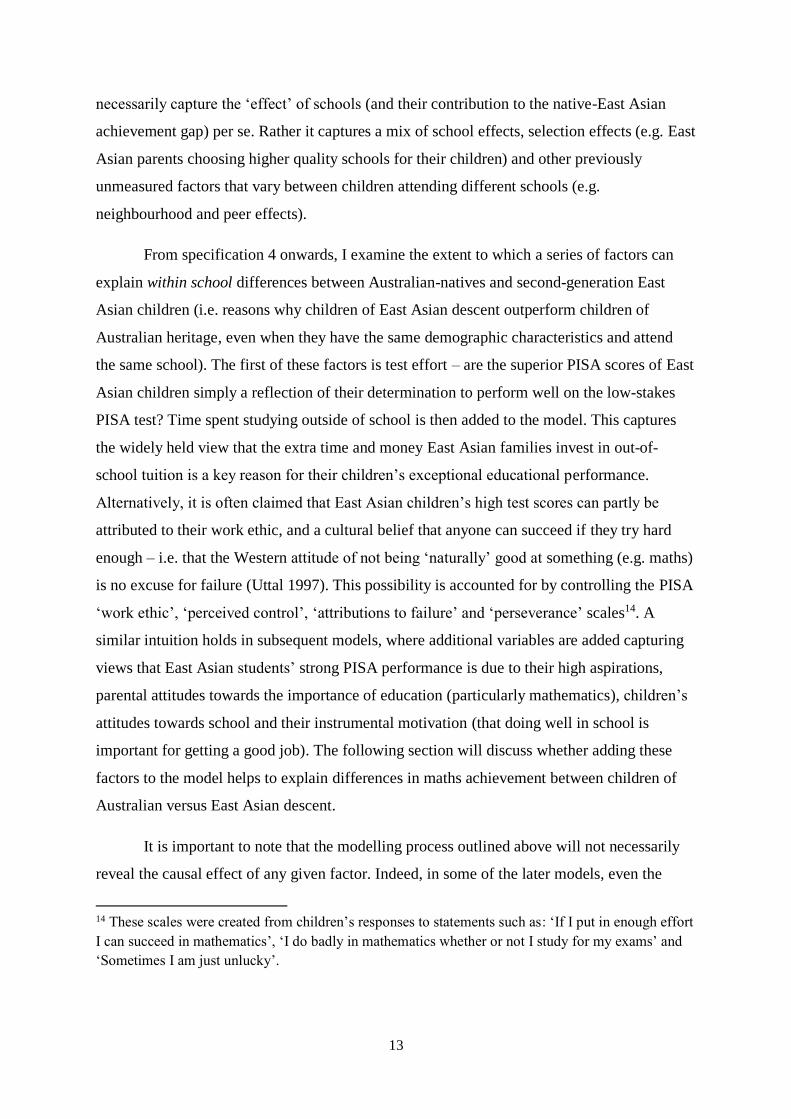
4. Results
Figure 2 presents average PISA maths test scores for the native-Australian and second-
generation immigrant groups (white bars). Analogous figures are also provided for a selection
of comparator countries (grey bars). The strong performance of Australian children of East
Asian heritage is striking. Their score of 605 is significantly above that of any other group,
outperforming children with two Australian parents by more than 100 test points (i.e. one
whole standard deviation). Thus, despite being born and raised in a Western country with an
‘average’ performing education system, Australian children of East Asian descent obtain test
scores consistent with countries at the top of the PISA rankings. This provides further
motivation for a detailed investigation of this group; they demonstrate high levels of
academic proficiency that educational policymakers would like all young people to achieve.
<< Figure 2 >>
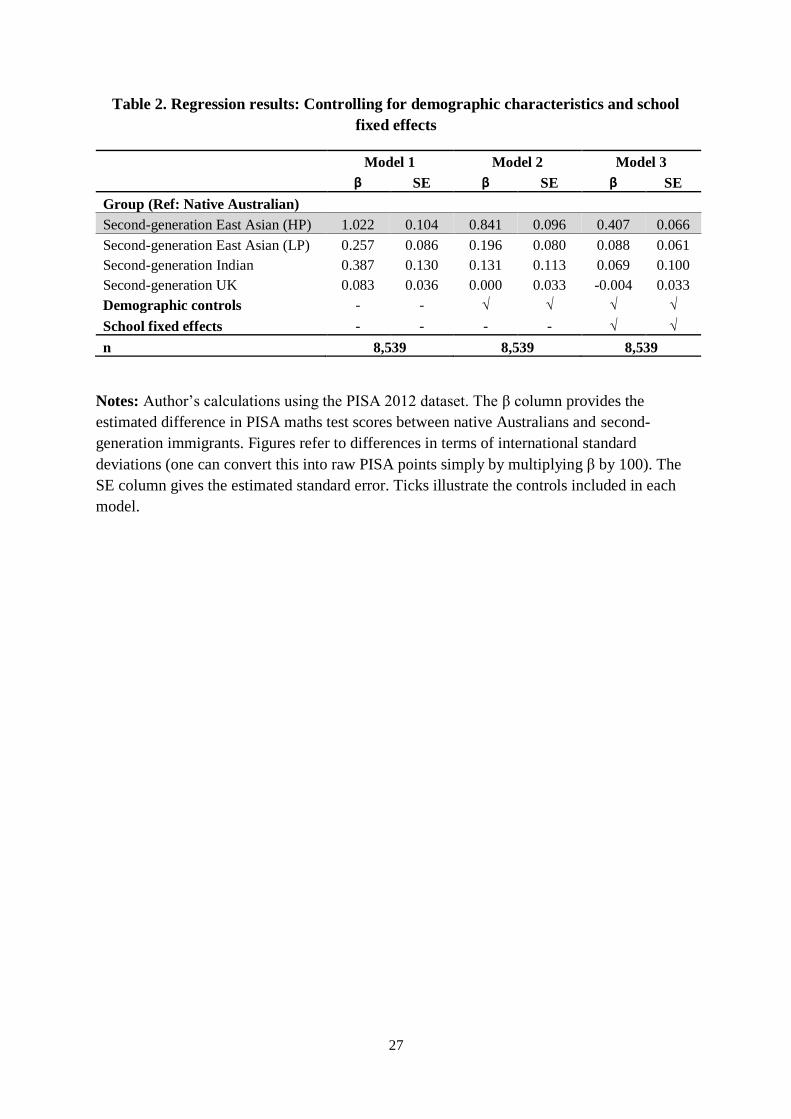
Table 2 presents results from the first three regression model specifications. All figures refer
to differences relative to the native Australian group, and are presented in terms of
international standard deviations15. Model 1 presents the unconditional estimates. Consistent
with Figure 2, second-generation immigrants from high-performing East Asian countries
achieve much higher scores than all other groups. Moreover, parameter estimates for second-
generation immigrants from other countries are of a reasonable magnitude and significantly
greater than zero at the five percent level. In other words, second-generation immigrants from
India, the United Kingdom and other (not high-performing) East Asian countries also achieve
higher scores (on average) than Australian natives on the PISA test.
<< Table 2 >>
15 Multiplying figures in the results table by 100 gives differences in terms of PISA points.
15
Model 2 adds controls for a range of demographic characteristics (e.g. age, gender,
parental education etc). This leads to a non-trivial decline in the high-performing East Asian
parameter estimate, falling from 1.02 to 0.84 standard deviations (102 to 84 PISA points).
Nevertheless, differences between children of East Asian heritage and their native-Australian
peers remain large (equivalent to more than two years of schooling) and statistically
significant at the five percent level. Thus, although positive selection among migrant families
seems to partly explain the achievement gap, it is by no means the only factor at play. In
contrast, the second-generation Indian and second-generation UK parameter estimates are no
longer statistically significant at conventional thresholds. Thus, unlike children of East Asian
heritage, the comparatively high test scores achieved by these groups can largely be
explained by differences in observed background characteristics alone.
School fixed effects are included in model 3. Consequently, any remaining between
school variation has now been removed. This causes the high-performing East Asian
parameter estimate to fall by more than half, from 0.84 standard deviations (84 PISA points)
to 0.41 (41 PISA points). This possibly indicates that East Asian families choose to send their
children to (or live in neighbourhoods with) ‘better’ schools than Australian parents, which in
turn leads to a substantial difference in their academic achievement. Indicative evidence on
this issue is presented in Appendix C, which illustrates how children of East Asian descent
generally attend higher quality schools than their native Australian peers (even after
conditioning upon a range of family background characteristics). This finding does, however,
require careful interpretation. On the one hand, it may represent a selection effect. For
instance, East Asian parents may be choosing to send their children to what they believe are
the ‘best’ schools, due to the importance they attach to education. The school fixed effect
may thus be partly picking up this important aspect of East Asian culture. Alternatively, the
school fixed effect may be capturing other residual background influences not fully
controlled in model specification 2 (e.g. local neighbourhood effects). This includes the
possibility that, as school assignment is often based upon location of the family home,
residential choice (rather than school choice) are being picked up by the school fixed effect
instead16. Similarly, one cannot interpret the striking decline in parameter estimates between
16 The Department of Education and Early Child Development in Victoria (the state where more than half our
sample of second-generation East Asian immigrants live – recall Table 1A) notes that children usually attend
their nearest secondary school. However, families have the choice to send their child to another secondary
school (or a catholic or independent school) if it has places available. See
http://www.education.vic.gov.au/school/parents/secondary/Pages/choosing.aspx for further details.

16
model 2 and 3 as representing the ‘causal’ influence of schools, as the school fixed effect will
also incorporate things like peer effects. What these results do show, however, is that a
combination of factors occurring at the school level (e.g. school selection, school
effectiveness, peer effects) form a key part of the explanation as to why children of East
Asian heritage outperform children with an Australian background.
Yet, even once all between school variation has been removed, the gap in
achievement between children of Australian and East Asian heritage remains large, standing
at approximately 40 PISA points (equivalent to one whole year of schooling). Moreover, note
that parameter estimates for all other second-generation immigrant groups are now small and
statistically insignificant at the five percent level. This suggests that East Asian parents are
doing additional things to boost their children’s achievement, relative to both Australian
natives and other immigrant families from a similar background, whose children attend the
same school. In other words, out-of-school factors (e.g. culture and home environment) also
seem to be playing a vital role.
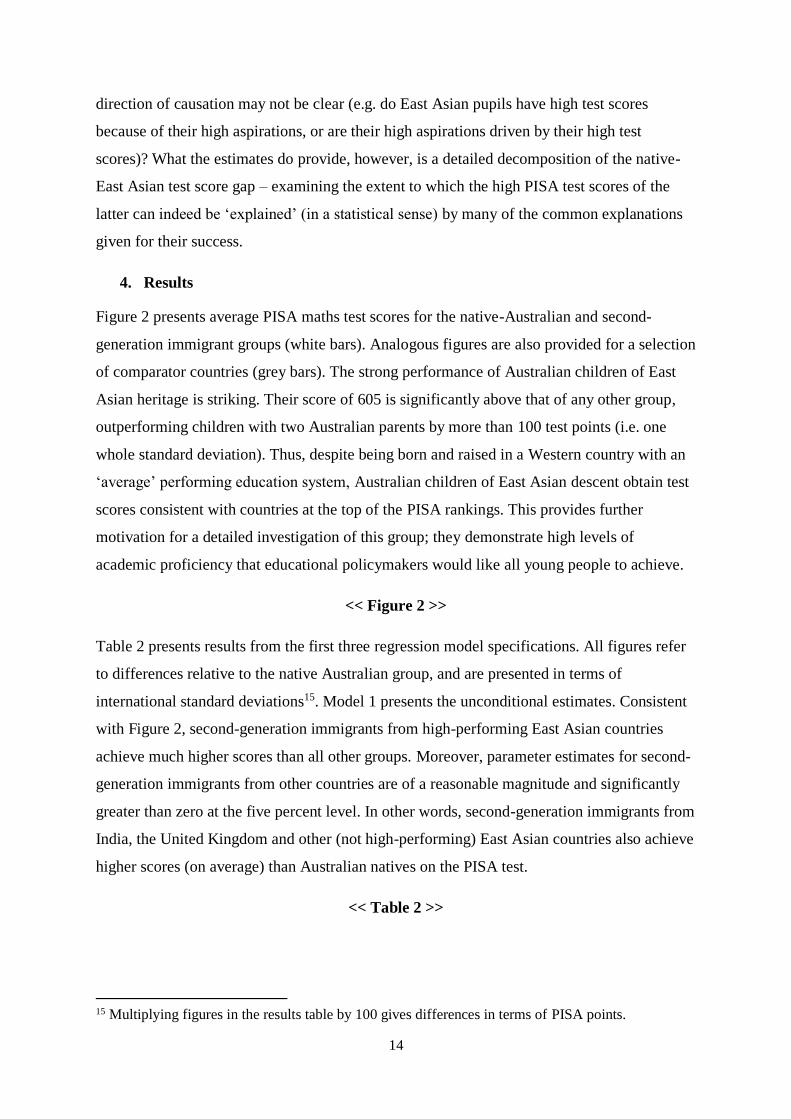
Before adding further explanatory variables to the model, I briefly turn to the issue of
trends over time. Australia has suffered a steep decline in the PISA rankings over the last
decade, with recent research suggesting that this was driven by falling performance amongst
private school pupils and the highest achievers (Ryan 2013). But has the performance of
Australian children with East Asian heritage followed this pattern? Or have their test scores
increased, and thus their lead over Australian natives grown? I answer this question by re-
estimating models 1, 2 and 3 in each of the PISA 2003, 2006 and 2009 datasets. Findings are
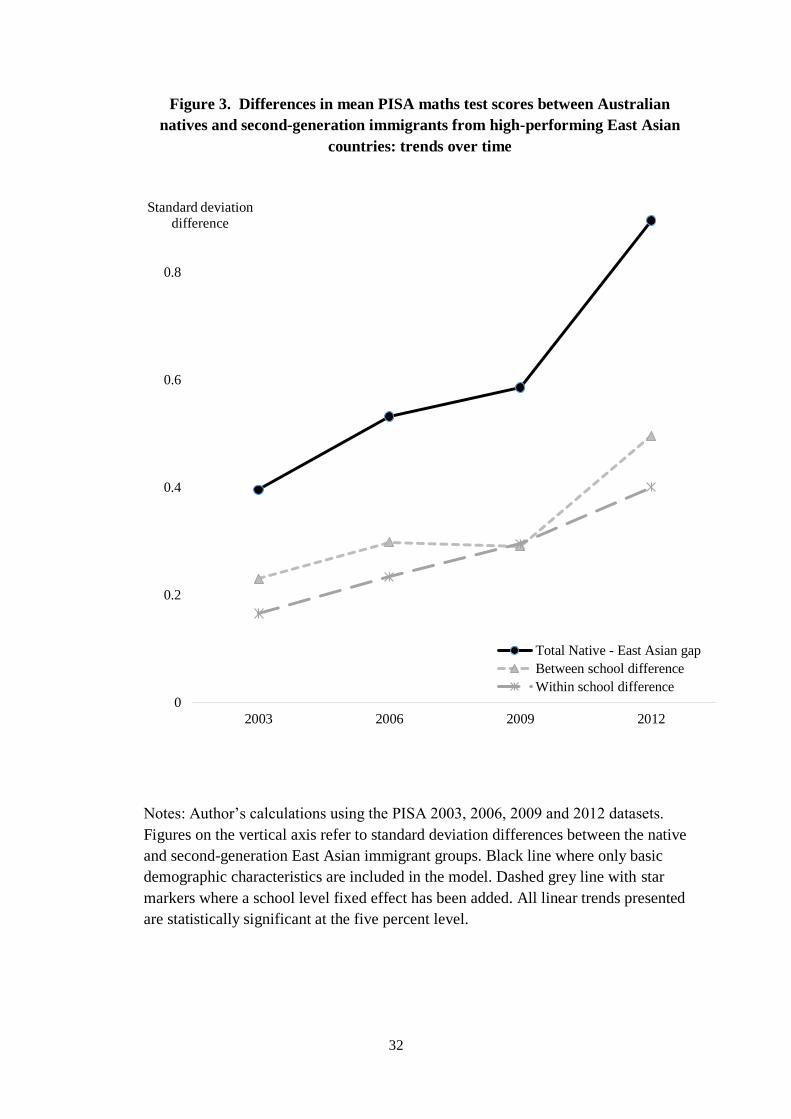
summarised in Figure 3. This plots the difference in standardised PISA test scores between
Australian natives and second-generation East Asian immigrants, based upon estimates from
model 2 (black line), model 3 (dashed grey line starred markers) and the difference between
the two (dashed grey line triangular markers).
<< Figure 3 >>
There is strong evidence that second-generation East Asian immigrants have managed to
increase their lead over the native-Australian group. While PISA maths test scores of the
latter have declined steadily from 528 in 2003 to 518 in 2006, 511 in 2009 and 499 in 2012,
those of second-generation East Asian immigrants have risen from 565 in 2003, to 582 in
2006, 579 in 2009 and 605 in 2012. The solid black line in Figure 3 consequently illustrates
the substantial increase in the maths achievement gap between these groups over this period.
17
This linear trend is statistically significant at the five percent level, highlighting how PISA
scores of Australian children with East Asian heritage have improved, even though
performance of the country as a whole has been in stark decline. Moreover, the grey lines
plotted in Figure 3 suggest that this cannot simply be attributed to East Asian families
becoming increasingly selective in their choice of school. Indeed, within school differences
between natives and second-generation East Asian immigrants have increased from 0.17 to
0.40 standard deviations between 2003 and 2012 (this linear trend is also statistically
significant at the five percent level). Consequently, there is strong evidence that East Asian
families have extended their children’s already large academic lead over recent years.
Table 3 attempts to explain the remaining within school differences between children
of Australian and East Asian heritage observed in PISA 2012. First, effort on the PISA test is
controlled, resulting in trivial declines in the second-generation immigrant parameter
estimates (β falls from 0.407 to 0.406 for the high-performing East Asian heritage group).
This reflects both the weak correlation between test effort and PISA scores (Pearson
correlation coefficient = 0.05) and that reported test effort differs little between native and
second-generation immigrants (recall Table 1b). I thus find little evidence that the
exceptional performance of East Asian children on PISA is simply due to the greater effort
they put into this ‘low stakes’ test.
<< Table 3 >>
Specification 5 adds to the model time spent studying outside of school. This includes
both the total amount of time, and the activities on which this time is spent (e.g. homework,
private tuition etc). The second-generation East Asian parameter estimate declines by
approximately 25 percent – from 0.406 standard deviations (41 PISA points) to 0.290 (29
PISA points). This is consistent with the view that out-of-school tuition (or what it proxies –
e.g. family commitment to their children’s education) makes an important contribution to
East Asian children’s success in PISA. One important implication is that this illustrates how
PISA test scores are not measuring the ‘quality’ of a country’s schooling system per se.
Rather, PISA test scores are influenced by several factors, many of which are beyond
schools’ control (e.g. the willingness of parents to provide their children with extra tuition).
However, it is equally important to note that large differences in PISA maths test scores
remain between Australian natives and second-generation East Asian immigrants, even after
this factor has been taken into account.

18
Four of the PISA scales are included in model 6: work ethic, perceived control,
attributions to failure and perseverance. Together, these attempt to capture the view that East
Asian children’s high test scores can be attributed to their hard work ethic, belief that anyone
can succeed if they put in enough effort, and that they do not give up easily when met with a
challenge. This results in another appreciable drop of 0.05 standard deviations (5 PISA
points) in the second-generation high-performing East Asian parameter estimate, from 0.290
(29 PISA points) to 0.244 (24 PISA points). Given the array of factors already taken into
account, this represents a reasonably sizeable decline. It thus suggests that East Asian
parents’ ability to instil a hard work ethic in their offspring, and a belief that they can succeed
if they try hard enough, does indeed make an important contribution to their high PISA test
scores.
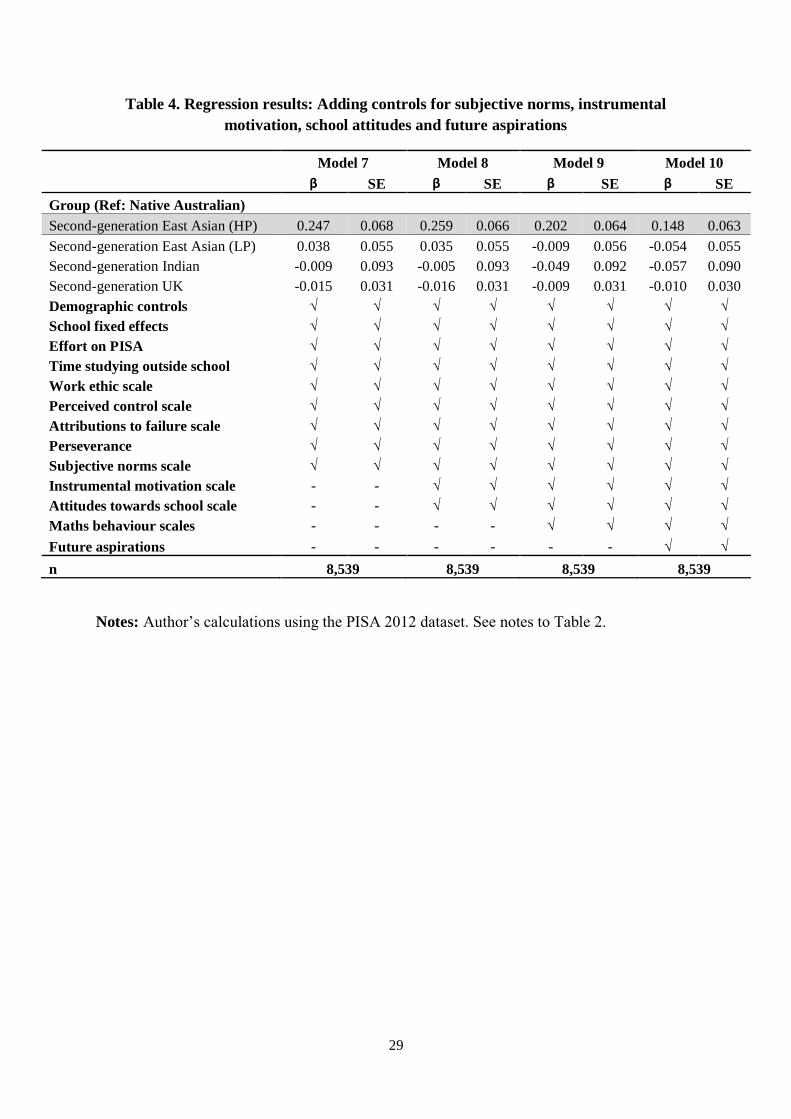
Model 7 adds the subjective norms scale. This includes children’s responses to
statements like ‘my parents believe it’s important for me to study mathematics’, thus partly
capturing the influence of parental views on the importance of education (and mathematics in
particular). Interestingly, this adds little explanatory power, with the high-performing East
Asian parameter estimate hardly changing (it actually increases slightly from 0.244 to 0.247).
This suggests that the influence of such factors is likely to have already been proxied by other
variables included in the model. For instance, parents who believe it is important to study
maths are also more likely to pay for out-of-school maths tuition, with the effect of the
former having already been captured once I had controlled for the latter in specification 5.
A similar story emerges from model 8, where the instrumental motivation and attitude
towards school scales are included. These reflect children’s answers to questions like
‘learning mathematics is worthwhile for me because it will improve my career prospects’ and
‘trying hard at school will help me get a good job.’ Their inclusion leads to a small increase
in the East Asian parameter estimate, from 0.247 to 0.259. Hence, students’ views on the use
of maths in their future careers do not explain any of the remaining difference in maths
achievement between children of Australian and East Asian descent (over and above the
other variables already included in the model).
Finally, models 9 and 10 control for children’s mathematics behaviour (e.g. whether
they take part in maths competitions) and their educational expectations. Including the former
reduces the high-performing East Asian parameter estimate down to 0.202 standard
deviations (from 0.259 in model 8), while adding the latter reduces this further to 0.148. This
19
is substantial, given the wide array of factors already controlled, potentially indicating that
doing more maths related activities and holding high educational aspirations play an
important role in driving East Asian children’s educational success. Some caution is required
when interpreting these results, however, due to the potentially endogenous nature of these
variables (e.g. rather than high aspirations leading to high achievement, the direction of
causality may be the other way around).
Thus, by the end of the modelling process, I have been able to explain (in a statistical
sense) approximately 85 percent of the difference in maths achievement between Australian
natives and second-generation immigrants from a high-performing East Asian country17. No
single factor has stood out as the cause of the difference in achievement between these
groups. Rather a combination of socio-economic characteristics, school selection, values
placed upon education, out-of-school tuition, work ethic, attitudes towards what drives
success and high aspirations for the future, seem to be at play. Yet, even after accounting for
such a wide set of characteristics, there remains a statistically significant difference of 15
PISA points (0.148 standard deviations) between children of Australian and East Asian
heritage. There are thus important factors not observed within the PISA dataset, and not
adequately proxied by other variables, that are partly responsible for the exceptionally high
test scores obtained by second-generation East Asian immigrants. Potential candidates
include educational experiences earlier in life (e.g. quality of primary or pre-school school
care – see Jerrim and Choi 2014), gaining access to higher quality teachers within schools18
or inherent ability19. Unfortunately, examining the influence of such factors is beyond the
scope of this paper and, indeed, the data currently available. Consequently, investigating the
influence of such factors remains an important area for future research.
17 This is based upon the high-performing East Asia parameter estimate falling from 1.022 in model 1
to 0.148 in model 10. 18 The PISA 2012 dataset does not include a measure of teacher quality per se. It does, however,
include a scale recording pupils’ views on their maths teachers (and their teaching practices). My
experimentations suggest, however, that this is unable to explain much additional variation in maths
achievement over and above the factors already included in the model. 19 This is clearly a controversial issue. The point is raised here to recognise that there has been some
debate about this matter within the literature (see Uttal 1997 and Lynn and Meisenberg 2010) and that
the empirical evidence presented is unable to conclusively support or reject such claims.
20
5. Conclusions
The high PISA test scores of East Asian children have become the envy of educational
policymakers across the Western world. Previous attempts to explain their phenomenal
performance have either drawn upon anecdotal evidence (Grattan Institute 2012; OECD
2013) or by simply examining a set of bivariate cross-national correlations (Leung 2006). In
contrast, this paper has examined PISA maths test scores of children with East Asian parents
who were born and raised in a Western country (Australia). My analysis suggests that this
group score, on average, more than 600 points on the PISA test, putting them second to only
Shanghai-China in the PISA rankings. They thus replicate the high PISA test scores of
children living in the high-performing East Asian economies, despite being educated within
an ‘average’ Western educational system. These findings are consistent with the findings of
Feniger and Lefstein (2014), who argue that that maths skills of Chinese children living in
Australia and New Zealand are more similar to those of children in Shanghai than their native
Australian and New Zealand peers. Yet I find little evidence that a single factor can explain
the exceptionally strong PISA performance of this group. Rather a combination of school
selection, a high value placed upon education, substantial out-of-school tuition, hard work
ethics, a belief that anyone can succeed with effort and high aspirations for the future, all play
an important, inter-linked role.
These findings have important implications for Western policymakers attempting to
catch the high-performing East Asian countries at the top of the PISA rankings. First, the
experience of second-generation East Asian immigrants in Australia illustrates how high-
level maths skills can be developed even within average-performing educational systems
(including by children of average and low socio-economic backgrounds). Second, the
attitudes and beliefs East Asian parents instil in their children make an important contribution
to their high levels of academic achievement. Yet as such factors are heavily influenced by
culture and home environment, they are likely to be beyond the control of schools. Greater
recognition needs to be given to this point in public discourse. Indeed, policymakers should
make it clear that there are many influences upon a country’s PISA performance, and that
climbing significantly up these rankings is unlikely to be achieved by the efforts of schools
alone. Finally, high-ranking PISA countries may well provide Western policymakers with
valuable insights into how their own education systems might be improved. But any

21
subsequent policy action must be supported by a wider evidence base – policymakers should
not rely upon PISA alone. For instance, one does not want to erroneously conclude that rote
learning helps to improve children’s maths skills, simply because this technique is often
practised within East Asian schools. Indeed, the fact that children of East Asian heritage
perform just as highly in the Australian education system (whose schools and teachers do not
routinely use such techniques) would actually seem to contradict such views. This highlights
the care that needs to be taken before policy is borrowed from other countries; due
consideration of the wider literature (and sources of evidence other than PISA) is always
needed.
It is equally important to reflect upon the limitations of this study and to stress the
need for further work. First, my ability to draw causal inferences has been limited, partly due
to the cross-sectional nature of the PISA dataset (providing a snapshot of children’s skills at
one particular point in time). Further evidence on the dynamics of East Asian children’s
educational achievement is required, including how their skills develop as they move through
primary and secondary school. Developing such a longitudinal component to the PISA study
would of course be a challenge, but is nevertheless critical to enhancing our understanding of
the mechanisms behind East Asian pupils’ extraordinary educational success. Second, it is
important to remember that immigrants are a self-selecting group, who tend to be more
ambitious and driven than individuals who remain in their country of birth (Borjas 1988;
Chiswick 1999). Migrant selectivity, rather than East Asian culture, may therefore be driving
second-generation East Asian immigrants high test scores. Although I have tried to examine
by making comparing test scores across immigrant groups, one still cannot rule out the
possibility that migrant selectivity is having some kind of influence upon my results. Third,
this paper has focused upon the experiences of East Asian children living in one particular
Western country. Future work should try to establish whether my findings generalise to East
Asian children born and raised in other parts of the Western world. Unfortunately, due to data
restrictions and small sample sizes, this is not currently possible for other PISA countries
(e.g. the United Kingdom, Canada, Europe and the United States). Yet such work should be
pursued as soon as possible, as it may provide even stronger evidence that East Asian
children’s success in PISA does not depend upon the schooling system (and other
institutional structures) to which they are exposed.
In the meantime, this paper has the potential to make an important contribution to
contemporary educational policy debate. It has illustrated how Australian children of East
22
Asian heritage perform just as highly on the PISA maths test as children within the high-
performing East Asian jurisdictions. This brings into question whether it really is the
schooling system (and associated teaching methods) in these countries that are responsible for
their dominance of the PISA and TIMSS rankings. Indeed, my results suggest that making
changes to the schooling system and teaching practices alone may be insufficient for Western
countries to catch the top-performing East Asian nations. Rather, this goal may only be
achieved with widespread cultural change, where a hard work ethic and a strong belief in the
value of education is displayed by all families and instilled in every child.

23
References
Australian Bureau of Statistics. 2013. ‘Migration, Australia, 2011-12 and 2012-13’. Accessed
01/08/2014 from http://www.abs.gov.au/AUSSTATS/[email protected]/DetailsPage/3412.02011-
12%20and%202012-13?OpenDocument.
Borjas, George. 1988. ‘Immigration and self-selection’. NBER working papers number 2566.
Accessed 08/09/2014 from http://www.nber.org/papers/w2566.
Bray, Mark and Percy Kwok. 2003. ‘Demand for private supplementary tutoring: conceptual
considerations, and socio-economic patterns in Hong Kong’. Economics of Education Review
22(6):611–20.
Butler, Jayne and Raymond Adams. 2007. ‘The impact of differential investment of student
effort on the outcomes of international studies’. Journal of Applied Measurement 8(3): 279-
304.
Byun, Soo-yong and Hyunjoon Park. 2012. ‘The academic success of East Asian American
youth: The role of shadow education’. Sociology of Education 85(1): 40-60.
Chiswick, Barry. 1999. ‘Are immigrants favourably self-selected?’ American Economic
Association papers and proceedings: 181-85. Accessed 08/09/2014 from
http://web.stanford.edu/group/scspi/_media/pdf/Reference%20Media/Chiswick_1999_Immig
ration.pdf.
CNN. 2013. ‘Opinion: What Asian schools can teach the rest of the world’. Accessed
05/09/2014 from http://edition.cnn.com/2013/12/03/opinion/education-rankings-commentary-
schleicher/
Department for Education. 2012. ‘What can we learn from the English, mathematics and
science curricula of high- performing jurisdictions?’ Department for Education Research
Report DFE-RR178. London (England): Department for Education. Accessed 22/07/2014
from www.gov.uk/government/uploads/system/uploads/attachment_data/file/184064/DFE-
RR178.pdf
Feniger, Yariv and Adam Lefstein. 2014. ‘How not to reason with PISA data: an ironic
investigation.’ Journal of Education Policy 29(6): 845-55.
Francis, Becky and Louise Archer. 2005. ‘British–Chinese pupils’ and parents’ constructions
of the value of education’. British Educational Research Journal 31(1): 89-108.
Fu, Alyssa and Hazel Markus. 2014. ‘My mother and me: why tiger mothers motivate Asian
Americans but not European Americans’. Personality and Social Psychology Bulletin 40(6):
739-49.
Jerrim, John and Alvaro Choi. 2014. ‘The mathematics skills of school children: how does
the UK compare to the high performing East Asian nations?’ Journal of Education Policy
29(3): 349-76.

24
Kim, Kyung. 2005. ‘Learning from each other: creativity in East Asian and American
education’. Creativity Research Journal 17(4): 337-47.
Leung, Fredrick. 2006. ‘Mathematics education in East Asia and the West: does culture
matter?’ Pp. 21-46 in Mathematics Education in Different Cultural Traditions-A
Comparative Study of East Asia and the West. Edited by Fredrick Leung, Klaus-D. Graf and
Francis Lopez-Real. Springer.
Lynn, Richard and Gerhard Meisenberg. 2010. ‘National IQs calculated and validated for 108
nations’. Intelligence 38(4):353-60.
Micklewright, John; John Jerrim.; Anna Vignoles; Andrew Jenkins; Rebecca Allen; Sonia
Llie; Elodie Bellarbre; Fabian Barrera and Christopher Hein. 2014. ‘Teachers in secondary
schools: evidence from TALIS 2013’. Department for Education Research Report DFE-
RR302. London (England): Department for Education. Accessed 22/07/2014 from
https://www.gov.uk/government/publications/teachers-in-secondary-schools-evidence-from-
talis-2013
OECD. 2009. ‘Analysis with plausible values’. DOI 10.1787/9789264056275-9-en
OECD. 2010. ‘PISA 2009 results. Learning to learn: student engagement strategies and
practices’. Paris: OECD.
OECD. 2013. ‘Asian countries top OECD’s latest PISA survey on state of global education’.
Accessed 22/07/2014 from http://www.oecd.org/education/asian-countries-top-oecd-s-latest-
pisa-survey-on-state-of-global-education.htm
OECD. 2014 (Forthcoming). ‘PISA 2012 technical report’. Paris: OECD.
Ryan, Chris. 2013. ‘What is behind the decline in student achievement in Australia?’
Economics of Education Review 37: 226-39.
The Economist. 2014. ‘Evaluating Shanghai's high test scores’. Accessed 22/07/2014 from
http://www.economist.com/blogs/analects/2014/01/chinese-
schools?fsrc=scn/tw_ec/evaluating_shanghais_high_test_scores
Time Magazine. 2013. ‘China is cheating the world student rankings system’. Accessed
22/07/2014 from http://world.time.com/2013/12/04/china-is-cheating-the-world-student-
rankings-system/
Tucker, Marc. 2011. ‘Surpassing Shanghai: an agenda for American education built on the
world’s leading systems’. Harvard Education Publishing Group: Harvard.
Uttal, David. 1997. ‘Beliefs about genetic influences on mathematics achievement: a cross-
cultural comparison’. Genetica 99(2):165-72.
Wu, Margaret and Dianzhou Zhang. 2006. ‘An overview of the mathematics curricula in the
West and East’. Pp. 181-193 in Mathematics Education in Different Cultural Traditions-A
Comparative Study of East Asia and the West. Edited by Fredrick Leung, Klaus-D. Graf and
Francis Lopez-Real. Springer.

25
Table 1a. The demographic characteristics of Australian natives compared to
second-generation East Asian immigrants
Natives Second-generation immigrants: parental origin
Australian
High-performing
East Asian
Low-performing
East Asian
Indian
region
United
Kingdom
Gender
% Female 49 44 50 52 48
% Male 51 56 50 48 52
Mother's education
% ISCED 0 – 2 21 13 17 13 20
% ISCED 3 - 4 35 29 34 34 31
% ISCED 5b 13 11 11 7 15
% ISCED 5a+ 28 47 37 43 32
Father's education
% ISCED 0 - 2 25 15 20 1 18
% ISCED 3 - 4 38 25 35 23 39
% ISCED 5b 9 8 8 5 9
% ISCED 5a+ 25 51 37 69 32
Mother's occupation (ISEI)
Mean 52 50 48 52 53
Father's occupation (ISEI)
Mean 46 50 46 58 49
Wealth
Mean (standardised) 0.08 -0.22 -0.22 -0.04 0.13
Language spoken at home
% English 100 48 85 73 98
% Other 0 52 15 27 2
State
% Australian Capital Territory 2 2 2 3 2
% Victoria 30 57 46 53 24
% New South Wales 25 23 22 28 19
% Queensland 22 10 12 5 19
% South Australia 8 2 4 3 12
% Western Australia 9 6 12 6 22
%Tasmania 3 0 1 1 2
% Northern Territory 1 1 1 1 1
Family Structure
% Single parent 13 12 15 11 13
% Two parent 87 88 85 89 87
Observations 6,837 276 279 99 1,049
Notes: Author’s calculations using the PISA 2012 database. Mother’s and father’s occupation
measured using the International Socio-Economic Index (ISEI), which has a mean of
approximately 50 and standard deviation of approximately 22 in Australia. The wealth index
has been standardised by the survey organisers across countries. In Australia, the wealth
index has a mean of approximately 0.55 and a standard deviation of 1.
26
Table 1b. PISA scale scores for Australian natives compared to second-generation East Asian immigrants
Natives Second-generation immigrants - parental origin
Scale Metric Australian
High-performing
East Asian
Low-performing
East Asian
Indian
region
United
Kingdom
Difference in test effort Mean (standardised) -0.02 0.09 -0.03 -0.06 0.03
Out of school tuition Mean (weekly hours) 9 15 11 16 9
Work ethic scale Mean (standardised) -0.07 0.33 -0.03 0.50 -0.06
Perceived control scale Mean (standardised) -0.06 0.42 0.06 0.45 -0.01
Reasons for failure scale Mean (standardised) 0.02 -0.27 0.06 -0.18 0.02
Perseverance Mean (standardised) -0.06 0.02 -0.06 0.54 -0.01
Subjective norms Mean (standardised) -0.12 0.43 0.22 0.51 -0.15
Instrumental motivation Mean (standardised) -0.04 0.15 0.14 0.24 -0.01
Attitude school Mean (standardised) -0.03 -0.02 0.04 0.21 0.02
Maths behaviour Mean (standardised) -0.13 0.67 0.35 0.57 -0.18
Expect university Percentage 58 94 81 85 63
Unweighted n 6,837 276 279 99 1,049
Notes: Author’s calculations using the PISA 2012 database. Standardised scales have a mean of 0 and a standard deviation of 1 across
the Australian population. Figures reported for only those children with valid responses. See Appendix B for the questions that form each
scale, and the distribution of responses to one of these questions.
27
Table 2. Regression results: Controlling for demographic characteristics and school
fixed effects
Model 1 Model 2 Model 3
β SE β SE β SE
Group (Ref: Native Australian)
Second-generation East Asian (HP) 1.022 0.104 0.841 0.096 0.407 0.066
Second-generation East Asian (LP) 0.257 0.086 0.196 0.080 0.088 0.061
Second-generation Indian 0.387 0.130 0.131 0.113 0.069 0.100
Second-generation UK 0.083 0.036 0.000 0.033 -0.004 0.033
Demographic controls - - √ √ √ √
School fixed effects - - - - √ √
n 8,539 8,539 8,539
Notes: Author’s calculations using the PISA 2012 dataset. The β column provides the
estimated difference in PISA maths test scores between native Australians and second-
generation immigrants. Figures refer to differences in terms of international standard
deviations (one can convert this into raw PISA points simply by multiplying β by 100). The
SE column gives the estimated standard error. Ticks illustrate the controls included in each
model.

28
Table 3. Regression results: Adding controls for test effort, time spent studying, work
ethic and teacher support
Model 4 Model 5 Model 6
β SE β SE β SE
Group (Ref: Native Australian)
Second-generation East Asian (HP) 0.406 0.065 0.290 0.067 0.244 0.068
Second-generation East Asian (LP) 0.088 0.062 0.060 0.057 0.033 0.055
Second-generation Indian 0.061 0.101 0.077 0.099 -0.008 0.093
Second-generation UK -0.003 0.032 -0.013 0.032 -0.012 0.031
Demographic controls √ √ √ √ √ √
School fixed effects √ √ √ √ √ √
Effort on PISA √ √ √ √ √ √
Time studying outside school - - √ √ √ √
Work ethic scale - - - - √ √
Perceived control scale - - - - √ √
Attributions to failure scale - - - - √ √
Perseverance - - - - √ √
n 8,539 8,539 8,539
Notes: Author’s calculations using the PISA 2012 dataset. See notes to Table 2.
29
Table 4. Regression results: Adding controls for subjective norms, instrumental
motivation, school attitudes and future aspirations
Model 7 Model 8 Model 9 Model 10
β SE β SE β SE β SE
Group (Ref: Native Australian)
Second-generation East Asian (HP) 0.247 0.068 0.259 0.066 0.202 0.064 0.148 0.063
Second-generation East Asian (LP) 0.038 0.055 0.035 0.055 -0.009 0.056 -0.054 0.055
Second-generation Indian -0.009 0.093 -0.005 0.093 -0.049 0.092 -0.057 0.090
Second-generation UK -0.015 0.031 -0.016 0.031 -0.009 0.031 -0.010 0.030
Demographic controls √ √ √ √ √ √ √ √
School fixed effects √ √ √ √ √ √ √ √
Effort on PISA √ √ √ √ √ √ √ √
Time studying outside school √ √ √ √ √ √ √ √
Work ethic scale √ √ √ √ √ √ √ √
Perceived control scale √ √ √ √ √ √ √ √
Attributions to failure scale √ √ √ √ √ √ √ √
Perseverance √ √ √ √ √ √ √ √
Subjective norms scale √ √ √ √ √ √ √ √
Instrumental motivation scale - - √ √ √ √ √ √
Attitudes towards school scale - - √ √ √ √ √ √
Maths behaviour scales - - - - √ √ √ √
Future aspirations - - - - - - √ √
n 8,539 8,539 8,539 8,539
Notes: Author’s calculations using the PISA 2012 dataset. See notes to Table 2.

30
Figure 1. The PISA effort thermometer
Source: Butler and Adams (2007: Figure 1)

31
Figure 2. Average PISA maths test scores: a comparison of second-generation
Australian immigrants to children in other countries
Notes: Author’s calculations using the Australian PISA 2012 data. Grey bars illustrate
average PISA maths test score for whole countries / economies. White bars illustrate
average PISA maths scores for Australian sub-groups of interest. “HP East Asian
heritage” refers to estimates for second-generation immigrants whose parents were
born in a high-performing East Asian country. The thin black line running through the
centre of bars refer to the estimated 95 percent confidence interval.
450 500 550 600 650
United States
United Kingdom
Australia (Natives)
Australia (all)
British heritage
Other East Asian heritage
Japan
Indian heritage
South Korea
Chinese Taipei
Hong Kong
Singapore
HP East Asian heritage
Shanghai-China
Average PISA score
32
Figure 3. Differences in mean PISA maths test scores between Australian
natives and second-generation immigrants from high-performing East Asian
countries: trends over time
Notes: Author’s calculations using the PISA 2003, 2006, 2009 and 2012 datasets.
Figures on the vertical axis refer to standard deviation differences between the native
and second-generation East Asian immigrant groups. Black line where only basic
demographic characteristics are included in the model. Dashed grey line with star
markers where a school level fixed effect has been added. All linear trends presented
are statistically significant at the five percent level.
0
0.2
0.4
0.6
0.8
2003 2006 2009 2012
Standard deviationdifference
Total Native - East Asian gap
Between school difference
Within school difference
33
Appendix A. Alternative methods for handling missing data
The results presented in the main body of the paper used Multiple Imputation by Chained
Equations (MICE) to account for the “rotated block design” of the PISA 2012 background
questionnaire. Recall that this meant some of the variables included in Models 5 to 10 were
Missing Completely At Random (MCAR). This appendix presents alternative estimates
where this missing data issue is tackled in a different way.
First, I present estimates from a “complete case” analysis. This is where the sample is
restricted to 2,143 observations where complete information is available on all variables.
These estimates have the advantage of using observed information only, but comes at the
sacrifice of losing statistical power. Moreover, some of the variables that were included in the
main analysis (e.g. the work ethic and reasons for failure scales) cannot be included as these
2,143 children did not respond to these particular questions. (Again, this was simply due to
the rotated questionnaire design, and not refusal to respond).
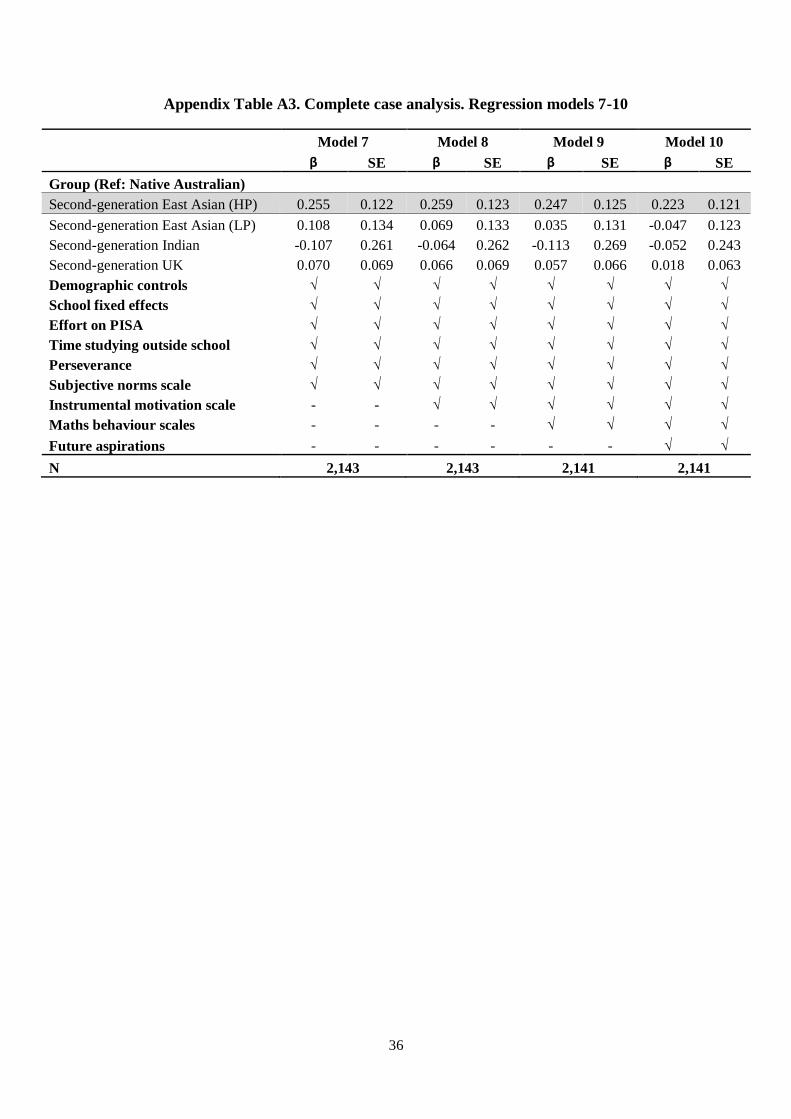
Parameter estimates can be found in Appendix Tables A1 to A3. These results are
analogous to those presented in Tables 2, 3 and 4 in the main body of the paper. Most of the
substantive conclusions reached continue to hold. For instance, the unconditional estimates
(model 1) continue to show an extremely large gap (1.09 standard deviations) between the
native Australian and second-generation East Asian immigrant groups. This declines to 0.96
standard deviations once demographic controls have been added (model 2) and down to 0.29
with the inclusion of a school level fixed effect (model 3). Moreover, I continue to find non-
trivial differences in maths achievement between Australian natives and second-generation
East Asian children, even when they share the same demographic characteristics and attend
the same school. Controlling for effort on the PISA test (model 4) continues to make little
difference, though there is a notable drop (down to 0.25 standard deviations) when out-of-
school study time has been taken into account (model 5). In contrast to the results presented
in the main body of the paper, the parameter estimate does not change between model 5 and
model 6. However, this is likely to be due to the more limited selection of variables now
included in the model20. There is then little change to the results until model 10, when
educational aspirations are added to the model (with the native-East Asian parameter estimate
falling slightly from approximately 0.25 to 0.22). Again, this is broadly in-line with the
results obtained using multiple imputation.
<< Appendix Tables A1 to A3 >>
20 Due to the rotated design, only the perseverance scale can be included in the complete case
version of model 6. In contrast, the work ethic, attributions to failure and perceived control
scales were also included in the sixth specification when using multiple imputation (in the
main body of the paper).
34
The second alternative method is to include missing dummy variables in the model where
pieces of information are not available. This has the advantage of retaining all available
observations in the analysis (i.e. n = 8,539 rather than 2,143 in the complete case analysis)
while also allowing all variables of interest to be included in the model (i.e. unlike the
complete case analysis the work ethic, reasons for failure, perceived control and attitudes
towards school scales no longer need to be dropped). The disadvantage over multiple
imputation is that this is a less principled way of accounting for missing data. In particular, it
could potentially lead to underestimation of the reduction in the second-generation immigrant
parameter estimates when additional factors are added to the model. These estimates are
presented in Appendix Tables A4 to A6. Appendix Table A7 then provides a comparison of
the high-performing East Asian parameter estimates across the three different methods used
to account for missing data.
<< Appendix Tables A4 to A7 >>
Reassuringly, the magnitude and pattern of coefficient estimates are similar across the
different sets of estimates. The only slight discrepancy between the “multiple imputation”
and “missing dummies” results are for model 6 and model 9. In particular, the missing
dummy method results suggest that that the study hours outside of school and the “maths
behaviour” scale explain slightly less of the remaining East Asian-native gap than the
multiple imputation results. Nevertheless, the overall message stemming from this appendix
is that substantive findings are quite robust to the different ways of handling missing data and
the rotated PISA questionnaire design.

35
Appendix Table A1. Complete case analysis. Regression models 1-3
Model 1 Model 2 Model 3
β SE β SE β SE
Group (Ref: Native Australian)
Second-generation East Asian (HP) 1.087 0.148 0.956 0.126 0.292 0.133
Second-generation East Asian (LP) 0.362 0.153 0.230 0.150 0.077 0.134
Second-generation Indian 0.416 0.225 0.110 0.221 -0.073 0.268
Second-generation UK 0.050 0.068 -0.047 0.062 0.039 0.074
Demographic controls - - √ √ √ √
School fixed effects - - - - √ √
N 2,143 2,143 2,143
Appendix Table A2. Complete case analysis. Regression models 4-6
Model 4 Model 5 Model 6
Β SE β SE β SE
Group (Ref: Native Australian)
Second-generation East Asian (HP) 0.293 0.130 0.246 0.129 0.251 0.128
Second-generation East Asian (LP) 0.077 0.137 0.074 0.139 0.109 0.130
Second-generation Indian -0.081 0.282 -0.076 0.289 -0.095 0.263
Second-generation UK 0.056 0.073 0.058 0.073 0.068 0.068
Demographic controls √ √ √ √ √ √
School fixed effects √ √ √ √ √ √
Effort on PISA √ √ √ √ √ √
Time studying outside school - - √ √ √ √
Perseverance - - - - √ √
N 2,143 2,143 2,143
36
Appendix Table A3. Complete case analysis. Regression models 7-10
Model 7 Model 8 Model 9 Model 10
β SE β SE β SE β SE
Group (Ref: Native Australian)
Second-generation East Asian (HP) 0.255 0.122 0.259 0.123 0.247 0.125 0.223 0.121
Second-generation East Asian (LP) 0.108 0.134 0.069 0.133 0.035 0.131 -0.047 0.123
Second-generation Indian -0.107 0.261 -0.064 0.262 -0.113 0.269 -0.052 0.243
Second-generation UK 0.070 0.069 0.066 0.069 0.057 0.066 0.018 0.063
Demographic controls √ √ √ √ √ √ √ √
School fixed effects √ √ √ √ √ √ √ √
Effort on PISA √ √ √ √ √ √ √ √
Time studying outside school √ √ √ √ √ √ √ √
Perseverance √ √ √ √ √ √ √ √
Subjective norms scale √ √ √ √ √ √ √ √
Instrumental motivation scale - - √ √ √ √ √ √
Maths behaviour scales - - - - √ √ √ √
Future aspirations - - - - - - √ √
N 2,143 2,143 2,141 2,141

37
Appendix Table A4. “Missing” dummy variables analysis. Regression models 1-3
Model 1 Model 2 Model 3
β SE β SE β SE
Group (Ref: Native Australian)
Second-generation East Asian (HP) 1.020 0.102 0.840 0.091 0.412 0.064
Second-generation East Asian (LP) 0.260 0.084 0.192 0.077 0.087 0.059
Second-generation Indian 0.397 0.127 0.130 0.106 0.066 0.094
Second-generation UK 0.081 0.035 0.006 0.031 0.000 0.031
Demographic controls - - √ √ √ √
School fixed effects - - - - √ √
n 8,541 8,541 8,541

38
Appendix Table A5. “Missing” dummy variables analysis. Regression models 4-6
Model 4 Model 5 Model 6
β SE β SE β SE
Group (Ref: Native Australian)
Second-generation East Asian (HP) 0.404 0.063 0.357 0.064 0.297 0.061
Second-generation East Asian (LP) 0.092 0.059 0.099 0.055 0.109 0.053
Second-generation Indian 0.058 0.093 0.089 0.091 0.027 0.089
Second-generation UK 0.000 0.031 -0.005 0.030 -0.001 0.028
Demographic controls √ √ √ √ √ √
School fixed effects √ √ √ √ √ √
Effort on PISA √ √ √ √ √ √
Time studying outside school - - √ √ √ √
Work ethic scale - - - - √ √
Perceived control scale - - - - √ √
Attributions to failure scale - - - - √ √
Perseverance - - - - √ √
n 8,541 8,541 8,541
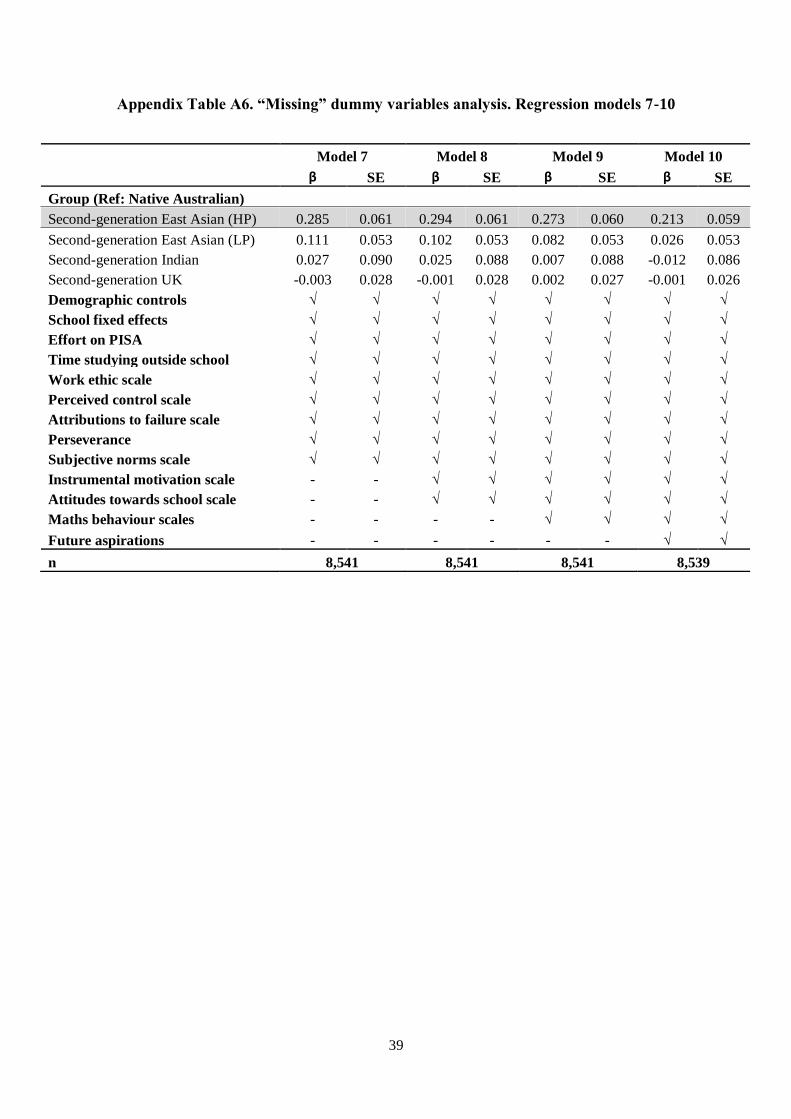
39
Appendix Table A6. “Missing” dummy variables analysis. Regression models 7-10
Model 7 Model 8 Model 9 Model 10
β SE β SE β SE β SE
Group (Ref: Native Australian)
Second-generation East Asian (HP) 0.285 0.061 0.294 0.061 0.273 0.060 0.213 0.059
Second-generation East Asian (LP) 0.111 0.053 0.102 0.053 0.082 0.053 0.026 0.053
Second-generation Indian 0.027 0.090 0.025 0.088 0.007 0.088 -0.012 0.086
Second-generation UK -0.003 0.028 -0.001 0.028 0.002 0.027 -0.001 0.026
Demographic controls √ √ √ √ √ √ √ √
School fixed effects √ √ √ √ √ √ √ √
Effort on PISA √ √ √ √ √ √ √ √
Time studying outside school √ √ √ √ √ √ √ √
Work ethic scale √ √ √ √ √ √ √ √
Perceived control scale √ √ √ √ √ √ √ √
Attributions to failure scale √ √ √ √ √ √ √ √
Perseverance √ √ √ √ √ √ √ √
Subjective norms scale √ √ √ √ √ √ √ √
Instrumental motivation scale - - √ √ √ √ √ √
Attitudes towards school scale - - √ √ √ √ √ √
Maths behaviour scales - - - - √ √ √ √
Future aspirations - - - - - - √ √
n 8,541 8,541 8,541 8,539
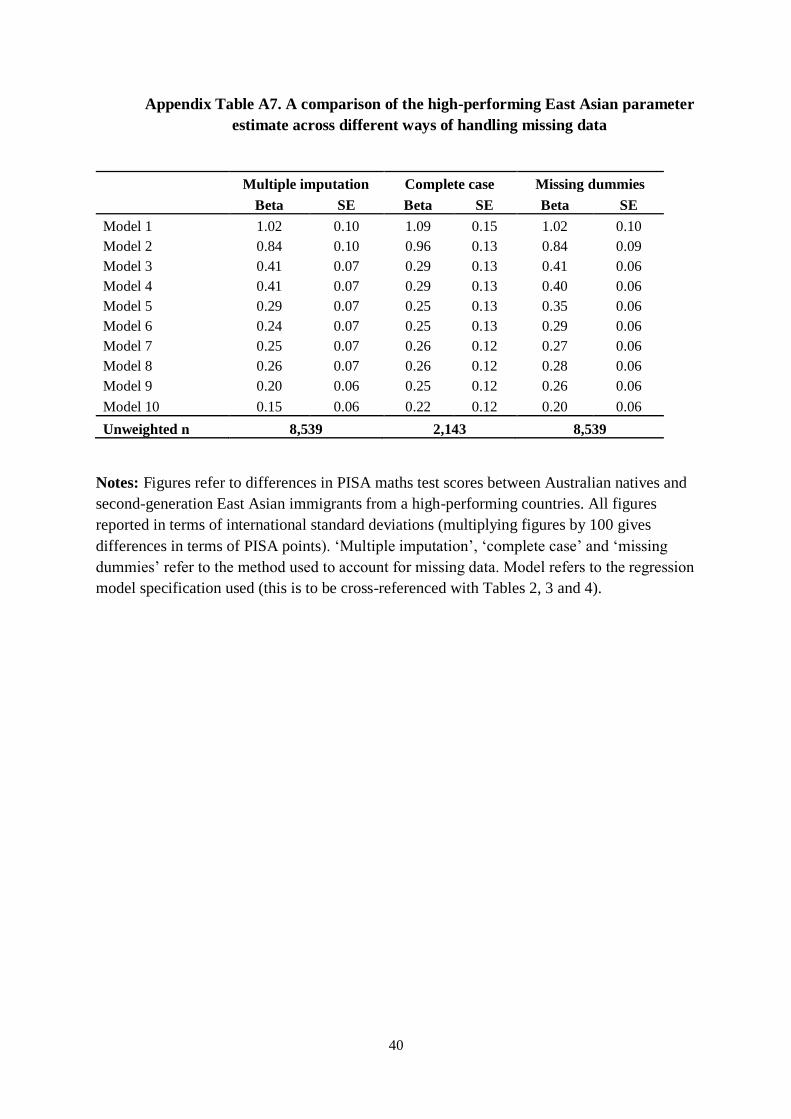
40
Appendix Table A7. A comparison of the high-performing East Asian parameter
estimate across different ways of handling missing data
Multiple imputation Complete case Missing dummies
Beta SE Beta SE Beta SE
Model 1 1.02 0.10 1.09 0.15 1.02 0.10
Model 2 0.84 0.10 0.96 0.13 0.84 0.09
Model 3 0.41 0.07 0.29 0.13 0.41 0.06
Model 4 0.41 0.07 0.29 0.13 0.40 0.06
Model 5 0.29 0.07 0.25 0.13 0.35 0.06
Model 6 0.24 0.07 0.25 0.13 0.29 0.06
Model 7 0.25 0.07 0.26 0.12 0.27 0.06
Model 8 0.26 0.07 0.26 0.12 0.28 0.06
Model 9 0.20 0.06 0.25 0.12 0.26 0.06
Model 10 0.15 0.06 0.22 0.12 0.20 0.06
Unweighted n 8,539 2,143 8,539
Notes: Figures refer to differences in PISA maths test scores between Australian natives and
second-generation East Asian immigrants from a high-performing countries. All figures
reported in terms of international standard deviations (multiplying figures by 100 gives
differences in terms of PISA points). ‘Multiple imputation’, ‘complete case’ and ‘missing
dummies’ refer to the method used to account for missing data. Model refers to the regression
model specification used (this is to be cross-referenced with Tables 2, 3 and 4).

41
Appendix B. The questions forming each PISA scale score
Work ethic scale
I finish my homework in time for mathematics class
I work hard on my mathematics homework
I am prepared for my mathematics exams
I study hard for mathematics quizzes
I keep studying until I understand mathematics material
I pay attention in mathematics class
I listen in mathematics class
I avoid distractions when I am studying mathematics
I keep my mathematics work well organised
Perceived control scale
If I put in enough effort I can succeed in mathematics
Whether or not I do well in mathematics is completely up to me
Family demands or other problems prevent me from putting a lot of time into my mathematics work
If I had different teachers, I would try harder in mathematics
If I wanted to, I could do well in mathematics
I do badly in mathematics whether or not I study for my exams
Reasons for failure scale
I’m not very good at solving mathematics problems
My teacher did not explain the concepts well this week
This week I made bad guesses on the quiz
Sometimes the course material is too hard
The teacher did not get students interested in the material
Sometimes I am just unlucky
Perseverance
When confronted with a problem, I give up easily
I put off difficult problems
I remain interested in the tasks that I start
I continue working on tasks until everything is perfect
When confronted with a problem, I do more than what is expected of me

42
Subjective norms
Most of my friends do well in mathematics
Most of my friends work hard at mathematics
My friends enjoy taking mathematics tests
My parents believe it’s important for me to study mathematics
My parents believe that mathematics is important for my career
My parents like mathematics
Instrumental motivation
Making an effort in mathematics is worth it because it will help me in the work that I want to do later on.
Learning mathematics is worthwhile for me because it will improve my career prospects
Mathematics is an important subject for me because I need it for what I want to study later on
I will learn many things in mathematics that will help me get a job
Attitude school
School has done little to prepare me for adult life when I leave school
School has been a waste of time
School has helped give me confidence to make decisions
School has taught me things which could be useful in a job
Trying hard at school will help me get a good job
Trying hard at school will help me get into a good college
I enjoy receiving good grades
Trying hard at school is important
Maths behaviour
I talk about mathematics problems with my friends
I help my friends with mathematics
I do mathematics as an extracurricular activity
I take part in mathematics competitions
I do mathematics more than 2 hours a day outside of school
I play chess
I program computers
I participate in a mathematics club
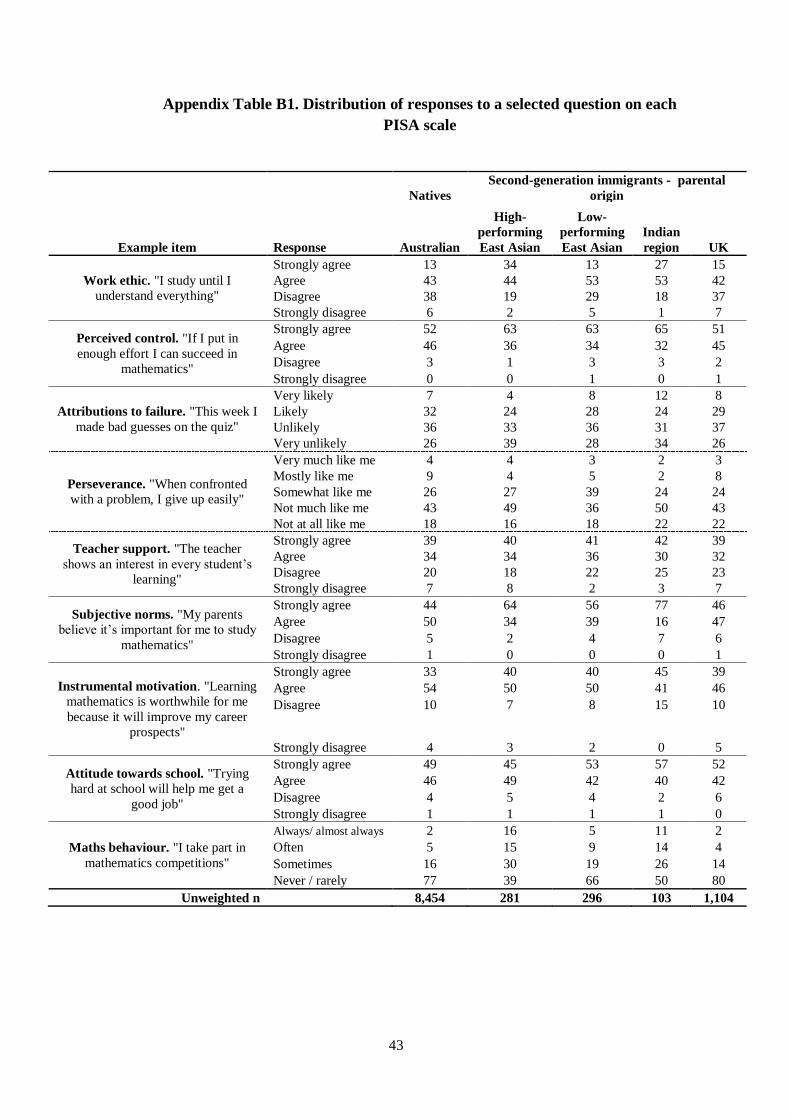
43
Appendix Table B1. Distribution of responses to a selected question on each
PISA scale
Natives
Second-generation immigrants - parental
origin
Example item Response Australian
High-
performing
East Asian
Low-
performing
East Asian
Indian
region UK
Work ethic. "I study until I
understand everything"
Strongly agree 13 34 13 27 15
Agree 43 44 53 53 42
Disagree 38 19 29 18 37
Strongly disagree 6 2 5 1 7
Perceived control. "If I put in
enough effort I can succeed in
mathematics"
Strongly agree 52 63 63 65 51
Agree 46 36 34 32 45
Disagree 3 1 3 3 2
Strongly disagree 0 0 1 0 1
Attributions to failure. "This week I
made bad guesses on the quiz"
Very likely 7 4 8 12 8
Likely 32 24 28 24 29
Unlikely 36 33 36 31 37
Very unlikely 26 39 28 34 26
Perseverance. "When confronted
with a problem, I give up easily"
Very much like me 4 4 3 2 3
Mostly like me 9 4 5 2 8
Somewhat like me 26 27 39 24 24
Not much like me 43 49 36 50 43
Not at all like me 18 16 18 22 22
Teacher support. "The teacher
shows an interest in every student’s
learning"
Strongly agree 39 40 41 42 39
Agree 34 34 36 30 32
Disagree 20 18 22 25 23
Strongly disagree 7 8 2 3 7
Subjective norms. "My parents
believe it’s important for me to study
mathematics"
Strongly agree 44 64 56 77 46
Agree 50 34 39 16 47
Disagree 5 2 4 7 6
Strongly disagree 1 0 0 0 1
Instrumental motivation. "Learning
mathematics is worthwhile for me
because it will improve my career
prospects"
Strongly agree 33 40 40 45 39
Agree 54 50 50 41 46
Disagree 10 7 8 15 10
Strongly disagree 4 3 2 0 5
Attitude towards school. "Trying
hard at school will help me get a
good job"
Strongly agree 49 45 53 57 52
Agree 46 49 42 40 42
Disagree 4 5 4 2 6
Strongly disagree 1 1 1 1 0
Maths behaviour. "I take part in
mathematics competitions"
Always/ almost always 2 16 5 11 2
Often 5 15 9 14 4
Sometimes 16 30 19 26 14
Never / rarely 77 39 66 50 80
Unweighted n 8,454 281 296 103 1,104

44
Appendix C. Differences in quality of school attended by Australian natives and second-
generation East Asian immigrants
In the main body of the paper I illustrated how the inclusion of a school level fixed effect led
to a substantial decline in the second-generation East Asian parameter estimate. One
interpretation is that this result has been driven by East Asian families choosing to send their
offspring to higher quality schools. This appendix examines this proposition in more detail.
To do so, I draw upon various pieces of school-level information, much of which has
been collected as part of the PISA school questionnaire. Specifically, as part of the PISA
2012 study, principals were asked a series of questions about their school. This included both
factual information (e.g. whether it is a private school, the proportion of maths teachers who
hold a maths degree) and their subjective views. The latter involved answering a series of
related questions which have been converted into scales by the survey organisers, including
indicators of school climate, teacher morale, availability of extra-curricular activities and the
quality of the school’s educational resources. In the following analysis, I have standardised
these scales to have a mean of 0 and a standard deviation of 1 across the Australian
population. Moreover, I have changed the direction of certain scales to ensure that larger
positive values always refer to more positive responses (e.g. a value of 1 on the teacher
shortages scale means that there is less likely to be teacher shortages in the school compared
to a value of, say, 0). Appendix Table C1 provides further information on the questions asked
as part of each scale.
Two indicators of school-peer quality have also been derived. The first is calculated
as the average maths test score of all other sampled children who attend the same school. The
second is the average socio-economic status (SES) of all other sampled children in the same
school, with SES defined using the ISEI index of occupational prestige (the highest value out
of the child’s mother or father). For ease of interpretation, these peer quality scales have also
been standardised to have a mean of 0 and standard deviation of 1 within the Australian
population.
Descriptive statistics for each of these ‘school quality’ indicators can be found in
Appendix Table C2. These refer to either percentages (variables above the dashed line) or
mean values on the standardised scales. Positive figures always refer to attendance at a
“higher quality” school.

45
Each of the variables presented in Appendix Table C2 is used as a dependent variable
in an OLS regression model of the form:
𝑄𝑖𝑗 = 𝛼 + 𝛽. 𝐼𝑖 + 𝛿. 𝐷𝑖 + 휀𝑖𝑗 (C1)
Where:
Q = One of the indicators of school quality (as given in Appendix Table C2)
I = A vector of second-generation immigrant dummy variables (reference = Australian-
natives)
D = A vector of demographic characteristics (e.g. age, gender, state, parental education)
휀 = Individual random error term
i = Pupil i
j = School j
Model C1 is estimated 11 times, once using each of the school quality variables (Q). Vector
D includes controls for mothers’ education, fathers’ education, mothers’ occupation, fathers’
occupation, mothers’ current work status, fathers’ current work status, household wealth,
language most often spoken at home, Australian state, urban or remote location, family
structure, age and gender. The parameter of interest is 𝛽 for the second-generation East Asian
immigrant group. This reveals whether there is a difference in school quality) between
Australian natives and second-generation East Asian immigrants, after accounting for
differences in demographic characteristics.
Results can be found in Appendix Table C2 and Appendix Figure C1. The former
illustrates that, although children of East Asian descent are no more likely to attend a private
school than a child with two Australian-born parents, they are 12 percentage points more
likely to attend an academically selective school21. Moreover, approximately 10 percent more
maths teachers hold a maths degree (on average) in the schools that second-generation East
21 Principals were asked “How often the following factors are considered when students are admitted
to your school?” (a) students’ record of academic performance (including placement tests); (b)
recommendation of feeder schools, along with three possible response options (never, sometimes,
always). Schools are defined as “academically selective” if principals responded “always” to at least
one of these two questions.
46
Asian immigrants attend. Differences with respect to Australian natives are statistically
significant at the five percent level.
This is further supported by Appendix Figure C3. This plots the difference between
Australian natives and second-generation East Asian immigrants for each of the “school
quality” standardised scale scores (both those based upon principals’ subjective responses
and the derived measures of peer quality). There are particularly large differences in school-
peers maths test scores; the peers of East Asian children score, on average, 0.65 standard
deviations higher on the PISA maths test than those of native Australian children. This
suggests that East Asian families are much more likely to send their offspring to schools with
higher overall levels of academic achievement. Similarly, children of East Asian heritage
attend schools that have (on average) 0.4 standard deviations better “school climate22”, 0.2
standard deviations better educational resources23 and are 0.2 standard deviations less likely
to have teacher shortages24 (compared to their Australian heritage peers). These differences
are all statistically significant at (at least) the 10 percent level. Moreover, Appendix Figure
C1 also suggests that second-generation East Asian immigrants have more socio-
economically advantaged school peers than the native-Australian group (even after their own
family background has been taken into account).
Overall, this appendix therefore supports the proposition that East Asian families tend
to send their children to “higher quality” schools than Australian families, even when they
share similar socio-economic backgrounds. This is likely to reflect the high value East Asian
families place upon their children’s education. It is also consistent with my suggestion that
the school level fixed effect included in model 3 (Table 2) partly captures this important
element of East Asian culture.
22 An example of a question on this scale is “In your school, to what extent is the learning of students
hindered by student truancy?” 23 An example of a question on this scale is “Is your school’s capacity to provide instruction hindered
by a shortage of instructional materials?” 24 An example of a question on this scale is “Is your school’s capacity to provide instruction hindered
by a lack of qualified maths teachers?”
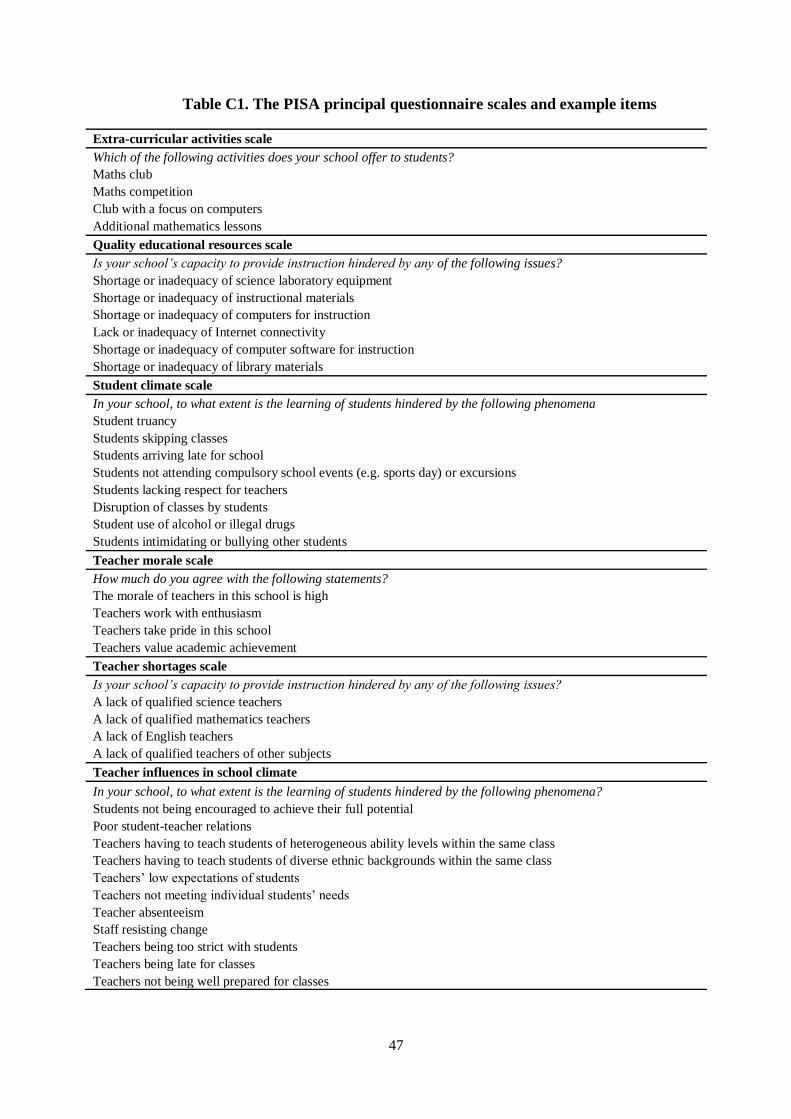
47
Table C1. The PISA principal questionnaire scales and example items
Extra-curricular activities scale
Which of the following activities does your school offer to students?
Maths club
Maths competition
Club with a focus on computers
Additional mathematics lessons
Quality educational resources scale
Is your school’s capacity to provide instruction hindered by any of the following issues?
Shortage or inadequacy of science laboratory equipment
Shortage or inadequacy of instructional materials
Shortage or inadequacy of computers for instruction
Lack or inadequacy of Internet connectivity
Shortage or inadequacy of computer software for instruction
Shortage or inadequacy of library materials
Student climate scale
In your school, to what extent is the learning of students hindered by the following phenomena
Student truancy
Students skipping classes
Students arriving late for school
Students not attending compulsory school events (e.g. sports day) or excursions
Students lacking respect for teachers
Disruption of classes by students
Student use of alcohol or illegal drugs
Students intimidating or bullying other students
Teacher morale scale
How much do you agree with the following statements?
The morale of teachers in this school is high
Teachers work with enthusiasm
Teachers take pride in this school
Teachers value academic achievement
Teacher shortages scale
Is your school’s capacity to provide instruction hindered by any of the following issues?
A lack of qualified science teachers
A lack of qualified mathematics teachers
A lack of English teachers
A lack of qualified teachers of other subjects
Teacher influences in school climate
In your school, to what extent is the learning of students hindered by the following phenomena?
Students not being encouraged to achieve their full potential
Poor student-teacher relations
Teachers having to teach students of heterogeneous ability levels within the same class
Teachers having to teach students of diverse ethnic backgrounds within the same class
Teachers’ low expectations of students
Teachers not meeting individual students’ needs
Teacher absenteeism
Staff resisting change
Teachers being too strict with students
Teachers being late for classes
Teachers not being well prepared for classes
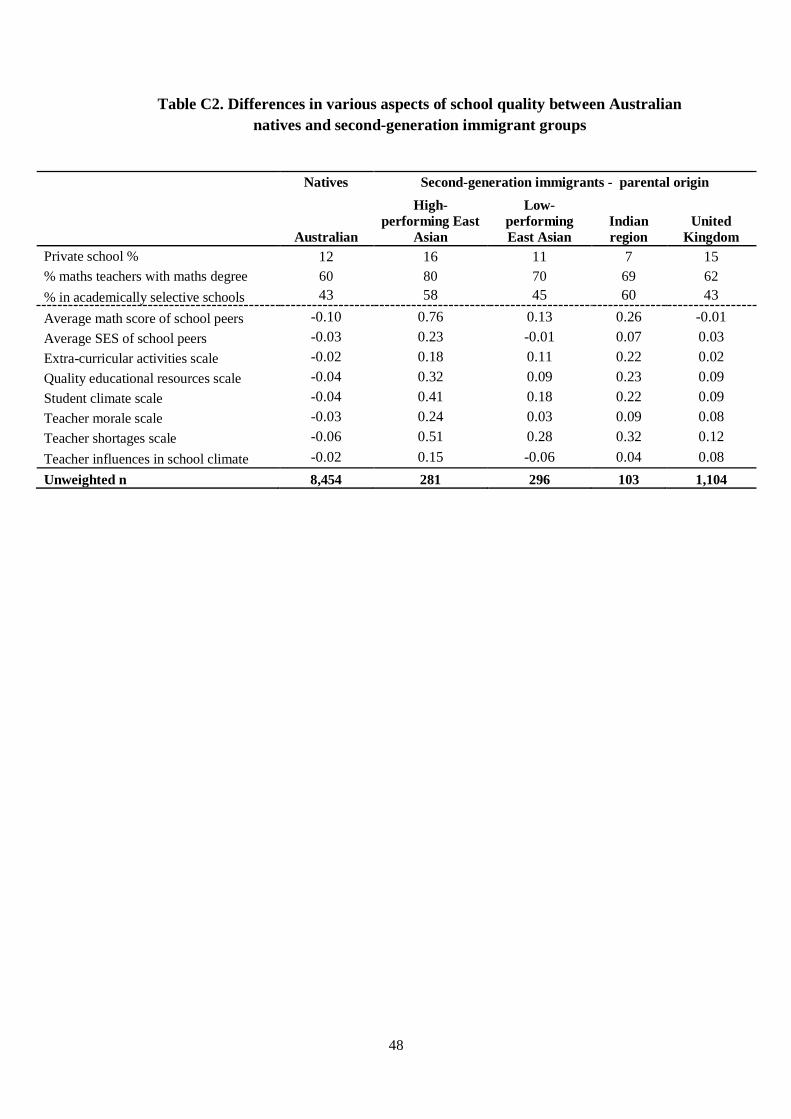
48
Table C2. Differences in various aspects of school quality between Australian
natives and second-generation immigrant groups
Natives Second-generation immigrants - parental origin
Australian
High-
performing East
Asian
Low-
performing
East Asian
Indian
region
United
Kingdom
Private school % 12 16 11 7 15
% maths teachers with maths degree 60 80 70 69 62
% in academically selective schools 43 58 45 60 43
Average math score of school peers -0.10 0.76 0.13 0.26 -0.01
Average SES of school peers -0.03 0.23 -0.01 0.07 0.03
Extra-curricular activities scale -0.02 0.18 0.11 0.22 0.02
Quality educational resources scale -0.04 0.32 0.09 0.23 0.09
Student climate scale -0.04 0.41 0.18 0.22 0.09
Teacher morale scale -0.03 0.24 0.03 0.09 0.08
Teacher shortages scale -0.06 0.51 0.28 0.32 0.12
Teacher influences in school climate -0.02 0.15 -0.06 0.04 0.08
Unweighted n 8,454 281 296 103 1,104
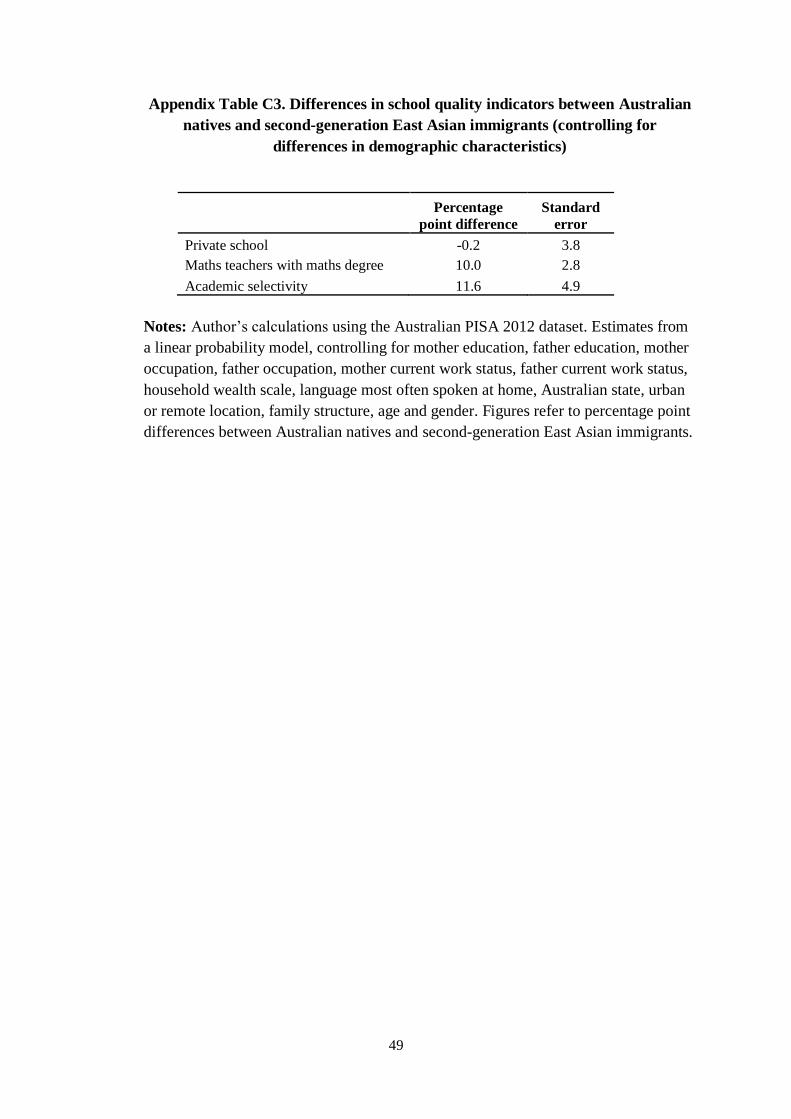
49
Appendix Table C3. Differences in school quality indicators between Australian
natives and second-generation East Asian immigrants (controlling for
differences in demographic characteristics)
Percentage
point difference
Standard
error
Private school -0.2 3.8
Maths teachers with maths degree 10.0 2.8
Academic selectivity 11.6 4.9
Notes: Author’s calculations using the Australian PISA 2012 dataset. Estimates from
a linear probability model, controlling for mother education, father education, mother
occupation, father occupation, mother current work status, father current work status,
household wealth scale, language most often spoken at home, Australian state, urban
or remote location, family structure, age and gender. Figures refer to percentage point
differences between Australian natives and second-generation East Asian immigrants.

50
Appendix Figure C1. Differences in school quality indicators between Australian
natives and second-generation East Asian immigrants (controlling for
differences in demographic characteristics)
Notes: Author’s calculations using the PISA 2012 Australian dataset. Figures refer to
differences between Australian natives and second-generation East Asian immigrants
in terms of national standard deviations. All scales have been recoded so that positive
values refer to more positive responses. Model includes controls for mother
education, father education, mother occupation, father occupation, mother current
work status, father current work status, household wealth scale, language most often
spoken at home, Australian state, urban or remote location, family structure, age and
gender. Thin black line running through the centre of the bars illustrate the estimated
90 percent confidence interval.
0.0 0.2 0.4 0.6 0.8 1.0
Maths skills of school
peers
Student climate
Extra-ciricular activities
School's educational
resources
Teacher shortages
Teacher morale
SES of school peers
Teacher behaviour
Standard deviations difference
51
Appendix D. Alternative estimates – excluding the school-level fixed effect
Appendix Table D1 presents alternative estimates where the school fixed effect has been
removed from the model. All figures refer to differences in standardised PISA maths test
scores between Australian natives and second-generation East Asian immigrants from high-
performing countries. The purpose is to investigate if the broad pattern of results stays the
same – particularly how the parameter estimates change between the different model
specifications. In the main body of the paper, the school fixed effect was entered in model 3
onwards. Hence the figures of interest in Appendix Table D1 come from models 4 to 10.
The broad pattern of results is similar whether the school fixed effect is included in
the model or not. There is no decline in the parameter estimate between models 3 and 4
(when controlling for effort on the PISA test). However, a substantial decline is observed in
both model 5 (controlling for time spent studying outside of school) and model 6 (controlling
for the work ethic, perseverance, perceived control and attributions to failure scales).
Estimates are then stable until models 9 and 10, when another slight decline can be observed
once maths behaviour and educational expectations are included in the model. The magnitude
of the decline is always slightly greater in the models excluding the school fixed effect – but
often by quite small amounts. For instance, the parameter estimate declines by 0.05 standard
deviations between models 5 and 6 when the fixed effect is included, and 0.06 when it is not.
The more notable difference between the two sets of estimates presented in Appendix Table
D1 is that, even after controlling for a host of factors in Model 10, differences between
Australian natives and second-generation East Asian immigrants after much smaller when the
fixed effect is included (0.15 standard deviations) compared to when it has been excluded
(0.48 standard deviations). This provides further evidence that school level factors play a key
role in explaining differences in maths test scores between these groups (over and above what
can be explained by differences in their attitudes, expectations and beliefs).

52
Appendix Table D1. A comparison of estimates with and without including the
school-level fixed effect
With Fixed Effect Without Fixed Effect
Beta SE Beta SE
Model 1 1.02 0.10 1.02 0.10
Model 2 0.84 0.10 0.84 0.10
Model 3 0.41 0.07 - -
Model 4 0.41 0.07 0.84 0.10
Model 5 0.29 0.07 0.67 0.09
Model 6 0.24 0.07 0.61 0.09
Model 7 0.25 0.07 0.62 0.09
Model 8 0.26 0.07 0.63 0.09
Model 9 0.20 0.06 0.56 0.09
Model 10 0.15 0.06 0.48 0.08
n 8,539 8,539
Notes: Figures refer to differences in PISA maths test scores between Australian natives and
second-generation East Asian immigrants from a high-performing countries. All figures
reported in terms of international standard deviations (multiplying figures by 100 gives
differences in terms of PISA points). Model refers to the regression model specification used
(this is to be cross-referenced with Tables 2, 3 and 4). Left hand columns include a school-
level fixed effect in model 3 onwards, figures in the right hand column do not.