why don’t well-educated adults understand accumulation? a...
TRANSCRIPT

UNDERSTANDING ACCUMULATION 1
Why Don’t Well-Educated Adults Understand Accumulation?
A Challenge to Researchers, Educators, and Citizens
Matthew A. Cronin School of Management
George Mason University [email protected]
Cleotilde Gonzalez
Dynamic Decision Making Laboratory Social and Decision Sciences Department
Carnegie Mellon University [email protected]
John D. Sterman
System Dynamics Group MIT Sloan School of Management

UNDERSTANDING ACCUMULATION 2
ABSTRACT
Accumulation is a fundamental process in dynamic systems: inventory accumulates production
less shipments; the national debt accumulates the federal deficit. Effective decision making in
such systems requires an understanding of the relationship between stocks and the flows that
alter them. However, highly educated people are often unable to infer the behavior of simple
stock-flow systems. Poor performance has been ascribed to artifacts including complex
information displays, lack of contextual knowledge, the cognitive burden of calculation, or the
inability to interpret graphs. Here, we demonstrate that poor understanding of accumulation,
termed stock-flow failure, is more fundamental. In a series of experiments, we find that persistent
poor performance is not attributable to an inability to interpret graphs, contextual knowledge,
motivation, or cognitive capacity. Rather, stock-flow failure is a robust phenomenon that appears
to be difficult to overcome. We discuss the origins of stock-flow failure and implications for
management and education.
Keywords: Dynamic decision making, problem representations, accumulation, stocks and flows,
system dynamics

UNDERSTANDING ACCUMULATION 3
INTRODUCTION
Understanding and managing stocks and flows (SF)—that is, resources that accumulate
or deplete and the flows that alter them—is a fundamental process in society, business, and
personal life. At the macroeconomic level, for example, exploration increases known petroleum
reserves, while oil production reduces the stock of oil remaining for the future. In turn, petroleum
combustion increases the stock of carbon dioxide in the atmosphere and contributes to global
warming. At the organizational level, firms’ capabilities and competitive advantages arise from
the accumulation of resources and knowledge (Dierickx & Cool, 1989; Sterman, 1989b). Firms
must manage their cash flows to maintain adequate stocks of working capital, and production
must be adjusted as sales vary to maintain sufficient inventory. Individuals, too, face similar
stock management challenges: We manage our bank accounts (stock of funds) to maintain a
reasonable balance as our incomes (inflows) and expenses (outflows) vary, and we struggle to
maintain a healthy weight by managing the inflow and outflow of calories through diet and
exercise. Accumulation is a pervasive process in everyday life, and arises at every temporal,
spatial and organizational scale.
All stock-flow problems share the same underlying structure. The resource level (stock)
accumulates its inflows less its outflows.1 Though the relationship between stocks and flows is a
fundamental concept of calculus, knowledge of calculus is not necessary to understand the
1 Formally, the stock at any time T, ST is the integral of its net inflow, which, in turn, is the inflow, I, less the
outflow, O (plus the initial quantity):
!
ST = Net Inflow dtt0
T
" + St0
= I #O( )dtt0
T
" + St0
Equivalently, the rate of change of the stock is the net inflow:
!
dS
dt= Net Inflow = I "O
UNDERSTANDING ACCUMULATION 4
concept of accumulation and the behavior of stocks and flows. Any stock can be thought of as
the amount of water in a tub. The water level accumulates the flow of water into the tub (the
inflow) less the flow exiting through the drain (the outflow). The rate of change in the water
level is the net flow, given by the difference between the inflow and outflow. As everyday
experience suggests, the water level rises only when the inflow exceeds the outflow, falls only
when the outflow exceeds the inflow, and remains the same only when the inflow equals the
outflow.2
Prior work has shown that stock-flow problems are unintuitive and difficult, even in
simple systems and even for highly educated people with strong technical backgrounds,
including calculus (Cronin & Gonzalez, in press; Sterman & Booth Sweeney, 2002; Booth
Sweeney & Sterman, 2000). In one experiment, for example, Booth Sweeney and Sterman
(2000) presented highly educated graduate students at an elite university with a picture of a
bathtub and graphs showing the inflow and outflow of water, then asked them to sketch the
trajectory of the stock of water in the tub. Although the patterns were simple, fewer than half the
participants were able to correctly sketch the path of the stock.
Two difficulties contribute to this problem. First, many people find it difficult to
recognize the key stock in a given situation and to distinguish between the stocks and the flows
that alter them—for example, failing to see that the federal deficit is a flow that accumulates into
the national debt or that the number of people in a store is a stock that accumulates the inflow of
people entering the store less the outflow of people exiting. Second, many people have difficulty
applying the principles of accumulation correctly, failing to grasp that the quantity of any stock,
2 In general, there may be many inflows and outflows to a stock. For example, the number of employees in a
division of a firm can be increased by hiring and transfers into the division, and decreased by quits, transfers out,
layoffs, and retirements.

UNDERSTANDING ACCUMULATION 5
such as the level of water in a tub, rises (falls) when the inflow exceeds (is less than) the outflow.
Rather, it appears that people often use intuitively appealing heuristics such as assuming that the
output of a system is positively correlated with its inputs. That is, people assume that the output
(the level of water in a tub) should “look like” the input (the flow or net flow of water into the
tub). We denote such behavior the correlation heuristic.
Correlational reasoning can be useful and adaptive (e.g., illness is highly correlated with
the consumption of certain mushrooms), but the correlation heuristic fails in systems with
significant accumulations. For example, the US federal deficit and national debt have both risen
dramatically in the past half century, and they are highly correlated (r = 0.80 for annual data
from 1950 to 2005, p < .001). However, because the debt is a stock that accumulates the deficit,
the national debt will continue to rise even if the deficit falls—the debt can fall only if the
government runs a surplus. Similarly, birth rates have been falling around the world, but world
population continues to grow even as births decline. Population will stabilize only when births
fall enough to equal deaths.
As these examples suggest, correlation heuristics can lead to erroneous judgments in
situations that have important public policy implications. For example, anthropogenic
greenhouse gases are now emitted at roughly double the rate at which they are removed from the
atmosphere by natural processes (Houghton et al. 2001). Therefore, atmospheric greenhouse gas
concentrations will continue to rise even if emissions fall, until emissions fall to the rate at which
greenhouse gases are removed from the atmosphere. However, experiments show that the vast
majority of highly educated adults assume that greenhouse gas concentrations follow the same
pattern as emissions, leading them to conclude, erroneously, that atmospheric greenhouse gas
concentrations can be stabilized even as emissions into the atmosphere continuously exceed

UNDERSTANDING ACCUMULATION 6
removal from it (Sterman and Booth Sweeney, 2006). Such beliefs are analogous to the assertion
that a bathtub continuously filled faster than it drains will never overflow. They violate
conservation of mass and lead to the erroneous conclusion that the risks of harmful climate
change can be mitigated simply by slowing the growth of emissions.
What we do not yet know is why people are so often unable to relate the behavior of
stocks to their flows (denoted here as SF failure). Although the results of prior work suggest that
poor performance arises from the use of the correlation heuristic (Cronin & Gonzalez, in press;
Sterman & Booth Sweeney, 2002; Booth Sweeney & Sterman, 2000), there are many other
explanations. Perhaps people understand the concept of accumulation but perform poorly
because of complex information displays, the cognitive burden of the calculations required to
determine the level of the stock, inadequate motivation, unfamiliar or inappropriate task context,
or the inability to interpret and construct graphs. If so, it should be relatively easy to induce good
performance through the use of appropriate information displays and relevant, familiar contexts,
or by training participants in the interpretation of graphs. If, on the other hand, SF failure is a
more fundamental limitation of our mental models and cognitive capabilities, it will be robust to
such manipulations.
Understanding the sources of SF failure has important theoretical and normative
implications. First, it will help improve our understanding of human cognition. If the problem is
simply attributable to unfamiliar or poorly designed information displays, then improvement
should be a straightforward matter of proper information system design. If, however, the problem
is robust to these surface features of the task, the source of the problem may lie in deeper
cognitive structures, analogous to the difficulties people have in probabilistic judgment and
decision making (Dawes, 1988, 1998; Kahneman & Tversky, 1972). Second, a better

UNDERSTANDING ACCUMULATION 7
understanding of SF failure can inform the design of curriculum and pedagogical methods aimed
at improving people’s ability to recognize SF structures and infer the relationships among them,
thus improving decision quality.
Here, we investigate the robustness of SF failure. We seek to understand why SF failure
occurs and what might be done to mitigate it. A series of five experiments investigates the
explanations for poor performance identified in prior work. These experiments demonstrate that
poor performance persists across multiple information displays, contexts, computational
requirements, allowed times, and motivation conditions. Neither skill in interpreting graphs nor
the cognitive load of the task appears to be a bottleneck to performance. Poor performance
persists regardless of whether the data are presented in text, tabular, or graphic form, across
many levels of complexity, and across different degrees of motivation. The results suggest that
SF failure is the result of poor ability (1) to recognize the stock and flow structure of a situation
and (2) to apply the principles of accumulation correctly.
The remainder of the paper proceeds as follows: We describe prior work and review the
literature in the context of a simple stock-flow problem. Next we present the experiments, which
address the cognitive burden of the task, information display, task context, motivation and
feedback, cue availability, and priming of prior stock-flow knowledge. We consider limitations
and extensions, discuss the managerial and educational implications of the results, and offer
suggestions for further research to create interventions that may overcome SF failure.
A SIMPLE STOCK AND FLOW PROBLEM
Prior work in dynamic decision making suggests that people have great difficulty
understanding and managing systems with high levels of dynamic complexity. Dynamic
complexity arises from the presence of multiple feedback processes, time delays, nonlinearities,

UNDERSTANDING ACCUMULATION 8
and accumulations (Sterman, 2002). Furthermore, learning in dynamic systems is often slow and
weak, even with repeated trials, unlimited time, and performance incentives (Diehl & Sterman,
1995; Kleinmuntz & Schkade, 1993; Paich & Sterman, 1993; Sterman, 1989a, 1989b). Many of
these studies involved tasks of great complexity, and poor performance was often ascribed to the
opacity of the system, the large number of entities and interactions, feedback delays, and
information overload (Brehmer, 1990, 1995; Gonzalez, 2004; Kleinmuntz, 1985; Omodei &
Wearing, 1995). More recent work, however, has shown that people make persistent mistakes
even in the simplest dynamic systems consisting of one stock, one inflow, and one outflow, with
no feedback processes, time delays, or nonlinearities (e.g., Booth-Sweeney and Sterman, 2000;
Sterman & Booth Sweeney, 2002).
To illustrate, the “department store” task presents participants with a graph showing the
number of people entering and leaving a department store each minute over a 30-minute interval
(Figure 1). The system involves a single stock (the number of people in the store) with one
inflow (people entering) and one outflow (people exiting). There are no feedbacks, time delays,
nonlinearities, stochastic events, or other elements of dynamic complexity that proved difficult in
prior research. Participants are asked four questions. The first two questions—When did the most
people enter the store? When did the most people leave the store—test whether participants can
read the graph and correctly distinguish between inflow and outflow. The third and fourth
questions—When were the most people in the store? When were the fewest people in the store—
test whether participants can infer the behavior of the stock from the behavior of the flows.
To do so, one could manually accumulate the stock by finding the net inflow at each
point of time and then adding the numbers for each time period. This method, however, is
tedious, error prone, and unnecessary. One need only understand that the number of people in the

UNDERSTANDING ACCUMULATION 9
store rises when the flow of people entering is greater than the flow of people leaving (and vice
versa), then note that the number entering is greater than the number exiting through time 13 and
less thereafter. Therefore, without making any calculations, one can see that the most people are
in the store when the two curves cross (Minute 13). Furthermore, because the number of people
in the store rises through Minute 13 and falls thereafter, the fewest people are in the store either
at the beginning or the end of the 30 minutes. To determine which, participants must judge
whether more people (net) enter up to Minute 13 than leave afterward. Once again, calculation is
unnecessary: One can simply judge whether the area between the rate of entering and the rate of
leaving up to Minute 13 is greater or smaller than the area between the two curves from Minute
14 on. The area between the curves from minute 14 on is clearly larger, so the fewest people are
in the store at the end of the 30 minutes. It might be objected that judging the areas of the
irregular shapes defined by the difference between inflow and outflow in figure 1 is difficult.
However, the task was carefully designed to make the determination of the area simple. The area
of the region in which outflow exceeds inflow (after t = 13) was constructed to be twice as large
as the area in which inflow exceeds outflow (prior to t = 13). To test whether people can
determine which area is larger, a convenience sample consisting of 12 members of the support
staff from the MIT Sloan School of Management were asked which area was greater; all
correctly identified the larger area.
------------------------------------------------------------ Insert Figure 1 here
------------------------------------------------------------ Finally, note that people who do not understand the intuitive concepts of accumulation—
that the stock rises when inflow exceeds outflow, and vice versa—can always answer correctly
by simply keeping a running total of the number of people in the store, St = St–1 + It – Ot.

UNDERSTANDING ACCUMULATION 10
Method
A total of 173 students enrolled in a graduate course in business simulation at the MIT
Sloan School of Management were asked to answer simple questions about the department store
task in Figure 1. Participants were primarily MBA students and graduate students from other
MIT departments or from Harvard University. All had taken calculus, and most had strong
mathematics training: 71% had a degree in engineering, mathematics, or the sciences; 28% had a
degree in the social sciences, primarily economics. Fully 40% had a prior graduate degree, most
in technical fields. Students did the task in class at the beginning of the semester. Students were
given approximately 10 minutes. Participation was voluntary. Students were informed that the
results would not be graded but illustrated important concepts they were about to study and
would be used anonymously in this research. To test for order effects, half the participants were
randomly selected to receive the questions about the flows (1 and 2) first (Order O1), as shown
in Figure 1, and half received the two questions about the stock (3 and 4) first (Order O2).
Results
Table 1 summarizes the results of the department store task.3 Question order made no
difference. (Using Fisher’s exact test to compare whether the order of presentation affected the
number answered correctly on each question, the p levels for Questions 1–4 were 0.44, 0.17, 1.0,
and 1.0, respectively). Hence, we pool O1 and O2 in the results presented here. The vast majority
of participants correctly identified when the most people entered and left the store (96% and 95%
for Questions 1 and 2, respectively). However, few were able to answer the stock-flow questions
3 Answers to all questions were considered correct if they were within 1 minute of the correct response, that is,
responses of 12, 13, or 14 were coded as correct responses to the question “During which minute did the most
people enter the store?” These tolerances count as correct those who understood the concepts but might have
misread the time-axis values, favoring high performance.

UNDERSTANDING ACCUMULATION 11
correctly (44% and 31% for Questions 3 and 4, respectively). About 17% indicated that it is not
possible to determine when the most people were in the store, and 25% said that it is not possible
to determine when the fewest people were in the store. Many participants appear to assume that
the stock should match the inflow or the outflow, leading them to make erroneous inferences
about the stock (see Sterman, 2002, for a discussion). To illustrate, 29% incorrectly indicated
that the most are in the store when the net inflow is greatest (t = 8) and 30% incorrectly indicate
that the fewest are in the store when the net outflow is greatest (t = 17). These responses,
accounting for far more of the erroneous choices than any other, reveal a fundamental confusion
about the relationship between stocks and flows. The belief that the extreme values of the stock
coincide with extremes of the net inflow violates the most basic relationships between stocks and
flows.
------------------------------------------------------------ Insert Table 1 here
------------------------------------------------------------
Why is this the case? Is the difficulty that people exhibit in SF tasks (such as the
department store case) an artifact of the task that could easily be remedied, a limitation in
education and training, or a manifestation of a more persistent cognitive limitation? The
experiments presented here test these hypotheses and suggest avenues for research to discover
improved methods to present, learn about, and understand the structure and dynamics of
accumulation.
In all of the experiments, participants were given a problem involving one stock, one
inflow, and one outflow. In all of the experiments, participants were asked to answer the four
questions presented in the baseline experiment. Because the baseline condition revealed no order
effect, the questions were always presented in the same order (most entering, most leaving, most

UNDERSTANDING ACCUMULATION 12
in store, fewest in store). Unless otherwise noted, participants received as much time as needed
(rarely did they need longer than 10 minutes) and were offered no performance-based incentive
(except in Experiment 3).
EXPERIMENT 1: COGNITIVE BURDEN AND DATA DISPLAY
Limited cognitive capacity is a commonly cited explanation for poor performance in
problem solving (Simon, 1979). In SF systems similar to those studied here, the cognitive burden
may arise from the need to manipulate and hold in memory a large set of numbers. Specifically,
individuals might attempt to answer the SF questions by calculating the accumulation of people
in the store each minute. To do so participants must first find the numerical value of the flow of
people entering and leaving the store by reading the graph, then subtract the outflow from the
inflow to compute the net flow, and finally, add the net flow to the running tally of the stock
stored in memory. The baseline task in Figure 1 presents 60 data points (inflow and outflow data
for 30 minutes), perhaps overwhelming participants’ available cognitive capacity and working
memory. Therefore, we created a simpler version of the problem, shown in Figure 2A. The
pattern is similar to that of the baseline condition but presents data for only 12 minutes, and the
value of the flows never exceeds 15 people per minute (compared to nearly 40 people per minute
in the baseline task). We retained the key features of the baseline task: The number of people in
the store rises, peaks, and falls. The most people are in the store at t = 7, and the fewest are in the
store at the end (t = 12). The cumulative number of people leaving after the store population
peaks is twice as large as the number entering before the peak. If cognitive capacity is a source
of error, then performance in the simpler version should improve compared to the baseline. If, on
the other hand, the difficulty arises from a weak understanding of the concept of accumulation,
then performance in the simpler version should not improve. Hence,

UNDERSTANDING ACCUMULATION 13
H1: Performance will improve in simpler versions of the task with fewer data points.
Another common explanation for poor problem solving is confusing information
presentation. To test this possibility, we created three isomorphs of Figure 2A: a bar graph, a
table, and a textual presentation (see Figures 2B–D). Researchers have shown that many people
have difficulty interpreting graphs (Paulos, 1988). If people misread the graph, they are likely to
answer the questions incorrectly as well. The high performance on Questions 1 and 2 suggests
that participants in the baseline condition (MIT graduate students) were able to read the graphs.
Nevertheless, perhaps the use of a graphical display makes it difficult to appreciate the
accumulation of people in the store. If the ability to interpret graphs is the source of the
difficulty, then an alternate data presentation mode, such as a table or text, should improve
performance on the stock-flow questions.
------------------------------------------------------------ Insert Figures 2A–2D here
------------------------------------------------------------
H2.1: Performance will improve if the data are presented in tabular or textual form rather
than in graphic form.
Another possibility is that the form of the graph leads people to misinterpret the problem.
Kotovsky, Hayes, and Simon (1985) showed that problem solving is more difficult when people
cannot reconcile the formulation of a problem with their beliefs about the real world. They used
a puzzle similar to the Tower of Hanoi in which acrobats jump from one stand to another,
sometimes coming to rest on each other’s shoulders. Participants were given isomorphic puzzles
(with the same rule structure, moves, and solution space). For one group, larger acrobats could
not jump onto smaller acrobats’ shoulders, and in the other group, smaller acrobats could not

UNDERSTANDING ACCUMULATION 14
jump onto larger acrobats’ shoulders. The latter group had more difficulty solving the puzzle,
presumably because what they saw conflicted with their belief that smaller people could not hold
larger ones.
A similar conflict may be at work in SF problems. The information in Figures 1 and 2A is
presented using a line graph. Line graphs are often used to represent continuously varying
quantities, such as water flowing into a tub. Here, however, the data points represent the total
number of people who entered or left over the course of each minute, not the instantaneous rate
at which people were entering or leaving at each moment. The continuous flow metaphor
suggested by the line graph may conflict with participants’ conception of the discrete event of a
person entering or leaving a store. Bar graphs are more commonly used to represent totals over
some finite period and may help people recognize and understand the relationship between the
flows and the stock. Hence,
H2.2: People will be more successful at judging the behavior of stocks and flows when
discrete quantities are represented with discrete features (bars instead of lines).
Comparing the table to a textual presentation (Figure 2C versus Figure 2D), participants
should find a numeric table more helpful than a paragraph because the numbers are already
aligned, reducing the cognitive burden involved in finding the values of the inflow and outflow
and calculating the net flow. Hence,
H2.3: Performance should improve when the data are presented in a table compared to
text.

UNDERSTANDING ACCUMULATION 15
Method
Participants (N = 271) were students enrolled in a subsequent term of the same course in
business dynamics at the MIT Sloan School of Management used in the baseline experiment.
The average age was 29 (range 18–38), and 69% were male. Of the participants, 55% were
trained in engineering, mathematics, or the sciences; 38% were trained in economics or another
social science; and 29% held prior advanced degrees. Participants were randomly assigned to one
of the four data presentation modes shown in Figure 2. Participants were demographically
similar to those who participated in the baseline experiment in gender, age, prior education, and
prior advanced degrees. As in the baseline, responses were considered correct if they were within
1 minute of the correct answer, a procedure that favors high performance.
Results
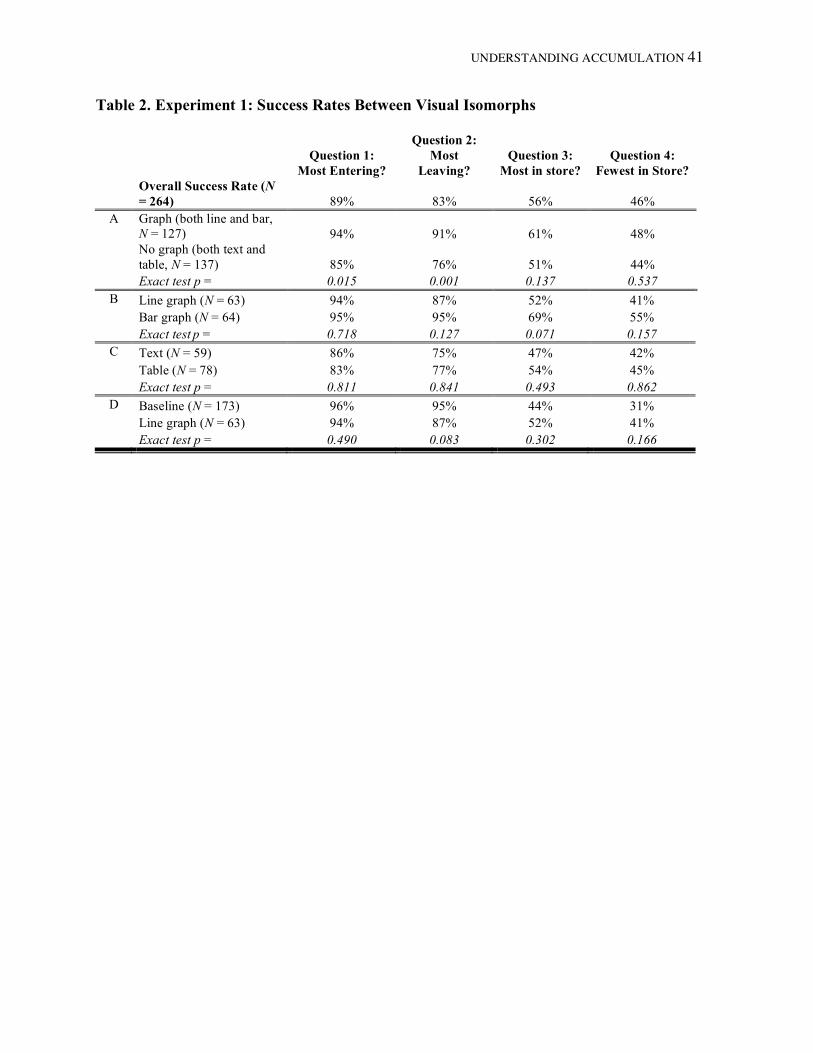
We first consider differences across data display modes (Hypotheses 2.1–2.3). Table 2
compares performance across the four isomorphic data presentation modes. Block A compares
performance in the two graphic conditions (line and bar) to the two nongraphic conditions (table
and text). Contrary to the hypothesis that SF failure is the result of participants’ inability to
interpret graphs, graphic presentation appears to reduce errors in data interpretation. Performance
on Questions 1 and 2 was significantly higher for the graphic representations than for the
nongraphic conditions (p = .015 and .001, respectively). There is also no support for the
hypothesis that participants’ poor ability to interpret graphs is responsible for their poor
understanding of accumulation. Contrary to Hypothesis 1.1, performance on the two stock-flow
questions was no better in the graphic conditions than in the nongraphic conditions.
------------------------------------------------------------ Insert Table 2 here
------------------------------------------------------------

UNDERSTANDING ACCUMULATION 16
There was no significant difference between the line and the bar graph representations
(Table 2, Block B). Performance on the stock-flow questions was slightly better in the bar graph
condition, but the differences were not significant (69% in the bar graph condition correctly
identified when the most are in the store compared to 52% in the line graph condition, p = .07),
and only for Question 3 (there was no difference on Question 4). At best, there is only weak
support for Hypothesis 2.2: Participants did not appear to be confused by the presentation of the
data in the line graph format, which suggests continuous flows, compared to the bar graph
format, which suggests discrete flows.
There also was no difference between the tabular and textual presentations on any of the
questions (Block C). Only one participant in the text condition made a graph from the data,
although the graphic display of the data would have allowed a direct determination of the stock-
flow questions without calculation. None of the participants in the table condition made a graph.
Turning now to the issue of cognitive overload, Block D in Table 2 compares the
performance of participants who received the simple line graph condition (Figure 2A) to the
baseline experiment (Figure 1).4 Results are similar to the baseline. Participants generally
interpreted the data correctly: Performance on Questions 1 and 2 was high, but participants did
poorly on the stock-flow questions. Individuals receiving the simpler version did no better than
those receiving the baseline condition. Like the baseline, many participants in the line graph
condition indicated that the answer to the stock questions could not be determined (21% and
4 Because the baseline task in Figure 1 and the simpler tasks in Figure 2 were administered to students taking the
same class in successive years, it is possible that there are unmeasured sources of variation that could confound the
interpretation of the results. However, the tasks were administered to each group by the same instructor (JS), in the
same course, at the same point in the semester, in the same classroom, at the same time of day, and with the same
instructions and time for completion. There were no significant differences in the demographic characteristics of the

UNDERSTANDING ACCUMULATION 17
27% for Questions 3 and 4, respectively, compared to 17% and 25% in the baseline; p = .44,
.86). Thus, Hypothesis 1 is not supported: The simpler version of the task with far fewer data
points did not improve performance on the stock-flow questions.
One may argue that, although the simplified graph, with its 12 rather than 30 minutes of
data, reduces the mental burden of the task, it still overwhelms participants’ cognitive capacity.
However, even simpler versions with still fewer data points and even simpler patterns did not
improve performance. To illustrate, Figure 3 shows an extremely simple pattern with both the
number of people entering and leaving the store rising linearly over 5 minutes (Cronin &
Gonzalez, in press). Though participants had no difficulty answering Questions 1 and 2 correctly
(97% on both), performance on the stock-flow questions was low (most in store, 33%; fewest in
store, 37%), similar to the baseline experiment (participants, N = 35, were a mix of
undergraduate and graduate students at Carnegie Mellon University). These results argue against
the hypothesis that cognitive overload causes poor performance.
------------------------------------------------------------ Insert Figure 3 here
------------------------------------------------------------ Overall, the results of Experiment 1 do not support the hypotheses that cognitive
capacity, the ability to interpret graphs, or the mode of information display cause poor
performance in stock-flow systems.
EXPERIMENT 2: TASK CONTEXT
Another explanation for SF failure is that the task context or cover story does not activate
the participants’ stock-flow knowledge—people may understand the principles of accumulation
two groups. Nevertheless, we alert the reader to the possibility that the results could reflect unmeasured sources of
variability across the two groups.

UNDERSTANDING ACCUMULATION 18
but are unable to recognize the stock and flow structure of the situation. Problem framing and
task context can significantly change people’s decisions (Tversky & Kahneman, 1986) and
decision processes—for example, people tend to make different decisions when a choice is
framed as a monetary gamble or a jury verdict, even when the two problems have the same
probability structure (Rettinger & Hastie, 2001). The cover story may bring some knowledge
into working memory while other knowledge remains latent. For example, it is possible that even
people who have studied calculus may not recognize the stock-flow structure of the department
store context. However, they might be able to do so if the context were more familiar or
involved fewer distractions (e.g., When did the store open? What do the people do in the store?
What time of day is it?).
Therefore, we created two additional cover stories for the original baseline task outlined
in Figure 1. In the tub condition, the data represent the flow of water into and out of a bathtub,
and the stock is the quantity of water in the tub. In the cars condition, the data represent the
velocities of two cars traveling in the same direction; the stock is the distance between them.
We hypothesize that the likelihood of activating the stock-flow schema depends on the
salience and familiarity of the accumulation process in the task context. People are likely to have
more experience and familiarity with bathtubs and driving than with the flow of people into and
out of a store. Accumulation is the purpose and focus of attention when filling a container, and
people can directly observe the flows and water level. Similarly, monitoring the distance
between vehicles is a central task in driving, and the speed and distance between cars are directly
observable. In contrast, the flows of people into and out of a store and the population of people
within it are not typically observable in everyday experience. If salience and familiarity are
UNDERSTANDING ACCUMULATION 19
important in activating participants’ latent stock-flow knowledge, then performance in the tub
and driving conditions should be better than in the store condition.
H3.1: People will make better judgments of a stock’s behavior when the context is more
familiar and the stock is more salient, implying better performance in the tub and cars
conditions than in the store condition.
The activation of latent stock-flow knowledge may also depend on whether the cover
story involves discrete events or continuous flows. Common examples of accumulation used in
high school mathematics and physics classes, for example, involve continuous quantities and
flows, such as water filling a tank or velocity accumulating into distance traveled. The store
context, however, involves discrete, unique individuals entering and leaving at particular
moments, which may prevent participants from recognizing the stock-flow structure. Both the
tub and cars conditions involve continuous quantities that evolve in continuous time. If the
correspondence of the cover story to a schema of accumulation that involves continuously
varying flows is important to participants’ ability to recognize the stock and flow structure of the
problem, then performance in the tub and car conditions should also exceed performance in the
store condition.
H3.2: People will be better able to judge the behavior of the stock when the stock
represents a continuous rather than a discrete quantity, implying better performance in the
tub and cars conditions than in the store condition.
Method
We recruited 47 undergraduate students from Carnegie Mellon University who
participated voluntarily and received $5.00 compensation for their time. The average age was 25.

UNDERSTANDING ACCUMULATION 20
No gender information was collected in this case. Participants were randomly assigned to the tub,
cars, or store condition.
Results
As in prior experiments, this population showed excellent ability in reading the graph
(Table 3), with 96% and 94% correctly answering Questions 1 and 2, respectively. Also
consistent with prior conditions, performance on the stock questions was poor (28% and 26% for
Questions 3 and 4, respectively). There were no statistically significant differences in
performance on the stock questions across the different task contexts. Furthermore, success rates
on Questions 3 and 4 remained less than 38%. Thus, neither Hypothesis 3.1 nor 3.2 is supported:
Participants’ poor ability to relate flows to the stock does not appear to be an artifact of the
context. The more familiar tub and driving contexts, with their continuously varying flows rather
than discrete individuals, do not appear to improve performance.
------------------------------------------------------------ Insert Table 3 here
------------------------------------------------------------
EXPERIMENT 3: MOTIVATION AND FEEDBACK
Another explanation for SF failure is that people do not think much about their answers.
In the baseline task shown in Figure 1 and in some prior research (Booth Sweeney & Sterman,
2000), no incentives were offered for performance, perhaps reducing motivation and effort. As
Petty and others (Petty & Caccioppo, 1986; Petty & Wegener, 1998) have shown, people who do
not have a reason to think hard about a problem will rely on simple heuristics to make judgments
instead of solving problems analytically or challenging the appropriateness of the commonsense
approach.

UNDERSTANDING ACCUMULATION 21
We expect that participants are more likely to use heuristics that do not account for stock-
flow structure, such as the correlation heuristic, when they are not motivated to think hard about
their answers. Although individuals may realize that calculating the net change in the stock and
accumulating it manually for each time period will yield the answer, they may choose not to do
so. Similarly, with low motivation, people may devote insufficient cognitive effort to the
examination of the problem and fail to notice the stock and flow structure. Prior work (Sterman
& Booth Sweeney, 2002; Booth Sweeney & Sterman, 2000) has shown that many people assume
the output of a system (here, the stock) is correlated with the input (here, the inflow or net flow).
With low motivation, people may simply use a heuristic based on matching the pattern of the
flows. Such a heuristic yields an answer—albeit an incorrect one—quickly and with little effort.
In contrast, high motivation should encourage greater cognitive effort, increasing the probability
that participants will recognize the stock-flow structure and use their understanding of
accumulation to derive the correct answer. Even if some participants fail to grasp that the stock
rises when inflow exceeds outflow and falls when outflow exceeds inflow—which would allow
them to answer correctly without calculation—higher motivation should lead more participants
to calculate the running total store population, improving performance even if they do not
understand the nature of accumulation.
H4.1: High motivation will improve performance on the stock-flow questions.
Low motivation may also lead people to fail to check their answers, resulting in careless
mistakes. If so, feedback on their initial responses might motivate participants to devote
additional cognitive effort to the task, increasing the likelihood of activating their latent
understanding of stock-flow knowledge. Motivation to think more about a wrong answer should
also eliminate answers that are wrong but plausible.

UNDERSTANDING ACCUMULATION 22
H4.2: Feedback that alerts participants to mistakes will improve performance on
subsequent attempts.
Method
We recruited two groups of undergraduate students from the George Mason University
School of Management, all of whom participated for course credit. Group 1 (N = 32) received the
motivation/feedback condition. The average age of this group was 22 (range 19–45), and 51%
were male. Group 2 (N = 37) received the no motivation/no feedback condition. The average age
of this group was 24 (range 19–50), and approximately 45% were male. Participants in both
conditions received the standard protocol for the task outlined in Figure 4 and were given up to
one hour to complete the task.
------------------------------------------------------------ Insert Figure 4 here
------------------------------------------------------------ In the no motivation/no feedback condition, participants only had to answer the four
questions and received no performance-based reward. In the motivation/feedback condition,
participants were instructed to answer the four questions and then bring their papers to the
experimenter to find out whether their answers were correct. Incorrect responses were marked
wrong, but no other information was provided. The participants returned to their seats with the
same graph to correct their response(s). Participants then turned in their sheets to the
experimenter and again received feedback. Participants continued this process until they
answered all four questions correctly. Motivation was induced by informing participants that
they could leave the session once they answered all questions correctly or after one hour,
whichever came first. Participants normally spend less than 10 minutes answering the four

UNDERSTANDING ACCUMULATION 23
questions (which was also true for the no motivation/no feedback group), so those answering
correctly could save the bulk of an hour, motivating them to do well on the first attempt.
The effect of motivation was assessed by comparing the performance of those in the no
motivation/no feedback condition to the performance of those in the motivation/feedback
condition on the first attempt (between participants). The effect of feedback was assessed by
comparing the percentage of people in the motivation/feedback condition who answered the
question correctly on the first try to the percentage of those who answered correctly on the
second try after receiving feedback (within participants).
Results
Results for participants’ first attempt are similar to prior conditions: Nearly all of the
participants read the graph correctly on their first attempt (94% and 97% for Questions 1 and 2,
respectively; see Table 4A), but very few answered the stock-flow questions correctly (16% and
13% for Questions 3 and 4, respectively). Thus, performance on the stock-flow questions was
poor in both conditions, and the differences in performance between the two conditions were not
statistically significant for either the graph interpretation questions (1 and 2) or the stock-flow
questions (3 and 4) . Motivation did not significantly improve performance on the first trial for
the stock-flow questions. Therefore, Hypothesis 4.1 not supported: Poor performance does not
appear to be caused by low effort.
Turning to the impact of feedback, although feedback did eventually improve
performance, we saw no indication that the stock-flow errors were simple, easily correctable
mistakes. The number of participants who answered the stock-flow questions correctly rose
slowly: Only 28% and 25% correctly answered Questions 3 and 4, respectively, on the second
attempt, and by the sixth attempt, performance reached 81% and 84%, respectively. There was

UNDERSTANDING ACCUMULATION 24
no further improvement with continued trials; the remainder of the participants were unable to
answer the stock-flow questions on the first task by the end of the hour and were dismissed. The
mean number of attempts made on the first task before correctly answering both stock-flow
questions was 4.6. Table 4B compares participants’ performance on the first and second attempts
in the motivation/feedback condition. The table reports the success rate for those who failed to
respond correctly the first time. For example, of 32 total participants, 5 answered question 3
correctly the first time (16%). Of the remaining 27 participants, 4 answered correctly on the
second attempt (15%). There is no statistically significant difference in success rates on the
stock-flow questions after the participants were given feedback.
Many participants recorded calculations on their papers. Most recorded the net flow each
minute and a running total of the store population, suggesting that these participants attempted to
calculate the number in the store rather than grasping the pattern of relationships between the
stock and flows (recall that all questions can be answered without any calculation by applying
the basic concepts of accumulation). Table 4C compares the performance of those who recorded
calculations to those who did not. People did no better even when they attempted a purely
mechanical, calculation method. None of the differences are significant.
------------------------------------------------------------ Insert Tables 4A–4C here
------------------------------------------------------------ The first three experiments provide no support for the hypotheses that SF failure is an
artifact of information display, the inability to read graphs, the cognitive load of required
calculations, unfamiliar or incompatible contexts, poor motivation, or lack of feedback. The
results are consistent with the hypothesis that that the difficulty lies in the conceptualization
(rather than the execution) of problem solving. Poor performance appears to arise from weak

UNDERSTANDING ACCUMULATION 25
understanding of the concepts of accumulation. The following experiments seek insight into the
sources of SF failure—specifically, the erroneous cognitive models that may be created by faulty
encoding and interpretation of stock-flow situations.
EXPERIMENT 4: INFERRING FLOWS FROM THE STOCK
So far, all of the tasks required participants to infer the behavior of the stock from the
behavior of the flows. Doing so requires people to understand that the stock is the accumulation
of the net flow (the running total of inflow less outflow). Next, we test whether people
understand that the rate of change in the stock is the net flow into the stock. For example, if the
inflow was 20 units during the last minute and the stock increased by 10 units during that
interval, then the outflow must have been 10 units. Inferring the flows from the stock might be
easier than accumulating the stock from its flows because it does not require people to keep track
of the running total or to estimate the area swept out by the difference between the inflow and
outflow.
We modified the task so that the behavior of the stock and one of the flows is given and
then asked participants to infer the behavior of the other flow. We used the same four questions.
When the stock is given, the answers to Questions 3 and 4—When were the most/fewest people
in the store?—can be read directly from the graph. When the inflow is given, the answer to
Question 1—When did the most people enter the store?—is also given directly. Participants must
infer the answer to the remaining question—When did the most people leave the store?—by
comparing the net change in the stock to the inflow. Doing so is simple: The change in the stock
is ΔSt = It – Ot, so the outflow is given by Ot = It – ΔSt. In the foregoing example, the inflow is
20, but the net change is only 10, so the outflow must be 10. No running total need be estimated
or calculated. The situation is analogous when the stock and outflow are given. If the difficulty

UNDERSTANDING ACCUMULATION 26
people have with SF problems arises from their inability to keep a running total of the store
population, performance should improve. If, however, the problem is that people do not
understand the concept of accumulation, performance will not improve. Hence,
H5: On graphs showing the stock and one of its flows, success rates in identifying the
behavior of the absent flow will be similar to success rates identifying the behavior of the
absent stock when both flows are given.
Method
We recruited 30 George Mason University undergraduates, all of whom participated for
course credit. Participants were given three simple 5-point graphs (Figure 5A–5C). Figure 5A
gives both flows but not the stock (the usual condition), Figure 5B gives the stock and outflow
but not the inflow, and Figure 5C shows the stock and inflow but not the outflow. The order of
presentation of the graphs was counterbalanced; there was no statistically significant order effect
in the results. Participants were asked the standard four questions for each task.
------------------------------------------------------------ Insert Figures 5A–5C here
------------------------------------------------------------
Results
Table 5 presents the success rates across conditions. The gray squares indicate the
information that could not be read directly from the graph. Results for the standard task with the
stock missing were similar to prior experiments: Most people read the graph well but did poorly
in assessing the behavior of the stock (3% and 10% for Questions 3 and 4, respectively).
Performance in the missing flow conditions was similarly poor. In the missing inflow condition,
performance on Question 1 was 7%, which was not statistically different from the success rates

UNDERSTANDING ACCUMULATION 27
on Question 3 or 4 in the missing stock condition. Similarly, in the missing outflow condition,
performance on Question 2 was 10%, which was not statistically different from the success rates
on Questions 3 or 4 in the missing stock condition.
------------------------------------------------------------ Insert Table 5 here
------------------------------------------------------------
The results support Hypothesis 5: People have as much trouble inferring the behavior of a
stock-flow system when one of the flows is missing as they do when they are asked to determine
the behavior of the stock. People’s poor performance is consistent with the tendency to use
information that is given while overlooking relevant information that is only implied (Fischhoff,
Slovic, & Lichtenstein, 1978; Klein, 1999). In the missing flow conditions, the implied relevant
information included the net change in the stock, which could easily be calculated from
successive values of the stock.
EXPERIMENT 5: DIRECT ACTIVATION OF STOCK-FLOW KNOWLEDGE
Given people’s tendency to ignore information that is not explicitly given when making
decisions (Fischhoff & Downs, 1997; Ross & Creyer, 1992), bringing relevant but implied
information to people’s attention should improve performance—if they understand the principles
of accumulation. Experiment 4 should have helped because the missing flow condition presents
participants with data for both a flow and the stock, while the baseline condition presents only
flow data. However, performance did not improve. In Experiment 5, we strengthened the cues
designed to activate participants’ latent knowledge of stock-flow systems. We used a priming
task that explicitly directed participants’ attention to the accumulation of the flows into the stock.
If people are forced to think about the stock and its accumulation pattern, then their knowledge
of accumulation, if it exists, should be activated for subsequent problems. Such direct activation

UNDERSTANDING ACCUMULATION 28
should improve performance in the same way that a hint works in changing peoples’
representations in insight problems (Kaplan & Simon, 1990).
H6: Providing cues to encourage participants to notice the presence and behavior of SF
structures will increase their success in understanding the relationship between stocks and
flows.
Method
We recruited 37 undergraduate students at George Mason University, all of whom
participated for course credit. Their average age was 23 (range 19–44), and 42% were male.
Participants were first given a priming task with an extremely simple version of the department
store task (Figure 6A). The priming graph shows a constant inflow of 10 people per minute and a
constant outflow of 5 people per minute, over an interval of five minutes. Written instructions
asked participants to determine how many people are in the store each minute (assuming none
were there initially). The explicit direction to record how many are in the store each minute
should help participants recognize that the number of people in the store accumulates the inflow
less the outflow without explicitly telling people how to do the calculation. The extreme
simplicity of the example reduces the cognitive burden of the required calculations. Immediately
after completing the priming task, participants were given the simple task shown in Figure 6B
and asked to answer the standard four questions.
------------------------------------------------------------ Insert Figures 6A and 6B here
------------------------------------------------------------
UNDERSTANDING ACCUMULATION 29
Results
Overall success rates (Table 6) approximated those observed in the other conditions: high
success rates on the first two questions, indicating that the participants could read the graph, and
low success rates on the stock questions, indicating that the participants generally did not
understand the concepts of accumulation (27% and 38% for Questions 3 and 4, respectively).
Success on the stock-flow questions was marginally higher than the baseline for this population
(8% and 16% on an isomorphic 5-point graph),5 so priming did have some effect, partially
supporting Hypothesis 6. Yet it by no means eliminated the problem. Surprisingly, nearly half
the participants (18 of 37) did the priming task incorrectly; most of these participants responded
that the number of people in the store each minute was 5, 5, 5, 5, 5—that is, they gave the net
flow of people into the store rather than the total number (5, 10, 15, 20, 25). Those who
responded correctly did significantly better on the stock-flow questions in Figure 6B than those
who did not: None of those who failed on the priming task correctly identified when the most
people were in the store, compared to about half of those who did the priming task correctly (p =
.0004). Only one of those who failed on the priming task correctly identified when the fewest
people were in the store, compared to 68% of those who got the priming task right (p = .0001).
------------------------------------------------------------ Insert Table 6 here
------------------------------------------------------------
The results suggest that many people (about half the participants) did not understand the
concept of accumulation. However, even for those who answered the priming question correctly,
5 Though the baseline graph was given in a different semester, the populations from which all the George Mason
University participants were drawn were very similar, as were recruitment methods and the manner (room, time,
etc.) in which the tasks were administered. Nevertheless, the same caveat as in note 4 applies.

UNDERSTANDING ACCUMULATION 30
success rates on the stock-flow questions in Figure 6B remained discouragingly low for such a
simple task. Many who could accumulate the net flow of people in the store mechanically in the
priming task (Figure 6A) were unable determine when the most and fewest people were in the
store in Figure 6B despite the extreme simplicity of that task. It appears that many participants
not only had difficulty applying the principles of accumulation but also failed to recognize the
stock-flow structure of the task, even after being explicitly directed to carry out the accumulation
of inflow and outflow into a stock. The results suggest that for these people, the problem is not
the failure to activate knowledge of accumulation but the lack of such knowledge.
GENERAL DISCUSSION
Results from the five experiments reported here demonstrate an important and pervasive
problem in human reasoning: our inability to understand stocks and flows, that is, the process by
which flows into and out of a stock accumulate over time. Stock and flow structures are
pervasive in systems at all scales, from the accumulation of water in a tub to the accumulation of
greenhouse gases in the atmosphere. Effective decision making in dynamic settings requires
decision makers to understand accumulation. Prior work has demonstrated that even highly
educated people do poorly on a range of simple stock-flow problems.
We tested whether people in fact understand the concepts of accumulation, but perform
poorly due to information displays, unfamiliar contexts, inadequate motivation, inability to read
or construct graphs, or limited cognitive capacity. We found no support for these hypotheses.
Poor performance persisted even when the tasks could be done without any calculation, when the
number of data points presented was reduced by a factor of six, and regardless of whether the
data are displayed in line graphs, bar graphs, tables, or text (Experiment 1). Poor performance
was robust to changes in the cover story and to contexts that involved discrete entities or

UNDERSTANDING ACCUMULATION 31
continuously varying quantities (Experiment 2). Modest incentives to respond correctly did not
lead to improvement on the first attempt (Experiment 3). The problem persisted regardless of
whether people were asked to infer the accumulation of the stock from the flows or the behavior
of the flows from the stock (Experiment 4). Many could not correctly accumulate the quantity in
the stock even when they were explicitly directed to do so in a problem with constant flows
(Experiment 5), and many of those who could had difficulty applying the concepts to a
subsequent, highly simplified problem (Experiment 5). Finally, although outcome feedback
indicating when participants had provided an incorrect answer did improve performance, the
improvement was slow, and a number of people never responded correctly, even after many
trials (Experiment 3).
Although most of the experiments allowed participants 10 minutes to finish the task, most
of the participants finished much earlier. Many reported high confidence that their answers were
correct, even when they were not. In Experiment 3, for example, in which participants were
given performance feedback, many participants expressed disbelief when they were told that
their answers were incorrect. These behaviors, coupled with the persistence of poor performance
in the face of large manipulations in task features, context, and so forth, suggest that SF failure
shares some features with insight problems (Mayer, 1995). Insight problems are analytically
easy—once one recognizes the proper frame to use. Until then, people tend to use a flawed but
intuitively appealing problem frame. Consider, for example, this problem: “A man has married
20 women in town. He has divorced none of them, and they are all still alive, yet he is not a
polygamist. How?” This question is challenging only because people assume that the man is
married to the women, not that the man performed the marriage ceremony as part of their
cognitive representation of the problem.

UNDERSTANDING ACCUMULATION 32
It seems that people often use the wrong representation to think about the stock and flow
structure of the situation and employ heuristics that are intuitively appealing but erroneous—for
example, they assume that the output of the system (here, the stock) should be correlated with its
inputs (the flows or net inflow). The intuitive appeal of the correlation heuristic appears to be
quite strong: Attempts to activate participants’ latent knowledge of accumulation through cover
stories emphasizing familiar contexts with continuously varying quantities (Experiment 2),
through motivation and feedback (Experiment 3), and by explicitly directing people to
accumulate a stock prior to doing the task (Experiment 5) had little impact.
The results indicate that two problems contribute to poor performance. First, people have
difficulty recognizing the stock in a given situation—in this case, they fail to grasp that the
number of people in a store is a stock that accumulates arrivals less departures. If recognizing the
stock were the only problem, then helping people attend to the stock would improve
performance. However, the results, particularly those of Experiment 5, suggest that for many
people, the problem is not merely the failure to recognize the stock but ignorance of the basic
principles governing accumulation (the relationships between the flows and the stock over time).
Many people fail to grasp that, like any bathtub, the quantity of any stock rises (falls) when the
inflow exceeds (is less than) the outflow. For these people, intuitively appealing heuristics such
as pattern matching appear to dominate their judgment. Consistent with the results of the
baseline experiment reported here, and with Cronin and Gonzalez (in press), people tend to
identify the point with the highest inflow (outflow) or the greatest (smallest) instantaneous net
difference as the point at which the stock is most full (empty).
The use of inappropriate heuristics and the persistence of error in stock and flow
problems, even among highly educated individuals, is reminiscent of the difficulties that people

UNDERSTANDING ACCUMULATION 33
have with probabilistic judgment. Much productive research has come from studying errors in
probabilistic reasoning (e.g., Dawes, 1998) and has found broad application in fields such as risk
analysis (Kahneman & Tversky, 1979) and negotiation (Bazerman & Neale, 1992). Insight into
people’s difficulties with dynamic decision making, including stock and flow structures, may
yield similar practical benefits, especially in forecasting, operations, strategy, and a variety of
important public policy domains.
Understanding the nature of people’s errors in stock-flow situations may also inform the
study of human cognition. Understanding how individuals set up a problem is a burgeoning area
of research (Legrenzi, Girotto, & Johnson-Laird, 1993), and is arguably understudied in
cognitive psychology (Simon, 1991). There is little work on the generation of insight in the
context of standard problem solving (Cronin, 2004); the class of stock-flow structures may
present opportunities to explore the nature of insight in a common and important class of
everyday reasoning problems.
The biggest challenge for future work is to find effective methods to improve people’s
understanding of stock-flow systems. Doing so requires greater insight into the construction and
nature of people’s mental representations as they try to solve SF problems. The use of verbal
protocols, as Chi, Feltovich, and Glaser (1981) suggest, may reveal the deep structure of this
class of problems, including other influences that promote or inhibit the discovery of the
structural relationship between stocks and flows. Other pedagogical methods should be
investigated, including having people work in teams so that those who appreciate stock-flow
structures can correct the heuristic errors of others (Heath, Larrick, & Klayman, 1998). The
impact of background training in systems thinking and dynamic modeling should also be
explored.

UNDERSTANDING ACCUMULATION 34
Research should investigate the cues that trigger or inhibit the use of the correlation
heuristic and the learning processes through which individuals acquire and use the deep structure
of the problem. Learning in many domains, including dynamic decision making, often occurs
implicitly (Gonzalez, 2005; Gonzalez, Lerch, & Lebiere, 2003; Reber, 1976, 1989): Individuals
who do well on a task are not always aware of the task structure, may not be able to describe the
key elements of the task, and may be unable to verbalize the ways in which they make decisions,
suggesting that the knowledge acquired does not take the form of rules about how the system
works. Future research should seek to discover ways in which we can provide individuals with
both implicit and explicit knowledge of stock and flow problems, increasing our ability to
understand the dynamics of complex systems affecting our personal lives, organizations, and
society.
ACKNOWLEDGMENTS
This research was partially supported by the ONR Multidisciplinary University Research
Initiative Program (N00014-01-1-0677) and by Army Research Laboratory research grants
(DAAD19-01-2-0009) to Cleotilde Gonzalez. We are grateful to Polina Vanyukov, who helped
collect some of the data reported here. John Sterman is supported by the Project on Innovation in
Markets and Organizations at the MIT Sloan School of Management.

UNDERSTANDING ACCUMULATION 35
References
Bazerman, M. H., & Neale, M. A. (1992). Negotiating rationally. New York: Free Press.
Booth Sweeney, L., & Sterman, J. D. (2000). Bathtub dynamics: Initial results of a systems
thinking inventory. System Dynamics Review, 16(4), 249–286.
Brehmer, B. (1990). Strategies in real-time, dynamic decision making. In R. M. Hogarth (Ed.),
Insights in decision making: A tribute to Hillel J. Einhorn (pp. 262–279). Chicago:
University of Chicago Press.
Brehmer, B. (1995). Feedback delays in complex dynamic decision tasks. In P. A. Frensch & J.
Funke (Eds.), Complex problem solving: The European perspective (pp. 103-130). Hillsdale,
NJ: Lawrence Erlbaum.
Chi, M. T. H., Feltovich, P. J., & Glaser, R. (1981). Categorization and representation of physics
problems by experts and novices. Cognitive Science, 5(2), 121–152.
Cronin, M. A. (2004). A model of knowledge activation and insight in problem solving.
Complexity, 9(5), 17–24.
Cronin, M. A., & Gonzalez, C. (in press). Understanding the building blocks of dynamic
systems: What is the problem, really? System Dynamics Review.
Dawes, R. M. (1988). Rational choice in an uncertain world. San Diego, CA: Harcourt Brace
Jovanovich.
Dawes, R. M. (1998). Behavioral decision making and judgment. In D. T. Gilbert, S. T. Fiske, &
G. Lindzey (Eds.), The handbook of social psychology (4th ed., pp. 497–538). Boston:
McGraw-Hill.
Diehl, E., & Sterman, J. D. (1995). Effects of feedback complexity on dynamic decision making.
Organizational Behavior and Human Decision Processes, 62(2), 198–215.

UNDERSTANDING ACCUMULATION 36
Dierickx, I., & Cool, K. (1989). Asset stock accumulation and sustainability of competitive
advantage. Management Science, 35(12), 1504–1511.
Fischhoff, B., & Downs, J. (1997). Accentuate the relevant. Psychological Science, 8(3), 154–
158.
Fischhoff, B., Slovic, P., & Lichtenstein, S. (1978). Fault trees: Sensitivity of estimated failure
probabilities to problem representation. Journal of Experimental Psychology: Human
Perception and Performance, 4(2), 330–344.
Gonzalez, C. (2004). Learning to make decisions in dynamic environments: Effects of time
constraints and cognitive abilities. Human Factors, 46(3), 449–460.
Gonzalez, C. (2005). Decision support for real-time dynamic decision making tasks.
Organizational Behavior and Human Decision Processes, 96(2), 142–154.
Gonzalez, C., Lerch, F. J., & Lebiere, C. (2003). Instance-based learning in dynamic decision
making. Cognitive Science, 27(4), 591–635.
Heath, C., Larrick, R. P., & Klayman, J. (1998). Cognitive repairs: How organizational practices
can compensate for individual shortcomings. In B. M. Staw & L. L. Cummings (Eds.),
Research in organizational behavior (Vol. 20, pp. 1–37). Greenwich, CT: JAI Press.
Houghton, J., Ding, Y., Griggs, D., Noguer, M., van der Linden, P., Dai, X., Maskell, K., and
Johnson, C., eds, (2001). Climate Change 2001: The Scientific Basis. Cambridge, UK:
Cambridge Univ. Press.
Kahneman, D., & Tversky, A. (1972). Subjective probability: A judgment of representativeness.
Cognitive Psychology, 3(3), 430–454.
Kahneman, D., & Tversky, A. (1979). Prospect theory: An analysis of decision under risk.
Econometrica, 47(2), 263–291.

UNDERSTANDING ACCUMULATION 37
Kaplan, C. A., & Simon, H. A. (1990). In search of insight. Cognitive Psychology, 22(3), 374–
419.
Klein, W. M. P. (1999). Justifying optimistic predictions with minimally diagnostic information
under conditions of outcome dependency. Basic and Applied Social Psychology, 21(3), 177–
188.
Kleinmuntz, D. N. (1985). Cognitive heuristics and feedback in a dynamic decision environment.
Management Science, 31(6), 680–702.
Kleinmuntz, D. N., & Schkade, D. A. (1993). Information displays and decision processes.
Psychological Science, 4(4), 221–227.
Kotovsky, K., Hayes, J. R., & Simon, H. A. (1985). Why are some problems hard? Evidence
from Tower of Hanoi. Cognitive Psychology, 17(2), 248–294.
Legrenzi, P., Girotto, V., & Johnson-Laird, P. N. (1993). Focussing in reasoning and decision
making. Cognition, 49(1–2), 37–66.
Mayer, R. E. (1995). The search for insight: Grappling with Gestalt psychology’s unanswered
questions. In R. E. Sternberg & J. E. Davidson (Eds.), The Nature of Insight (pp. 3–32).
Cambridge: MIT Press.
Omodei, M. M., & Wearing, A. J. (1995). The fire chief microworld generating program: An
illustration of computer-simulated microworlds as an experimental paradigm for studying
complex decision-making behavior. Behavior Research Methods, Instruments, and
Computers, 27, 303–316.
Paich, M., & Sterman, J. D. (1993). Boom, bust, and failures to learn in experimental markets.
Management Science, 39(12), 1439–1458.

UNDERSTANDING ACCUMULATION 38
Paulos, J. A. (1988). Innumeracy: Mathematical illiteracy and its consequences. New York: Hill
and Wang.
Petty, R. E., & Caccioppo, J. T. (1986). The elaboration likelihood model of persuasion. In
Advances in Experimental Social Psychology (Vol. 19, pp. 123–205). New York: Academic
Press.
Petty, R. E., & Wegener, D. T. (1998). Attitude change: multiple roles for persuasion variables.
In D. T. Gilbert, S. T. Fiske, & G. Lindzey (Eds.), The handbook of social psychology (4th
ed., pp. 323–390). Boston: McGraw-Hill.
Reber, A. S. (1976). Implicit learning of synthetic languages: The role of instructional set.
Journal of Experimental Psychology: Human Learning and Memory, 2(1), 88–94.
Reber, A. S. (1989). Implicit learning and tacit knowledge. Journal of Experimental Psychology:
General, 118(3), 219–235.
Rettinger, D. A., & Hastie, R. (2001). Content effects on decision making. Organizational
Behavior and Human Decision Processes, 85(2), 336–359.
Ross, W. T., & Creyer, E. H. (1992). Making inferences about missing information: The effects
of existing information. Journal of Consumer Research, 19(1), 14–25.
Simon, H. A. (1979). Models of thought. New Haven, CT: Yale University Press.
Simon, H. A. (1991). Bounded rationality and organizational learning. Organization Science,
2(1), 125–134.
Sterman, J. D. (1989a). Misperceptions of feedback in dynamic decision making. Organizational
Behavior and Human Decision Processes, 43(3), 301–335.
Sterman, J. D. (1989b). Modeling managerial behavior: Misperceptions of feedback in a dynamic
decision making experiment. Management Science, 35(3), 321–339.

UNDERSTANDING ACCUMULATION 39
Sterman, J. D. (2002). All models are wrong: Reflections on becoming a systems scientist.
System Dynamics Review, 18(4), 501–531.
Sterman, J. D., & Booth Sweeney, L. (2002). Cloudy skies: Assessing public understanding of
global warning. System Dynamics Review, 18(2), 207–240.
Sterman, J. D. & Booth Sweeney, L. (2006). Understanding Public Complacency About Climate
Change: Adults’ mental models of climate change violate conservation of matter.
forthcoming, Climatic Change. Available at
web.mit.edu/jsterman/www/Understanding_public.html.
Tversky, A., & Kahneman, D. (1986). Rational choice and the framing of decisions. Journal of
Business, 59(4), S251–S278.

UNDERSTANDING ACCUMULATION 40
Table 1. Results of the Baseline Department Store Task
Rows show number N (top panel) and percent (bottom panel) answering each question in Figure
1 with the time specified in the first column (±1 minute to account for possible participant error
in reading time-axis values). For example, 166 selected t = 3, 4, or 5 minutes to answer “During
which minute did the most people enter the store?” (the correct answer is 4). Probabilities report
the Fisher exact test of the null hypothesis that the proportions answering correctly are equal for
the two question order treatments O1 and O2 (see text). Bold entries highlight correct responses.
Italics show those incorrectly specifying the maximum net inflow/net outflow instead of
maximum/minimum in the store.
O1 O2 Sum O1 O2 Sum O1 O2 Sum O1 O2 Sum
Max Entering t= 4 82 84 166 0 0 0 2 4 6 1 0 1
Max Leaving t=21 1 1 2 82 82 164 0 1 1 1 2 3
Max in Store t=13 0 0 0 0 0 0 37 39 76 1 3 4
Fewest in Store t=30 0 0 0 0 0 0 0 1 1 26 28 54
Max Net Inflow t= 8 0 4 4 0 0 0 26 24 50 0 0 0
Max Net Outflow t=17 0 0 0 0 6 6 5 1 6 29 22 51
Initial in Store t= 1 0 0 0 0 0 0 0 0 0 5 7 12
0 0 0 0 0 0 12 17 29 18 25 43
Other 1 0 1 1 1 2 0 2 2 0 2 2
No Answer 0 0 0 1 0 1 2 0 2 3 0 3
Total 84 89 173 84 89 173 84 89 173 84 89 173
O1 O2 Sum O1 O2 Sum O1 O2 Sum O1 O2 Sum
Max Entering t= 4 97.6 94.4 96.0 0.0 0.0 0.0 2.4 4.5 3.5 1.2 0.0 0.6
Max Leaving t=21 1.2 1.1 1.2 97.6 92.1 94.8 0.0 1.1 0.6 1.2 2.2 1.7
Max in Store t=13 0.0 0.0 0.0 0.0 0.0 0.0 44.0 43.8 43.9 1.2 3.4 2.3
Fewest in Store t=30 0.0 0.0 0.0 0.0 0.0 0.0 0.0 1.1 0.6 31.0 31.5 31.2
Max Net Inflow t= 8 0.0 4.5 2.3 0.0 0.0 0.0 31.0 27.0 28.9 0.0 0.0 0.0
Max Net Outflow t=17 0.0 0.0 0.0 0.0 6.7 3.5 6.0 1.1 3.5 34.5 24.7 29.5
Initial in Store t= 1 0.0 0.0 0.0 0.0 0.0 0.0 0.0 0.0 0.0 6.0 7.9 6.9
0.0 0.0 0.0 0.0 0.0 0.0 14.3 19.1 16.8 21.4 28.1 24.9
Other 1.2 0.0 0.6 1.2 1.1 1.2 0.0 2.2 1.2 0.0 2.2 1.2
No Answer 0.0 0.0 0.0 1.2 0.0 0.6 2.4 0.0 1.2 3.6 0.0 1.7
N
Most Leaving? Most in Store?
Can't be Determined
Can't be Determined
H0: Correct(Order 1) =
Correct(Order 2)? (Fisher
Exact Test)
%
Most Entering? Most Leaving? Most in Store?
Fewest in
Store?
Fewest in
Store?Most Entering?
p = 1.0p = 0.44 p = 0.17 p = 1.0
UNDERSTANDING ACCUMULATION 41
Table 2. Experiment 1: Success Rates Between Visual Isomorphs
Question 1:
Most Entering?
Question 2: Most
Leaving? Question 3:
Most in store? Question 4:
Fewest in Store? Overall Success Rate (N
= 264) 89% 83% 56% 46% A Graph (both line and bar,
N = 127) 94% 91% 61% 48% No graph (both text and
table, N = 137) 85% 76% 51% 44% Exact test p = 0.015 0.001 0.137 0.537
B Line graph (N = 63) 94% 87% 52% 41% Bar graph (N = 64) 95% 95% 69% 55% Exact test p = 0.718 0.127 0.071 0.157
C Text (N = 59) 86% 75% 47% 42% Table (N = 78) 83% 77% 54% 45% Exact test p = 0.811 0.841 0.493 0.862
D Baseline (N = 173) 96% 95% 44% 31% Line graph (N = 63) 94% 87% 52% 41% Exact test p = 0.490 0.083 0.302 0.166

UNDERSTANDING ACCUMULATION 42
Table 3. Experiment 2: Success Rates Across Cover Stories
Question 1: Most
Entering? Question 2:
Most Leaving? Question 3:
Most in Store?
Question 4: Fewest in
Store? Overall success rates (N
= 47) 96% 94% 28% 26% A Store (N = 18) 100% 100% 22% 17%
Cars (N = 16) 100% 100% 38% 31% Exact test p = 1.000 1.000 .457 .429
B Store (N = 18) 100% 100% 22% 17% Tub (N = 13) 85% 77% 23% 31% Exact test p = .168 .064 1.000 .413
C Tub + cars (N = 29) 93% 90% 31% 31% Store (N = 18) 100% 100% 22% 17% Exact test p = .517 .276 .739 .324
D Tub (N = 13) 85% 77% 23% 31% Cars (N = 16) 100% 100% 38% 31% Exact test p = .192 .078 .454 1.000

UNDERSTANDING ACCUMULATION 43
Table 4A. Experiment 3: Effect of Motivation and Feedback on Success Rates for Task 1
Question 1: Most
Entering?
Question 2: Most
Leaving? Question 3:
Most in store?
Question 4: Fewest in
Store? No motivation/no feedback condition (n = 37) 100% 86.5% 18.9% 21.6%
Motivation/feedback condition (n = 32) Task 1 (Figure 4A): Attempt 1 93.8% 96.9% 15.6% 12.5% Exact test, p = .211 .205 .761 .359
Attempt 2 100% 100% 28.1% 25.0% Attempt 3 56.3% 50.0% Attempt 4 65.6% 62.5% Attempt 5 68.8% 71.9% Attempt 6 71.9% 81.3% Attempt 7 81.3% 84.4% Attempt 8 81.3% 84.4% Attempt 9 81.3% 84.4%

UNDERSTANDING ACCUMULATION 44
Table 4B. Experiment 3: Effect of Feedback on Problem Success in the High-Motivation
Condition
Question 3: Most
in Store? Question 4: Fewest
in Store? Correct on first try 5 of 32 (15.6%) 4 of 32 (12.5%)
Correct on second try 4 of 27 (14.8%) 4 of 28 (14.3%) Exact test p = 1.00 1.00

UNDERSTANDING ACCUMULATION 45
Table 4C. Experiment 3: Effect of Manual Calculation on Success, Task 1 (Figure 4)
Question 3: Most in Store?
(First Try)
Question 4: Fewest in Store?
(First Try) Did Not Finish Manual calculation (N = 22) 14% 9% 23%
No written calculation (N = 10) 20% 10% 40% Exact test p = .637 1.00 .407

UNDERSTANDING ACCUMULATION 46
Table 5. Experiment 4: Comparison of Success Rates with Missing Flows
N = 30 Question 1: Most Entering?
Question 2: Most Leaving?
Question 3: Most in Store?
Question 4: Fewest in
Store? Missing stock 90% 79% 3% 10% Missing outflow 90% 10% 75% 79% Missing inflow 7% 76% 79% 66%

UNDERSTANDING ACCUMULATION 47
Table 6. Experiment 5: Influence of Priming on Success
Question 1: Most
Entering?
Question 2: Most
Leaving?
Question 3: Most in Store?
Question 4: Fewest in
Store? Baseline (N = 37) 95% 92% 8% 16%
Priming condition (N = 37) 86% 89% 27% 38% Exact test p = .430 .999 .063 .065
Prime correct (N = 19) 95% 95% 53% 68% Prime incorrect (N = 18) 78% 83% 0% 6%
Exact test p = .180 .340 .0004 .0001

UNDERSTANDING ACCUMULATION 48
Figure 1. Department Store Task
The graph below shows the number of people entering and leaving a department store over a 30-
minute period.
0
5
10
15
20
25
30
35
40
0 2 4 6 8 10 12 14 16 18 20 22 24 26 28 30
People/Minute
Minute
Entering Leaving
Please answer the following questions.
Check the box if the answer cannot be determined from the information provided.
1. During which minute did the most people enter the store?
Minute ________ Can’t be determined
2. During which minute did the most people leave the store?
Minute ________ Can’t be determined
3. During which minute were the most people in the store?
Minute ________ Can’t be determined
4. During which minute were the fewest people in the store?
Minute ________ Can’t be determined
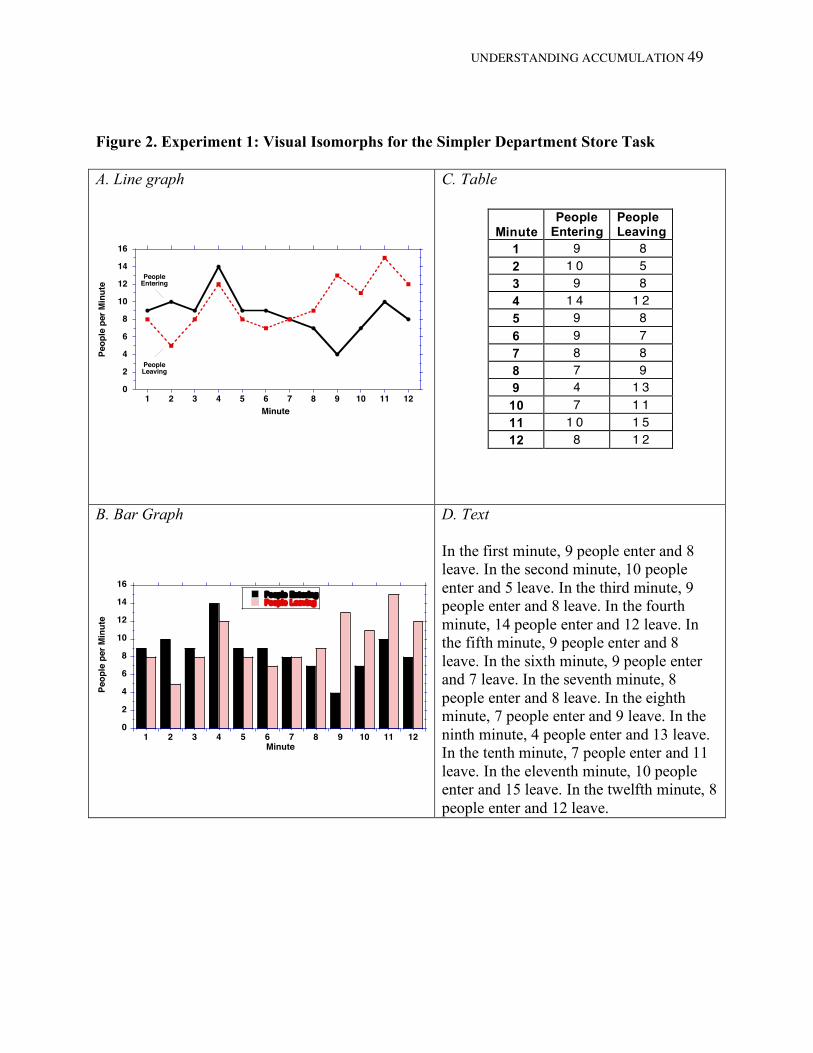
UNDERSTANDING ACCUMULATION 49
Figure 2. Experiment 1: Visual Isomorphs for the Simpler Department Store Task
A. Line graph
0
2
4
6
8
10
12
14
16
1 2 3 4 5 6 7 8 9 10 11 12
Pe
op
le p
er
Min
ute
Minute
PeopleEntering
PeopleLeaving
C. Table
Minute
People Entering
People Leaving
1 9 8
2 1 0 5
3 9 8
4 1 4 1 2
5 9 8
6 9 7
7 8 8
8 7 9
9 4 1 3
10 7 1 1
11 1 0 1 5
12 8 1 2
B. Bar Graph
0
2
4
6
8
10
12
14
16
1 2 3 4 5 6 7 8 9 10 11 12
People EnteringPeople Leaving
Peo
ple
per
Min
ute
Minute
D. Text
In the first minute, 9 people enter and 8 leave. In the second minute, 10 people enter and 5 leave. In the third minute, 9 people enter and 8 leave. In the fourth minute, 14 people enter and 12 leave. In the fifth minute, 9 people enter and 8 leave. In the sixth minute, 9 people enter and 7 leave. In the seventh minute, 8 people enter and 8 leave. In the eighth minute, 7 people enter and 9 leave. In the ninth minute, 4 people enter and 13 leave. In the tenth minute, 7 people enter and 11 leave. In the eleventh minute, 10 people enter and 15 leave. In the twelfth minute, 8 people enter and 12 leave.

UNDERSTANDING ACCUMULATION 50
Figure 3. Simple Graph Used in Cronin and Gonzalez (in press)
0
5
10
15
20
25
1 2 3 4 5
Minute
People Entering
Leaving

UNDERSTANDING ACCUMULATION 51
Figure 4. Experiment 2: Graph Used in Motivation Experiments A
0
2
4
6
8
10
12
14
16
18
20
1 2 3 4 5 6 7 8 9 10 11 12 13 14 15 16 17 18 19 20 21 22 23 24 25 26 27 28 29 30
Minutes
Pe
op
le p
er
min
ute
People Entering
People Leaving
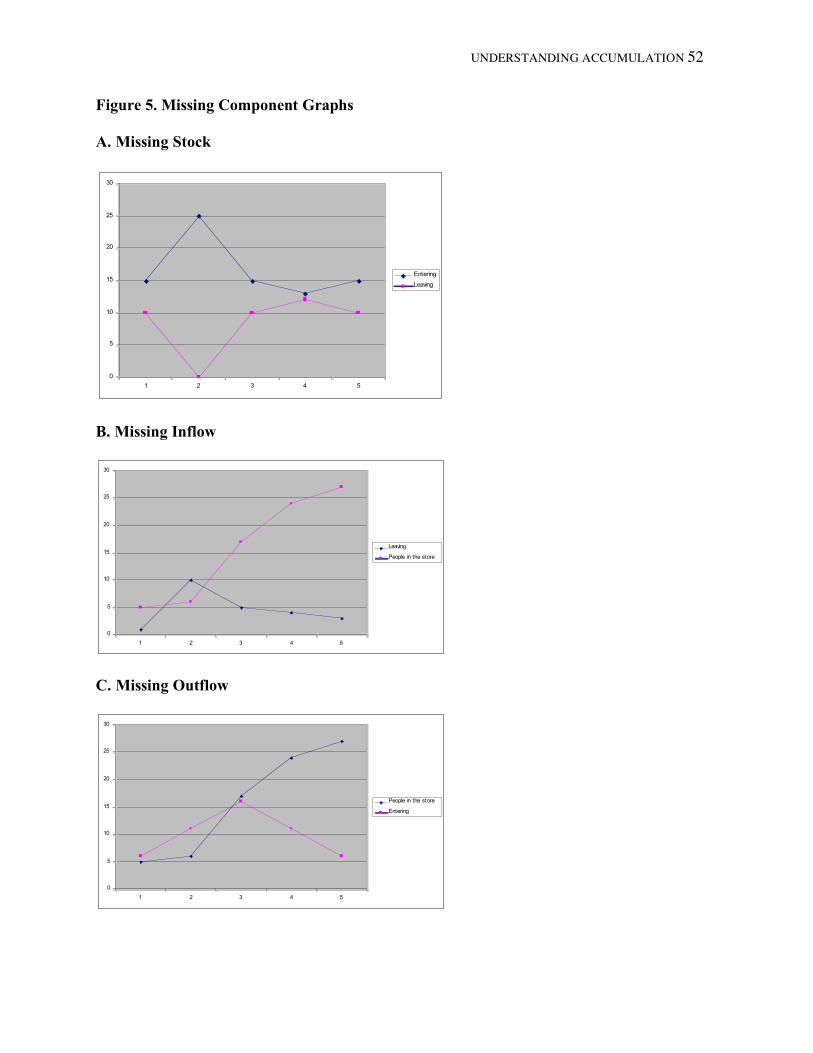
UNDERSTANDING ACCUMULATION 52
Figure 5. Missing Component Graphs
A. Missing Stock
0
5
10
15
20
25
30
1 2 3 4 5
Entering
Leaving
B. Missing Inflow
0
5
10
15
20
25
30
1 2 3 4 5
Leaving
People in the store
C. Missing Outflow
0
5
10
15
20
25
30
1 2 3 4 5
People in the store
Entering

UNDERSTANDING ACCUMULATION 53
Figure 6. Experiment 5
A. Priming Task
0
2
4
6
8
10
12
1 2 3 4 5
Minute
People Entering
Leaving
Write down how many people are in the store each minute:
Minute 1: Minute 2: Minute 3: Minute 4: Minute 5:
B. Simple SF Task (Participants Were Asked the Same Four Questions Shown in Figure 1)
0
5
10
15
20
25
30
35
1 2 3 4 5
Minute
People Entering
Leaving