why guarantee employment? evidence from a large indian ... · ry theo besley and coate 1992, basu...
TRANSCRIPT

Introdu tion Ba kground Theoreti al Model Identi� ation Strategy Empiri al Results Con lusion Appendix
Why Guarantee Employment? Eviden e from a
Large Indian Publi -Works Program
Laura Zimmermann
University of Georgia
lvzimmer�uga.edu
De ember 5, 2014
Laura Zimmermann (UGA) Indian Employment Guarantee De ember 5, 2014 1

Introdu tion Ba kground Theoreti al Model Identi� ation Strategy Empiri al Results Con lusion Appendix
Introdu tion
What are the labor-market impa ts of India's Mahatma Gandhi
National Rural Employment Guarantee S heme (MGNREGS)?
Unemployment and underemployment widespread problems in
developing ountries
aggregate sho ks
seasonality
in omplete insuran e markets
Laura Zimmermann (UGA) Indian Employment Guarantee De ember 5, 2014 2

Introdu tion Ba kground Theoreti al Model Identi� ation Strategy Empiri al Results Con lusion Appendix
Introdu tion
What are the labor-market impa ts of India's Mahatma Gandhi
National Rural Employment Guarantee S heme (MGNREGS)?
Unemployment and underemployment widespread problems in
developing ountries
aggregate sho ks
seasonality
in omplete insuran e markets
Publi -works programs popular government tools
Resurgen e of interest: long-run so ial prote tion
World Bank funded programs in 24 ountries (2007-2009)
safety net
in ome transfer to poor
asset reation
legal guarantee and broad overage make NREGS largest and
most ambitious program
Laura Zimmermann (UGA) Indian Employment Guarantee De ember 5, 2014 2

Introdu tion Ba kground Theoreti al Model Identi� ation Strategy Empiri al Results Con lusion Appendix
Related Literature
Publi -works programs in developing ountries
Empiri s
Subbarao 1997, Subbarao et al. 2013, Datt and Ravallion
1994, Berhane et al. 2011, Gilligan et al. 2009
Theory
Besley and Coate 1992, Basu 2002, Basu forth oming
Con lusions
Propensity s ore mat hing and DID strategies, large fo us on
targeting and take-up, some eviden e on time allo ation
NREGS
Labor market impa ts
Azam 2012, Berg et al. 2012, Imbert and Papp 2013, Johnson
2009
Other out omes
Deininger and Liu 2013, Klonner and Oldiges 2012
Con lusions
DID strategies, substantial onsumption and poverty impa ts,
heterogeneous treatment e�e ts in labor market out omes
Laura Zimmermann (UGA) Indian Employment Guarantee De ember 5, 2014 3

Introdu tion Ba kground Theoreti al Model Identi� ation Strategy Empiri al Results Con lusion Appendix
National Rural Employment Guarantee S heme (NREGS)
Based on National Rural Employment Guarantee A t (NREGA)
Up to 100 days of publi employment at minimum wage for
ea h rural household
Laura Zimmermann (UGA) Indian Employment Guarantee De ember 5, 2014 4

Introdu tion Ba kground Theoreti al Model Identi� ation Strategy Empiri al Results Con lusion Appendix
National Rural Employment Guarantee S heme (NREGS)
Based on National Rural Employment Guarantee A t (NREGA)
Up to 100 days of publi employment at minimum wage for
ea h rural household
No other eligibility riteria
Households an apply for work at any time of the year
Men and women paid equally
NREGS proje ts supposed to advan e lo al development
no ontra tors or ma hines
number of permissible ategories
Categories
in pra ti e, most proje ts fo us on drought-proo�ng, land
development
Proje ts
Laura Zimmermann (UGA) Indian Employment Guarantee De ember 5, 2014 4
Introdu tion Ba kground Theoreti al Model Identi� ation Strategy Empiri al Results Con lusion Appendix
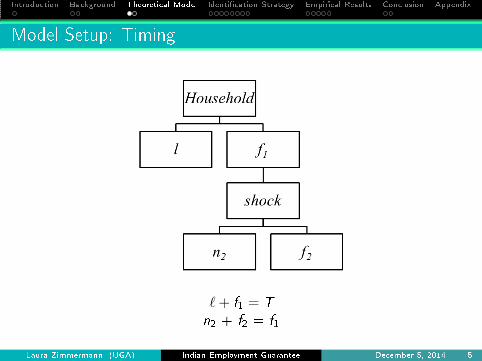
Model Setup: Timing
ℓ+ f
1
= T
n
2
+ f
2
= f
1
Laura Zimmermann (UGA) Indian Employment Guarantee De ember 5, 2014 5

Introdu tion Ba kground Theoreti al Model Identi� ation Strategy Empiri al Results Con lusion Appendix
Empiri al Predi tions
If employment guarantee fun tions as a safety net
1
Ex post e�e t
NREGS employment higher after bad e onomi sho k
2
Ex ante e�e t
NREGS employment is low
Private employment falls
Family employment rises
Extensions Assumptions Wage Impa ts
Laura Zimmermann (UGA) Indian Employment Guarantee De ember 5, 2014 6

Introdu tion Ba kground Theoreti al Model Identi� ation Strategy Empiri al Results Con lusion Appendix
Program Rollout
National Rural Employment Guarantee A t (NREGA) passed
in the Indian Parliament in August 2005
Came into for e in February 2006 in India's 200 `least
developed' distri ts (Phase 1)
Extended to 130 distri ts in April 2007 (Phase 2)
Extended to the rest of the ountry in April 2008 (Phase 3)
Sin e 2008, the s heme operates in 99 per ent of Indian
distri ts
Laura Zimmermann (UGA) Indian Employment Guarantee De ember 5, 2014 7
Introdu tion Ba kground Theoreti al Model Identi� ation Strategy Empiri al Results Con lusion Appendix
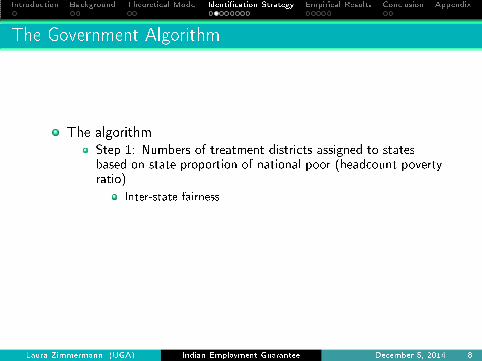
The Government Algorithm
The algorithm
Step 1: Numbers of treatment distri ts assigned to states
based on state proportion of national poor (head ount poverty
ratio)
Inter-state fairness
Laura Zimmermann (UGA) Indian Employment Guarantee De ember 5, 2014 8

Introdu tion Ba kground Theoreti al Model Identi� ation Strategy Empiri al Results Con lusion Appendix
The Government Algorithm
The algorithm
Step 1: Numbers of treatment distri ts assigned to states
based on state proportion of national poor (head ount poverty
ratio)
Inter-state fairness
Step 2: Within-state treatment assignment based on their rank
a ording to a reated poverty index
Intra-state fairness
Laura Zimmermann (UGA) Indian Employment Guarantee De ember 5, 2014 8

Introdu tion Ba kground Theoreti al Model Identi� ation Strategy Empiri al Results Con lusion Appendix
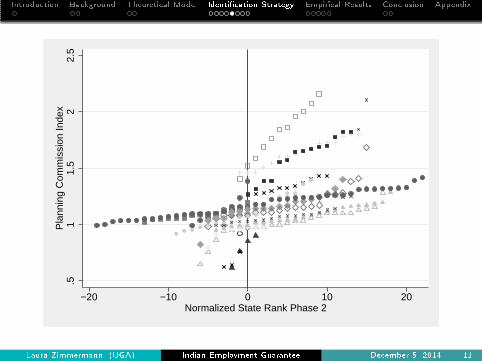
The Government Algorithm
Re onstru t the algorithm values
Head ount poverty ratio (Planning Commission 2009)
Distri t poverty index variable and rank (Planning Commission
2003)
Algorithm generates state-spe i� uto�s
Fo us on Phase 2 uto�
Re-normalize the rank variable so that all uto�s at 0
All-India predi tion su ess rate
Phase 1: 0.84
Phase 2: 0.82
Observations State Su ess
Laura Zimmermann (UGA) Indian Employment Guarantee De ember 5, 2014 9
Introdu tion Ba kground Theoreti al Model Identi� ation Strategy Empiri al Results Con lusion Appendix
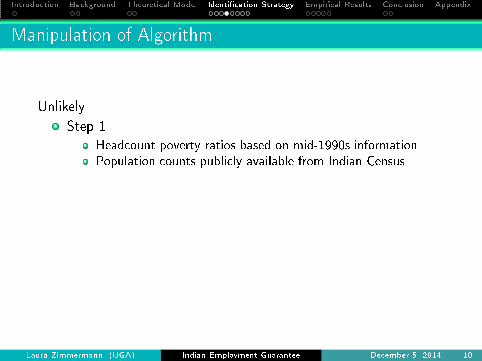
Manipulation of Algorithm
Unlikely
Step 1
Head ount poverty ratios based on mid-1990s information
Population ounts publi ly available from Indian Census
Laura Zimmermann (UGA) Indian Employment Guarantee De ember 5, 2014 10
Introdu tion Ba kground Theoreti al Model Identi� ation Strategy Empiri al Results Con lusion Appendix
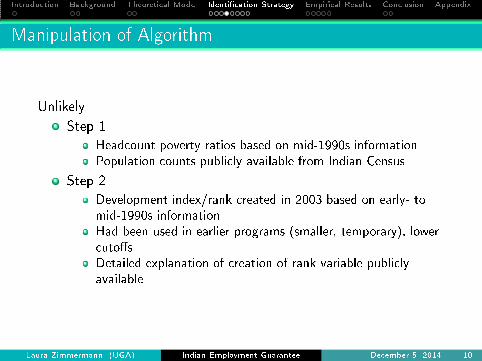
Manipulation of Algorithm
Unlikely
Step 1
Head ount poverty ratios based on mid-1990s information
Population ounts publi ly available from Indian Census
Step 2
Development index/rank reated in 2003 based on early- to
mid-1990s information
Had been used in earlier programs (smaller, temporary), lower
uto�s
Detailed explanation of reation of rank variable publi ly
available
Laura Zimmermann (UGA) Indian Employment Guarantee De ember 5, 2014 10
Introdu tion Ba kground Theoreti al Model Identi� ation Strategy Empiri al Results Con lusion Appendix
.51
1.5
22.
5P
lann
ing
Com
mis
sion
Inde
x
−20 −10 0 10 20Normalized State Rank Phase 2
Laura Zimmermann (UGA) Indian Employment Guarantee De ember 5, 2014 11
Introdu tion Ba kground Theoreti al Model Identi� ation Strategy Empiri al Results Con lusion Appendix
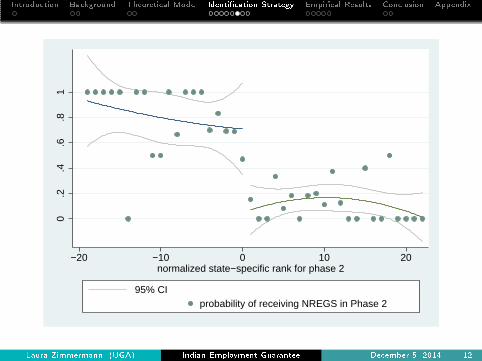
0.2
.4.6
.81
−20 −10 0 10 20normalized state−specific rank for phase 2
95% CIprobability of receiving NREGS in Phase 2
Laura Zimmermann (UGA) Indian Employment Guarantee De ember 5, 2014 12

Introdu tion Ba kground Theoreti al Model Identi� ation Strategy Empiri al Results Con lusion Appendix
Data and Sample
Representative National Sample Survey (NSS) data on Indian
households (2007/08)
Sample restri tions
Drop Phase 1 distri ts
Only keep rural areas
18-60 year olds with at most se ondary edu ation
Collapse to distri t-season level
Constru t extensive-margin employment out omes (publi ,
private, family), daily private-se tor wage
Use baseline information from 2004/05
Baseline Test
Summary Statisti s
Laura Zimmermann (UGA) Indian Employment Guarantee De ember 5, 2014 13
Introdu tion Ba kground Theoreti al Model Identi� ation Strategy Empiri al Results Con lusion Appendix
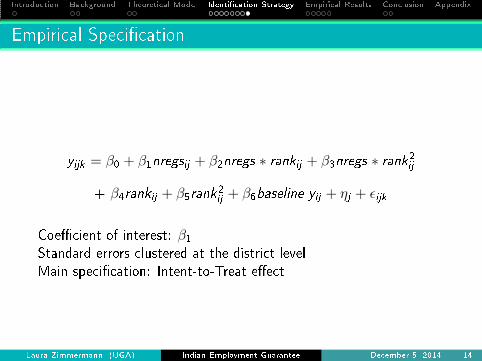
Empiri al Spe i� ation
y
ijk
= β0
+ β1
nregs
ij
+ β2
nregs ∗ rank
ij
+ β3
nregs ∗ rank
2
ij
+ β4
rank
ij
+ β5
rank
2
ij
+ β6
baseline y
ij
+ ηj
+ ǫijk
Coe� ient of interest: β1
Standard errors lustered at the distri t level
Main spe i� ation: Intent-to-Treat e�e t
Laura Zimmermann (UGA) Indian Employment Guarantee De ember 5, 2014 14
Introdu tion Ba kground Theoreti al Model Identi� ation Strategy Empiri al Results Con lusion Appendix
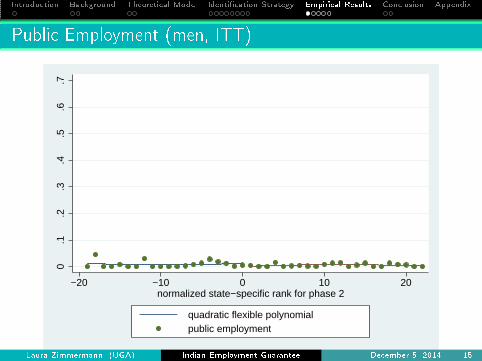
Publi Employment (men, ITT)
0.1
.2.3
.4.5
.6.7
−20 −10 0 10 20normalized state−specific rank for phase 2
quadratic flexible polynomialpublic employment
Laura Zimmermann (UGA) Indian Employment Guarantee De ember 5, 2014 15
Introdu tion Ba kground Theoreti al Model Identi� ation Strategy Empiri al Results Con lusion Appendix
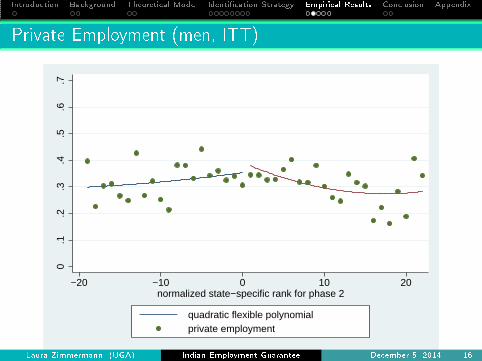
Private Employment (men, ITT)
0.1
.2.3
.4.5
.6.7
−20 −10 0 10 20normalized state−specific rank for phase 2
quadratic flexible polynomialprivate employment
Laura Zimmermann (UGA) Indian Employment Guarantee De ember 5, 2014 16
Introdu tion Ba kground Theoreti al Model Identi� ation Strategy Empiri al Results Con lusion Appendix
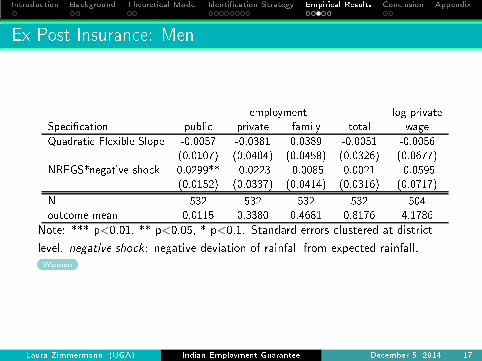
Ex Post Insuran e: Men
employment log private
Spe i� ation publi private family total wage
Quadrati Flexible Slope -0.0057 -0.0381 0.0389 -0.0051 -0.0056
(0.0107) (0.0404) (0.0458) (0.0326) (0.0677)
NREGS*negative sho k 0.0299** -0.0223 -0.0085 0.0021 -0.0595
(0.0152) (0.0337) (0.0414) (0.0316) (0.0717)
N 532 532 532 532 504
out ome mean 0.0115 0.3380 0.4681 0.8176 4.1786
Note: *** p<0.01, ** p<0.05, * p<0.1. Standard errors lustered at distri t
level. negative sho k: negative deviation of rainfall from expe ted rainfall.
Women
Laura Zimmermann (UGA) Indian Employment Guarantee De ember 5, 2014 17
Introdu tion Ba kground Theoreti al Model Identi� ation Strategy Empiri al Results Con lusion Appendix
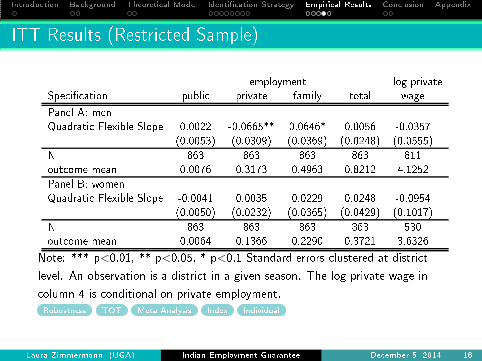
ITT Results (Restri ted Sample)
employment log private
Spe i� ation publi private family total wage
Panel A: men
Quadrati Flexible Slope 0.0022 -0.0665** 0.0646* 0.0056 -0.0357
(0.0053) (0.0309) (0.0369) (0.0248) (0.0555)
N 863 863 863 863 811
out ome mean 0.0076 0.3173 0.4963 0.8212 4.1252
Panel B: women
Quadrati Flexible Slope -0.0041 0.0035 0.0229 0.0248 -0.0954
(0.0050) (0.0232) (0.0365) (0.0429) (0.1017)
N 863 863 863 863 530
out ome mean 0.0064 0.1366 0.2290 0.3721 3.6326
Note: *** p<0.01, ** p<0.05, * p<0.1 Standard errors lustered at distri t
level. An observation is a distri t in a given season. The log private wage in
olumn 4 is onditional on private employment.
Robustness TOT Meta Analysis Index Individual
Laura Zimmermann (UGA) Indian Employment Guarantee De ember 5, 2014 18
Introdu tion Ba kground Theoreti al Model Identi� ation Strategy Empiri al Results Con lusion Appendix
Robustness Che ks
Estimates robust to other spe i� ations
Ex lusion of baseline ontrols
In lusion of additional ontrols
Other parametri spe i� ations
Di�erent bandwidth hoi es
Use of population weights
Donut-hole approa h
Meta analysis
Change of running variable
Individual level
Laura Zimmermann (UGA) Indian Employment Guarantee De ember 5, 2014 19
Introdu tion Ba kground Theoreti al Model Identi� ation Strategy Empiri al Results Con lusion Appendix
Robustness Che ks
Estimates robust to other spe i� ations
Ex lusion of baseline ontrols
In lusion of additional ontrols
Other parametri spe i� ations
Di�erent bandwidth hoi es
Use of population weights
Donut-hole approa h
Meta analysis
Change of running variable
Individual level
E�e t size onsistent with administrative data
Administrative
DID (men) DID (women) Explanation
Laura Zimmermann (UGA) Indian Employment Guarantee De ember 5, 2014 19

Introdu tion Ba kground Theoreti al Model Identi� ation Strategy Empiri al Results Con lusion Appendix
Con lusion
RD analysis of impa t of NREGS on labor-market out omes
NREGS fun tions as a safety net
Ex post e�e t
Higher take-up after negative rainfall sho k
Ex ante e�e t
Low NREGS take-up
Move from private to family employment
If at all, wage impa ts usually negative
Laura Zimmermann (UGA) Indian Employment Guarantee De ember 5, 2014 20

Introdu tion Ba kground Theoreti al Model Identi� ation Strategy Empiri al Results Con lusion Appendix
Con lusion
Impli ations: NREGS
No in rease in lo al labor-market ompetitiveness
No better enfor ement of minimum-wage laws
In entivizes self-employment
Laura Zimmermann (UGA) Indian Employment Guarantee De ember 5, 2014 21

Introdu tion Ba kground Theoreti al Model Identi� ation Strategy Empiri al Results Con lusion Appendix
Con lusion
Impli ations: NREGS
No in rease in lo al labor-market ompetitiveness
No better enfor ement of minimum-wage laws
In entivizes self-employment
But are welfare bene�ts big enough to justify high annual
expenditures?
No large e�e t on household expenditures
Need information on household produ tion
Short-run e�e ts
Thank you!
Laura Zimmermann (UGA) Indian Employment Guarantee De ember 5, 2014 21

Introdu tion Ba kground Theoreti al Model Identi� ation Strategy Empiri al Results Con lusion Appendix
Permissible NREGS Proje t Categories
1
Water onservation and water harvesting
2
Drought proo�ng, in luding a�orestation and tree plantation
3
Irrigation anals, in luding mi ro and minor irrigation works
4
Provision of irrigation fa ility to land owned by poor/low- aste
households
5
Renovation of traditional water bodies
6
Land development
7
Flood ontrol and prote tion works
8
Rural onne tivity to provide all-weather a ess
9
Any work that may be noti�ed by the Central Government in
onsultation with the State Government
Maximum emphasis is supposed to be on water onservation
(Government of India 2010).
Ba k
Laura Zimmermann (UGA) Indian Employment Guarantee De ember 5, 2014 22

Introdu tion Ba kground Theoreti al Model Identi� ation Strategy Empiri al Results Con lusion Appendix
Proje t-Category Breakdown in 2007/2008
46% Water onservation
20% Provision of irrigation fa ility to low- aste households
18% Land development
15% Rural onne tivity
1% Any other a tivity
Ba k
Laura Zimmermann (UGA) Indian Employment Guarantee De ember 5, 2014 23

Introdu tion Ba kground Theoreti al Model Identi� ation Strategy Empiri al Results Con lusion Appendix
Assumption 1
Private employment ℓ is less �exible than NREGS employment
Labor ontra ts
Seasonality of private-se tor jobs
If ℓ an also be taken up after sho k has been realized
NREGS less attra tive as ex post insuran e
More dire t substitution between ℓ and NREGS work
Ba k
Laura Zimmermann (UGA) Indian Employment Guarantee De ember 5, 2014 24

Introdu tion Ba kground Theoreti al Model Identi� ation Strategy Empiri al Results Con lusion Appendix
Assumption 2
Private employment ℓ is less risky than family employment
Labor ontra ts
Spot market as long as work is usually available
Private-se tor wage is onstant for usual rainfall sho ks (below
5 standard deviations)
Wage rigidity in the private se tor (Kaur 2012)
If ℓ is as a�e ted/more a�e ted by sho k as family employment
Lower in entive to work in private se tor given the expe ted
wage
Ba k
Laura Zimmermann (UGA) Indian Employment Guarantee De ember 5, 2014 25

Introdu tion Ba kground Theoreti al Model Identi� ation Strategy Empiri al Results Con lusion Appendix
Assumption 3
Household derives utility from from self-employment and total
in ome earned
Ane dotal eviden e (avoid exploitation, hoose how to spend
time)
Self-employment is seen as preferable to private-se tor work
(Bandiera et al. 2013, Banerjee et al. 2011)
Ensures interior solution
Ba k
Laura Zimmermann (UGA) Indian Employment Guarantee De ember 5, 2014 26
Introdu tion Ba kground Theoreti al Model Identi� ation Strategy Empiri al Results Con lusion Appendix
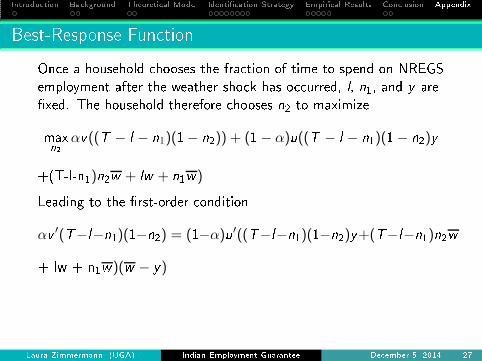
Best-Response Fun tion
On e a household hooses the fra tion of time to spend on NREGS
employment after the weather sho k has o urred, l, n
1
, and y are
�xed. The household therefore hooses n
2
to maximize
max
n
2
αv((T − l − n
1
)(1− n
2
)) + (1− α)u((T − l − n
1
)(1− n
2
)y
+(T-l-n
1
)n2
w + lw + n
1
w)
Leading to the �rst-order ondition
αv ′(T−l−n
1
)(1−n
2
) = (1−α)u′((T−l−n
1
)(1−n
2
)y+(T−l−n
1
)n2
w
+ lw + n
1
w)(w − y)
Laura Zimmermann (UGA) Indian Employment Guarantee De ember 5, 2014 27
Introdu tion Ba kground Theoreti al Model Identi� ation Strategy Empiri al Results Con lusion Appendix
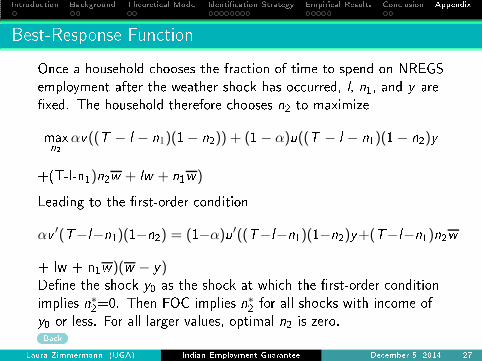
Best-Response Fun tion
On e a household hooses the fra tion of time to spend on NREGS
employment after the weather sho k has o urred, l, n
1
, and y are
�xed. The household therefore hooses n
2
to maximize
max
n
2
αv((T − l − n
1
)(1− n
2
)) + (1− α)u((T − l − n
1
)(1− n
2
)y
+(T-l-n
1
)n2
w + lw + n
1
w)
Leading to the �rst-order ondition
αv ′(T−l−n
1
)(1−n
2
) = (1−α)u′((T−l−n
1
)(1−n
2
)y+(T−l−n
1
)n2
w
+ lw + n
1
w)(w − y)De�ne the sho k y
0
as the sho k at whi h the �rst-order ondition
implies n
∗
2
=0. Then FOC implies n
∗
2
for all sho ks with in ome of
y
0
or less. For all larger values, optimal n
2
is zero.
Ba k
Laura Zimmermann (UGA) Indian Employment Guarantee De ember 5, 2014 27
Introdu tion Ba kground Theoreti al Model Identi� ation Strategy Empiri al Results Con lusion Appendix
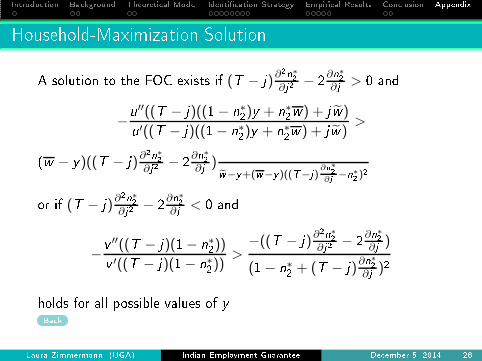
Household-Maximization Solution
A solution to the FOC exists if (T − j)∂2n∗
2
∂j2− 2
∂n∗2
∂j> 0 and
−
u
′′((T − j)((1− n
∗
2
)y + n
∗
2
w) + j w̃)
u
′((T − j)((1− n
∗
2
)y + n
∗
2
w ) + j w̃)>
(w − y)((T − j)∂2n∗
2
∂j2− 2
∂n∗2
∂j)w̃−y+(w−y)((T−j)
∂n
∗
2
∂j
−n
∗
2
)2
or if (T − j)∂2n∗
2
∂j2− 2
∂n∗2
∂j< 0 and
−
v
′′((T − j)(1− n
∗
2
))
v
′((T − j)(1− n
∗
2
))>
−((T − j)∂2n∗
2
∂j2− 2
∂n∗2
∂j)
(1− n
∗
2
+ (T − j)∂n∗
2
∂j)2
holds for all possible values of y
Ba k
Laura Zimmermann (UGA) Indian Employment Guarantee De ember 5, 2014 28

Introdu tion Ba kground Theoreti al Model Identi� ation Strategy Empiri al Results Con lusion Appendix
Model Extensions
NREGS 100-day ap
de reases attra tiveness ex post risk- oping tool
attenuates labor-market impa ts
Implementation problems
rationing works like ap
orruption works like lower wage
attenuates labor-market impa ts
Private-se tor wage variability
the more variable the wage is to sho ks, the less it is a good
risk-mitigation tool
in reases private-se tor impa ts of NREGS
Ba k
Laura Zimmermann (UGA) Indian Employment Guarantee De ember 5, 2014 29
Introdu tion Ba kground Theoreti al Model Identi� ation Strategy Empiri al Results Con lusion Appendix
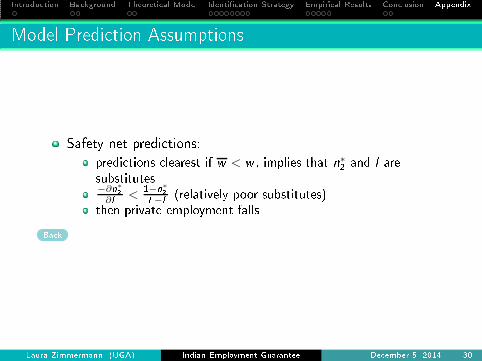
Model Predi tion Assumptions
Safety net predi tions:
predi tions learest if w < w , implies that n
∗
2
and l are
substitutes
−∂n∗
2
∂l<
1−n
∗
2
T−l
(relatively poor substitutes)
then private employment falls
Ba k
Laura Zimmermann (UGA) Indian Employment Guarantee De ember 5, 2014 30

Introdu tion Ba kground Theoreti al Model Identi� ation Strategy Empiri al Results Con lusion Appendix
Model assumes �xed private-se tor wage
Laura Zimmermann (UGA) Indian Employment Guarantee De ember 5, 2014 31

Introdu tion Ba kground Theoreti al Model Identi� ation Strategy Empiri al Results Con lusion Appendix
Model assumes �xed private-se tor wage
Little onsensus about model of Indian asual private se tor
e.g. Basu 2002, Basu and Felkey 2008, Basu forth oming,
Besley and Coate 1992, Kaur 2012
Under standard assumptions (perfe t ompetition, de reasing
marginal produ t)
Wage rises
Attenuates negative private employment e�e t
Wage also rises if NREGS enfor es minimum-wage laws
Wage ould also fall, e.g.
Wage equals marginal produ t, independent of number of
workers
Heterogeneity in worker produ tivity
Higher-produ tivity workers have higher α
Ba k
Laura Zimmermann (UGA) Indian Employment Guarantee De ember 5, 2014 31
Introdu tion Ba kground Theoreti al Model Identi� ation Strategy Empiri al Results Con lusion Appendix
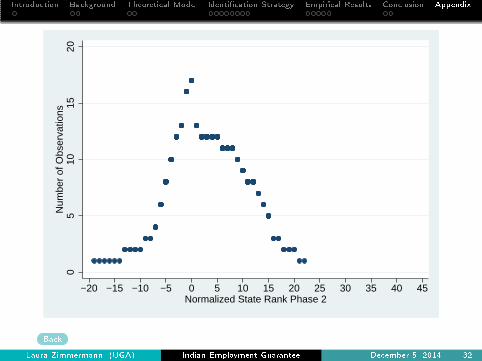
05
1015
20N
umbe
r of
Obs
erva
tions
−20 −15 −10 −5 0 5 10 15 20 25 30 35 40 45Normalized State Rank Phase 2
Ba k
Laura Zimmermann (UGA) Indian Employment Guarantee De ember 5, 2014 32
Introdu tion Ba kground Theoreti al Model Identi� ation Strategy Empiri al Results Con lusion Appendix
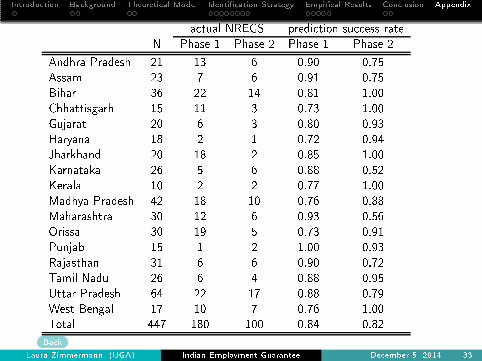
a tual NREGS predi tion su ess rate
N Phase 1 Phase 2 Phase 1 Phase 2
Andhra Pradesh 21 13 6 0.90 0.75
Assam 23 7 6 0.91 0.75
Bihar 36 22 14 0.81 1.00
Chhattisgarh 15 11 3 0.73 1.00
Gujarat 20 6 3 0.80 0.93
Haryana 18 2 1 0.72 0.94
Jharkhand 20 18 2 0.85 1.00
Karnataka 26 5 6 0.88 0.52
Kerala 10 2 2 0.77 1.00
Madhya Pradesh 42 18 10 0.76 0.88
Maharashtra 30 12 6 0.93 0.56
Orissa 30 19 5 0.73 0.91
Punjab 15 1 2 1.00 0.93
Rajasthan 31 6 6 0.90 0.72
Tamil Nadu 26 6 4 0.88 0.95
Uttar Pradesh 64 22 17 0.88 0.79
West Bengal 17 10 7 0.76 1.00
Total 447 180 100 0.84 0.82
Ba k
Laura Zimmermann (UGA) Indian Employment Guarantee De ember 5, 2014 33
Introdu tion Ba kground Theoreti al Model Identi� ation Strategy Empiri al Results Con lusion Appendix
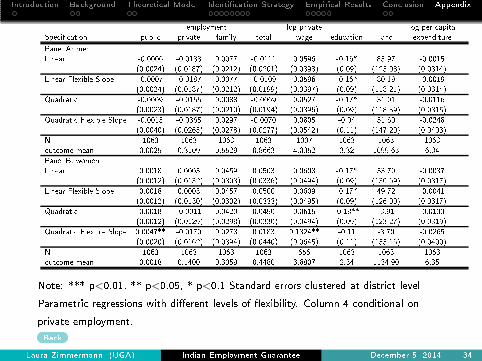
employment log private log per apita
Spe i� ation publi private family total wage edu ation land expenditure
Panel A: men
Linear -0.0006 -0.0188 0.0077 -0.0111 0.0596 -0.16* 83.97 -0.0015
(0.0024) (0.0187) (0.0212) (0.0201) (0.0398) (0.09) (123.03) (0.0314)
Linear Flexible Slope -0.0007 -0.0187 0.0077 -0.0109 0.0596 -0.16* 80.19 -0.0019
(0.0024) (0.0187) (0.0212) (0.0199) (0.0397) (0.09) (118.21) (0.0314)
Quadrati -0.0009 -0.0155 0.0088 -0.0069 0.0527 -0.17* 31.01 -0.0116
(0.0023) (0.0187) (0.0210) (0.0194) (0.0396) (0.09) (118.39) (0.0315)
Quadrati Flexible Slope -0.0013 -0.0365 0.0297 -0.0070 0.0805 -0.04 51.60 -0.0248
(0.0040) (0.0265) (0.0278) (0.0277) (0.0542) (0.11) (147.20) (0.0403)
N 1063 1063 1063 1063 1007 1063 1063 1063
out ome mean 0.0025 0.3109 0.5529 0.8663 4.0352 3.32 1099.63 6.34
Panel B: women
Linear 0.0018 0.0005 0.0459 0.0503 0.0608 -0.17* 53.70 -0.0037
(0.0012) (0.0132) (0.0303) (0.0336) (0.0494) (0.09) (130.69) (0.0317)
Linear Flexible Slope 0.0018 0.0003 0.0457 0.0500 0.0609 -0.17* 49.72 -0.0041
(0.0012) (0.0130) (0.0302) (0.0333) (0.0495) (0.09) (126.00) (0.0317)
Quadrati 0.0018 -0.0011 0.0420 0.0450 0.0615 -0.18** -3.91 -0.0133
(0.0012) (0.0129) (0.0298) (0.0330) (0.0494) (0.09) (123.27) (0.0319)
Quadrati Flexible Slope 0.0047** -0.0170 0.0278 0.0183 0.1324** -0.11 -3.70 -0.0265
(0.0020) (0.0162) (0.0394) (0.0440) (0.0645) (0.11) (155.16) (0.0400)
N 1063 1063 1063 1063 656 1063 1063 1063
out ome mean 0.0018 0.1400 0.3059 0.4480 3.6807 2.34 1134.90 6.35
Note: *** p<0.01, ** p<0.05, * p<0.1 Standard errors lustered at distri t level.
Parametri regressions with di�erent levels of �exibility. Column 4 onditional on
private employment.
Ba k
Laura Zimmermann (UGA) Indian Employment Guarantee De ember 5, 2014 34
Introdu tion Ba kground Theoreti al Model Identi� ation Strategy Empiri al Results Con lusion Appendix
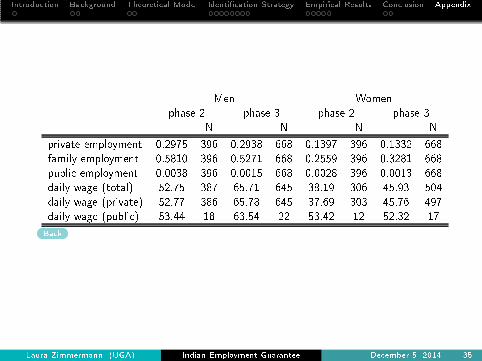
Men Women
phase 2 phase 3 phase 2 phase 3
N N N N
private employment 0.2975 396 0.2938 668 0.1397 396 0.1332 668
family employment 0.5810 396 0.5271 668 0.2559 396 0.3281 668
publi employment 0.0038 396 0.0015 668 0.0028 396 0.0013 668
daily wage (total) 52.75 387 65.71 645 38.19 306 45.93 504
daily wage (private) 52.77 386 65.78 645 37.69 303 45.76 497
daily wage (publi ) 53.44 18 63.54 22 53.42 12 52.32 17
Ba k
Laura Zimmermann (UGA) Indian Employment Guarantee De ember 5, 2014 35
Introdu tion Ba kground Theoreti al Model Identi� ation Strategy Empiri al Results Con lusion Appendix
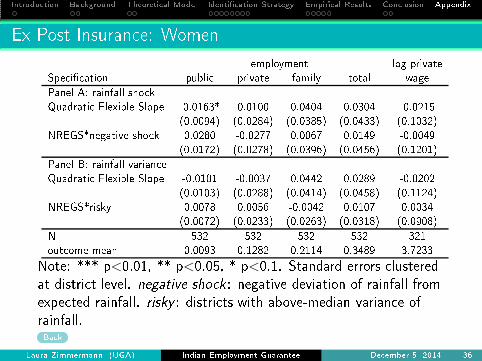
Ex Post Insuran e: Women
employment log private
Spe i� ation publi private family total wage
Panel A: rainfall sho k
Quadrati Flexible Slope -0.0163* 0.0100 0.0404 0.0304 -0.0215
(0.0094) (0.0284) (0.0385) (0.0433) (0.1032)
NREGS*negative sho k 0.0280 -0.0277 0.0067 0.0149 -0.0049
(0.0172) (0.0278) (0.0396) (0.0456) (0.1201)
Panel B: rainfall varian e
Quadrati Flexible Slope -0.0101 -0.0037 0.0442 0.0289 -0.0202
(0.0103) (0.0288) (0.0414) (0.0458) (0.1124)
NREGS*risky 0.0078 0.0056 -0.0042 0.0107 0.0034
(0.0072) (0.0233) (0.0263) (0.0318) (0.0908)
N 532 532 532 532 321
out ome mean 0.0093 0.1282 0.2114 0.3489 3.7233
Note: *** p<0.01, ** p<0.05, * p<0.1. Standard errors lustered
at distri t level. negative sho k : negative deviation of rainfall from
expe ted rainfall. risky : distri ts with above-median varian e of
rainfall.
Ba k
Laura Zimmermann (UGA) Indian Employment Guarantee De ember 5, 2014 36
Introdu tion Ba kground Theoreti al Model Identi� ation Strategy Empiri al Results Con lusion Appendix
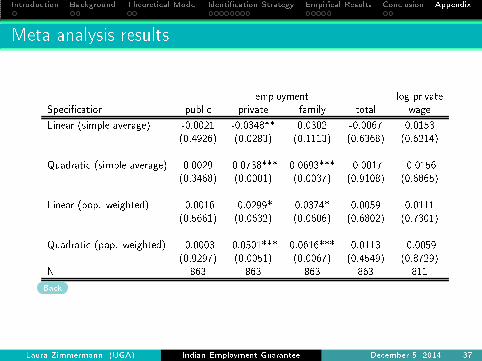
Meta analysis results
employment log private
Spe i� ation publi private family total wage
Linear (simple average) -0.0021 -0.0348** 0.0302 -0.0067 0.0153
(0.4926) (0.0283) (0.1113) (0.6368) (0.6214)
Quadrati (simple average) 0.0029 -0.0738*** 0.0693*** -0.0017 -0.0156
(0.3468) (0.0001) (0.0037) (0.9108) (0.6865)
Linear (pop. weighted) -0.0016 -0.0299* 0.0374* 0.0059 0.0111
(0.5661) (0.0632) (0.0606) (0.6802) (0.7301)
Quadrati (pop. weighted) -0.0003 -0.0501*** 0.0616*** 0.0113 -0.0059
(0.9297) (0.0051) (0.0067) (0.4549) (0.8729)
N 863 863 863 863 811
Ba k
Laura Zimmermann (UGA) Indian Employment Guarantee De ember 5, 2014 37
Introdu tion Ba kground Theoreti al Model Identi� ation Strategy Empiri al Results Con lusion Appendix
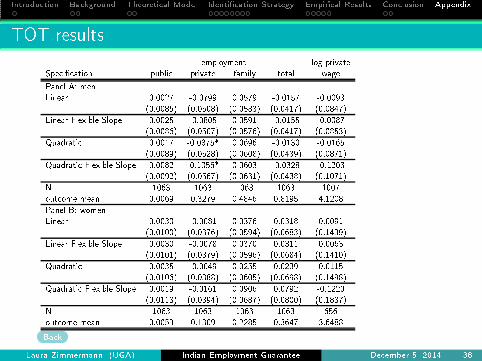
TOT results
employment log private
Spe i� ation publi private family total wage
Panel A: men
Linear 0.0027 -0.0799 0.0579 -0.0157 -0.0093
(0.0085) (0.0508) (0.0583) (0.0417) (0.0847)
Linear Flexible Slope 0.0025 -0.0805 0.0591 -0.0155 -0.0087
(0.0086) (0.0507) (0.0576) (0.0417) (0.0853)
Quadrati 0.0017 -0.0875* 0.0696 -0.0130 -0.0165
(0.0089) (0.0528) (0.0608) (0.0439) (0.0871)
Quadrati Flexible Slope 0.0082 -0.1056* 0.0603 -0.0328 -0.1203
(0.0092) (0.0567) (0.0631) (0.0438) (0.1071)
N 1063 1063 1063 1063 1007
out ome mean 0.0069 0.3279 0.4846 0.8195 4.1208
Panel B: women
Linear 0.0030 -0.0081 0.0376 0.0318 0.0091
(0.0100) (0.0376) (0.0594) (0.0683) (0.1439)
Linear Flexible Slope 0.0030 -0.0078 0.0370 0.0311 0.0063
(0.0101) (0.0379) (0.0596) (0.0684) (0.1410)
Quadrati 0.0035 -0.0049 0.0255 0.0239 0.0115
(0.0106) (0.0388) (0.0605) (0.0698) (0.1498)
Quadrati Flexible Slope 0.0019 -0.0161 0.0906 0.0792 -0.1220
(0.0118) (0.0394) (0.0687) (0.0800) (0.1887)
N 1063 1063 1063 1063 656
out ome mean 0.0053 0.1309 0.2285 0.3647 3.6488
Ba k
Laura Zimmermann (UGA) Indian Employment Guarantee De ember 5, 2014 38
Introdu tion Ba kground Theoreti al Model Identi� ation Strategy Empiri al Results Con lusion Appendix
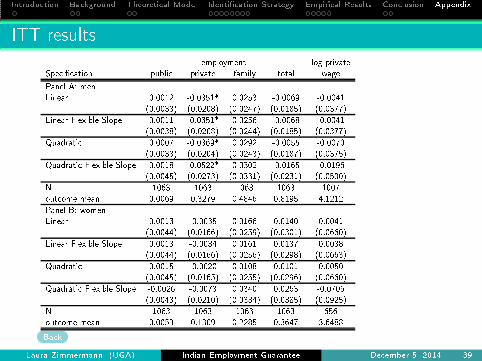
ITT results
employment log private
Spe i� ation publi private family total wage
Panel A: men
Linear 0.0012 -0.0351* 0.0253 -0.0069 -0.0041
(0.0038) (0.0208) (0.0247) (0.0185) (0.0377)
Linear Flexible Slope 0.0011 -0.0351* 0.0256 -0.0068 -0.0041
(0.0038) (0.0208) (0.0244) (0.0185) (0.0377)
Quadrati 0.0007 -0.0369* 0.0292 -0.0055 -0.0070
(0.0038) (0.0204) (0.0243) (0.0187) (0.0375)
Quadrati Flexible Slope 0.0018 -0.0522* 0.0302 -0.0165 -0.0196
(0.0045) (0.0273) (0.0331) (0.0231) (0.0500)
N 1063 1063 1063 1063 1007
out ome mean 0.0069 0.3279 0.4846 0.8195 4.1212
Panel B: women
Linear 0.0013 -0.0035 0.0166 0.0140 0.0041
(0.0044) (0.0166) (0.0259) (0.0301) (0.0660)
Linear Flexible Slope 0.0013 -0.0034 0.0161 0.0137 0.0038
(0.0044) (0.0166) (0.0256) (0.0298) (0.0663)
Quadrati 0.0015 -0.0020 0.0108 0.0101 0.0050
(0.0045) (0.0165) (0.0255) (0.0296) (0.0660)
Quadrati Flexible Slope -0.0026 -0.0073 0.0340 0.0263 -0.0706
(0.0043) (0.0210) (0.0334) (0.0385) (0.0925)
N 1063 1063 1063 1063 656
out ome mean 0.0053 0.1309 0.2285 0.3647 3.6488
Ba k
Laura Zimmermann (UGA) Indian Employment Guarantee De ember 5, 2014 39
Introdu tion Ba kground Theoreti al Model Identi� ation Strategy Empiri al Results Con lusion Appendix
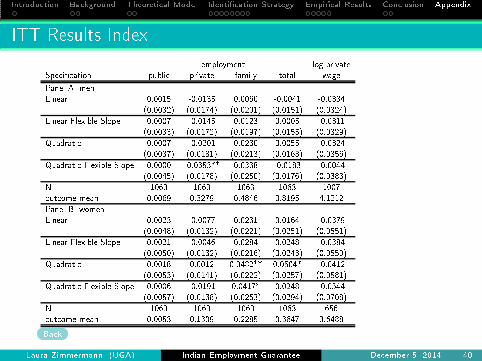
ITT Results Index
employment log private
Spe i� ation publi private family total wage
Panel A: men
Linear 0.0015 -0.0135 0.0060 -0.0041 -0.0334
(0.0032) (0.0174) (0.0201) (0.0151) (0.0324)
Linear Flexible Slope 0.0007 -0.0145 0.0123 0.0005 -0.0311
(0.0033) (0.0172) (0.0197) (0.0155) (0.0329)
Quadrati 0.0007 -0.0201 0.0230 0.0055 -0.0324
(0.0037) (0.0181) (0.0213) (0.0163) (0.0356)
Quadrati Flexible Slope 0.0000 -0.0353** 0.0338 -0.0183 -0.0044
(0.0045) (0.0178) (0.0250) (0.0176) (0.0383)
N 1063 1063 1063 1063 1007
out ome mean 0.0069 0.3279 0.4846 0.8195 4.1212
Panel B: women
Linear 0.0023 -0.0077 0.0231 0.0164 -0.0379
(0.0048) (0.0132) (0.0221) (0.0251) (0.0551)
Linear Flexible Slope 0.0021 -0.0046 0.0284 0.0248 -0.0384
(0.0050) (0.0132) (0.0216) (0.0243) (0.0550)
Quadrati 0.0018 0.0012 0.0482** 0.0504* -0.0412
(0.0053) (0.0141) (0.0222) (0.0257) (0.0581)
Quadrati Flexible Slope 0.0006 -0.0191 0.0417* 0.0248 -0.0544
(0.0057) (0.0138) (0.0253) (0.0294) (0.0708)
N 1063 1063 1063 1063 656
out ome mean 0.0053 0.1309 0.2285 0.3647 3.6488
Ba k
Laura Zimmermann (UGA) Indian Employment Guarantee De ember 5, 2014 40
Introdu tion Ba kground Theoreti al Model Identi� ation Strategy Empiri al Results Con lusion Appendix
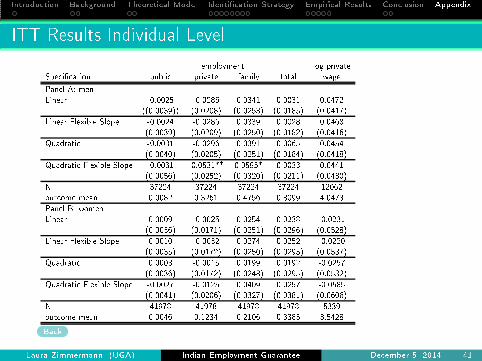
ITT Results Individual Level
employment log private
Spe i� ation publi private family total wage
Panel A: men
Linear -0.0025 -0.0286 0.0341 0.0031 0.0472
((0.0039)) (0.0208) (0.0253) (0.0185) (0.0417)
Linear Flexible Slope -0.0024 -0.0286 0.0339 0.0028 0.0468
(0.0039) (0.0209) (0.0250) (0.0182) (0.0416)
Quadrati -0.0031 -0.0296 0.0391 0.0065 0.0454
(0.0040) (0.0205) (0.0251) (0.0184) (0.0418)
Quadrati Flexible Slope -0.0031 -0.0531** 0.0595* 0.0033 0.0441
(0.0056) (0.0252) (0.0320) (0.0211) (0.0480)
N 37224 37224 37224 37224 12062
out ome mean 0.0082 0.3261 0.4756 0.8099 4.0473
Panel B: women
Linear 0.0009 -0.0025 0.0254 0.0238 -0.0231
(0.0036) (0.0171) (0.0251) (0.0296) (0.0528)
Linear Flexible Slope 0.0010 -0.0032 0.0274 0.0252 -0.0220
(0.0035) (0.0172) (0.0250) (0.0295) (0.0537)
Quadrati 0.0008 -0.0015 0.0199 0.0192 -0.0257
(0.0036) (0.0172) (0.0248) (0.0295) (0.0532)
Quadrati Flexible Slope -0.0027 -0.0125 0.0409 0.0257 -0.0585
(0.0041) (0.0206) (0.0327) (0.0381) (0.0606)
N 41978 41978 41978 41978 5339
out ome mean 0.0046 0.1234 0.2106 0.3385 3.5428
Ba k
Laura Zimmermann (UGA) Indian Employment Guarantee De ember 5, 2014 41

Introdu tion Ba kground Theoreti al Model Identi� ation Strategy Empiri al Results Con lusion Appendix
Dis ussion
Does NSS data adequately apture publi employment?
Can rule out take-up e�e ts larger than 1pp
Spe i� questions on publi employment, NREGS employment
Laura Zimmermann (UGA) Indian Employment Guarantee De ember 5, 2014 42

Introdu tion Ba kground Theoreti al Model Identi� ation Strategy Empiri al Results Con lusion Appendix
Dis ussion
Does NSS data adequately apture publi employment?
Can rule out take-up e�e ts larger than 1pp
Spe i� questions on publi employment, NREGS employment
Annual administrative re ords for 2007/08
1.4bn person-days of NREGS employment (1.78m proje ts) in
Phase 1 and Phase 2 distri ts
impli ation: on average 0.0764 NREGS workdays per person
per week in typi al distri t
NSS data
average publi -works workdays per person per week in typi al
distri t (Phase 1 and Phase 2): 0.0789
about 4 days of employment per person per year
Ba k
Laura Zimmermann (UGA) Indian Employment Guarantee De ember 5, 2014 42
Introdu tion Ba kground Theoreti al Model Identi� ation Strategy Empiri al Results Con lusion Appendix
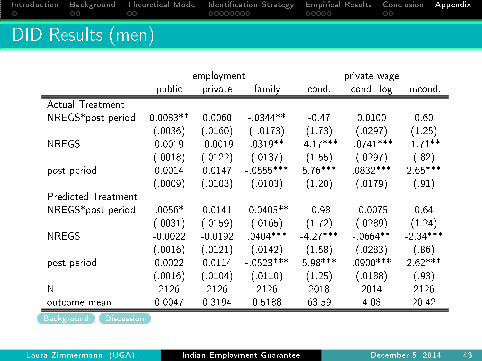
DID Results (men)
employment private wage
publi private family ond. ond. log un ond.
A tual Treatment
NREGS*post period 0.0083** 0.0060 -.0344** -0.47 0.0100 0.60
(.0036) (.0160) ( .0173) (1.73) (.0297) (1.25)
NREGS 0.0019 -0.0019 .0319** -4.17*** -.0741*** -1.71**
(.0018) (.0122) (.0137) (1.55) (.0297) (.82)
post period 0.0014 0.0147 -.0555*** 5.76*** .0832*** 2.65***
(.0009) (.0103) (.0103) (1.20) (.0179) (.91)
Predi ted Treatment
NREGS*post period .0056* 0.0141 -0.0405** -0.98 -0.0075 0.64
(.0031) (.0159) (.0165) (1.72) (.0289) (1.24)
NREGS -0.0022 -0.0192 .0404*** -4.27*** -.0664** -2.34***
(.0016) (.0121) (.0142) (1.58) (.0283) (.86)
post period 0.0022 0.0114 -.0523*** 5.98*** .0900*** 2.62***
(.0016) (.0104) (.0110) (1.25) (.0188) (.93)
N 2126 2126 2126 2018 2014 2126
out ome mean 0.0047 0.3194 0.5188 63.59 4.08 20.42
Ba kground Dis ussion
Laura Zimmermann (UGA) Indian Employment Guarantee De ember 5, 2014 43
Introdu tion Ba kground Theoreti al Model Identi� ation Strategy Empiri al Results Con lusion Appendix
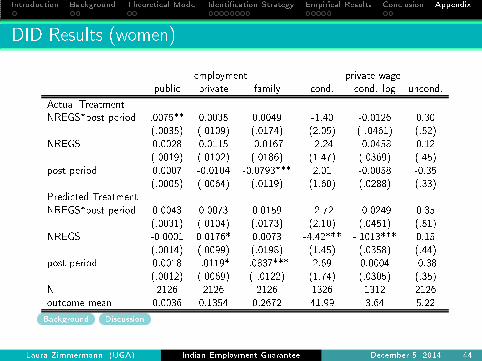
DID Results (women)
employment private wage
publi private family ond. ond. log un ond.
A tual Treatment
NREGS*post period .0075** 0.0035 0.0049 -1.40 -0.0126 0.30
(.0035) (.0109) (.0174) (2.05) ( .0461) (.52)
NREGS 0.0028 0.0115 -0.0167 -2.24 -0.0458 0.12
(.0019) (.0102) (.0186) (1.47) (.0369) (.45)
post period 0.0007 -0.0104 -0.0793*** 2.01 -0.0058 -0.35
(.0005) (.0064) (.0119) (1.60) (.0288) (.33)
Predi ted Treatment
NREGS*post period 0.0043 0.0073 0.0159 -2.72 -0.0249 0.35
(.0031) (.0104) (.0173) (2.10) (.0451) (.51)
NREGS -0.0001 0.0176* 0.0073 -4.42*** -.1013*** 0.15
(.0014) (.0099) (.0198) (1.45) (.0358) (.44)
post period 0.0018 -.0119* -.0837*** 2.69 0.0004 -0.38
(.0012) (.0069) ( .0122) (1.74) (.0305) (.35)
N 2126 2126 2126 1326 1312 2126
out ome mean 0.0036 0.1354 0.2672 41.99 3.64 5.22
Ba kground Dis ussion
Laura Zimmermann (UGA) Indian Employment Guarantee De ember 5, 2014 44
Introdu tion Ba kground Theoreti al Model Identi� ation Strategy Empiri al Results Con lusion Appendix
DID Di�eren es Explanation
Typi al DID results stress substantial private-se tor wage
in reases, NREGS take-up (e.g. Azam 2012, Berg et al. 2012,
Imbert and Papp 2013)
Di�eren es to my results ould be driven by sample
omposition, data, empiri al spe i� ations
Laura Zimmermann (UGA) Indian Employment Guarantee De ember 5, 2014 45
Introdu tion Ba kground Theoreti al Model Identi� ation Strategy Empiri al Results Con lusion Appendix
DID Di�eren es Explanation
Typi al DID results stress substantial private-se tor wage
in reases, NREGS take-up (e.g. Azam 2012, Berg et al. 2012,
Imbert and Papp 2013)
Di�eren es to my results ould be driven by sample
omposition, data, empiri al spe i� ations
Repli ation of results possible, di�eren es driven by
hoi e of empiri al spe i� ation: Imbert and Papp 2013
(seasonality), Berg et al. 2012 (high implementation quality)
sample omposition: Azam 2012 ( asual workers)
So di�eren es mostly explained by emphasis on di�erent subgroups
of distri ts or individuals. Overall patterns onsistent with my
results
Ba kground Dis ussion
Laura Zimmermann (UGA) Indian Employment Guarantee De ember 5, 2014 45