why has china overinvested in coal power? …
TRANSCRIPT

NBER WORKING PAPER SERIES
WHY HAS CHINA OVERINVESTED IN COAL POWER?
Mengjia RenLee G. BranstetterBrian K. Kovak
Daniel E. ArmaniosJiahai Yuan
Working Paper 25437http://www.nber.org/papers/w25437
NATIONAL BUREAU OF ECONOMIC RESEARCH1050 Massachusetts Avenue
Cambridge, MA 02138January 2019
This research was supported by funding from the CMU-Portugal program. We thank Karen Clay, AkshayaJha, Nick Muller, and Billy Pizer for helpful comments. We also thank Zhanming Chen, Thomas G.Rawski, Feng Song, Chu Wei, Lunyu Xie, and Yihua Yu for a useful discussion of this paper duringRenmin University's 98th Energy Economics Seminar. Any remaining errors are our own. The viewsexpressed herein are those of the authors and do not necessarily reflect the views of the National Bureauof Economic Research.
NBER working papers are circulated for discussion and comment purposes. They have not been peer-reviewed or been subject to the review by the NBER Board of Directors that accompanies officialNBER publications.
© 2019 by Mengjia Ren, Lee G. Branstetter, Brian K. Kovak, Daniel E. Armanios, and Jiahai Yuan.All rights reserved. Short sections of text, not to exceed two paragraphs, may be quoted without explicitpermission provided that full credit, including © notice, is given to the source.

Why Has China Overinvested in Coal Power?Mengjia Ren, Lee G. Branstetter, Brian K. Kovak, Daniel E. Armanios, and Jiahai YuanNBER Working Paper No. 25437January 2019JEL No. Q40,Q48
ABSTRACT
Since 2005, the Chinese government has engaged in an ambitious effort to move China’s energy system away from coal and towards more environmentally friendly sources of energy. However, China’s investment in coal power has accelerated sharply in recent years, raising concerns of massive overcapacity and undermining the central policy goal of promoting cleaner energy. In this paper, we ask why China engaged in such a pronounced investment boom in coal power in the mid-2010s. We find the protective rules under which China’s coal power industry has historically operated have made excessive investment extremely likely unless the central government serves as a “gatekeeper,” slowing and limiting investment in the face of incentives for socially excessive entry. When coal-power project approval authority was decentralized from the central government to local governments at the end of 2014, the gate was lifted and approval time considerably shortened, allowing investment to flood into the market. We construct a simple economic model that elucidates the effects of key policies on coal power investment, and examine the model’s predictions using coal-power project approval records from 2013 to 2016. We find the approval rate of coal power is about 3 times higher when the approval authority is decentralized, and provinces with larger coal industries tend to approve more coal power. We estimate that local coal production accounts for an additional 54GW of approved coal power in 2015 (other things equal), which is about 1/4 of total approved capacity in that year.
Mengjia RenCarnegie Mellon UniversityHeinz College 4800 Forbes AvePittsburgh, PA [email protected]
Lee G. BranstetterHeinz CollegeSchool of Public Policy and ManagementDepartment of Social and Decision SciencesCarnegie Mellon UniversityPittsburgh, PA 15213and the Peterson Institute for International Economicsand also [email protected]
Brian K. KovakH. John Heinz III CollegeCarnegie Mellon University4800 Forbes Avenue, HBH 3012Pittsburgh, PA 15213and [email protected]
Daniel E. ArmaniosCarnegie Mellon UniversityHeinz College 4800 Forbes AvePittsburgh, PA [email protected]
Jiahai YuanSchool of Economics and Management North China Electric Power University Beijing [email protected]

2
1. Introduction
Since 2005, the Chinese government has engaged in an ambitious effort to move China’s
energy system away from coal and towards more environmentally friendly sources of energy.
The government has sponsored a historically unprecedented expansion of renewable energy, with
its wind and solar photovoltaic (PV) capacity growing rapidly to double those of the U.S. by
2017 and 2016 respectively. This growth was greatly enabled by the renewable energy policy
framework created by the landmark Renewable Energy Law, passed in 2005 and amended in
2009. Paradoxically, however, China has – at the very same time – been investing heavily in a
massive expansion of coal-fired thermal energy capacity. From 2010 to 2015, China’s coal
power capacity increased from 660 to 884 GW, and China approved nearly 200 GW of new coal
power capacity in 2015 alone.1
The rapid expansion of coal power investment raised serious concerns of overcapacity in
coal power and increased rates of renewable energy curtailment, in which wind and solar power
generation are refused by the grid operator even though power is available. In 2016, it was
estimated that China would face 200 GW of overcapacity in coal power if all the coal power
projects submitted for Environmental Impact Assessment (EIA) approval were put into operation
in 2020 (Yuan et al., 2016). In 2018, Feng et al. (2018) estimated the excess scale to be around
210 GW under their basic scenario and 240 to 260 GW under a high scenario. At the same time,
the curtailment rates for renewable energy in China rose to astonishingly high levels – 17.1%2 of
wind energy and 19.81%3 of solar energy were curtailed in 2016 (compared to less than 2.5%4
1 Authors’ calculations based on coal power project approval dataset described in Section 4.1. 2 From http://www.nea.gov.cn/2018-02/01/c_136942234.htm 3 From http://www.nea.gov.cn/2017-01/19/c_135996630.htm4 (Bird, Cochran, & Wang, 2014)

3
annual aggregate wind and solar curtailment in the United States since 2013). Starting from
March 2016, the central government issued a series of policies designed to halt investment in
coal power generation across the country, cancelling and suspending coal power projects up to
90 GW of capacity in 2016 and 2017. 5 Apparently, the government realized the risk of
enormous excessive supply in coal power and took immediate actions to mitigate the associated
social cost.
If the Chinese government has been aggressively promoting renewable energy to
restructure its energy mix, why did it also keep investing in coal power to the point where the
government had to conduct emergency measures to limit this investment? What is holding China
back from using more renewable power and less coal power? In this paper, we argue that
longstanding market rules created a persistent incentive for power companies to invest, as they
effectively guaranteed positive profits for new investments. We demonstrate the implications of
these incentives in a simple model and empirically confirm its predictions using a newly
collected dataset of coal-fired power project approval records. The decentralization of coal
power approval authority in 2014 removed an important historical “brake” on a longstanding
5 2016/3/17 “Notice on Promoting the Orderly Development of Coal Power in China”《关于促进我国煤电有序发展的通知》 2016/4/20 “Notice on Establishing Risk Early Warning Mechanism for Coal Power Planning and Construction”《关于建立煤电规划建设风险预警机制暨发布 2019年煤电规划建设风险预警的通知》 2016/8/5 “Notice on further standardizing the order of construction of power projects”《关于进一步规范电力项目开工建设秩序的通知》 2016/9/15 “Notice on canceling a batch of coal-fired power projects that do not have the approved construction conditions”《关于取消一批不具备核准建设条件煤电项目的通知》 2016/10/10 “Notice on further regulation of coal power planning and construction”《关于进一步调控煤电规划建设的通知》 2017/7/26 “Opinions on promoting the structural reform of the supply side and preventing the overcapacity of coal-fired power generation”《关于推进供给侧结构性改革,防范化解煤电产能过剩风险的意见》 2017/9/26 “Notice on Printing and Distributing the List of Cancelled and Suspended Coal Power Projects in 2017” 《关于印发 2017年分省煤电停建和缓建项目名单的通知》

4
tendency to overinvest in thermal power; coal power approval rates tripled after approval
authority was decentralized. This occurred because local governments tended to place greater
value on the short-run economic stimulative effect of new power plant construction, and less
value on the longer-run problems created by excessive thermal power capacity. This
misalignment of incentives should be greatest in provinces that have large coal industries, and
we find strong empirical evidence supporting this hypothesis.
Prior researchers have studied China’s unusually high level of curtailment of renewable
power by reviewing the distinctive policies and institutional structure in China’s power sector.
These prior studies recognized the deep-rooted political and institutional obstacles to the
effective utilization of renewable energy capacity in China (García, 2011; Kahrl & Wang, 2014,
2015; Lam, Branstetter, & Azevedo, 2016, 2017; Zhao, Wang, & Wang, 2012). One key problem
relates to the rules under which renewable energy and coal-fired power plants compete for
utilization – these rules have traditionally privileged coal power in a number of ways, including
assigned generation hours and administered on-grid electricity price (Davidson, 2014; Kahrl et
al., 2013; Ma, 2011; Zhao et al., 2012). Prior research has also identified the incentives faced by
local governments to prioritize economic growth over environmental policy objectives in ways
that undermined central government policies to promote cleaner energy (Zhao et al., 2013). In
this paper, we investigate key industry policies that have tilted the playing field of power
generation towards coal power and against renewables. In particular, we show that a recent
policy that decentralized coal power project approval authority from the central government to
provincial governments significantly increased firms’ investment in coal power. This paper
explains China’s overinvestment in coal power from an economic perspective, and provides a
plausible explanation for provincial differences in coal power investment.
5
The paper is organized as follows. Section 2 provides an overview of China’s power
industry, key policies, and institutional background. Section 3 constructs an economic
investment model to illustrate the economic incentives driving coal power investment in China.
Section 4 examines the effects of industry policies on the 2015 investment boom using a unique
dataset of coal-power project approval records from 2013 to 2016. Section 5 provides a
discussion, and Section 6 concludes.
2. China’s Power Industry
2.1. Energy Structure, Supply and Demand
The development of renewable and coal power have proceeded almost in parallel in
China. Figure 1 shows China’s coal, wind, and solar PV production capacity from 2005 to 2015.
The expansion of coal power in recent years has been quite large relative to the growth in
renewable energy capacity. The utilization rate of power generation facilities, measured by
average annual operation hours, has declined by almost 30 percent from 2005 to 2015. In
addition to declining operation hours, wind and solar curtailments have been rampant across
Chinese provinces, as Table 1 shows. Since wind and solar energy are clean, have no fuel cost,
and have been developed rapidly with extensive government support, these high curtailment
rates represent a substantial social loss.6
[Figure 1 about here.]
[Table 1 about here.]
6 Curtailment rates in China have been 7-10 times higher than the United States in recent years.

6
From 2010 to 2015, as Table 2 shows, total electricity demand increased by 38% while
installed generation capacity increased by 55%, which explains the declining operation hours of
generation facilities.
[Table 2 about here.]
In the face of declining operation hours and rampant renewable curtailments, the local
governments, surprisingly, approved nearly 200 GW of new coal power capacity in 2015, which
was almost 1/4 of total existing coal power capacity. Figure 2 shows the quarterly approval of
coal power capacity from January 2012 to March 2016. An unanticipated slowdown in industrial
demand for electricity occurred in the mid-2010s. However, the explosion in new capacity was
so great that overcapacity would have resulted even if demand growth had been stable.
[Figure 2 about here.]
2.2. China’s Protective Policies for Coal Power
To understand why China engaged in the massive expansion of coal power, one needs to
understand the policies that have incentivized investment in coal power, in particular, the power
dispatch and wholesale electricity pricing mechanisms. Dating back to the 1980s, China
experienced surging electricity demand, as market-oriented reforms caused economic growth to
accelerate. Inadequate electricity generating capacity quickly emerged as a factor limiting
industrial expansion. To encourage power investment, the government set relatively equal annual
operating hours for all coal-fired power generators, and dispatched them based on an annual
contract designed to maintain operation hour targets (Kahrl et al., 2013). This rule is known as
“equal share dispatch” or “average dispatch” (平均调度 | Ping Jun Diao Du), and is formally
named the “generation quota system” (发电配额制度 | Fa Dian Pei E Zhi Du). In economic

7
terms, this allocation rule ensured that demand was equally distributed across producers. This, in
turn, raised the possibility of a business-stealing effect inducing excessive entry (Mankiw &
Whinston, 1986).
In addition to equal operation hours, to meet surging electricity demand in 1980s, China
implemented the so-called “cost-repayment tariff scheme” (还本付息电价 | Huan Ben Fu Xi
Dian Jia) to encourage power investment. This policy directed electricity sale prices to be set so
as to ensure repayment of principle and interest on all borrowing plus a reasonable profit margin
for each coal-fired power plant. However, China soon realized that such a “rate-of-return” policy
induced little incentive for generation companies to invest in cost control. The government then
introduced the “benchmark on-grid electricity tariff” mechanism in 2003 to set a uniform
electricity price within a province for all coal power plants. These benchmark tariffs aimed to
reflect average social costs of power generation in each province and to provide incentives for
power producers to reduce costs (Ma, 2011). While coal power plants could earn profits under
the administratively set electricity price in each province, they could further enlarge their profit
margins by reducing operation costs. With the generation quota system and regulated electricity
price policy in place, the coal power generation business in China has been almost risk-free.
2.3. China’s Project Approval System and Coal Power Investment in China
Since the early 2000s, a unique project approval system has been used in determining the
level and composition of investment in power generation and transmission in China. The
approval process consists of government review (审批制 | Shen Pi Zhi), project approval (核准
制 | He Zhun Zhi), and project registration (备案制 | Bei An Zhi), each applying to different
kinds of energy investment projects and carried out by different levels of government. Without
coordinating with China’s industrial planning process in a way that could carefully balance the

8
energy demand arising from future growth and the energy supply needed to fuel it, government
agencies have often approved new projects without any transparent, objective criteria for
determining how much and what kind of generation and transmission capacity to build, and
where to build it (Kahrl & Wang, 2015).
Coal power projects have been subject to the second type of approval process, project
approval (核准制 | He Zhun Zhi). In particular, there was a decentralization of project approval
authority from central government to provincial governments for coal power projects in 2014.
Prior to November 2014, the central government retained sole authority to approve coal-fired
power projects. The approval procedure was often lengthy and costly, sometimes taking years for
a project to obtain all the licenses and permits required before construction. To facilitate an
easier approval process for business, the government decentralized approval authority of coal-
fired power plants from central to provincial governments in November, 2014. Thereafter, the
approval procedure was considerably simplified and approval time greatly shortened. Figure 3
shows the time spent from the Ministry of Environmental Protection (MEP)’s pre-approval to
National Development and Reform Commission (NDRC)’s final approval for 47 projects
approved by the central government and 124 projects approved by provincial governments.
Provincial approvals shortened the average approval process by more than half. Figure 4 shows
the process time from MEP Pre-approval to NDRC Final Approval using a random sample of
projects from the five largest generation companies in China, known as the “Big Five.” The
plants in the random sample approved under the old, centralized system are plotted as squares.
The plants approved under the decentralized system are plotted as circles. The decentralized
approval regime decreased approval times, and these reductions were bigger for larger projects.
Based on our dataset, the “Big Five” together owned 49.9% of operating coal power capacity in

9
2017, so a sample based on the Big Five is informative about the underlying population of power
plants.
It should also be noted that the Chinese government stipulates that 300MW coal power
units be constructed within 24 months, and 600MW units within 26 months, after which the
plants will be tested for safety and put through a 168-hour trial commercial operation before
transitioning to full operation. Therefore, the average approval time of a project before
decentralization was comparable to the maximum construction time of the project.
[Figure 3 about here.]
[Figure 4 about here.]
2.4. Institutional Background
Implementation of a policy at the local level strongly depends on its interest alignment
with local stakeholders. Prior to 2017, local economic growth had been put at the top of the
policy agenda of local governments, while other social issues such as environmental protection
have had a lower priority. Under China’s cadre evaluation system, provincial leaders have been
pressured to meet GDP growth rate targets and compete with the economic performance of other
provinces for future promotion and resource acquisition from superiors (Guo, 2009; Li & Zhou,
2005; Shih, Adolph, & Liu, 2012; Zhang & Zhao, 2014). As a result, provincial leaders are
highly incentivized to promote local investments that directly increase local GDP growth. More
importantly, they are capable of intervening in power generation investments – state-owned
enterprises (SOE) accounted for 91.6% of total revenues in China’s power sector in 2010
(Szamosszegi & Kyle, 2011). This means local government leaders can easily intervene in local

10
SOEs’ investment plans through their role as leading shareholders.7 For centrally owned
enterprises, local governments are also able to intervene using coercive administrative force.8
This institutional background gives rise to a hypothesis concerning the relative impact of
approval decentralization across provinces: investment in coal power generation under the
decentralized approval regime should be especially strong in provinces with a large local coal
mining industry. This positive correlation should exist because the construction of new power
plants would not only increase provincial GDP in the very short run – it would also lead to
greater demand for (and therefore greater supply of) locally mined coal, providing a secondary
boost to GDP and shoring up a local pillar industry.
3. Economic Model
We model the behavior of a representative generation company, which selects a level of
generating capacity in which to invest and then produces output in accordance with the
government’s regulatory structure. In particular, the Chinese government sets the wholesale
electricity price and assigns production levels approximately proportionally based on plant
capacity. Therefore, each producer in province i will have approximately the same capacity
factor, defined as power actually generated divided by rated peak power. The value of this
capacity factor will be determined by the total provincial coal power generation (𝐷") divided by
total provincial rated peak power (𝑌").
7 The government agency “State-owned Assets Supervision and Administration Agency (SASAC)” represents and performs duties of the shareholder of these nationally owned SOEs on behalf of the Chinese state. SASAC has the right to share asset income, involve itself in important decision-making processes, and appoint the top management teams of these firms. It also makes vets important decisions by these SOEs, including large investments, profit distributions, senior executive dismissals, and bankruptcy, according to China’s State-owned Assets Law. 8 Local governments hold the approval authority for new investments by firms, which they can use as a credible threat to intervene in the current investment of firms operating within their jurisdiction. Also, as firms usually encounter upfront cost (preliminary research, land transfer, and etc.), they are vulnerable to local governments’ repeal of previously granted permits and land use rights if they do not conform to the wishes of the local authorities.

11
𝐶𝐹" =𝐷"𝑌", (1)
where 𝑖 indicates province, 𝐶𝐹" indicates the capacity factor of coal power generators in province
𝑖, defined by average power generated divided by rated peak power, 𝐷" is the load demand to be
served by coal power in province 𝑖 at time of investment, and 𝑌" is existing coal power supply in
province 𝑖 at time of investment.9
Historically, operation hours of generation facilities have been highly correlated with
economic performance (i.e. GDP growth). While operation hours may fluctuate due to economic
cycles and shocks, China successfully maintained an average of more than 5000 hours per plant
per year from 1978 to 2013,10 and few people in the power industry were seriously concerned
about the momentum of China’s economic growth and associated growth in energy demand.11
Because of this history, we assume that investors in coal power plants presume the capacity
factor of a province (average annual operation hours) to be relatively stable in the long run. In
addition, they ignore the marginal effect of their own investment on the province’s overall
capacity factor – we verified this by talking to industry experts in China, including a coal power
plant CEO, who acknowledged the fact that they would plan new projects as long as the region’s
existing operation hours meet their threshold. This CEO also claimed that if his firm did not
invest in new coal power capacity under current incentives, other firms would.
From an economic perspective, equal allocation of inelastic electricity demand across
producers creates a strong “business-stealing” effect, and when the effect combines with an
administratively set price that guarantees a marginal profit for most producers and low
9 𝐶𝐹" can also be calculated by coal power’s annual average operation hours divided by 8760h per year 10 (Wu, 2009) and authors’ calculations with more recent data. 11 Interview and conversation with coal power plant CEO in Jilin province.

12
administrative barriers for new capacity (“free entry”) under the decentralized approval regime,
private investments tend to be excessive relative to the social optimum (Mankiw & Whinston,
1986). We ignore the integer constraint on power plants so that investment (capacity) can be
treated as continuous. A firm therefore selects capacity 𝑠 to maximize profit:
𝜋(𝑠) = 𝑃"𝑞"/(𝑠) − 𝑐"(𝑞"/ 𝑠 ) − 𝐹(𝑠) − 𝐴",3(𝑠) (2)
where 𝑃" is the administered wholesale electricity price in province 𝑖, 𝑞"/ is expected lifetime
generation output given capacity 𝑠, 𝑐" 𝑞 is variable cost to produce output of 𝑞, 𝐹(𝑠) is the
fixed cost to invest capacity 𝑠, and 𝐴",3(𝑠) is the administrative cost of government approval.
Consistent with Figure 4, this administrative cost varies with capacity s and depends on the
relevant approval regime, as indicated by d, which equals 0 before the decentralization and 1
after.
The firm’s first-order condition is:
𝜋4 𝑠 = 𝑞"/4 𝑠 𝑃" − 𝑐"4 𝑞"/(𝑠) − 𝐹′(𝑠) − 𝐴",3′(𝑠) = 0 (3)
Having invested in capacity according to (3), firms then produce electricity output 𝑞, as assigned
by government regulators. Since regulators set each firm’s output to achieve the common
provincial capacity factor in (1), the firm’s expected output given its chosen capacity s is
𝑞"/ = 𝐶𝐹"/ ⋅ 𝑠 (4)
Substituting this into the first-order condition yields
𝐶𝐹"/ 𝑃" − 𝑐"4 𝑞"/(𝑠) = 𝐹4 𝑠 + 𝐴",34 𝑠 . (5)
Equation (5) shows that firms will invest up to the point where their marginal cost of
investment is equal to the expected marginal profit of investment. Because the cost of capital

13
generally rises with the scale of investment, we assume 𝐹′(𝑠) > 0 and 𝐹′′(𝑠) > 0. Based on
Figure 4, we can also assume the total administrative cost to be approximately linear in the size
of capacity investment, which means the slope of 𝐴 𝑠 is a positive constant: 𝐴4 𝑠 = 𝑎 > 0.
Figure 4 also shows that decentralization of approval from the central to provincial governments
significantly lowers marginal approval cost, as seen in the flatter slope of the approval time
profile after decentralization. Therefore, we have 𝐴",3=>4 𝑠 > 𝐴",3=?4 𝑠 , or 𝑎3=> > 𝑎3=?.
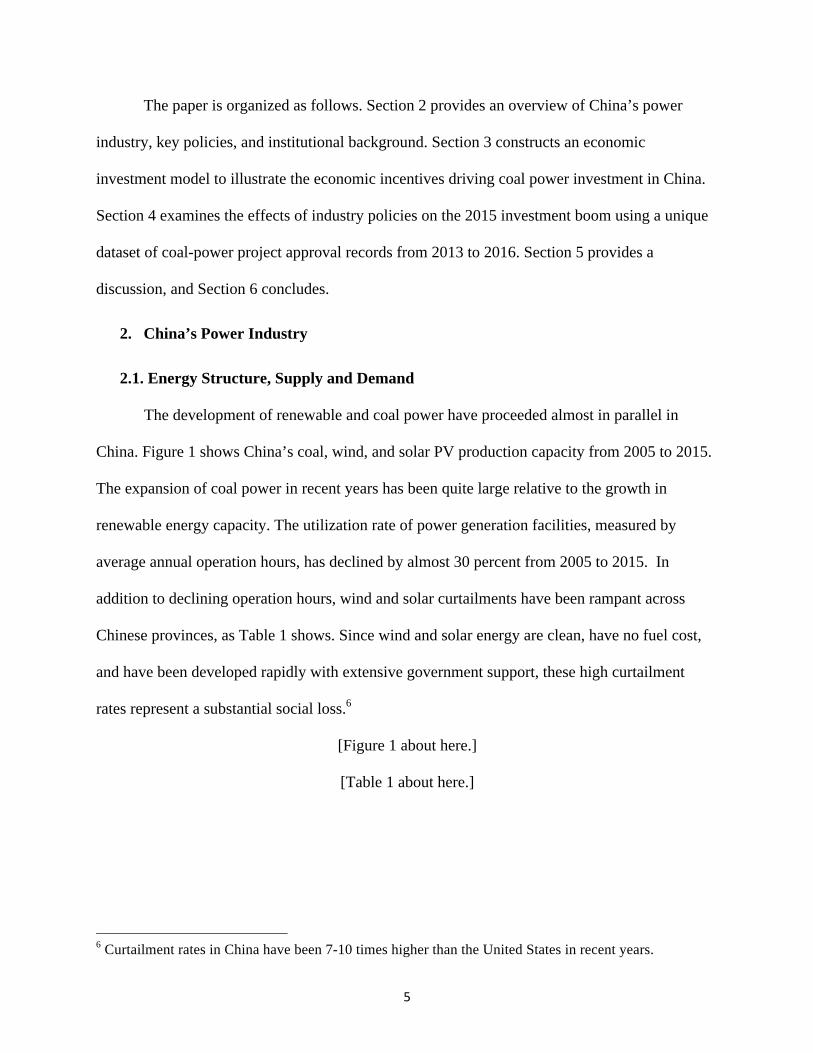
We illustrate the equilibrium in Equation (5) in Figure 5. The left-hand-side of (5) is the
expected marginal benefit of investment. One unique feature of the coal power industry is that
fuel costs constitute the majority of variable cost (60% – 70% in China).12 Therefore, the
marginal cost of generation 𝑐"4 𝑞"/ will be principally driven by the fuel cost (coal price) in
province 𝑖. Also, since the electricity price 𝑃" is administered, the marginal profit 𝑃" − 𝑐"4 𝑞"/
for coal power generation will be highly correlated across plants within a province. For
expositional purposes, Figure 5 assumes a constant marginal cost of generation, implying a
constant marginal profit of investment. Our qualitative conclusions are identical with convex
generation costs. The right-hand-side of Equation (5) is the marginal cost of investment,
consisting of the marginal fixed cost 𝐹4 𝑠 and marginal administrative cost 𝑎.13 Firms therefore
maximize profits by investing in capacity 𝑠? of coal power, at which the marginal benefit meets
the marginal cost of investment.
[Figure 5 about here.]
By the end of 2014, however, approval authority was decentralized to provincial level.
This decentralization policy effectively lowers the marginal administrative cost of project
12 (Lin, 2017) http://paper.people.com.cn/zgnyb/html/2017-09/04/content_1803137.htm 13 Prior to November 2014, approval authority is solely retained by the central government, and thus the marginal administrative cost 𝑎> does not vary by province.

14
approval as discussed above, which shifts the marginal cost of investment curve down, while
leaving everything else constant. Notice that the optimal investment level (𝑠@") will now vary by
𝑖 because provinces may have different marginal administrative costs following the
decentralization policy.
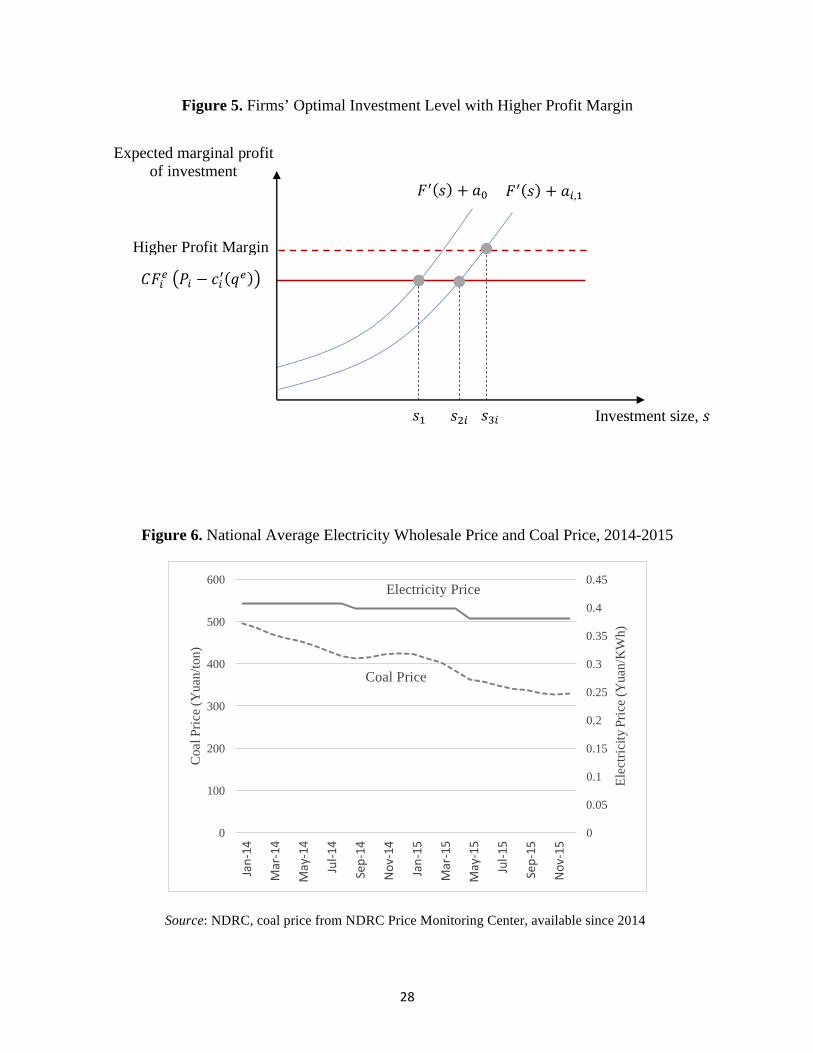
In addition to decentralization of approval authority, coal prices had been falling since
2012, and adjustment of electricity prices had lagged behind. Figure 6 shows the changes in
national average electricity wholesale price and the coal price from 2014 to 2015. The growing
gap implies an increasing marginal profit of generation.14 This increases the marginal benefit of
investment and moves the horizontal line in Figure 5 upward, raising private optimal investment
levels to 𝑠A". An increase in the coal price shrinks the marginal profit of generation and has the
opposite effect.
[Figure 6 about here.]
Therefore, the model predicts an increase in the level of private investment in coal power
after decentralization of approval authority. Also, higher marginal profit should lead to increased
capacity investment. We will examine the effects of these two factors in the empirical analysis
below. In addition, we test the hypothesis of provincial heterogeneity in exploitation of the
decentralization policy based on political incentives embedded in China’s cadre evaluation
system.
14 Appendix figures A1-A3 show changes in provincial electricity wholesale prices, coal prices, and marginal profits from March 2012 to March 2016.

15
4. Empirical Analysis
4.1 Data
In this section, we empirically assess the effect of the approval decentralization policy on
coal power investment in China, and also seek to explain the provincial heterogeneity in that
effect. We manually collected a dataset of China’s coal-fired power project “approval records”
from June 2013 to March 2016 across 30 provinces and province-level subnational
administrative units, excluding Tibet. A total of 313 approved projects were collected from
government websites, power companies’ websites, and online news sources.15 We confirmed the
completeness of our data coverage by cross checking with Green Peace’s dataset of coal-fired
power projects registered with the Ministry of Environmental Protection. The study period ends
in March 2016 because, starting from that month, the Chinese central government issued a series
of policies to halt the approval and construction of new coal power plants after realizing the vast
extent of overcapacity.16
On October 31st, 2014, the State Council released the revised National Investment Project
Catalogues, decentralizing the approval authority of thermal power stations to provincial
governments, so the decentralization policy went into effect starting in November 2014.17
Table 3 summarizes the implementation of the policy. It shows that the policy is fully
implemented within months after its issuance at the end of October in 2014: there is a significant
reduction in central-government approvals. Table 4 summarizes the number of projects and the
amount of generating capacity approved before and after the decentralization policy was issued.
Each period spans 17 months.
15 Most records are collected from provincial NDRC websites and news published by http://www.bjx.com.cn 16 See footnote 5.17 Government Investment Project Approval Catalogue (2014) http://www.gov.cn/zhengce/content/2014-11/18/content_9219.htm

16
[Table 3 about here.]
[Table 4 about here.]
The approval records are incorporated into a panel dataset, with the dependent variable
being coal power capacity approved. These data vary by province and month from 2013 June to
2016 March. However, because not every province approved coal power projects every month
and there are often months that approved multiple projects, the data are sparse and highly
variable: 80% of the dependent-variable entries are zero. The choice of independent variables
depends on the hypothesis and the selected model. Table 5 lists the main variables used in this
study, their units, and summary statistics. We use the number of full-load operation hours to
indicate generators’ capacity factor, as capacity factor is calculated by dividing the number of
full-load operation hours by the total number of hours in a year.
[Table 5 about here.]
4.2 Empirical Approach
The economic model predicts that decentralization of approval power leads to higher
investment in coal power because of lower administrative costs. We assess the effect of the
decentralization policy on coal power investment in each province using the following baseline
specification.
𝐶𝑎𝑝𝑎𝑐𝑖𝑡𝑦"E = 𝛼" + 𝛾H + 𝛽?𝑃E + 𝛽@𝑀𝑃"E + 𝛽@𝑂𝐻"M + 𝜀"E, (6)
where 𝐶𝑎𝑝𝑎𝑐𝑖𝑡𝑦"E is the capacity approved for province 𝑖 during month 𝑡, 𝛾H is a season dummy
(winter, spring, etc.), 𝑃E = 1 indicates months after the decentralization policy went into effect,
𝑀𝑃"E is the lagged 12-month moving average of marginal profit for a representative coal-power
generation company in province 𝑖 during month period 𝑡, and 𝑂𝐻"M is the 1-year lagged number

17
of operation hours of coal power units in province 𝑖. We expect to find that the policy led to
increased coal capacity, i.e. 𝛽? > 0.
The impact of the central government’s handover of entry regulation authority to the
provinces may also vary across provinces. Figure 7 shows monthly average coal production and
coal power approvals by province in our dataset, and we can see that provincial heterogeneity in
the approval rate is much greater after decentralization than before. We hypothesize that
provinces that already have a relatively large coal mining industry may be more likely to permit
the construction of new plants, because this will raise demand for another important local
industry, and hence boost local officials’ economic performance, a key criterion in China’s cadre
evaluation system (see Section 2). Also, large coal-mining industries may have more political
power to lobby the government for permission to build more coal power plants. We therefore
estimate the following interaction model.
𝐶𝑎𝑝𝑎𝑐𝑖𝑡𝑦"E = 𝛼" + 𝛾H + 𝛽?𝑃E + 𝛽@𝐶"E + 𝛽A𝑃E ∗ 𝐶"E + 𝛽Q𝑀𝑃"E + 𝛽R𝑂𝐻"M + 𝛽S𝐺𝐷𝑃"M + 𝜀"E (7)
where 𝐶"E is the lagged 12-month moving average of coal production in province 𝑖 and 𝐺𝐷𝑃"M is
the lagged 1-year GDP growth rate (in percentage terms) of province 𝑖. All other terms follow
specification in equation (6). Because we hypothesize that more coal intensive regions will
respond more strongly to the policy, we expect that 𝛽A > 0.
[Figure 7 about here.]

18
4.3. Results
Table 6 shows the results of estimating the baseline specification in equation (6). As
expected, we find that the decentralization policy has a significant positive effect on coal-power
project approval and dominates the effect of the other factors. Table 6 column (3) shows that
governments approved about 360MW more coal power capacity per month after decentralization
of approval authority. This is a very large effect, since the average monthly approval was only
120MW before decentralization. Note that the standard errors in Table 6 are clustered by
province.
[Table 6 about here.]
Because the dependent variables are nonnegative count data with overdispersion, we
apply a fixed-effect negative binomial model to control for conditional means and variances.18
Using a fixed-effect negative binomial model, Table 7 also shows that the approved capacity of
coal power is about 3 times higher when the approval authority is decentralized.19 We also find
that the implementation of the decentralization policy mediates the effect of marginal profit, such
that the significance of marginal profit declines when the policy dummy variable is included.
This means that the policy effect dominates the increase in approval records in the decentralized
regime. Because most variation in operational hours is cross provincial rather than over time, the
effect of operation hours is not significant when provincial fixed effects are included.
[Table 7 about here.]
18 We include an indicator variable for each province to control for conditional means of the negative binomial model, suggested by https://statisticalhorizons.com/fe-nbreg#comments 19 Observations of two municipalities (Beijing and Shanghai) are omitted in the fixed-effect binomial model because of no approvals throughout the study period.

19
By interacting our decentralization policy dummy with lagged measures of provincial
coal production in Table 8, we find that provinces with a larger local coal industry are more
likely to approve new coal power investment following decentralization. This effect is
statistically significant and economically large, with the coefficient on this interaction term
implying that each additional million tons of local coal production is associated with 15 MW of
additional coal power capacity approved on a monthly basis after decentralization, other things
being equal.20 Since an average province produced about 10 million tons of coal per month in
2015, this implies that an additional 54GW of coal power was approved due to local coal
production in 2015 (other things equal), which is roughly 1/4 of total approved capacity in that
year. Using the coefficients from Table 8, we can also get a sense of the effect of GDP growth on
coal power approval. Our estimated coefficients imply that a 1% increase in provincial GDP is
associated with 28MW of additional coal power approval per month for a province, other things
equal. Note that provincial characteristics are lagged by one year. Specifically, since coal
production and marginal profit have monthly variation, we use lagged moving averages of past
12 months to capture investors’ expectations for these two factors.
[Table 8 about here.]
5. Discussion
Historically, China has struggled to meet its electricity demand in a reliable and efficient
manner. Dating back to the 1980s, China experienced chronic power shortages and relied on
“demand planning” to allocate limited power resources to municipalities and counties via a
quarterly “electricity use quota” (Kahrl & Wang, 2014; Wang & Chen, 2012). After three
20 The direct impact of local coal production is insignificant, indicating that under centralized approval regime, coal power project approval was not affected by local coal production level.

20
decades of “reform and opening” in the power industry, China’s power shortage has been largely
relieved, but instead of achieving a stable balance between energy demand and supply, the
Chinese government put in place policies leading to a significant coal power investment
bubble.21 As the government became aware of the overcapacity emerging in coal power
generation, it took actions to suspend ongoing projects and prevent further investment, and
initiated a new round of reforms to experiment with liberalization of the wholesale electricity
market.
However, achieving long-term efficiency in energy investment may be particularly
challenging for China. When it comes to development of renewable energy and reform of the
electricity sector, China is viewed as having very diverse development goals that can come into
conflict with one another – including energy security, socio-economic development (developing
local industry, providing employment, lessening rural-urban inequalities and consequent
migration, etc.), and environmental protection (García, 2011). The empirical findings of this
paper support this theory by showing that coal-abundant provinces tend to approve more coal
power projects when approval authority was decentralized, reflecting the various conflicts in the
incentives facing local government leaders. Effective reconciliation of these conflicting goals
will be a necessary but difficult step on the way toward a more socially efficient energy system.
6. Conclusion
Even as China was aggressively promoting renewable energy in the 2000s, investment in
coal-fired power surged, raising concerns of overcapacity and exacerbating renewable power
21 In 1985, Chinese government allowed the domestic private enterprises and foreign investors to invest in generators sector, and by 1997, the nationwide chronic power shortage had been by and large relieved (Wang & Chen, 2012). In 2002,the Scheme for the Reform of Power Industry, was enacted to dismantle the vertically integrated public utility into multiple generation companies to foster competition and power investments.

21
curtailment. The overall capacity factor of China’s power generation facilities has declined by
almost 30% from 2005 to 2015, and wind and solar curtailments have been rampant across
Chinese provinces. In face of declining operation hours and high renewable curtailments, China
further approved nearly 200 GW of new coal power capacity in 2015, which was almost 1/4 of
total incumbent coal power capacity. At a time when China is trying to limit carbon emissions,
contend with severe air pollution, and adjust to a smaller role of heavy industry, such investment
in coal power could come at a high social cost.
In this paper, we ask why China engaged in such a pronounced investment boom in coal
power in the mid-2010s. The paper contributes to the growing literature on the importance of
incentives in the ongoing reform of China’s energy system. We find the protective rules under
which China’s coal power have historically operated have made excessive investment extremely
likely unless the central government serves as a “gatekeeper” slowing and limiting investment in
the face of incentives for socially excessive entry. When coal-power project approval authority
was decentralized from the central government to local governments at the end of 2014, the gate
was lifted and approval time considerably shortened, reducing the cost of entry for generation
companies. We also show that decentralized approval authority was most likely to be abused by
local governments, given the importance of short-term economic growth in the career
advancement of local officials. Empirically, we find an economically and statistically significant
positive effect of decentralization of approval authority on coal power project approval. The
approval rate of coal power was about 3 times higher when the approval authority was
decentralized. Also, provinces with a larger coal industry were more likely to approve new coal
power investment. We estimate that local coal production accounted for an additional 54GW of
approved coal power in 2015 (other things equal), which is about 1/4 of total approved capacity

22
in that year. These empirical findings are consistent with our economic model and with current
scholarship on China’s political economy.
References
Biggar, D. R., & Hesamzadeh, M. R. (2014). The Economics of Electricity Markets. IEEE Press
and John Wiley & Sons Ltd.
Bird, L., Cochran, J., & Wang, X. (2014). Wind and solar energy curtailment : experience and
practices in the United States. National Renewable Energy Laboratory (NREL), (March),
58.
Davidson, M. (2014). Regulatory and Technical Barriers to Wind Energy Integration in
Northeast China.
Feng, Y., Wang, S., Sha, Y., Ding, Q., Yuan, J., & Guo, X. (2018). Coal power overcapacity in
China: Province-Level estimates and policy implications. Resources, Conservation and
Recycling, 137(May), 89–100. https://doi.org/10.1016/j.resconrec.2018.05.019
García, C. (2011). Grid-connected renewable energy in China: Policies and institutions under
gradualism, developmentalism, and socialism. Energy Policy, 39(12), 8046–8050.
https://doi.org/10.1016/j.enpol.2011.09.059
Guo, G. (2009). China’ s Local Political Budget Cycles. American Journal of Political Science,
53(3), 621–632.
Kahrl, F., & Wang, X. (2014). Integrating Renewable Energy Into Power Systems in China : A
Technical Primer, (December).

23
Kahrl, F., & Wang, X. (2015). Integrating Renewable Energy Into Power Systems in China : A
Technical Primer, (October).
Kahrl, F., Williams, J. H., & Hu, J. (2013). The political economy of electricity dispatch reform
in China. Energy Policy, 53, 361–369. https://doi.org/10.1016/j.enpol.2012.10.062
Lam, L., Branstetter, L., & Azevedo, I. (2016). China ’ s wind electricity and cost of carbon
mitigation are more expensive than anticipated. Environmental Research Letters.
Lam, L., Branstetter, L., & Azevedo, I. M. L. (2017). POLICY BRIEF PB 17-5 Against the
Wind : China ’ s Struggle to Integrate Wind Energy into Its National Grid.
Li, H., & Zhou, L.-A. (2005). Political turnover and economic performance: the incentive role of
personnel control in China. Journal of Public Economics, 89(9–10), 1743–1762.
https://doi.org/10.1016/j.jpubeco.2004.06.009
Ma, J. (2011). On-grid electricity tariffs in China: Development, reform and prospects. Energy
Policy, 39(5), 2633–2645. https://doi.org/10.1016/j.enpol.2011.02.032
Mankiw, N. G., & Whinston, M. D. (1986). Free entry and social inefficiency.pdf. RAND
Journal of Economics, 17(1), 48–58. https://doi.org/10.2307/2555627
Shih, V., Adolph, C., & Liu, M. (2012). Getting Ahead in the Communist Party: Explaining the
Advancement of Central Committee Members in China. American Political Science Review,
106(01), 166–187. https://doi.org/10.1017/S0003055411000566
Szamosszegi, A., & Kyle, C. (2011). An Analysis of State - owned Enterprises and State
Capitalism in China.
Wang, Q., & Chen, X. (2012). China’s electricity market-oriented reform: From an absolute to a

24
relative monopoly. Energy Policy, 51(0), 143–148.
https://doi.org/10.1016/j.enpol.2012.08.039
Wang, Q., Qiu, H. N., & Kuang, Y. (2009). Market-driven energy pricing necessary to ensure
China’s power supply. Energy Policy, 37(7), 2498–2504.
https://doi.org/10.1016/j.enpol.2009.03.008
Yuan, J., Li, P., Wang, Y., Liu, Q., Shen, X., Zhang, K., & Dong, L. (2016). Coal power
overcapacity and investment bubble in China during 2015–2020. Energy Policy, 97, 136–
144. https://doi.org/10.1016/j.enpol.2016.07.009
Zhang, W., & Zhao, Q. (2014). A study on over-investment behavior of state-owned companies
under the intervention of local governments (地方政府干预下国有企业过度投资问题研
究). China Soft Science.
Zhao, X., Wang, F., & Wang, M. (2012). Large-scale utilization of wind power in China:
Obstacles of conflict between market and planning. Energy Policy, 48, 222–232.
https://doi.org/10.1016/j.enpol.2012.05.009
Zhao, X., Zhang, S., Zou, Y., & Yao, J. (2013). To what extent does wind power deployment
affect vested interests? A case study of the Northeast China Grid. Energy Policy, 63, 814–
822. https://doi.org/10.1016/j.enpol.2013.08.092

25
Figure 1. Power Generation Capacity and Annual Operation Hours in China
Sources: National Energy Adminiatration (NEA) of China
0
100
200
300
400
500
600
700
800
900
1000
3000
3500
4000
4500
5000
5500
6000
6500
2005 2006 2007 2008 2009 2010 2011 2012 2013 2014 2015 2016
GW
Hou
rs
Coal Capacity
Connected Wind Capacity
Solar PV Capacity
Average Operation Hours of All Energy Types
Average Operation Hours of Thermal Power

26
Figure 2. Coal Power Capacity Approved in China
Sources: authors’ compilation from government websites, power companies’ websites, and online news sources.22
22 Most records are collected from provincial NDRC websites and news published by http://www.bjx.com.cn
0
10
20
30
40
50
60
2012 Q1
2012 Q2
2012 Q3
2012 Q4
2013 Q1
2013 Q2
2013 Q3
2013 Q4
2014 Q1
2014 Q2
2014 Q3
2014 Q4
2015 Q1
2015 Q2
2015 Q3
2015 Q4
2016 Q1
GW

27
Figure 3. Time from MEP Pre-approval to NDRC Final Approval
Figure 4. Proxy for Administrative Cost of Coal Power Investment
Time from MEP Pre-approval to NDRC Final Approval
Sources: Greenpeace China, authors’ compilation, data sample of Big Five's projects
0
1000
2000
3000
4000
5000
6000
0 5000 10000 15000 20000 25000 30000 35000
Cum
mul
ativ
e Tim
e (D
ays)
Total Investment Size (MW)
Central Approvals Provincial
Approvals
28
Figure 5. Firms’ Optimal Investment Level with Higher Profit Margin
Figure 6. National Average Electricity Wholesale Price and Coal Price, 2014-2015
Source: NDRC, coal price from NDRC Price Monitoring Center, available since 2014
0
0.05
0.1
0.15
0.2
0.25
0.3
0.35
0.4
0.45
0
100
200
300
400
500
600
Jan-14
Mar-14
May-14
Jul-1
4
Sep-14
Nov-14
Jan-15
Mar-15
May-15
Jul-1
5
Sep-15
Nov-15
Elec
trici
ty P
rice
(Yua
n/K
Wh)
Coa
l Pric
e (Y
uan/
ton)
Investment size, 𝑠 𝑠?
Expected marginal profit of investment
𝐶𝐹"/U𝑃" − 𝑐"4(𝑞/)V
𝑠@"
Higher Profit Margin
𝑠A"
𝐹4(𝑠) + 𝑎",? 𝐹4(𝑠) + 𝑎>
Electricity Price
Coal Price

29
Figure 7. Monthly Coal Production and Average Capacity Approved by Province
Notes: monthly coal production and coal power capacity approved by province, before and after decentralization of approval authority in 2014 Sources: monthly coal production data from http://energy.ckcest.cn/home
0
500
1000
1500
2000
2500
0
10
20
30
40
50
60
70
80
90
100B
eijin
gSh
angh
aiTi
anjin
Jilin
Zhej
iang
Yun
nan
Hai
nan
Hei
long
jiang
Sich
uan
Cho
ngqi
ngG
ansu
Qin
ghai
Liao
ning
Gua
ngxi
Hun
anH
ebei
Hen
anJi
angx
iG
uizh
ouG
uang
dong
Hub
eiFu
jian
Jian
gsu
Nin
gxia
Shan
dong
Anh
uiSh
aanx
iIn
ner M
ongo
liaX
injia
ngSh
anxi
MW
Mill
ion
tons
per
mon
th
Coal Production (Policy = 0)Coal Production (Policy = 1)Approvals (Policy = 0)Approvals (Policy = 1)

30
Table 1. Curtailment Rates of Connected Wind and Solar PV Power in Chinese Provinces
Wind Curtailment Solar PV Curtailment Province 2014 2015 2016 2015 2016 Gansu 11% 39% 43% 31% 30.45% Hebei 12% 10% 9%
Heilongjiang 12% 21% 19% Inner Mongolia 9% 18% 21%
Jilin 15% 32% 30% Liaoning 6% 10% 13% Ningxia 0% 13% 13% 9.30% 7.15% Shanxi 0% 2% 9%
Xinjiang 15% 32% 38% 26% 32.23% Yunnan 4% 3% 4%
Sources: National Energy Adminiatration (NEA) of China
Table 2. Generation Capacity and Electricity Demand Growth from 2010 to 2015
Installation Unit 2010 2015 Change Coal Power GW 660 884 224
Hydro Power GW 220 319 99 Wind Power GW 31 128 97 Solar Power GW 0.86 42 41
Natural Gas Power GW 26 66 40 Nuclear Power GW 11 27 16
Total Installed Capacity GW 949 1467 518 (55%)
Total Electricity Consumption Trillion KWh 4.2 5.8 1.60 (38%)
Estimate of Average Operation Hours Hours per year 4425 3954 -471
Sources: National Bureau of Statistics in China, authors’ compilation

31
Table 3. Implementation of Approval Authority Decentralization
Month Capacity Approved by Central Government (%)
Projects Approved by Central Government (%)
2014 Jan - 2014 May 84.2% 82.4% 2014 June - 2014 Oct 84.7% 76.5%
2014 Nov - 2015 March 9.0% 9.2% 2015 Apr - 2015 Aug 0.0% 0.0%
Table 4. Capacity and Projects Approved Before and After Policy Issuance
Period Number of Projects Approved
Total Capacity Approved
Average Capacity Per Project
Before 56 57440 1026 After 253 239696 947 Total 309 297136 962
Table 5. Summary Statistics Variable Name Obs. Mean Std. Dev. Min Max
Monthly Capacity Approved (megawatt) 1,020 298.17 822.24 0 6600
Monthly Capacity Approved Per Capita (watt/person) 1,020 9.76 42.30 0 795.22
Lagged Monthly Moving Averages of Marginal Profit (cents/KWh) 1,020 19.35 4.17 8.36 28.33
Lagged Monthly Moving Averages of Coal Production (million ton) 1,020 10.79 20.13 0 89.74
Lagged Annual Operation Hours 1,020 4.47 0.80 1.88 6.17 Lagged Annual GDP Growth Rate 1,020 8.92 4.03 -0.17 20.18

32
Table 6. The effect of decentralization on capacity approved – linear regression
(1) (2) (3) VARIABLES Capacity Approved Capacity Approved Capacity Approved 1(Policy) 389.4*** 358.2***
(86.02) (100.4) Lagged Marginal Profit 99.90*** 25.41
(26.52) (26.82) Lagged Operational Hours 84.13 142.5 (86.57) (91.78) 1(season 2) 82.53 48.59 64.99 (73.52) (71.43) (71.96) 1(season 3) 133.6 78.26 115.1 (89.66) (84.15) (87.82) 1(season 4) 138.9** 123.7** 115.5*
(63.10) (60.06) (61.19) Provincial Fixed Effects Yes Yes Yes
Observations 1,020 1,020 1,020 R-squared 0.062 0.048 0.064 Number of provinces 30 30 30 Standard errors clustered by province in parentheses *** p<0.01, ** p<0.05, * p<0.1
Notes: Monthly coal power capacity approved by province, June 2013 to March 2016. Regressions include provincial fixed effects. Standard errors are clustered by province. Marginal profits are lagged moving averages of past 12 months for each province (extrapolation method in Appendix Figure A3). Annual operation hours are lagged 1 year for each province.

33
Table 7. The effect of decentralization on capacity approved – negative binomial
(1) (2) (3) VARIABLES Capacity Approved Capacity Approved Capacity Approved 1(Policy) 1.561*** 1.127***
(0.175) (0.271) Lagged Marginal Profit 0.394*** 0.156*
(0.0574) (0.0815) Lagged Operational Hours -0.0724 0.00543 (0.330) (0.336) 1(season 2) 0.250 0.334 0.301 (0.217) (0.228) (0.224) 1(season 3) 0.297 0.208 0.304 (0.215) (0.224) (0.222) 1(season 4) 0.406** 0.530** 0.466**
(0.189) (0.206) (0.207) Provincial Fixed Effects Yes Yes Yes
Observations 952 952 952 Number of provinces 28 28 28 Robust standard errors in parentheses *** p<0.01, ** p<0.05, * p<0.1
Notes: Monthly coal power capacity approved by province, June 2013 to March 2016. Negative binominal regressions include provincial fixed effects of means and variances. 23 Standard errors are heteroskedastic robust. Marginal profits are lagged moving averages of past 12 months for each province (extrapolation method in Appendix Figure A3). Annual operation hours are lagged 1 year for each province.
23 See footnote 18.

34
Table 8. Heterogeneity by provincial coal production – linear regression
(1) (2) (3)
VARIABLES Capacity Approved
Capacity Approved
Capacity Approved
1(Policy) 241.7*** 189.3** 172.1*
(66.25) (90.13) (88.19) Lagged Coal Production 9.365 8.262 5.548
(10.04) (10.47) (9.547) 1(Policy) x Lagged Coal Production 15.07*** 14.95*** 15.48***
(2.621) (2.573) (2.628) Lagged Marginal Profit 22.19 52.96*
(25.00) (27.22) Lagged Operational Hours 43.36 -22.15
(75.70) (90.32) Lagged GDP Growth Rate 28.15**
(12.00) 1(season 2) 80.96 76.42 14.69 (73.61) (74.86) (91.28) 1(season 3) 135.3 128.5 58.77 (89.98) (89.58) (102.1) 1(season 4) 137.5** 132.4** 50.78 (63.12) (63.11) (80.49) Provincial Fixed Effects Yes Yes Yes
Observations 1,020 1,020 1,020 R-squared 0.099 0.100 0.104 Number of provinces 30 30 30 Standard errors clustered by province in parentheses *** p<0.01, ** p<0.05, * p<0.1 Notes: Monthly coal power capacity approved by province, June 2013 to March 2016. Regressions include provincial fixed effects. Standard errors are clustered by province. Coal production and marginal profits are lagged moving averages of past 12 months for each province (extrapolation method for marginal profits is in Appendix Figure A3). Annual operation hours and GDP growth rates are lagged 1 year for each province.

35
Appendix
Figure A1. Declining Coal Prices in China from 2012 Jan to 2016 March
Notes: Coal prices from January 2014 to 2016 March are released by NDRC Price Monitoring Center. They are normalized prices to represent coals of 5,000 kcal (calorific value) in each province. Hence, we call them “normed coal prices” in this study. The monitoring area covers 30 provinces (except Tibet). The prices are sampled from the province's main coal Power generation enterprises, main coal production enterprises, main coal transport ports and coal traders, including more than 1,600 enterprises. Prices before 2014 are imputed using monthly coal prices published by Shanghai Coal Trading Center. Provincial variances are introduced from NDRC’s monitored prices in 2014.
0
100
200
300
400
500
600
700
800
900
Beijing Tianjin Hebei Shanxi InnerMongolia
Liaoning Jilin Heilongjiang Shanghai Jiangsu
Zhejiang Anhui Fujian Jiangxi Shandong
Henan Hubei Hunan Guangdong Guangxi
Hainan Chongqing Sichuan Guizhou Yunnan
Shaanxi Gansu Qinghai Ningxia Xinjiang

36
Figure A2. Wholesale Electricity Prices of Coal Power Generation, 2012 January to 2016 March
Sources: NDRC, figure shows the benchmark prices for desulfurized coal-power electricity. By end of 2014, 91.4% of coal power generation units have gas desulfurized.
0.20
0.25
0.30
0.35
0.40
0.45
0.50
0.55
Beijing Tianjin Hebei Shanxi InnerMongolia
Liaoning Jilin Heilongjiang Shanghai Jiangsu
Zhejiang Anhui Fujian Jiangxi Shandong
Henan Hubei Hunan Guangdong Guangxi
Hainan Chongqing Sichuan Guizhou Yunnan
Shaanxi Gansu Qinghai Ningxia Xinjiang

37
Figure A3. Average Marginal Profits of Coal Power Generation, 2012 January to 2016 March
Notes: Marginal Profit is calculated as 𝑂𝑛𝑔𝑟𝑖𝑑 𝑃𝑟𝑖𝑐𝑒−𝑁𝑜𝑟𝑚𝑒𝑑 𝐶𝑜𝑎𝑙 𝑃𝑟𝑖𝑐𝑒∗𝑁𝑜𝑟𝑚𝑒𝑑 𝐶𝑜𝑎l 𝐶𝑜𝑛𝑠𝑢𝑚𝑝𝑡𝑖𝑜𝑛 𝑅𝑎𝑡𝑒, where normed coal consumption rates (5,000 kcal coal) are converted from provincial “standard coal consumption rates (7,000kcal coal)” published in China Electric Power Annual Development Reports.
0
0.05
0.1
0.15
0.2
0.25
0.3
0.35
2012/1
2012/3
2012/5
2012/7
2012/9
2012/11
2013/1
2013/3
2013/5
2013/7
2013/9
2013/11
2014
/1
2014
/3
2014
/5
2014
/7
2014
/9
2014/11
2015
/1
2015
/3
2015
/5
2015
/7
2015
/9
2015
/11
2016
/1
2016
/3
Yuan/KWh
Anhui Beijing Chongqing Fujian
Guangdong Guangxi Hebei Heilongjiang
Hunan InnerMongolia Jiangsu Jilin
Shandong Sichuan Yunnan Zhejiang