why, how, who - האיגוד הישראלי לסטטיסטיקה · Ö 35.510.5 5.5 8 y x x xx 28...
TRANSCRIPT
Quality by Design (QbD) and the
Design of Experiments (DoE):
Why, How, Who
Prof Ron Kenett

Agenda
• Background
• Introduction to QbD – Why
• Introduction to DoE – How
• Case studies - Who
2 © 2013 KPA Ltd., All rights reserved

3
http://apps.pharmacy.wisc.edu/esp/prog/IsraelQBD
http://ce.pharmacy.wisc.edu/courseinfo/archive/2012Israel
© 2013 KPA Ltd., All rights reserved

4 © 2013 KPA Ltd., All rights reserved
1998
2000
2004
2007
2012
1998
Modern Industrial Statistics with R,
MINITAB and JMP, Wiley, 2013
Part IV: Design and Analysis of Experiments
11. Classical Design and Analysis of Experiments
12. Quality by Design
13. Computer Experiments

Agenda
• Background
• Introduction to QbD – Why
• Introduction to DoE – How
• Case studies - Who
5 © 2013 KPA Ltd., All rights reserved

6 © 2013 KPA Ltd., All rights reserved
2004

Food and Drug Administration, Challenge
and opportunity on the critical path to new
medical products, March 2004.
© 2013 KPA Ltd., All rights reserved 7

8
Quality
by
Design
Process
Understanding
Product
Understanding Design
Space
Quality by Design (QbD)
Control
Strategy
Moheb Nasr, Pharmaceutical Quality for the 21st
Century, 2nd QbD Conference; Jerusalem, 5-6 May 2010
Target
Product
Profile

9
Quality by Design - A 4 Stage Process
Control
Verification
Control
Definition
Design
Selection
Design
Intent
The Active Pharmaceutical Ingredient chemical and physical
characteristics and Drug Product performance targets are
identified for the commercial product.
The API manufacturing process and the DP formulation and
manufacturing process are selected to achieve the Design
Intent for the commercial product.
The largest contributors to Critical Quality Attributes
variability are established and controls defined to ensure
process performance expectations are met.
The performance of the API and DP processes in
manufacturing are measured to verify that the controls are
effective and the product performance acceptable.
© 2013 KPA Ltd., All rights reserved

10
Control
Verification
Control
Definition
Design
Selection
Design
Intent Process Understanding
ie how the inputs effect
the outputs
Risk Evaluation
(FMEA)
Control Actions
Analytical Monitoring Strategy
Experiments Desired
Outputs
(Drug Product CQAs)
and
Inputs
(Process Parameters
and Material Attributes)
Measure Performance
Analysis
© 2013 KPA Ltd., All rights reserved

11
Quality by Design
Process Control Verification
Process Control Definition
(Control Strategy)
Process Design Selection
Quality by Design
for the Process and Product
Process Design Intent
Method Control Strategy
Method Control Definition
(Risk Assessment & Design Space Definition)
Method Design Selection
(Method/Technology Development)
Method Design Intent (Method Performance Requirements)
Quality by Design
for Analytical Methods
© 2013 KPA Ltd., All rights reserved
Quality by Design
for Clinical Investigations
Quality by Design
for Clinical Practice

Design Space
• Multidimensional combinations of the product characteristics
• Interactions of inputs variables
• Interactions of process parameters
• Changes within the design space are not considered a regulatory change
• QbD information and conclusions need to be shared with the FDA – Do and Tell
© 2013 KPA Ltd., All rights reserved 12
13
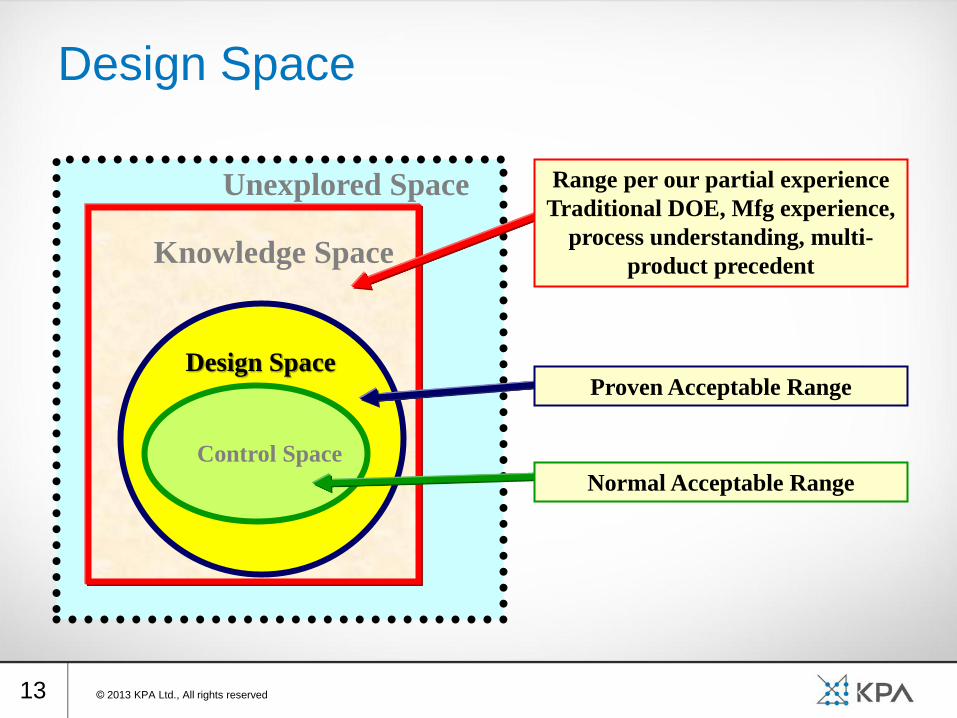
Design Space
Unexplored Space
Knowledge Space
Control Space
Design Space
Normal Acceptable Range
Proven Acceptable Range
Range per our partial experience
Traditional DOE, Mfg experience,
process understanding, multi-
product precedent
© 2013 KPA Ltd., All rights reserved
Agenda
• Background
• Introduction to QbD – Why
• Introduction to DoE – How
• Case studies - Who
14 © 2013 KPA Ltd., All rights reserved
15
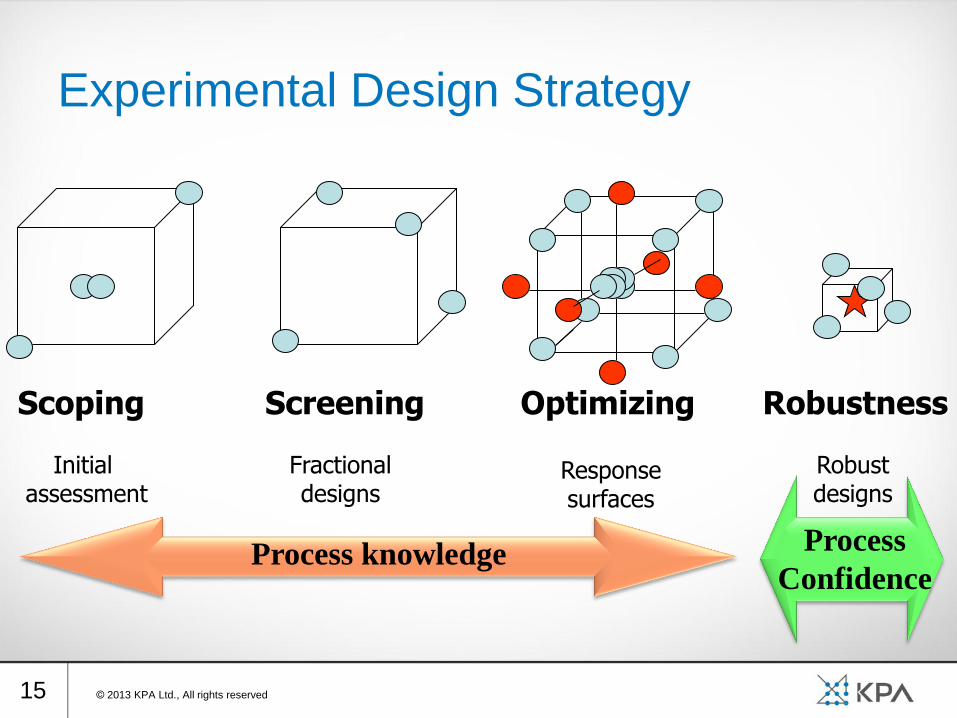
Scoping Screening Optimizing
Initial assessment
Fractional designs
Response surfaces
Robustness
Robust designs
Process knowledge Process
Confidence
Experimental Design Strategy
© 2013 KPA Ltd., All rights reserved

16
A Serious Problem... I want my car to go
fast … like that one!
© 2013 KPA Ltd., All rights reserved

17
What Factors Affect the Speed?
Yes
Air Holes
No
Slow
Fast
Shape
© 2013 KPA Ltd., All rights reserved

18
Yes
Air Holes
No
Slow
Fast Slow
Shape
Effect of Air Holes
© 2013 KPA Ltd., All rights reserved

19
Yes
Air Holes
No
Slow
Fast Slow
Shape
Effect of Air Shape
Slow
© 2013 KPA Ltd., All rights reserved
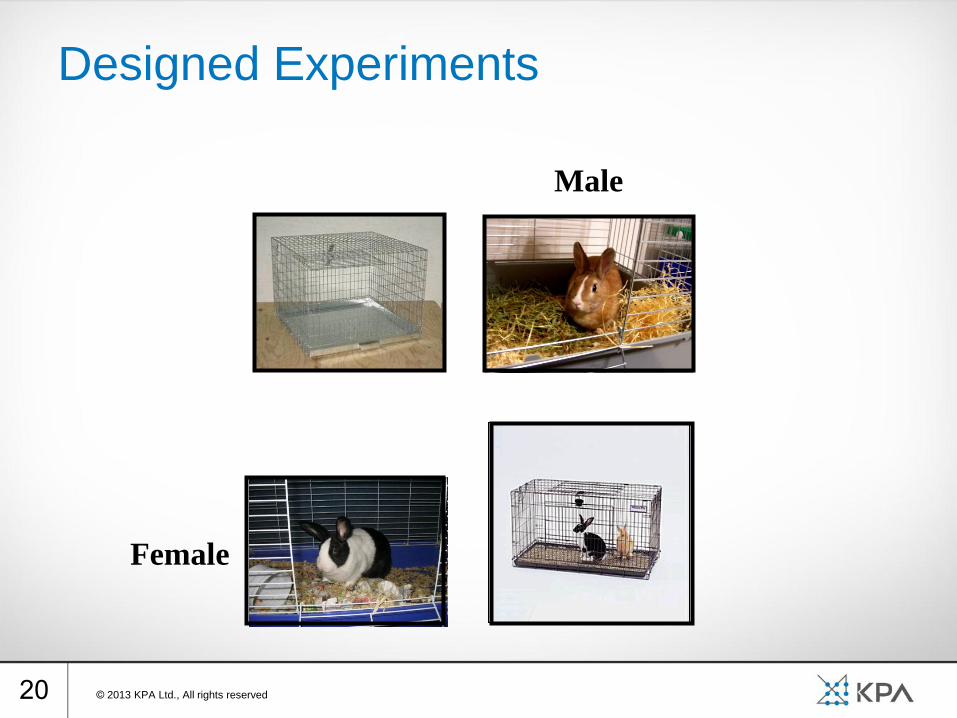
Designed Experiments
Male
Female
© 2013 KPA Ltd., All rights reserved 20

Designed Experiments
Inte
racti
on
© 2013 KPA Ltd., All rights reserved 21

22
Experiment #1: Study Effects of Reaction Time on Yield
(Reaction Temperature held fixed at 225o C)
OFAT
One Factor at a Time
© 2013 KPA Ltd., All rights reserved

23
Experiment #2: Study Effects of Reaction Temperature on Yield
(Reaction Time held fixed at 130 minutes)
OFAT
One Factor at a Time
© 2013 KPA Ltd., All rights reserved

24 DOE
One Factor at a Time
© 2013 KPA Ltd., All rights reserved
T=130 m, T = 225 C

25
One Factor at a Time
© 2013 KPA Ltd., All rights reserved

26
DoE
Reaching the top
© 2013 KPA Ltd., All rights reserved

27
Regression Model and the associated
Response Surface
© 2013 KPA Ltd., All rights reserved
1 2
1 2
ˆ 35.5 10.5 5.5
8
y x x
x x

28
The Effect of Interaction on the
Response Surface
© 2013 KPA Ltd., All rights reserved
1 2
1 2
ˆ 35.5 10.5 5.5
8
y x x
x x
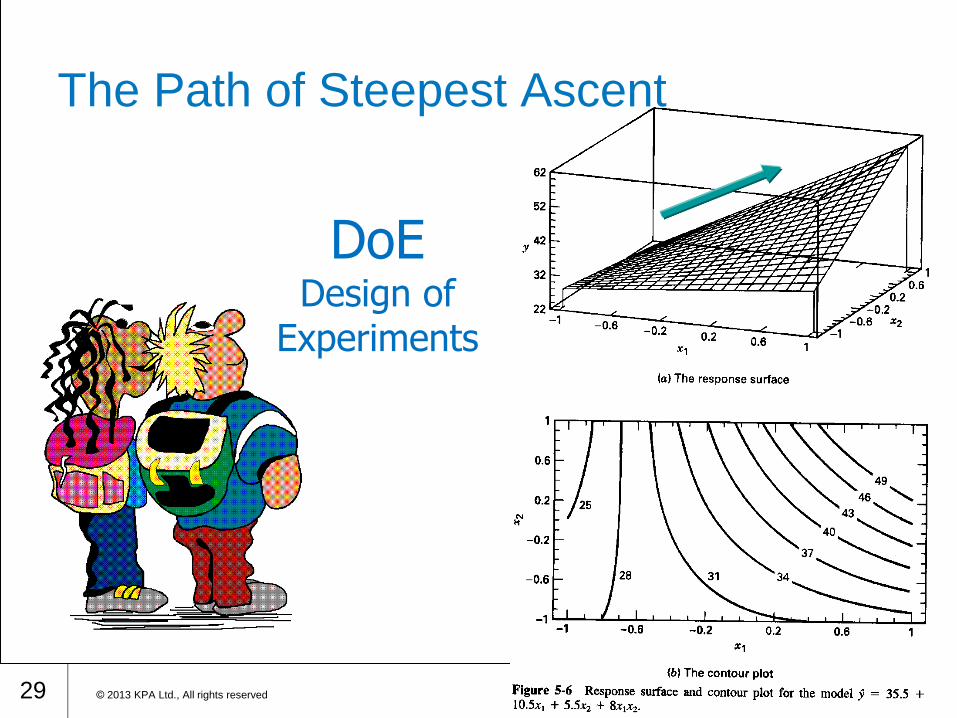
29 © 2013 KPA Ltd., All rights reserved
DoE Design of
Experiments
The Path of Steepest Ascent

?עיה הנחקרת במה ה
Response ?שתנה הכמותי המאפיין את הבעיה הנחקרת ממה ה
Factors ?ורמים הניתנים לשינוי במסגרת הניסוי גמהם ה
Levels ?מות הגורמים המשתתפים בניסוי רמהן
Experimental Array ?רופים הקובעים את מערך הניסוי צמהם ה
Replicates ?ספר החזרות שיתבצעו בכל נקודת ניסוי ממה
Order ?דר או פרוטוקול הניסוי סמהו
?יטות איסוף וניתוח הנתונים מהניסוי שמהי
ב מ ג ר צ מ ס ש
A DoE Checklist
© 2013 KPA Ltd., All rights reserved 30

31
Factors and Levels
Cooling time
(min)
Emulsion
creation time
(min)
Temperature
(°C) Formulation
30 2 60 D078
105 3.5 67.5 D081
180 2 75 D082
30 5 75 D077
180 5 60 D080
180 2 60 D079
30 2 75 D075
105 3.5 67.5 D084
180 5 75 D083
30 5 60 D076
© 2013 KPA Ltd., All rights reserved
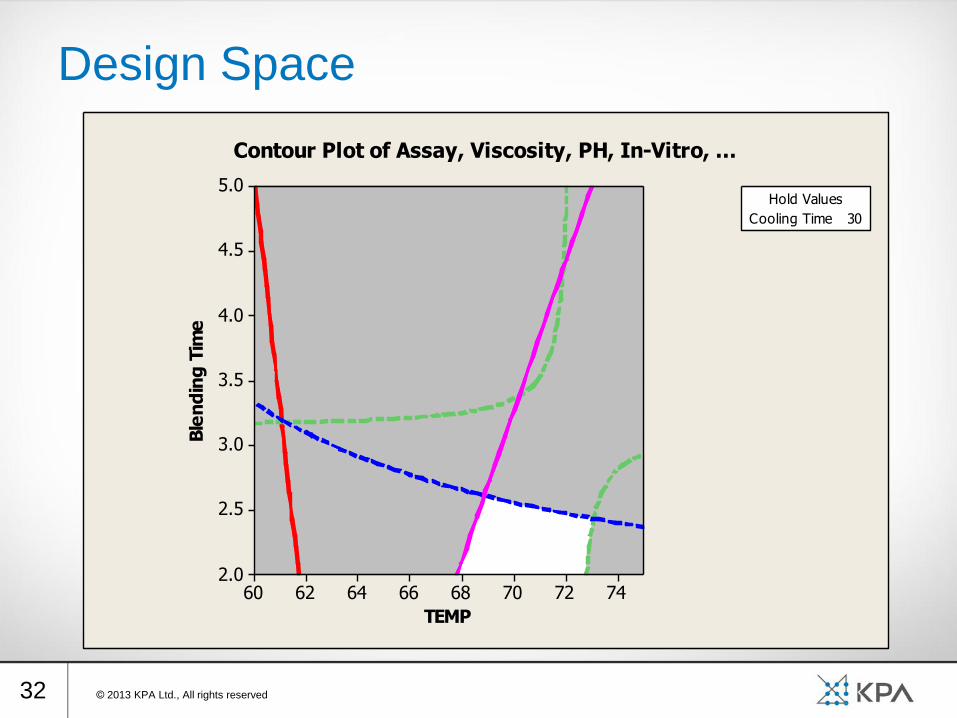
32
Design Space
TEMP
Ble
nd
ing
Tim
e
7472706866646260
5.0
4.5
4.0
3.5
3.0
2.5
2.0
Cooling Time 30
Hold Values
Contour Plot of Assay, Viscosity, PH, In-Vitro, ...
© 2013 KPA Ltd., All rights reserved

Agenda
• Background
• Introduction to QbD – Why
• Introduction to DoE – How
• Case studies - Who
33 © 2013 KPA Ltd., All rights reserved
ACE
Foam
HPLC
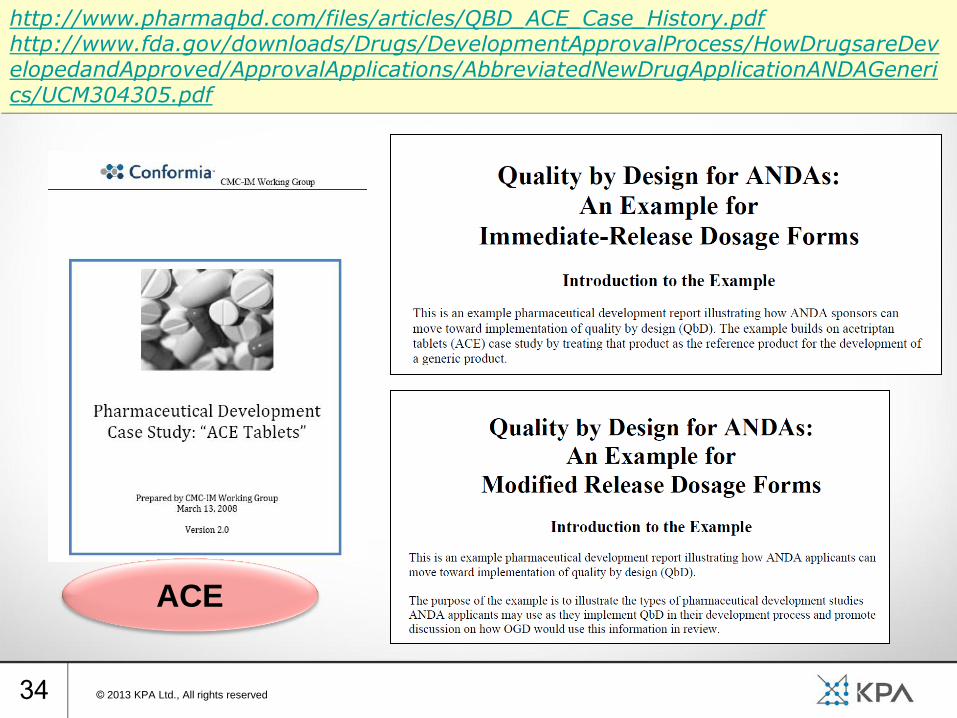
http://www.pharmaqbd.com/files/articles/QBD_ACE_Case_History.pdf http://www.fda.gov/downloads/Drugs/DevelopmentApprovalProcess/HowDrugsareDevelopedandApproved/ApprovalApplications/AbbreviatedNewDrugApplicationANDAGenerics/UCM304305.pdf
© 2013 KPA Ltd., All rights reserved 34
ACE

35
Target Product Profile of ACE
© 2013 KPA Ltd., All rights reserved
ACE

36
Responses:
• Tablet hardness
• Dissolution average at 30 min.
• Tablet weight uniformity
Factors:
• Acetriptan particle size D90: 10, 25 & 40 μm
• Lubricant (Magnesium Stearate) level: 1, 1.5 & 2%
DOE Study – API and Magnesium stearate
(Lubricant) Interaction Study
© 2013 KPA Ltd., All rights reserved
ACE

37
Contour Plot of Dissolution at a Set Target
Tablet Hardness of 12kP
(Dissolution Acceptance Criteria > 80%(
© 2013 KPA Ltd., All rights reserved
ACE

38
Summary – Formulation Components Studies
© 2013 KPA Ltd., All rights reserved
ACE

Manufacturing Process Development
© 2013 KPA Ltd., All rights reserved 39

Variables and unit Operations
CQA’s Formulation
Composition
Blending I Roller
Compression
Milling Lubrication Compression
Appearance Low Low Low Low High High
Identity Low Low Low Low Low Low
Assay Low Low Low Low Low High
Impurities High Low Low Low Low Low
Content
Uniformity
High High High High Low High
Dissolution High Low High High High High
Risk Assessment – Unit Operations
© 2013 KPA Ltd., All rights reserved 40
ACE
41
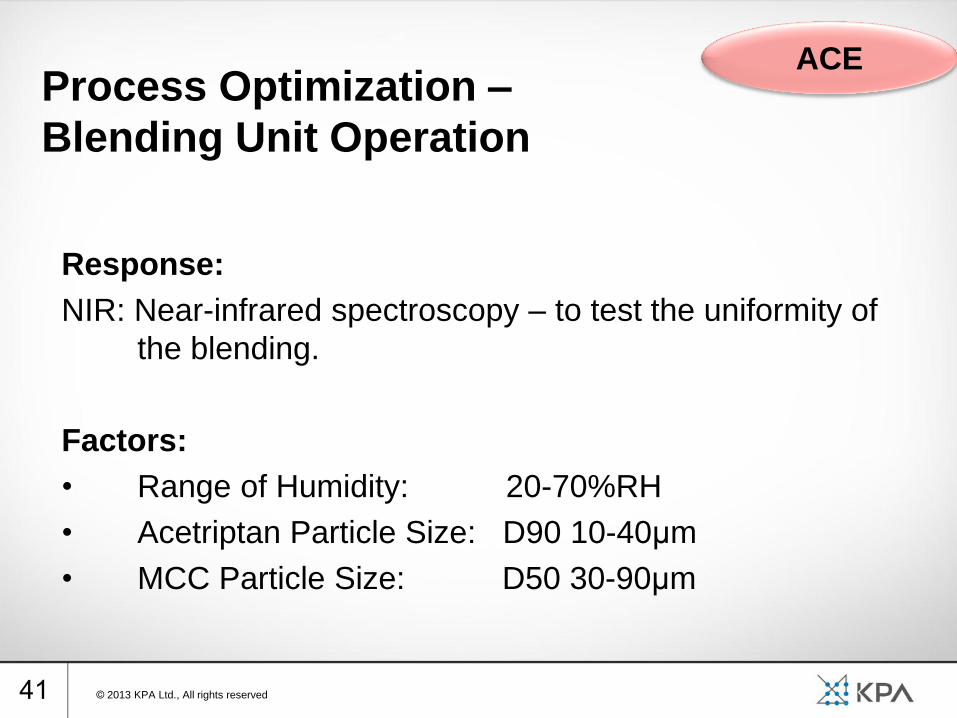
Response:
NIR: Near-infrared spectroscopy – to test the uniformity of
the blending.
Factors:
• Range of Humidity: 20-70%RH
• Acetriptan Particle Size: D90 10-40μm
• MCC Particle Size: D50 30-90μm
Process Optimization –
Blending Unit Operation
© 2013 KPA Ltd., All rights reserved
ACE

42
NIR For the DOE Study
© 2013 KPA Ltd., All rights reserved
ACE

Variables and unit Operations
CQA’s Roller Compression Milling
Appearance Low Low
Identity Low Low
Assay Low Low
Impurities Low Low
Content
Uniformity High High
Dissolution High High
Process Optimization –
Roller Compaction and Milling
© 2013 KPA Ltd., All rights reserved 43
ACE

44
Final Product Attributes:
• Tablet Weight
• Tablet Hardness
• Tablet Friability
• Tablet Disintegration Time
Responses
© 2013 KPA Ltd., All rights reserved
ACE Process Optimization –
Roller Compaction and Milling

45
Factors Investigated Ingredients:
1. Acetriptan Particle Size (10 and 40μm)
2. Magnesium Stearate Level (1.25 and 2.25% w/w)
3. Croscarmellose Sodium Level (3 and 4% w/w)
Process:
1. Roller Pressure (50 and 150 bar)
2. Mill Screen Size (0.039 and 0.062 inches)
3. Mill Speed (600 and 1200 rpm)
© 2013 KPA Ltd., All rights reserved
ACE Process Optimization –
Roller Compaction and Milling
46
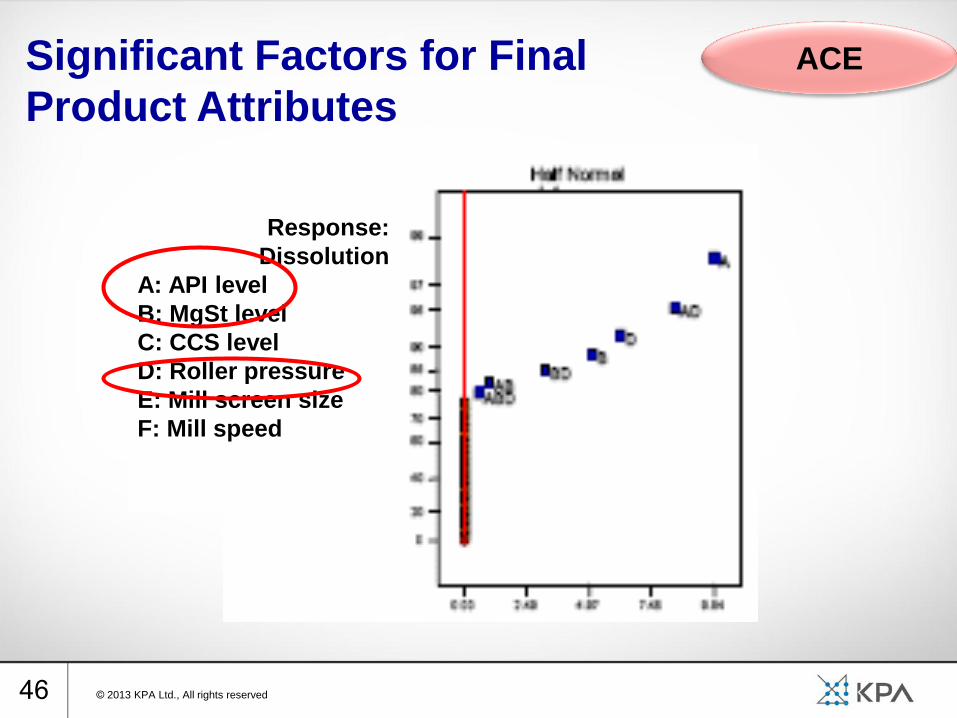
Significant Factors for Final
Product Attributes
Response:
Dissolution
A: API level
B: MgSt level
C: CCS level
D: Roller pressure
E: Mill screen size
F: Mill speed
© 2013 KPA Ltd., All rights reserved
ACE

47
Factors:
• Acetriptan PS: d90 10-40μm
• Magnesium stearate level: 1-2% intragranular
• Roller Pressure: 50-150 bar
DOE 2 - Roller Compaction
© 2013 KPA Ltd., All rights reserved
ACE

48
Roller Pressure
API PS
10.00
17.50
25.00
32.50
40.00
50.00 75.00 100.00 125.00 150.00
90.53
101.58
Contour Plot For API particle size and Roller
Pressure vs. Tablet Dissolution (at 1% Mg. St.
Level)
© 2013 KPA Ltd., All rights reserved
ACE

49
Design Space for ACE tablets
© 2013 KPA Ltd., All rights reserved
ACE
An Oily Foam Drug Product Example
The goal is to design a process suitable for
routine commercial manufacturing that
consistently delivers a product that meets
its quality attributes.
© 2013 KPA Ltd., All rights reserved 50
Foam
51
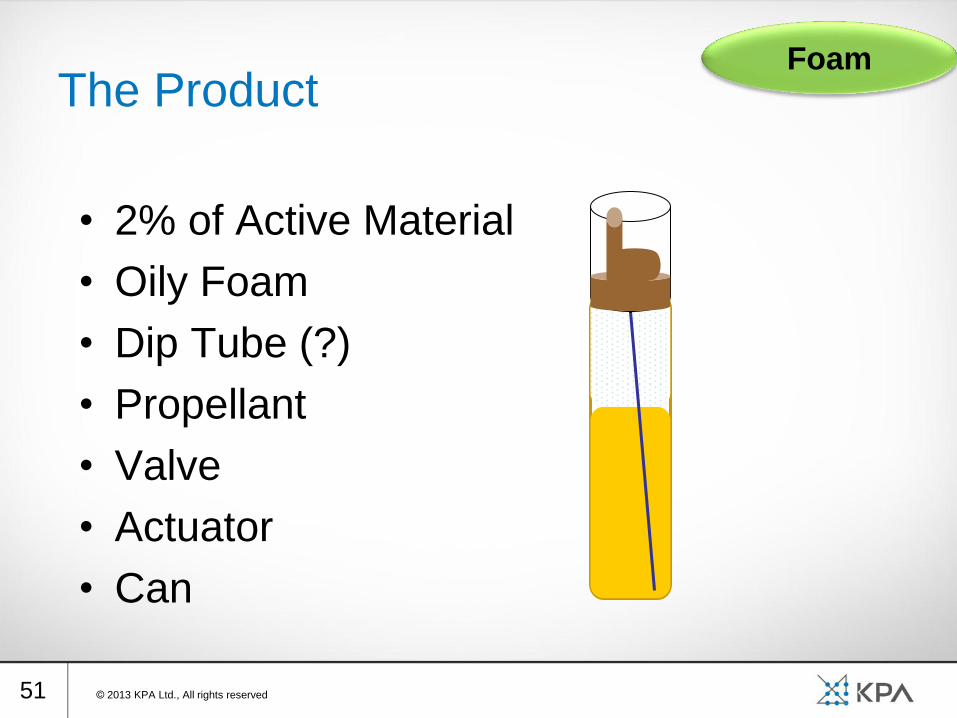
The Product
• 2% of Active Material
• Oily Foam
• Dip Tube (?)
• Propellant
• Valve
• Actuator
• Can
© 2013 KPA Ltd., All rights reserved
Foam

Target Product Profile
Quality Attribute Target at time 0 Target at
end of shelf life Criticality
Dosage form Foam Foam NA
Potency 2% 2% NA
Appearance White foam White foam Critical
Assay 95-105% 90-110% Critical
Impurities Not More Than… As per USP 33 monograph Critical
Water NMT - Critical
Safety NLT other products in
the market
NLT other products in
the market Critical
Microbiology Meets USP criteria Meets USP criteria Critical
Delivery amount Meets USP criteria Meets USP criteria Critical
Shelf Life NLT 24 months NLT 24 months Critical
© 2013 KPA Ltd., All rights reserved 52
Foam

Prior Knowledge
• API is sensitive to extensive heat. (24 hr. at 800C are
equivalent to 1 month at 400C.)
• API is sensitive to water.
• Manufacturing and Packaging Processes includes heating.
• Manufacturing Process: API is exposed to 600C.
• Packaging Process: Above 550C.
• Bulk should be visually clear.
© 2013 KPA Ltd., All rights reserved 53
Foam

Questions that are looking for answers:
Manufacturing:
1. Specify manufacturing equipment
2. Filtering the bulk; is it essential?
3. Is there a need to cool down the bulk in the storage container?
Packaging:
1) Immediate filling vs. bulk reheating for packaging, any differences?
2) Epoxy containers vs. PAM containers, any differences?
3) Propellant type and concentration – Determine levels
4) Dip tube – Can we use them?
5) Determine the limits of filling specification for the bulk and propellant.
6) Leakage tests – Do we pass them?
7) Vacuum effect: Design on target formulation
© 2013 KPA Ltd., All rights reserved 54
Foam

55
Manufacturing and Packaging Process
Inactive ingredients
Cooling to
60°C
Dissolution of active
ingredient, for 30
minutes at 60°C
Packaging at minimum
temperature of 55°C
Heating to
80°C
Active ingredient
© 2013 KPA Ltd., All rights reserved
Foam

56
1. What is the preferable packaging temperature?
6858
50.5
50.0
49.5
49.0
48.5
48.0
47.5
47.0
bulk tempD
elive
rab
le A
mo
un
t (g
ram
)
50
Deliverable amount vs. Bulk TemperatureData Means
Aerosol Performance
Deliverable Amount:
© 2013 KPA Ltd., All rights reserved
Foam
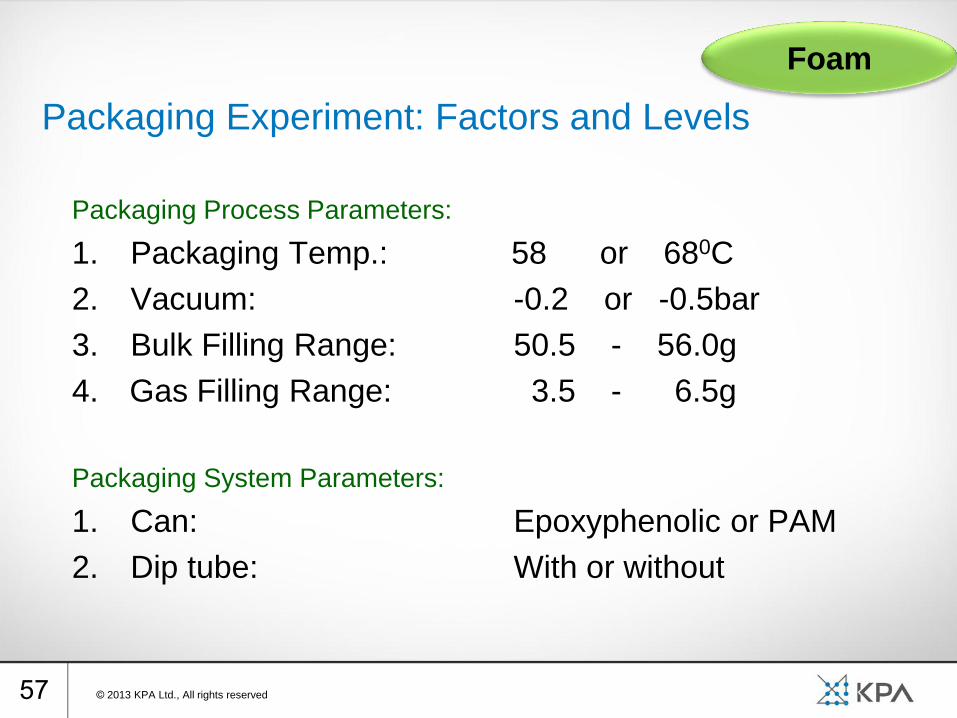
Packaging Experiment: Factors and Levels
Packaging Process Parameters:
1. Packaging Temp.: 58 or 680C
2. Vacuum: -0.2 or -0.5bar
3. Bulk Filling Range: 50.5 - 56.0g
4. Gas Filling Range: 3.5 - 6.5g
Packaging System Parameters:
1. Can: Epoxyphenolic or PAM
2. Dip tube: With or without
© 2013 KPA Ltd., All rights reserved 57
Foam

58
2. What is the effect of the factors on pressure?
4.0
3.5
3.0
2.5
2.0
1.5
1.0
58
Pre
ssu
re
68
Boxplot of Pressure
Panel variable: bulk temp
When packaging at 580C the
pressure variability between
different cans is higher
54
2.7
2.6
2.5
-0.2-0.5
6858
2.7
2.6
2.5
Gas amount
Me
an
vacuum
bulk temp
Main Effects Plot for PressureData Means
© 2013 KPA Ltd., All rights reserved
Foam

59
3. What is the preferable gas filling range?
6.56.05.55.04.5
51.5
51.0
50.5
50.0
49.5
49.0
Gas amount
Me
an
50
Main Effects Plot for Deliverable amountData Means
Appearance:
Deliverable Amount:
5.0-6.5g
X √
© 2013 KPA Ltd., All rights reserved
Foam

60
Packaging Ranges and Design Space
Approved Range/ Design Space Parameter
65-700C Packaging Temperature
Immediate/ Reheating Immediate/ Reheating for
packaging
5.0g-6.5g Gas Filling Range
51.0-54.0g Bulk Filling Range
Better without dip-tube Dip Tube
© 2013 KPA Ltd., All rights reserved
Foam
61
DryLab simplifies and speeds the
process of developing good
chromatographic separations or
methods by allowing to model
changes in separation conditions
using a personal computer.
Analytic Methods Development
© 2013 KPA Ltd., All rights reserved
HPLC

62
4,87
8,13
11,66 12,03
16,91, Propionate de fluticasone
28,64
0 5 10 15 20 25 30 35 40
Retention Time (min)
-0,010
-0,005
0,000
0,005
0,010
0,015
0,020
0,025
0,030
Intensity (AU)
Chromatogram with true signal at 4.9 min.
© 2013 KPA Ltd., All rights reserved
HPLC
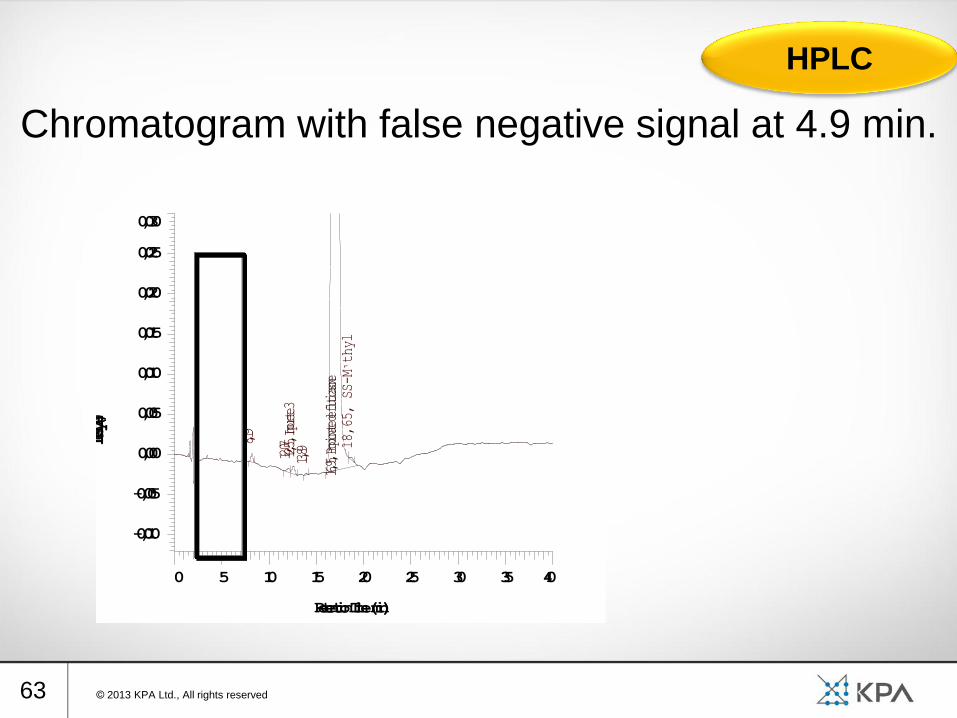
63
8,19
12,0712,55, Impurete 3
13,89
16,95, Propionate de fluticasone
18,65, SS-Mיthyl
0 5 10 15 20 25 30 35 40
Retention Time (min)
-0,010
-0,005
0,000
0,005
0,010
0,015
0,020
0,025
0,030
Intensity (AU)
Chromatogram with false negative signal at 4.9 min.
© 2013 KPA Ltd., All rights reserved
HPLC

64
Minutes
0 10 20 30 40 50 60
mA
U
0
5
10
mA
U
0
5
10
8.0
35
10.4
70
17.4
65
PDA-246nmT=0 Specificity solution ( 3IMQMN0E002 +~0.15% of impurities)04A04.dat
Retention Time
Typical
chromatogram of
related
substances.
Minutes
0 10 20 30 40 50 60
mA
U
0
5
10
mA
U
0
5
10
7.0
02
9.3
50
11.0
08
14.9
08
UV1000-246nmSystem specificity (3IMQMN0E002+~0.15%imp's)
Retention Time
Chromatogram of
related substances
with False-positive
Signal (peak at 11
min).
Chromatogram with false positive
signal at 11 min.
© 2013 KPA Ltd., All rights reserved
HPLC

65
Simulated Chromatograms
© 2013 KPA Ltd., All rights reserved
HPLC

66
Development of
Analytical Methods
T[°C] DEA[ml] n-
Hexane/EtOH
[v/v]
Run
Order
15°C 2ml 4 1
15°C 0.5ml 5.7 2
40°C 2ml 5.7 3
40°C 0.5ml 4 4
Bates, R., Kenett R., Steinberg D.
and Wynn, H. (2004), Robust Design
using Computer Experiments, The
13-th Conference on Mathematics for
Industry 21-25 June 2004 Eindhoven,
The Netherlands.
© 2013 KPA Ltd., All rights reserved
HPLC

67
min0 5 10 15 20 25 30 35
Norm.
0
500
1000
1500
2000
2500
VWD1 A, Wav elength=262 nm (040413-1\004-0401.D)
12.6
83
16.8
92
min0 5 10 15 20 25 30 35 40 45
Norm.
0
500
1000
1500
2000
2500
VWD1 A, Wav elength=262 nm (040413-1\004-0801.D)
19.1
12
26.1
21
min0 5 10 15 20 25 30
Norm.
0
500
1000
1500
2000
2500
VWD1 A, Wav elength=262 nm (040414-1\004-0401.D)
15.3
47
20.9
63
min0 5 10 15 20 25 30 35
Norm.
0
500
1000
1500
2000
2500
VWD1 A, Wav elength=262 nm (040414-2\004-0401.D)
10.4
34
13.8
03
1
2
3
4
T[°C] DEA[ml] n-
Hexane/EtOH
[v/v]
Run
Order
15°C 2ml 4 1
15°C 0.5ml 5.7 2
40°C 2ml 5.7 3
40°C 0.5ml 4 4
Bates, R., Kenett R., Steinberg D.
and Wynn, H. (2004), Robust Design
using Computer Experiments, The
13-th Conference on Mathematics for
Industry 21-25 June 2004 Eindhoven,
The Netherlands.
Development of
Analytical Methods
© 2013 KPA Ltd., All rights reserved
HPLC

68
Resolution RT[min]
Isomer #2
RT[min]
Isomer #1
T[°C] Mobile Phase #
3.56 RT =16.892
Tailing=2.8
Plates=2758
RT =12.683
Tailing=3.0
Plates=2239
15° C
800ml n-Hexane
200ml EtOH
2ml
Diethylamine(DEA)
1
4.48 RT =26.122
Tailing=3.3
Plates=3709
RT =19.113
Tailing=3.6
Plates=2938
15° C
850ml n-Hexane
150ml EtOH
0.5ml
Diethylamine(DEA)
2
4.40
RT =20.963
Tailing=3.4
Plates=3576
RT =15.347
Tailing=3.0
Plates=2867
40°C
850ml n-Hexane
150ml EtOH
2ml
Diethylamine(DEA)
3
1.32 RT =13.803
Tailing=3.7
Plates=2459
RT =10.434
Tailing=3.3
Plates=2236
40°C
800ml n-Hexane
200ml EtOH
0.5ml
Diethylamine(DEA)
4
Simulation Experiments Analysis
© 2013 KPA Ltd., All rights reserved
HPLC

69 © 2013 KPA Ltd., All rights reserved
HPLC
Simulation Experiments Analysis

ב מ ג ר צ מ ס ש