“why should i trust you?” explaining the predictions ... · pdf file“why...
TRANSCRIPT
“Why Should I Trust You?”Explaining the Predictions of Any Classifier
Marco Tulio RibeiroUniversity of WashingtonSeattle, WA 98105, [email protected]
Sameer SinghUniversity of WashingtonSeattle, WA 98105, [email protected]
Carlos GuestrinUniversity of WashingtonSeattle, WA 98105, [email protected]
ABSTRACTDespite widespread adoption, machine learning models re-main mostly black boxes. Understanding the reasons behindpredictions is, however, quite important in assessing trust,which is fundamental if one plans to take action based on aprediction, or when choosing whether to deploy a new model.Such understanding also provides insights into the model,which can be used to transform an untrustworthy model orprediction into a trustworthy one.
In this work, we propose LIME, a novel explanation tech-nique that explains the predictions of any classifier in an in-terpretable and faithful manner, by learning an interpretablemodel locally around the prediction. We also propose amethod to explain models by presenting representative indi-vidual predictions and their explanations in a non-redundantway, framing the task as a submodular optimization prob-lem. We demonstrate the flexibility of these methods byexplaining different models for text (e.g. random forests)and image classification (e.g. neural networks). We show theutility of explanations via novel experiments, both simulatedand with human subjects, on various scenarios that requiretrust: deciding if one should trust a prediction, choosingbetween models, improving an untrustworthy classifier, andidentifying why a classifier should not be trusted.
1. INTRODUCTIONMachine learning is at the core of many recent advances inscience and technology. Unfortunately, the important roleof humans is an oft-overlooked aspect in the field. Whetherhumans are directly using machine learning classifiers as tools,or are deploying models within other products, a vital concernremains: if the users do not trust a model or a prediction,they will not use it. It is important to differentiate betweentwo different (but related) definitions of trust: (1) trusting aprediction, i.e. whether a user trusts an individual predictionsufficiently to take some action based on it, and (2) trustinga model, i.e. whether the user trusts a model to behave inreasonable ways if deployed. Both are directly impacted by
Permission to make digital or hard copies of all or part of this work for personal orclassroom use is granted without fee provided that copies are not made or distributedfor profit or commercial advantage and that copies bear this notice and the full citationon the first page. Copyrights for components of this work owned by others than theauthor(s) must be honored. Abstracting with credit is permitted. To copy otherwise, orrepublish, to post on servers or to redistribute to lists, requires prior specific permissionand/or a fee. Request permissions from [email protected].
KDD 2016 San Francisco, CA, USAc© 2016 Copyright held by the owner/author(s). Publication rights licensed to ACM.
ISBN 978-1-4503-4232-2/16/08. . . $15.00
DOI: http://dx.doi.org/10.1145/2939672.2939778
how much the human understands a model’s behaviour, asopposed to seeing it as a black box.
Determining trust in individual predictions is an importantproblem when the model is used for decision making. Whenusing machine learning for medical diagnosis [6] or terrorismdetection, for example, predictions cannot be acted upon onblind faith, as the consequences may be catastrophic.
Apart from trusting individual predictions, there is also aneed to evaluate the model as a whole before deploying it “inthe wild”. To make this decision, users need to be confidentthat the model will perform well on real-world data, accordingto the metrics of interest. Currently, models are evaluatedusing accuracy metrics on an available validation dataset.However, real-world data is often significantly different, andfurther, the evaluation metric may not be indicative of theproduct’s goal. Inspecting individual predictions and theirexplanations is a worthwhile solution, in addition to suchmetrics. In this case, it is important to aid users by suggestingwhich instances to inspect, especially for large datasets.
In this paper, we propose providing explanations for indi-vidual predictions as a solution to the “trusting a prediction”problem, and selecting multiple such predictions (and expla-nations) as a solution to the “trusting the model” problem.Our main contributions are summarized as follows.
• LIME, an algorithm that can explain the predictions of anyclassifier or regressor in a faithful way, by approximatingit locally with an interpretable model.
• SP-LIME, a method that selects a set of representativeinstances with explanations to address the “trusting themodel” problem, via submodular optimization.
• Comprehensive evaluation with simulated and human sub-jects, where we measure the impact of explanations ontrust and associated tasks. In our experiments, non-expertsusing LIME are able to pick which classifier from a pairgeneralizes better in the real world. Further, they are ableto greatly improve an untrustworthy classifier trained on20 newsgroups, by doing feature engineering using LIME.We also show how understanding the predictions of a neu-ral network on images helps practitioners know when andwhy they should not trust a model.
2. THE CASE FOR EXPLANATIONSBy“explaining a prediction”, we mean presenting textual or
visual artifacts that provide qualitative understanding of therelationship between the instance’s components (e.g. wordsin text, patches in an image) and the model’s prediction. Weargue that explaining predictions is an important aspect in
arX
iv:1
602.
0493
8v3
[cs
.LG
] 9
Aug
201
6
sneezeweightheadacheno fatigueage
Flu sneeze
headache
Model Data and Prediction
Explainer (LIME)
Explanation
Explainer (LIME)
Human makes decision Explanation
no fatigue
sneeze
headache
active
Human makes decision
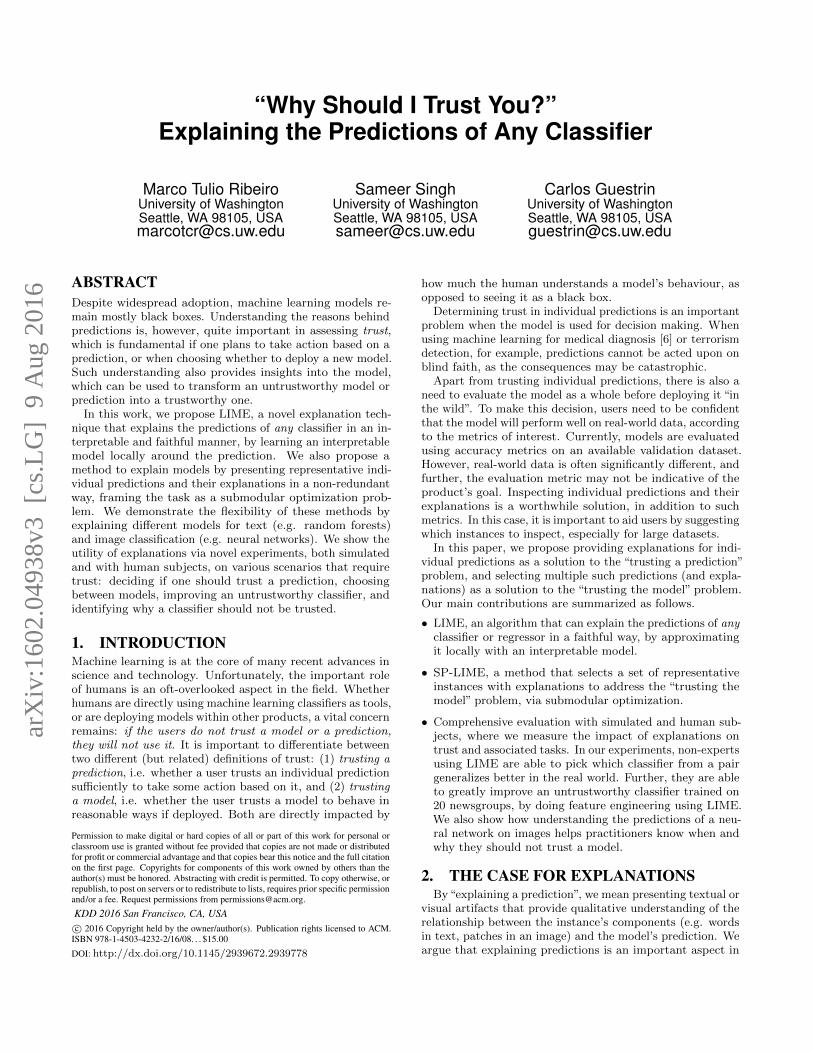
Figure 1: Explaining individual predictions. A model predicts that a patient has the flu, and LIME highlightsthe symptoms in the patient’s history that led to the prediction. Sneeze and headache are portrayed ascontributing to the “flu” prediction, while “no fatigue” is evidence against it. With these, a doctor can makean informed decision about whether to trust the model’s prediction.
getting humans to trust and use machine learning effectively,if the explanations are faithful and intelligible.
The process of explaining individual predictions is illus-trated in Figure 1. It is clear that a doctor is much betterpositioned to make a decision with the help of a model ifintelligible explanations are provided. In this case, an ex-planation is a small list of symptoms with relative weights –symptoms that either contribute to the prediction (in green)or are evidence against it (in red). Humans usually have priorknowledge about the application domain, which they can useto accept (trust) or reject a prediction if they understand thereasoning behind it. It has been observed, for example, thatproviding explanations can increase the acceptance of movierecommendations [12] and other automated systems [8].
Every machine learning application also requires a certainmeasure of overall trust in the model. Development andevaluation of a classification model often consists of collect-ing annotated data, of which a held-out subset is used forautomated evaluation. Although this is a useful pipeline formany applications, evaluation on validation data may notcorrespond to performance “in the wild”, as practitionersoften overestimate the accuracy of their models [20], andthus trust cannot rely solely on it. Looking at examplesoffers an alternative method to assess truth in the model,especially if the examples are explained. We thus proposeexplaining several representative individual predictions of amodel as a way to provide a global understanding.
There are several ways a model or its evaluation can gowrong. Data leakage, for example, defined as the uninten-tional leakage of signal into the training (and validation)data that would not appear when deployed [14], potentiallyincreases accuracy. A challenging example cited by Kauf-man et al. [14] is one where the patient ID was found to beheavily correlated with the target class in the training andvalidation data. This issue would be incredibly challengingto identify just by observing the predictions and the rawdata, but much easier if explanations such as the one inFigure 1 are provided, as patient ID would be listed as anexplanation for predictions. Another particularly hard todetect problem is dataset shift [5], where training data isdifferent than test data (we give an example in the famous20 newsgroups dataset later on). The insights given by expla-nations are particularly helpful in identifying what must bedone to convert an untrustworthy model into a trustworthyone – for example, removing leaked data or changing thetraining data to avoid dataset shift.
Machine learning practitioners often have to select a modelfrom a number of alternatives, requiring them to assessthe relative trust between two or more models. In Figure
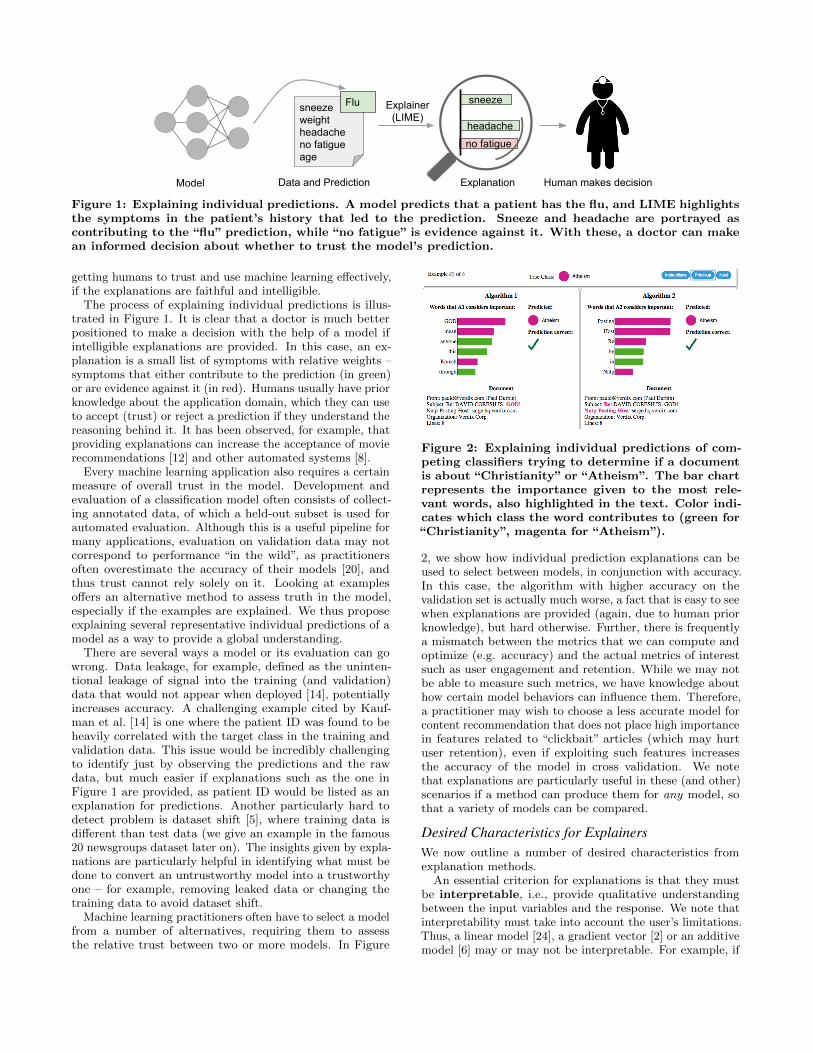
Figure 2: Explaining individual predictions of com-peting classifiers trying to determine if a documentis about “Christianity” or “Atheism”. The bar chartrepresents the importance given to the most rele-vant words, also highlighted in the text. Color indi-cates which class the word contributes to (green for“Christianity”, magenta for “Atheism”).
2, we show how individual prediction explanations can beused to select between models, in conjunction with accuracy.In this case, the algorithm with higher accuracy on thevalidation set is actually much worse, a fact that is easy to seewhen explanations are provided (again, due to human priorknowledge), but hard otherwise. Further, there is frequentlya mismatch between the metrics that we can compute andoptimize (e.g. accuracy) and the actual metrics of interestsuch as user engagement and retention. While we may notbe able to measure such metrics, we have knowledge abouthow certain model behaviors can influence them. Therefore,a practitioner may wish to choose a less accurate model forcontent recommendation that does not place high importancein features related to “clickbait” articles (which may hurtuser retention), even if exploiting such features increasesthe accuracy of the model in cross validation. We notethat explanations are particularly useful in these (and other)scenarios if a method can produce them for any model, sothat a variety of models can be compared.
Desired Characteristics for ExplainersWe now outline a number of desired characteristics fromexplanation methods.
An essential criterion for explanations is that they mustbe interpretable, i.e., provide qualitative understandingbetween the input variables and the response. We note thatinterpretability must take into account the user’s limitations.Thus, a linear model [24], a gradient vector [2] or an additivemodel [6] may or may not be interpretable. For example, if
hundreds or thousands of features significantly contributeto a prediction, it is not reasonable to expect any user tocomprehend why the prediction was made, even if individualweights can be inspected. This requirement further impliesthat explanations should be easy to understand, which isnot necessarily true of the features used by the model, andthus the “input variables” in the explanations may needto be different than the features. Finally, we note that thenotion of interpretability also depends on the target audience.Machine learning practitioners may be able to interpret smallBayesian networks, but laymen may be more comfortablewith a small number of weighted features as an explanation.
Another essential criterion is local fidelity. Although it isoften impossible for an explanation to be completely faithfulunless it is the complete description of the model itself, foran explanation to be meaningful it must at least be locallyfaithful, i.e. it must correspond to how the model behaves inthe vicinity of the instance being predicted. We note thatlocal fidelity does not imply global fidelity: features thatare globally important may not be important in the localcontext, and vice versa. While global fidelity would implylocal fidelity, identifying globally faithful explanations thatare interpretable remains a challenge for complex models.
While there are models that are inherently interpretable [6,17, 26, 27], an explainer should be able to explain any model,and thus be model-agnostic (i.e. treat the original modelas a black box). Apart from the fact that many state-of-the-art classifiers are not currently interpretable, this alsoprovides flexibility to explain future classifiers.
In addition to explaining predictions, providing a globalperspective is important to ascertain trust in the model.As mentioned before, accuracy may often not be a suitablemetric to evaluate the model, and thus we want to explainthe model. Building upon the explanations for individualpredictions, we select a few explanations to present to theuser, such that they are representative of the model.
3. LOCAL INTERPRETABLEMODEL-AGNOSTIC EXPLANATIONS
We now present Local Interpretable Model-agnostic Expla-nations (LIME). The overall goal of LIME is to identify aninterpretable model over the interpretable representationthat is locally faithful to the classifier.
3.1 Interpretable Data RepresentationsBefore we present the explanation system, it is impor-
tant to distinguish between features and interpretable datarepresentations. As mentioned before, interpretable expla-nations need to use a representation that is understandableto humans, regardless of the actual features used by themodel. For example, a possible interpretable representationfor text classification is a binary vector indicating the pres-ence or absence of a word, even though the classifier mayuse more complex (and incomprehensible) features such asword embeddings. Likewise for image classification, an in-terpretable representation may be a binary vector indicatingthe “presence” or “absence” of a contiguous patch of similarpixels (a super-pixel), while the classifier may represent theimage as a tensor with three color channels per pixel. Wedenote x ∈ Rd be the original representation of an instance
being explained, and we use x′ ∈ 0, 1d′
to denote a binaryvector for its interpretable representation.
3.2 Fidelity-Interpretability Trade-offFormally, we define an explanation as a model g ∈ G,
where G is a class of potentially interpretable models, suchas linear models, decision trees, or falling rule lists [27], i.e. amodel g ∈ G can be readily presented to the user with visual
or textual artifacts. The domain of g is 0, 1d′, i.e. g acts
over absence/presence of the interpretable components. Asnot every g ∈ G may be simple enough to be interpretable -thus we let Ω(g) be a measure of complexity (as opposed tointerpretability) of the explanation g ∈ G. For example, fordecision trees Ω(g) may be the depth of the tree, while forlinear models, Ω(g) may be the number of non-zero weights.
Let the model being explained be denoted f : Rd → R. Inclassification, f(x) is the probability (or a binary indicator)that x belongs to a certain class1. We further use πx(z) as aproximity measure between an instance z to x, so as to definelocality around x. Finally, let L(f, g, πx) be a measure ofhow unfaithful g is in approximating f in the locality definedby πx. In order to ensure both interpretability and localfidelity, we must minimize L(f, g, πx) while having Ω(g) below enough to be interpretable by humans. The explanationproduced by LIME is obtained by the following:
ξ(x) = argming∈G
L(f, g, πx) + Ω(g) (1)
This formulation can be used with different explanationfamilies G, fidelity functions L, and complexity measures Ω.Here we focus on sparse linear models as explanations, andon performing the search using perturbations.
3.3 Sampling for Local ExplorationWe want to minimize the locality-aware loss L(f, g, πx)
without making any assumptions about f , since we want theexplainer to be model-agnostic. Thus, in order to learnthe local behavior of f as the interpretable inputs vary, weapproximate L(f, g, πx) by drawing samples, weighted byπx. We sample instances around x′ by drawing nonzeroelements of x′ uniformly at random (where the number ofsuch draws is also uniformly sampled). Given a perturbed
sample z′ ∈ 0, 1d′
(which contains a fraction of the nonzeroelements of x′), we recover the sample in the original repre-sentation z ∈ Rd and obtain f(z), which is used as a label forthe explanation model. Given this dataset Z of perturbedsamples with the associated labels, we optimize Eq. (1) toget an explanation ξ(x). The primary intuition behind LIMEis presented in Figure 3, where we sample instances bothin the vicinity of x (which have a high weight due to πx)and far away from x (low weight from πx). Even thoughthe original model may be too complex to explain globally,LIME presents an explanation that is locally faithful (linearin this case), where the locality is captured by πx. It is worthnoting that our method is fairly robust to sampling noisesince the samples are weighted by πx in Eq. (1). We nowpresent a concrete instance of this general framework.
3.4 Sparse Linear ExplanationsFor the rest of this paper, we let G be the class of linear
models, such that g(z′) = wg ·z′. We use the locally weightedsquare loss as L, as defined in Eq. (2), where we let πx(z) =exp(−D(x, z)2/σ2) be an exponential kernel defined on some
1For multiple classes, we explain each class separately, thusf(x) is the prediction of the relevant class.

Figure 3: Toy example to present intuition for LIME.The black-box model’s complex decision function f(unknown to LIME) is represented by the blue/pinkbackground, which cannot be approximated well bya linear model. The bold red cross is the instancebeing explained. LIME samples instances, gets pre-dictions using f , and weighs them by the proximityto the instance being explained (represented hereby size). The dashed line is the learned explanationthat is locally (but not globally) faithful.
distance function D (e.g. cosine distance for text, L2 distancefor images) with width σ.
L(f, g, πx) =∑
z,z′∈Z
πx(z)(f(z)− g(z′)
)2(2)
For text classification, we ensure that the explanation isinterpretable by letting the interpretable representation bea bag of words, and by setting a limit K on the number ofwords, i.e. Ω(g) =∞1[‖wg‖0 > K]. Potentially, K can beadapted to be as big as the user can handle, or we couldhave different values of K for different instances. In thispaper we use a constant value for K, leaving the explorationof different values to future work. We use the same Ω forimage classification, using “super-pixels” (computed usingany standard algorithm) instead of words, such that theinterpretable representation of an image is a binary vectorwhere 1 indicates the original super-pixel and 0 indicates agrayed out super-pixel. This particular choice of Ω makesdirectly solving Eq. (1) intractable, but we approximate it byfirst selecting K features with Lasso (using the regularizationpath [9]) and then learning the weights via least squares (aprocedure we call K-LASSO in Algorithm 1). Since Algo-rithm 1 produces an explanation for an individual prediction,its complexity does not depend on the size of the dataset,but instead on time to compute f(x) and on the numberof samples N . In practice, explaining random forests with1000 trees using scikit-learn (http://scikit-learn.org) on alaptop with N = 5000 takes under 3 seconds without anyoptimizations such as using gpus or parallelization. Explain-ing each prediction of the Inception network [25] for imageclassification takes around 10 minutes.
Any choice of interpretable representations and G willhave some inherent drawbacks. First, while the underlyingmodel can be treated as a black-box, certain interpretablerepresentations will not be powerful enough to explain certainbehaviors. For example, a model that predicts sepia-tonedimages to be retro cannot be explained by presence of absenceof super pixels. Second, our choice of G (sparse linear models)means that if the underlying model is highly non-linear evenin the locality of the prediction, there may not be a faithfulexplanation. However, we can estimate the faithfulness of
Algorithm 1 Sparse Linear Explanations using LIME
Require: Classifier f , Number of samples NRequire: Instance x, and its interpretable version x′
Require: Similarity kernel πx, Length of explanation KZ ← for i ∈ 1, 2, 3, ..., N do
z′i ← sample around(x′)Z ← Z ∪ 〈z′i, f(zi), πx(zi)〉
end forw ← K-Lasso(Z,K) . with z′i as features, f(z) as targetreturn w
the explanation on Z, and present this information to theuser. This estimate of faithfulness can also be used forselecting an appropriate family of explanations from a set ofmultiple interpretable model classes, thus adapting to thegiven dataset and the classifier. We leave such explorationfor future work, as linear explanations work quite well formultiple black-box models in our experiments.
3.5 Example 1: Text classification with SVMsIn Figure 2 (right side), we explain the predictions of asupport vector machine with RBF kernel trained on uni-grams to differentiate “Christianity” from “Atheism” (on asubset of the 20 newsgroup dataset). Although this classifierachieves 94% held-out accuracy, and one would be temptedto trust it based on this, the explanation for an instanceshows that predictions are made for quite arbitrary reasons(words “Posting”, “Host”, and “Re” have no connection toeither Christianity or Atheism). The word “Posting” appearsin 22% of examples in the training set, 99% of them in theclass “Atheism”. Even if headers are removed, proper namesof prolific posters in the original newsgroups are selected bythe classifier, which would also not generalize.
After getting such insights from explanations, it is clearthat this dataset has serious issues (which are not evidentjust by studying the raw data or predictions), and that thisclassifier, or held-out evaluation, cannot be trusted. It is alsoclear what the problems are, and the steps that can be takento fix these issues and train a more trustworthy classifier.
3.6 Example 2: Deep networks for imagesWhen using sparse linear explanations for image classifiers,one may wish to just highlight the super-pixels with posi-tive weight towards a specific class, as they give intuitionas to why the model would think that class may be present.We explain the prediction of Google’s pre-trained Inceptionneural network [25] in this fashion on an arbitrary image(Figure 4a). Figures 4b, 4c, 4d show the superpixels expla-nations for the top 3 predicted classes (with the rest of theimage grayed out), having set K = 10. What the neuralnetwork picks up on for each of the classes is quite naturalto humans - Figure 4b in particular provides insight as towhy acoustic guitar was predicted to be electric: due to thefretboard. This kind of explanation enhances trust in theclassifier (even if the top predicted class is wrong), as it showsthat it is not acting in an unreasonable manner.

(a) Original Image (b) Explaining Electric guitar (c) Explaining Acoustic guitar (d) Explaining Labrador
Figure 4: Explaining an image classification prediction made by Google’s Inception neural network. The top3 classes predicted are “Electric Guitar” (p = 0.32), “Acoustic guitar” (p = 0.24) and “Labrador” (p = 0.21)
4. SUBMODULAR PICK FOREXPLAINING MODELS
Although an explanation of a single prediction providessome understanding into the reliability of the classifier to theuser, it is not sufficient to evaluate and assess trust in themodel as a whole. We propose to give a global understandingof the model by explaining a set of individual instances. Thisapproach is still model agnostic, and is complementary tocomputing summary statistics such as held-out accuracy.
Even though explanations of multiple instances can beinsightful, these instances need to be selected judiciously,since users may not have the time to examine a large numberof explanations. We represent the time/patience that humanshave by a budget B that denotes the number of explanationsthey are willing to look at in order to understand a model.Given a set of instances X, we define the pick step as thetask of selecting B instances for the user to inspect.
The pick step is not dependent on the existence of explana-tions - one of the main purpose of tools like Modeltracker [1]and others [11] is to assist users in selecting instances them-selves, and examining the raw data and predictions. However,since looking at raw data is not enough to understand predic-tions and get insights, the pick step should take into accountthe explanations that accompany each prediction. Moreover,this method should pick a diverse, representative set of expla-nations to show the user – i.e. non-redundant explanationsthat represent how the model behaves globally.
Given the explanations for a set of instances X (|X| = n),we construct an n× d′ explanation matrix W that representsthe local importance of the interpretable components foreach instance. When using linear models as explanations,for an instance xi and explanation gi = ξ(xi), we set Wij =|wgij |. Further, for each component (column) j in W, welet Ij denote the global importance of that component inthe explanation space. Intuitively, we want I such thatfeatures that explain many different instances have higherimportance scores. In Figure 5, we show a toy example W,with n = d′ = 5, where W is binary (for simplicity). Theimportance function I should score feature f2 higher thanfeature f1, i.e. I2 > I1, since feature f2 is used to explainmore instances. Concretely for the text applications, we setIj =
√∑ni=1Wij . For images, I must measure something
that is comparable across the super-pixels in different images,
f1 f2 f3 f4 f5
Covered FeaturesFigure 5: Toy example W. Rows represent in-stances (documents) and columns represent features(words). Feature f2 (dotted blue) has the highest im-portance. Rows 2 and 5 (in red) would be selectedby the pick procedure, covering all but feature f1.
Algorithm 2 Submodular pick (SP) algorithm
Require: Instances X, Budget Bfor all xi ∈ X doWi ← explain(xi, x
′i) . Using Algorithm 1
end forfor j ∈ 1 . . . d′ do
Ij ←√∑n
i=1 |Wij | . Compute feature importancesend forV ← while |V | < B do . Greedy optimization of Eq (4)
V ← V ∪ argmaxi c(V ∪ i,W, I)end whilereturn V
such as color histograms or other features of super-pixels; weleave further exploration of these ideas for future work.
While we want to pick instances that cover the importantcomponents, the set of explanations must not be redundantin the components they show the users, i.e. avoid selectinginstances with similar explanations. In Figure 5, after thesecond row is picked, the third row adds no value, as theuser has already seen features f2 and f3 - while the last rowexposes the user to completely new features. Selecting thesecond and last row results in the coverage of almost all thefeatures. We formalize this non-redundant coverage intuitionin Eq. (3), where we define coverage as the set function cthat, given W and I, computes the total importance of thefeatures that appear in at least one instance in a set V .

c(V,W, I) =
d′∑j=1
1[∃i∈V :Wij>0]Ij (3)
The pick problem, defined in Eq. (4), consists of finding theset V, |V | ≤ B that achieves highest coverage.
Pick(W, I) = argmaxV,|V |≤B
c(V,W, I) (4)
The problem in Eq. (4) is maximizing a weighted coveragefunction, and is NP-hard [10]. Let c(V ∪i,W, I)−c(V,W, I)be the marginal coverage gain of adding an instance i to a setV . Due to submodularity, a greedy algorithm that iterativelyadds the instance with the highest marginal coverage gain tothe solution offers a constant-factor approximation guaranteeof 1−1/e to the optimum [15]. We outline this approximationin Algorithm 2, and call it submodular pick.
5. SIMULATED USER EXPERIMENTSIn this section, we present simulated user experiments to
evaluate the utility of explanations in trust-related tasks. Inparticular, we address the following questions: (1) Are theexplanations faithful to the model, (2) Can the explanationsaid users in ascertaining trust in predictions, and (3) Arethe explanations useful for evaluating the model as a whole.Code and data for replicating our experiments are availableat https://github.com/marcotcr/lime-experiments.
5.1 Experiment SetupWe use two sentiment analysis datasets (books and DVDs,
2000 instances each) where the task is to classify prod-uct reviews as positive or negative [4]. We train decisiontrees (DT), logistic regression with L2 regularization (LR),nearest neighbors (NN), and support vector machines withRBF kernel (SVM), all using bag of words as features. Wealso include random forests (with 1000 trees) trained withthe average word2vec embedding [19] (RF), a model that isimpossible to interpret without a technique like LIME. Weuse the implementations and default parameters of scikit-learn, unless noted otherwise. We divide each dataset intotrain (1600 instances) and test (400 instances).
To explain individual predictions, we compare our pro-posed approach (LIME), with parzen [2], a method thatapproximates the black box classifier globally with Parzenwindows, and explains individual predictions by taking thegradient of the prediction probability function. For parzen,we take the K features with the highest absolute gradientsas explanations. We set the hyper-parameters for parzen andLIME using cross validation, and set N = 15, 000. We alsocompare against a greedy procedure (similar to Martensand Provost [18]) in which we greedily remove features thatcontribute the most to the predicted class until the predictionchanges (or we reach the maximum of K features), and arandom procedure that randomly picks K features as anexplanation. We set K to 10 for our experiments.
For experiments where the pick procedure applies, we eitherdo random selection (random pick, RP) or the proceduredescribed in §4 (submodular pick, SP). We refer to pick-explainer combinations by adding RP or SP as a prefix.
5.2 Are explanations faithful to the model?We measure faithfulness of explanations on classifiers that
are by themselves interpretable (sparse logistic regression
random parzen greedy LIME0
25
50
75
100
Rec
all (
%)
17.4
72.864.3
92.1
(a) Sparse LR
random parzen greedy LIME0
25
50
75
100
Rec
all (
%)
20.6
78.9
37.0
97.0
(b) Decision Tree
Figure 6: Recall on truly important features for twointerpretable classifiers on the books dataset.
random parzen greedy LIME0
25
50
75
100
Rec
all (
%)
19.2
60.8 63.4
90.2
(a) Sparse LR
random parzen greedy LIME0
25
50
75
100
Rec
all (
%)
17.4
80.6
47.6
97.8
(b) Decision Tree
Figure 7: Recall on truly important features for twointerpretable classifiers on the DVDs dataset.
and decision trees). In particular, we train both classifierssuch that the maximum number of features they use for anyinstance is 10, and thus we know the gold set of featuresthat the are considered important by these models. Foreach prediction on the test set, we generate explanations andcompute the fraction of these gold features that are recoveredby the explanations. We report this recall averaged over allthe test instances in Figures 6 and 7. We observe thatthe greedy approach is comparable to parzen on logisticregression, but is substantially worse on decision trees sincechanging a single feature at a time often does not have aneffect on the prediction. The overall recall by parzen is low,likely due to the difficulty in approximating the original high-dimensional classifier. LIME consistently provides > 90%recall for both classifiers on both datasets, demonstratingthat LIME explanations are faithful to the models.
5.3 Should I trust this prediction?In order to simulate trust in individual predictions, we first
randomly select 25% of the features to be “untrustworthy”,and assume that the users can identify and would not wantto trust these features (such as the headers in 20 newsgroups,leaked data, etc). We thus develop oracle “trustworthiness”by labeling test set predictions from a black box classifier as“untrustworthy” if the prediction changes when untrustworthyfeatures are removed from the instance, and “trustworthy”otherwise. In order to simulate users, we assume that usersdeem predictions untrustworthy from LIME and parzen ex-planations if the prediction from the linear approximationchanges when all untrustworthy features that appear in theexplanations are removed (the simulated human “discounts”the effect of untrustworthy features). For greedy and random,the prediction is mistrusted if any untrustworthy featuresare present in the explanation, since these methods do notprovide a notion of the contribution of each feature to theprediction. Thus for each test set prediction, we can evaluatewhether the simulated user trusts it using each explanationmethod, and compare it to the trustworthiness oracle.
Using this setup, we report the F1 on the trustworthy
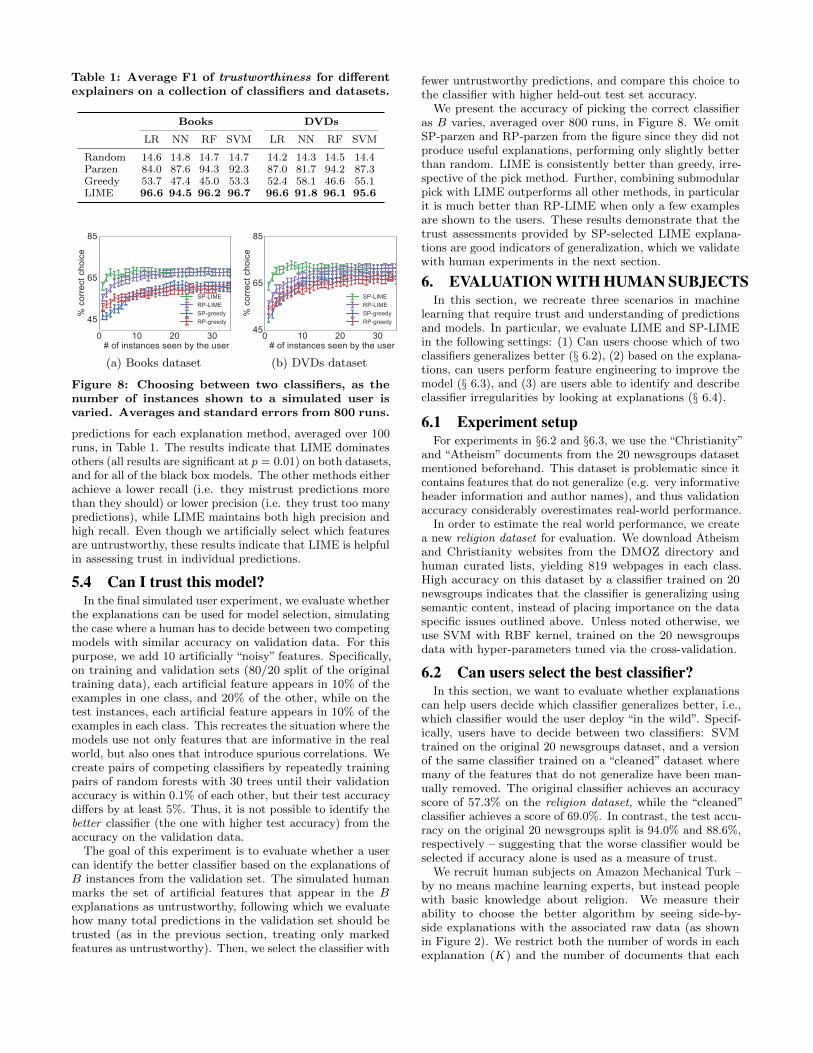
Table 1: Average F1 of trustworthiness for differentexplainers on a collection of classifiers and datasets.
Books DVDs
LR NN RF SVM LR NN RF SVM
Random 14.6 14.8 14.7 14.7 14.2 14.3 14.5 14.4Parzen 84.0 87.6 94.3 92.3 87.0 81.7 94.2 87.3Greedy 53.7 47.4 45.0 53.3 52.4 58.1 46.6 55.1LIME 96.6 94.5 96.2 96.7 96.6 91.8 96.1 95.6
0 10 20 30# of instances seen by the user
45
65
85
% c
orre
ct c
hoic
e
SP-LIMERP-LIMESP-greedyRP-greedy
(a) Books dataset
0 10 20 30# of instances seen by the user
45
65
85%
cor
rect
cho
ice
SP-LIMERP-LIMESP-greedyRP-greedy
(b) DVDs dataset
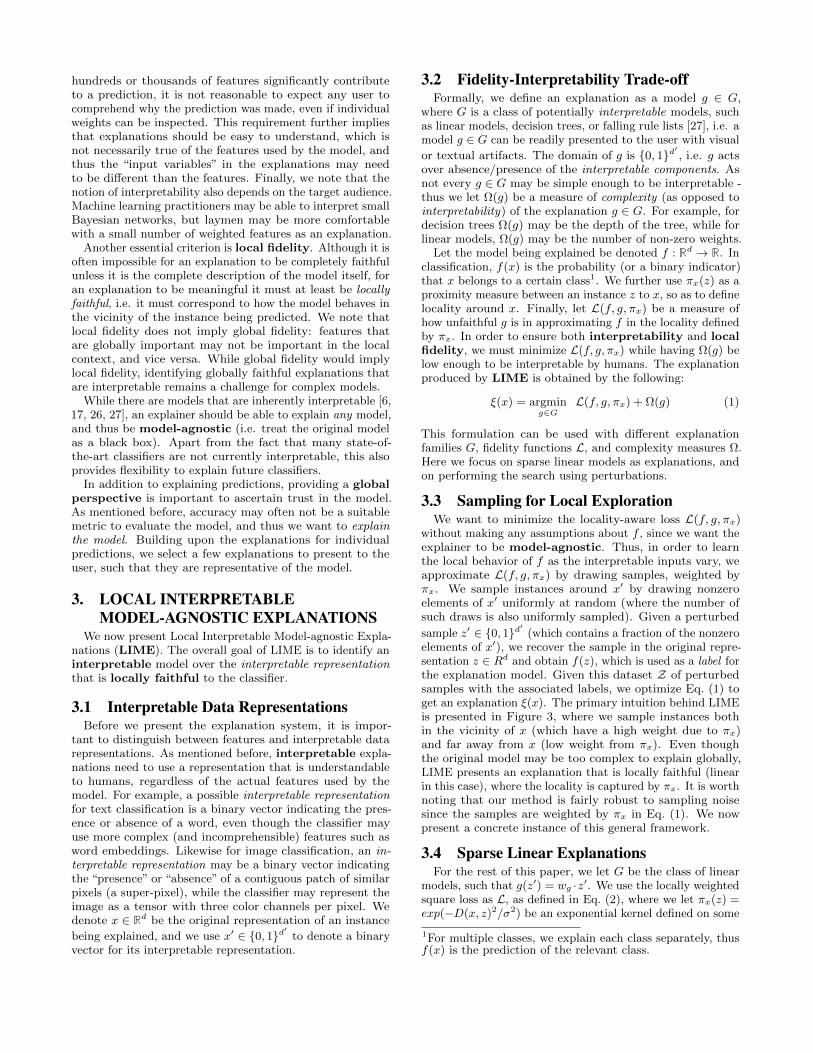
Figure 8: Choosing between two classifiers, as thenumber of instances shown to a simulated user isvaried. Averages and standard errors from 800 runs.
predictions for each explanation method, averaged over 100runs, in Table 1. The results indicate that LIME dominatesothers (all results are significant at p = 0.01) on both datasets,and for all of the black box models. The other methods eitherachieve a lower recall (i.e. they mistrust predictions morethan they should) or lower precision (i.e. they trust too manypredictions), while LIME maintains both high precision andhigh recall. Even though we artificially select which featuresare untrustworthy, these results indicate that LIME is helpfulin assessing trust in individual predictions.
5.4 Can I trust this model?In the final simulated user experiment, we evaluate whether
the explanations can be used for model selection, simulatingthe case where a human has to decide between two competingmodels with similar accuracy on validation data. For thispurpose, we add 10 artificially “noisy” features. Specifically,on training and validation sets (80/20 split of the originaltraining data), each artificial feature appears in 10% of theexamples in one class, and 20% of the other, while on thetest instances, each artificial feature appears in 10% of theexamples in each class. This recreates the situation where themodels use not only features that are informative in the realworld, but also ones that introduce spurious correlations. Wecreate pairs of competing classifiers by repeatedly trainingpairs of random forests with 30 trees until their validationaccuracy is within 0.1% of each other, but their test accuracydiffers by at least 5%. Thus, it is not possible to identify thebetter classifier (the one with higher test accuracy) from theaccuracy on the validation data.
The goal of this experiment is to evaluate whether a usercan identify the better classifier based on the explanations ofB instances from the validation set. The simulated humanmarks the set of artificial features that appear in the Bexplanations as untrustworthy, following which we evaluatehow many total predictions in the validation set should betrusted (as in the previous section, treating only markedfeatures as untrustworthy). Then, we select the classifier with
fewer untrustworthy predictions, and compare this choice tothe classifier with higher held-out test set accuracy.
We present the accuracy of picking the correct classifieras B varies, averaged over 800 runs, in Figure 8. We omitSP-parzen and RP-parzen from the figure since they did notproduce useful explanations, performing only slightly betterthan random. LIME is consistently better than greedy, irre-spective of the pick method. Further, combining submodularpick with LIME outperforms all other methods, in particularit is much better than RP-LIME when only a few examplesare shown to the users. These results demonstrate that thetrust assessments provided by SP-selected LIME explana-tions are good indicators of generalization, which we validatewith human experiments in the next section.
6. EVALUATION WITH HUMAN SUBJECTSIn this section, we recreate three scenarios in machine
learning that require trust and understanding of predictionsand models. In particular, we evaluate LIME and SP-LIMEin the following settings: (1) Can users choose which of twoclassifiers generalizes better (§ 6.2), (2) based on the explana-tions, can users perform feature engineering to improve themodel (§ 6.3), and (3) are users able to identify and describeclassifier irregularities by looking at explanations (§ 6.4).
6.1 Experiment setupFor experiments in §6.2 and §6.3, we use the “Christianity”
and “Atheism” documents from the 20 newsgroups datasetmentioned beforehand. This dataset is problematic since itcontains features that do not generalize (e.g. very informativeheader information and author names), and thus validationaccuracy considerably overestimates real-world performance.
In order to estimate the real world performance, we createa new religion dataset for evaluation. We download Atheismand Christianity websites from the DMOZ directory andhuman curated lists, yielding 819 webpages in each class.High accuracy on this dataset by a classifier trained on 20newsgroups indicates that the classifier is generalizing usingsemantic content, instead of placing importance on the dataspecific issues outlined above. Unless noted otherwise, weuse SVM with RBF kernel, trained on the 20 newsgroupsdata with hyper-parameters tuned via the cross-validation.
6.2 Can users select the best classifier?In this section, we want to evaluate whether explanations
can help users decide which classifier generalizes better, i.e.,which classifier would the user deploy “in the wild”. Specif-ically, users have to decide between two classifiers: SVMtrained on the original 20 newsgroups dataset, and a versionof the same classifier trained on a “cleaned” dataset wheremany of the features that do not generalize have been man-ually removed. The original classifier achieves an accuracyscore of 57.3% on the religion dataset, while the “cleaned”classifier achieves a score of 69.0%. In contrast, the test accu-racy on the original 20 newsgroups split is 94.0% and 88.6%,respectively – suggesting that the worse classifier would beselected if accuracy alone is used as a measure of trust.
We recruit human subjects on Amazon Mechanical Turk –by no means machine learning experts, but instead peoplewith basic knowledge about religion. We measure theirability to choose the better algorithm by seeing side-by-side explanations with the associated raw data (as shownin Figure 2). We restrict both the number of words in eachexplanation (K) and the number of documents that each
greedy LIME40
60
80
100
% c
orre
ct c
hoic
e68.0
75.080.0
89.0Random Pick (RP)Submodular Pick (RP)
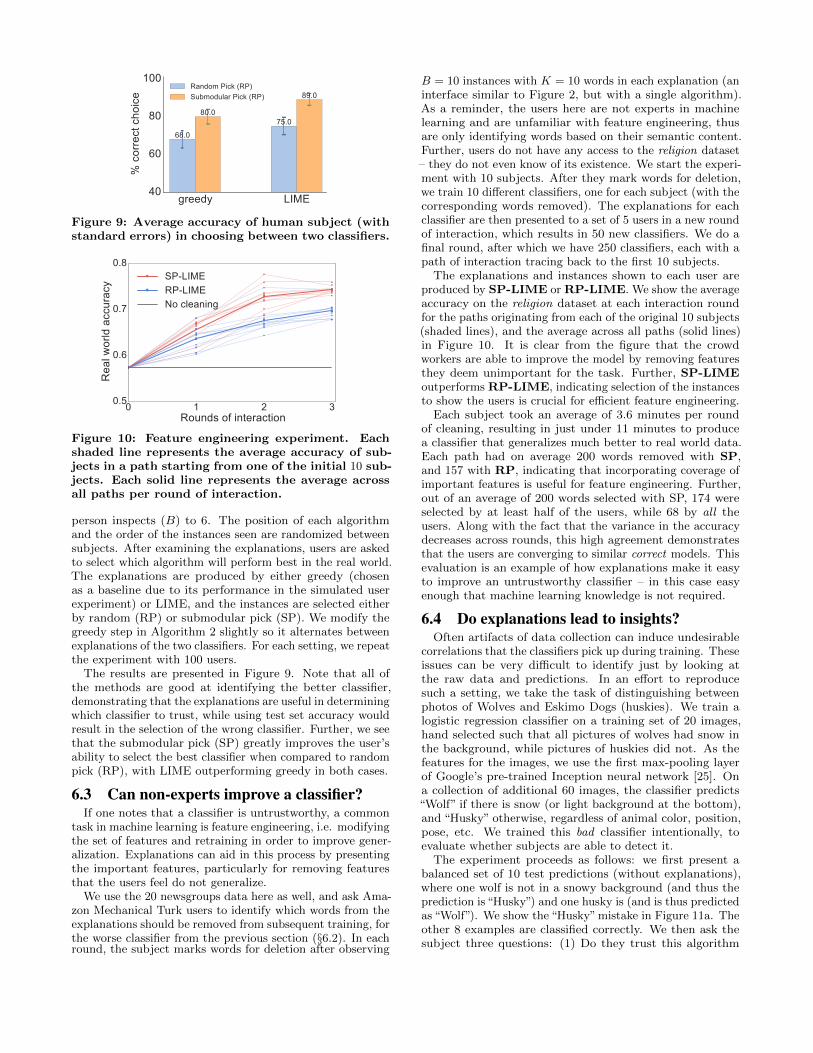
Figure 9: Average accuracy of human subject (withstandard errors) in choosing between two classifiers.
0 1 2 3Rounds of interaction
0.5
0.6
0.7
0.8
Rea
l wor
ld a
ccur
acy
SP-LIMERP-LIMENo cleaning
Figure 10: Feature engineering experiment. Eachshaded line represents the average accuracy of sub-jects in a path starting from one of the initial 10 sub-jects. Each solid line represents the average acrossall paths per round of interaction.
person inspects (B) to 6. The position of each algorithmand the order of the instances seen are randomized betweensubjects. After examining the explanations, users are askedto select which algorithm will perform best in the real world.The explanations are produced by either greedy (chosenas a baseline due to its performance in the simulated userexperiment) or LIME, and the instances are selected eitherby random (RP) or submodular pick (SP). We modify thegreedy step in Algorithm 2 slightly so it alternates betweenexplanations of the two classifiers. For each setting, we repeatthe experiment with 100 users.
The results are presented in Figure 9. Note that all ofthe methods are good at identifying the better classifier,demonstrating that the explanations are useful in determiningwhich classifier to trust, while using test set accuracy wouldresult in the selection of the wrong classifier. Further, we seethat the submodular pick (SP) greatly improves the user’sability to select the best classifier when compared to randompick (RP), with LIME outperforming greedy in both cases.
6.3 Can non-experts improve a classifier?If one notes that a classifier is untrustworthy, a common
task in machine learning is feature engineering, i.e. modifyingthe set of features and retraining in order to improve gener-alization. Explanations can aid in this process by presentingthe important features, particularly for removing featuresthat the users feel do not generalize.
We use the 20 newsgroups data here as well, and ask Ama-zon Mechanical Turk users to identify which words from theexplanations should be removed from subsequent training, forthe worse classifier from the previous section (§6.2). In eachround, the subject marks words for deletion after observing
B = 10 instances with K = 10 words in each explanation (aninterface similar to Figure 2, but with a single algorithm).As a reminder, the users here are not experts in machinelearning and are unfamiliar with feature engineering, thusare only identifying words based on their semantic content.Further, users do not have any access to the religion dataset– they do not even know of its existence. We start the experi-ment with 10 subjects. After they mark words for deletion,we train 10 different classifiers, one for each subject (with thecorresponding words removed). The explanations for eachclassifier are then presented to a set of 5 users in a new roundof interaction, which results in 50 new classifiers. We do afinal round, after which we have 250 classifiers, each with apath of interaction tracing back to the first 10 subjects.
The explanations and instances shown to each user areproduced by SP-LIME or RP-LIME. We show the averageaccuracy on the religion dataset at each interaction roundfor the paths originating from each of the original 10 subjects(shaded lines), and the average across all paths (solid lines)in Figure 10. It is clear from the figure that the crowdworkers are able to improve the model by removing featuresthey deem unimportant for the task. Further, SP-LIMEoutperforms RP-LIME, indicating selection of the instancesto show the users is crucial for efficient feature engineering.
Each subject took an average of 3.6 minutes per roundof cleaning, resulting in just under 11 minutes to producea classifier that generalizes much better to real world data.Each path had on average 200 words removed with SP,and 157 with RP, indicating that incorporating coverage ofimportant features is useful for feature engineering. Further,out of an average of 200 words selected with SP, 174 wereselected by at least half of the users, while 68 by all theusers. Along with the fact that the variance in the accuracydecreases across rounds, this high agreement demonstratesthat the users are converging to similar correct models. Thisevaluation is an example of how explanations make it easyto improve an untrustworthy classifier – in this case easyenough that machine learning knowledge is not required.
6.4 Do explanations lead to insights?Often artifacts of data collection can induce undesirable
correlations that the classifiers pick up during training. Theseissues can be very difficult to identify just by looking atthe raw data and predictions. In an effort to reproducesuch a setting, we take the task of distinguishing betweenphotos of Wolves and Eskimo Dogs (huskies). We train alogistic regression classifier on a training set of 20 images,hand selected such that all pictures of wolves had snow inthe background, while pictures of huskies did not. As thefeatures for the images, we use the first max-pooling layerof Google’s pre-trained Inception neural network [25]. Ona collection of additional 60 images, the classifier predicts“Wolf” if there is snow (or light background at the bottom),and “Husky” otherwise, regardless of animal color, position,pose, etc. We trained this bad classifier intentionally, toevaluate whether subjects are able to detect it.
The experiment proceeds as follows: we first present abalanced set of 10 test predictions (without explanations),where one wolf is not in a snowy background (and thus theprediction is “Husky”) and one husky is (and is thus predictedas “Wolf”). We show the “Husky” mistake in Figure 11a. Theother 8 examples are classified correctly. We then ask thesubject three questions: (1) Do they trust this algorithm
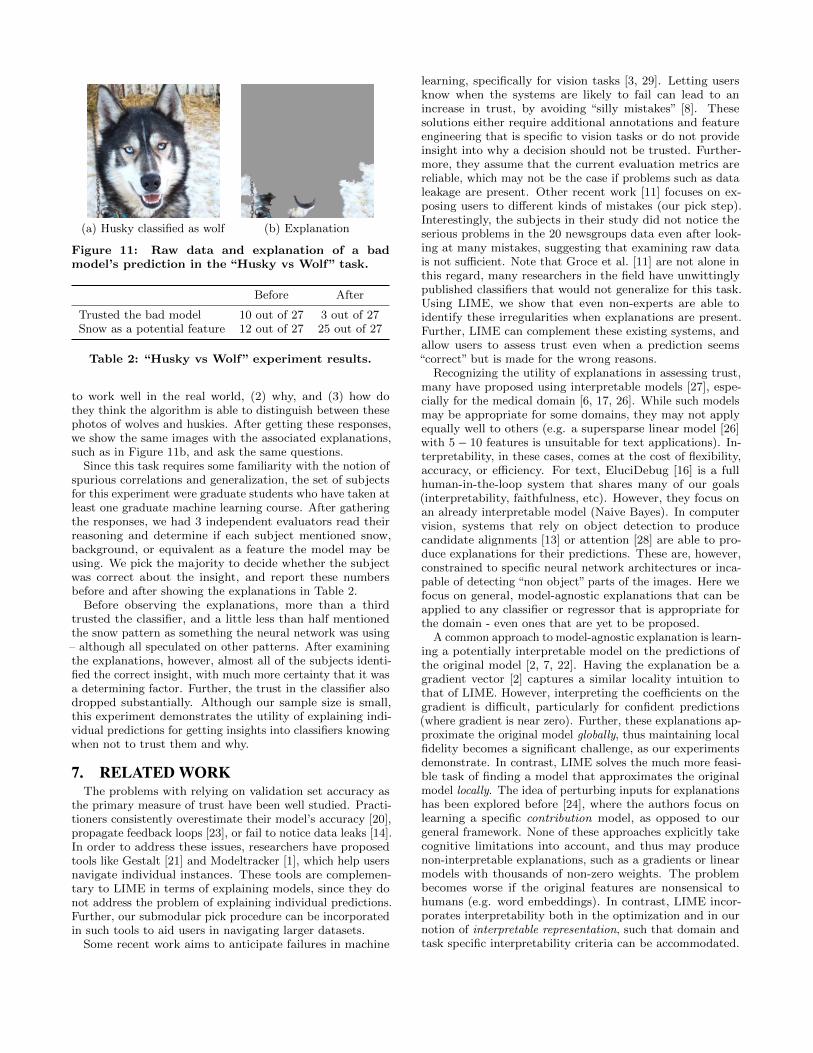
(a) Husky classified as wolf (b) Explanation
Figure 11: Raw data and explanation of a badmodel’s prediction in the “Husky vs Wolf” task.
Before After
Trusted the bad model 10 out of 27 3 out of 27Snow as a potential feature 12 out of 27 25 out of 27
Table 2: “Husky vs Wolf” experiment results.
to work well in the real world, (2) why, and (3) how dothey think the algorithm is able to distinguish between thesephotos of wolves and huskies. After getting these responses,we show the same images with the associated explanations,such as in Figure 11b, and ask the same questions.
Since this task requires some familiarity with the notion ofspurious correlations and generalization, the set of subjectsfor this experiment were graduate students who have taken atleast one graduate machine learning course. After gatheringthe responses, we had 3 independent evaluators read theirreasoning and determine if each subject mentioned snow,background, or equivalent as a feature the model may beusing. We pick the majority to decide whether the subjectwas correct about the insight, and report these numbersbefore and after showing the explanations in Table 2.
Before observing the explanations, more than a thirdtrusted the classifier, and a little less than half mentionedthe snow pattern as something the neural network was using– although all speculated on other patterns. After examiningthe explanations, however, almost all of the subjects identi-fied the correct insight, with much more certainty that it wasa determining factor. Further, the trust in the classifier alsodropped substantially. Although our sample size is small,this experiment demonstrates the utility of explaining indi-vidual predictions for getting insights into classifiers knowingwhen not to trust them and why.
7. RELATED WORKThe problems with relying on validation set accuracy as
the primary measure of trust have been well studied. Practi-tioners consistently overestimate their model’s accuracy [20],propagate feedback loops [23], or fail to notice data leaks [14].In order to address these issues, researchers have proposedtools like Gestalt [21] and Modeltracker [1], which help usersnavigate individual instances. These tools are complemen-tary to LIME in terms of explaining models, since they donot address the problem of explaining individual predictions.Further, our submodular pick procedure can be incorporatedin such tools to aid users in navigating larger datasets.
Some recent work aims to anticipate failures in machine
learning, specifically for vision tasks [3, 29]. Letting usersknow when the systems are likely to fail can lead to anincrease in trust, by avoiding “silly mistakes” [8]. Thesesolutions either require additional annotations and featureengineering that is specific to vision tasks or do not provideinsight into why a decision should not be trusted. Further-more, they assume that the current evaluation metrics arereliable, which may not be the case if problems such as dataleakage are present. Other recent work [11] focuses on ex-posing users to different kinds of mistakes (our pick step).Interestingly, the subjects in their study did not notice theserious problems in the 20 newsgroups data even after look-ing at many mistakes, suggesting that examining raw datais not sufficient. Note that Groce et al. [11] are not alone inthis regard, many researchers in the field have unwittinglypublished classifiers that would not generalize for this task.Using LIME, we show that even non-experts are able toidentify these irregularities when explanations are present.Further, LIME can complement these existing systems, andallow users to assess trust even when a prediction seems“correct” but is made for the wrong reasons.
Recognizing the utility of explanations in assessing trust,many have proposed using interpretable models [27], espe-cially for the medical domain [6, 17, 26]. While such modelsmay be appropriate for some domains, they may not applyequally well to others (e.g. a supersparse linear model [26]with 5− 10 features is unsuitable for text applications). In-terpretability, in these cases, comes at the cost of flexibility,accuracy, or efficiency. For text, EluciDebug [16] is a fullhuman-in-the-loop system that shares many of our goals(interpretability, faithfulness, etc). However, they focus onan already interpretable model (Naive Bayes). In computervision, systems that rely on object detection to producecandidate alignments [13] or attention [28] are able to pro-duce explanations for their predictions. These are, however,constrained to specific neural network architectures or inca-pable of detecting “non object” parts of the images. Here wefocus on general, model-agnostic explanations that can beapplied to any classifier or regressor that is appropriate forthe domain - even ones that are yet to be proposed.
A common approach to model-agnostic explanation is learn-ing a potentially interpretable model on the predictions ofthe original model [2, 7, 22]. Having the explanation be agradient vector [2] captures a similar locality intuition tothat of LIME. However, interpreting the coefficients on thegradient is difficult, particularly for confident predictions(where gradient is near zero). Further, these explanations ap-proximate the original model globally, thus maintaining localfidelity becomes a significant challenge, as our experimentsdemonstrate. In contrast, LIME solves the much more feasi-ble task of finding a model that approximates the originalmodel locally. The idea of perturbing inputs for explanationshas been explored before [24], where the authors focus onlearning a specific contribution model, as opposed to ourgeneral framework. None of these approaches explicitly takecognitive limitations into account, and thus may producenon-interpretable explanations, such as a gradients or linearmodels with thousands of non-zero weights. The problembecomes worse if the original features are nonsensical tohumans (e.g. word embeddings). In contrast, LIME incor-porates interpretability both in the optimization and in ournotion of interpretable representation, such that domain andtask specific interpretability criteria can be accommodated.

8. CONCLUSION AND FUTURE WORKIn this paper, we argued that trust is crucial for effectivehuman interaction with machine learning systems, and thatexplaining individual predictions is important in assessingtrust. We proposed LIME, a modular and extensible ap-proach to faithfully explain the predictions of any model inan interpretable manner. We also introduced SP-LIME, amethod to select representative and non-redundant predic-tions, providing a global view of the model to users. Ourexperiments demonstrated that explanations are useful for avariety of models in trust-related tasks in the text and imagedomains, with both expert and non-expert users: decidingbetween models, assessing trust, improving untrustworthymodels, and getting insights into predictions.
There are a number of avenues of future work that wewould like to explore. Although we describe only sparselinear models as explanations, our framework supports theexploration of a variety of explanation families, such as de-cision trees; it would be interesting to see a comparativestudy on these with real users. One issue that we do notmention in this work was how to perform the pick step forimages, and we would like to address this limitation in thefuture. The domain and model agnosticism enables us toexplore a variety of applications, and we would like to inves-tigate potential uses in speech, video, and medical domains,as well as recommendation systems. Finally, we would liketo explore theoretical properties (such as the appropriatenumber of samples) and computational optimizations (suchas using parallelization and GPU processing), in order toprovide the accurate, real-time explanations that are criticalfor any human-in-the-loop machine learning system.
AcknowledgementsWe would like to thank Scott Lundberg, Tianqi Chen, andTyler Johnson for helpful discussions and feedback. Thiswork was supported in part by ONR awards #W911NF-13-1-0246 and #N00014-13-1-0023, and in part by TerraSwarm,one of six centers of STARnet, a Semiconductor ResearchCorporation program sponsored by MARCO and DARPA.
9. REFERENCES[1] S. Amershi, M. Chickering, S. M. Drucker, B. Lee,
P. Simard, and J. Suh. Modeltracker: Redesigningperformance analysis tools for machine learning. In HumanFactors in Computing Systems (CHI), 2015.
[2] D. Baehrens, T. Schroeter, S. Harmeling, M. Kawanabe,K. Hansen, and K.-R. Muller. How to explain individualclassification decisions. Journal of Machine LearningResearch, 11, 2010.
[3] A. Bansal, A. Farhadi, and D. Parikh. Towards transparentsystems: Semantic characterization of failure modes. InEuropean Conference on Computer Vision (ECCV), 2014.
[4] J. Blitzer, M. Dredze, and F. Pereira. Biographies,bollywood, boom-boxes and blenders: Domain adaptationfor sentiment classification. In Association forComputational Linguistics (ACL), 2007.
[5] J. Q. Candela, M. Sugiyama, A. Schwaighofer, and N. D.Lawrence. Dataset Shift in Machine Learning. MIT, 2009.
[6] R. Caruana, Y. Lou, J. Gehrke, P. Koch, M. Sturm, andN. Elhadad. Intelligible models for healthcare: Predictingpneumonia risk and hospital 30-day readmission. InKnowledge Discovery and Data Mining (KDD), 2015.
[7] M. W. Craven and J. W. Shavlik. Extracting tree-structuredrepresentations of trained networks. Neural informationprocessing systems (NIPS), pages 24–30, 1996.
[8] M. T. Dzindolet, S. A. Peterson, R. A. Pomranky, L. G.Pierce, and H. P. Beck. The role of trust in automationreliance. Int. J. Hum.-Comput. Stud., 58(6), 2003.
[9] B. Efron, T. Hastie, I. Johnstone, and R. Tibshirani. Leastangle regression. Annals of Statistics, 32:407–499, 2004.
[10] U. Feige. A threshold of ln n for approximating set cover. J.ACM, 45(4), July 1998.
[11] A. Groce, T. Kulesza, C. Zhang, S. Shamasunder,M. Burnett, W.-K. Wong, S. Stumpf, S. Das, A. Shinsel,F. Bice, and K. McIntosh. You are the only possible oracle:Effective test selection for end users of interactive machinelearning systems. IEEE Trans. Softw. Eng., 40(3), 2014.
[12] J. L. Herlocker, J. A. Konstan, and J. Riedl. Explainingcollaborative filtering recommendations. In Conference onComputer Supported Cooperative Work (CSCW), 2000.
[13] A. Karpathy and F. Li. Deep visual-semantic alignments forgenerating image descriptions. In Computer Vision andPattern Recognition (CVPR), 2015.
[14] S. Kaufman, S. Rosset, and C. Perlich. Leakage in datamining: Formulation, detection, and avoidance. InKnowledge Discovery and Data Mining (KDD), 2011.
[15] A. Krause and D. Golovin. Submodular functionmaximization. In Tractability: Practical Approaches to HardProblems. Cambridge University Press, February 2014.
[16] T. Kulesza, M. Burnett, W.-K. Wong, and S. Stumpf.Principles of explanatory debugging to personalizeinteractive machine learning. In Intelligent User Interfaces(IUI), 2015.
[17] B. Letham, C. Rudin, T. H. McCormick, and D. Madigan.Interpretable classifiers using rules and bayesian analysis:Building a better stroke prediction model. Annals of AppliedStatistics, 2015.
[18] D. Martens and F. Provost. Explaining data-drivendocument classifications. MIS Q., 38(1), 2014.
[19] T. Mikolov, I. Sutskever, K. Chen, G. S. Corrado, andJ. Dean. Distributed representations of words and phrasesand their compositionality. In Neural InformationProcessing Systems (NIPS). 2013.
[20] K. Patel, J. Fogarty, J. A. Landay, and B. Harrison.Investigating statistical machine learning as a tool forsoftware development. In Human Factors in ComputingSystems (CHI), 2008.
[21] K. Patel, N. Bancroft, S. M. Drucker, J. Fogarty, A. J. Ko,and J. Landay. Gestalt: Integrated support forimplementation and analysis in machine learning. In UserInterface Software and Technology (UIST), 2010.
[22] I. Sanchez, T. Rocktaschel, S. Riedel, and S. Singh. Towardsextracting faithful and descriptive representations of latentvariable models. In AAAI Spring Syposium on KnowledgeRepresentation and Reasoning (KRR): Integrating Symbolicand Neural Approaches, 2015.
[23] D. Sculley, G. Holt, D. Golovin, E. Davydov, T. Phillips,D. Ebner, V. Chaudhary, M. Young, and J.-F. Crespo.Hidden technical debt in machine learning systems. InNeural Information Processing Systems (NIPS). 2015.
[24] E. Strumbelj and I. Kononenko. An efficient explanation ofindividual classifications using game theory. Journal ofMachine Learning Research, 11, 2010.
[25] C. Szegedy, W. Liu, Y. Jia, P. Sermanet, S. Reed,D. Anguelov, D. Erhan, V. Vanhoucke, and A. Rabinovich.Going deeper with convolutions. In Computer Vision andPattern Recognition (CVPR), 2015.
[26] B. Ustun and C. Rudin. Supersparse linear integer modelsfor optimized medical scoring systems. Machine Learning,2015.
[27] F. Wang and C. Rudin. Falling rule lists. In ArtificialIntelligence and Statistics (AISTATS), 2015.
[28] K. Xu, J. Ba, R. Kiros, K. Cho, A. Courville,R. Salakhutdinov, R. Zemel, and Y. Bengio. Show, attendand tell: Neural image caption generation with visualattention. In International Conference on Machine Learning(ICML), 2015.
[29] P. Zhang, J. Wang, A. Farhadi, M. Hebert, and D. Parikh.Predicting failures of vision systems. In Computer Visionand Pattern Recognition (CVPR), 2014.