why stocks go up and down - tpni engagemedia.instantcustomer.com/14378/0/58_pe.pdf · 292 why...
TRANSCRIPT

WHY STOCKS
GO UP AND DOWN
Fourth Edition
William H. Pike
Patrick C. Gregory
“The book you need to understand
other investment books”
BILL PIKE BOOKS
P.O. Box 620254 Newton, MA 02462-0254
www.WhyStocksGoUpandDown.com

By WILLIAM H. PIKE
PATRICK C. GREGORY
Copyright © 2013 William H Pike
ISBN 978-0-9892982-0-9
Cover Design: Leo Pike
Production assistance: Peter Rovick, Jeanne Cooper
ALL RIGHTS RESERVED
The text, graphs, charts, tables and figures in this publication, or any part thereof, may not be reproduced or transmitted in any form or by any means, electronic or mechanical, including photocopying, recording, scanning, storage in an information retrieval system, or otherwise, without prior written permission of the publisher.
This publication is sold with the understanding that the authors are not providing investment advice. The financial data interpretation and valuation methods discussed herein are just a few of the many ways to look at investments. Any of the investment analyses or valuation methods presented herein may not be applicable to individual securities, and may require further investment analysis in order to make an informed investment decision. Readers are encouraged to get other opinions and to consult an investment professional before investing.
Library of Congress Catalogue Number: 2013908933
Printed in the United States of America

291
18
Price/Earnings and other Evaluation Ratios: When Is a Stock Cheap or Expensive?
Ask a professional investor why stocks go up and down, and you will be told
that each situation is different. That statement is probably correct, but it is not
very useful. In this chapter, we will provide a framework for understanding and
evaluating stock price behavior. First, we will discuss the price-to-earnings
ratio, which is the method most used by investors to value a company’s stock.
We will then look at how to evaluate the relationship between a stock’s P/E
ratio and the company’s earnings growth rate. We will see that the market is a
discounting mechanism, which is Wall Street language meaning that stock
prices (and P/E multiples) often move up or down in anticipation of changes in
future earnings. We will also look at the price-to-cash-flow ratio, Enterprise
Value/EBITDA, and other metrics investors use to value a stock. Taken
together, these valuation methods will help the reader determine when a stock is
undervalued, fairly valued, or overvalued.
STOCK PRICES ARE RELATED TO A COMPANY’S LONG-TERM
EARNINGS OUTLOOK
A company’s ability to generate a profit over time is ultimately what creates
increasing shareholder value and will be reflected in a rising stock price. In
Chapter 4 we showed why the price of a share of stock can best be related to a
company’s earnings and the dividends it is currently paying, or potentially could
292 Why Stocks Go Up and Down
be paying in the future to its common stockholders. We saw in Chapter 16 that
the best measure of the company’s ability to pay dividends in the long run is its
ability to generate free cash flow – that is, cash flow after the company has met
its “survival” needs; debt repayment, maintenance level capital spending, and
preferred dividends. A company that has cash on the balance sheet can always
choose to pay a dividend, or a company can borrow money to pay its dividend,
but eventually the company’s cash gets spent, and the ability to borrow more
money dries up as the company takes on too much debt. Thus, again, the best
measure of the ability of a company to pay dividends in the long run is the
company’s ability to continuously generate enough earnings to meet all
company needs and have enough left over to pay dividends.
If a company is earning enough to pay a dividend, it may not matter whether
the company is actually paying the dividend. The stockholders benefit whether
there is a dividend or not. Whatever earnings are not being paid as dividends are
being retained in the company as reflected in the Retained Earnings account
(see Chapter 2), and can be spent on such things as new plant and equipment,
more sales and other personnel, new product development, and acquisitions of
other companies, all of which enable the company to grow faster. This can
result in even larger dividends in the future and a higher stock price.
This is why small, rapidly growing companies usually do not pay dividends.
These companies expect that by reinvesting earnings back into the company
now, it will lead to a higher level of earnings in the future. This expectation of
higher future earnings causes the stock to move up now as the market discounts
(anticipates) the higher future earnings.
As successful companies mature and generate more and more free cash flow,
they often times initiate a dividend. Since company management and directors
are best positioned to assess the company’s long term potential, their decision to
initiate a dividend sends a positive signal to the market, indicating their confi-
dence in the company’s future prospects and its ability to generate enough free
cash flow to fund its operations and pay a dividend to shareholders. Investors
like to see a steady – or even better, a steadily increasing dividend. In either
case, for small, rapidly growing companies, or for mature dividend paying
companies, it is the long term growth and free cash flow that drives stock prices.
THE PRICE / EARNINGS RATIO
The price/earnings ratio, or P/E, is probably the most commonly used tool for
determining whether a stock is cheap or expensive. The P/E ratio is simply the

Price/Earnings and Other Evaluation Ratios: When Is a Stock Cheap or Expensive? 293
stock’s current price per share divided by the earnings per share of the
company.1
This company is earning $2 a share and its stock is selling at $30 a share.
Thus, it has a P/E of 15x. That is, its stock is selling at 15 times its earnings per
share. On Wall Street, one might hear “the stock is selling at fifteen times.” The
words earnings per common share, or earnings per share, are assumed and do
not need to be said. One might also say, “The stock is selling at a 15 multiple,”
or “The market is capitalizing this company’s earnings at 15 times.” These all
say the same thing and are used interchangeably. Other abbreviations for the
price/earnings ratio are P.E.R., P.E., P-E, or just PE.
As we look at how price multiples are used in valuing a stock, we will use
EverConnect (EVCT) as our primary example. The company provides cloud
storage and related services, allowing customers to store their photos,
documents, and videos on the cloud, so that they can be accessed from any
computer, tablet, or phone with an internet connection. Some examples will use
other companies.
When talking about a company’s price/earnings ratio, it is important to
specify which year’s earnings you are talking about. With EverConnect stock at
$30 in September 2013 and the earnings forecasts shown in Table 18.1, we can
calculate EVCT’s P/E ratio for each year.
1 A common mistake that many new investors make when calculating P/E is to divide the
price per share by total net income (often times just referred to as “earnings”). To calculate
the P/E multiple, either divide price per share by earnings per share, or divide the company’s
total market capitalization by total net income; both will result in the same value for P/E.
$30
Earnings per share $2 = = = P/E ratio 15x
Stock price per share
EVCT @ $30/share 2012A 2013E 2014E 2015P
Estimated earnings per share (EPS) $1.82 $2.00 $2.20 $2.42
Price/earnings ratio (P/E) 16.5x 15.0x 13.6x 12.4x
Table 18.1 Calculating EVCT Price/Earnings Ratios
with EVCT Stock at $30/Share

294 Why Stocks Go Up and Down
In Table 18.1, the “A” beside 2012 means actual. That year has been
completed and earnings were $1.82 per share. The “E” beside 2013 and 2014
means estimated and the “P” beside 2015 means projected, implying a lower
confidence than the nearer years’ estimates. With EVCT stock at $30 in Sept. 2013 and EVCT’s 2012 reported earnings
of $1.82, we would say EVCT is selling at a P/E of 16.5 times trailing earnings.
Trailing means the P/E is based on the past year (2012) or past 4 quarters.
Other terminology you will see in P/E discussions include: “NTM” which
means the earnings expected over the Next Twelve Months, and “LTM” which
means earnings reported over the latest or Last Twelve Months. For instance, a
discussion of LTM EPS in early April of 2013 would include the earnings
reported for the first quarter of 2013 (the quarter ending on 3-31-13), and the
earnings for the last three quarters of 2012. In early April 2013, the NTM
estimate refers to an earnings estimate for the remaining three quarters of 2013
and the first quarter of 2014. The term “Trailing 12” means the last12 months (same thing as LTM).
You might be wondering, “Where do these estimates come from?” Investment banks such as Morgan Stanley, Goldman Sachs, and others, employ
analysts to follow stocks and issue earnings estimates and stock ratings on the
companies they follow. Many of these earnings estimates are available to the
public. All of the published estimates for a particular company are then aggre-
gated by data providers such as FactSet, Bloomberg, and Thomson, to arrive at
a consensus estimate. The consensus can be the average or the median estimate.
Consensus estimates are available from a variety of internet services such as
Yahoo! Finance. Some brokers like Ameritrade also provide consensus earnings
estimates for their clients. Other data providers such as FactSet, Bloomberg, and
Thomson, which are available for an expensive monthly subscription fee, have a
broader data base.2
2 Depending on the data source you are looking at, the time period for earnings estimates can
be described in a number of different ways. Some data providers will use the actual years, i.e.
2013, 2014, etc. Others will label the year FY1, FY2, and FY3. For example, if in September
2013, an investor were analyzing a company with a December 31 fiscal year end, the FY1
consensus estimate would be the estimate for December 31, 2013. Likewise, the FY2 estimate
would be the consensus earnings estimate for the year ended December 31, 2014. For a com-
pany that had a June 30 fiscal year, a P/E calculated in Sept. 2013 would use the EPS estimate
for the fiscal year end June 30, 2014 as FY1, 6/30 2015 as FY2, etc. While most companies
have a December 31 fiscal year end, each company has the discretion to select the fiscal year
end that makes the most sense. For instance, companies in the retail sector typically have a
January 31 year end so that the companies can better account for the large number of sales in
December and related returns in January.

Price/Earnings and Other Evaluation Ratios: When Is a Stock Cheap or Expensive? 295
Value investor and CEO of Berkshire Hathaway, Warren Buffet, has noted
that using a trailing P/E ratio (which incorporates past year’s earnings) is akin to
“investing by using the rearview mirror.”3 This is because the price of a stock
reflects investors’ expectations of future performance. For this reason,
forecasted earnings – rather than past year’s earnings – should be used when
looking at P/E ratios. When forecasted earnings is used, the calculated P/E is
referred to as a “forward P/E.” Looking again at Table 18.1, we would say EVCT is selling at 15.0 times
this year’s (2013) estimated earnings, 13.6 times next year’s estimated earnings, and 12.4 times 2015 projected earnings. Instead of writing “15.0 times,” we
usually just write “15x,” which is read, “15 times.” So we can say EVCT sells at
15x this year’s earnings, 13.6x next year’s earnings, and so on. The terminology
used thus far is very important to stock price discussions, and the reader should
become familiar with it quickly.
CHANGES IN EARNINGS OR THE P/E MULTIPLE, OR BOTH,
CAN DRIVE STOCK PRICE CHANGES
Changes in Earnings
If the price/earnings ratio stays the same over a period of time, then a stock’s move will be entirely the result of the changes in earnings. Look at
EverConnect, assuming it is September 2013.
EVCT is selling at 15x the current year’s (2013) earnings estimate. A year
later, in September 2014, if the P/E remains the same (15x) and earnings have
grown at 10%, then the stock price will be up 10%, from $30 to $33; the same
percentage as the earnings gain.
3 Mauboussin, Michael. More Than You Know: Finding Financial Wisdom in Unconventional
Places. New York: Columbia Business School Publishing, 2008.
2013 Sept. 2013 P / E EPS est. Stock Price
15x $2.00 $30 = x
Expected 2014 Sept. 2014
P / E EPS est. Stock Price
15x $2.20 $33 = x
296 Why Stocks Go Up and Down
If EVCT is a company that generally has steady earnings growth and little
change in its P/E, investors can expect the stock to go up or down in line with
the earnings. The stock price will still fluctuate over time because different
investors will have different earnings forecasts and different ideas of what
price/earnings ratio ought to be paid, and will choose different times of the year
to start putting the 15x P/E ratio on next year’s earnings.
Changes in P/E
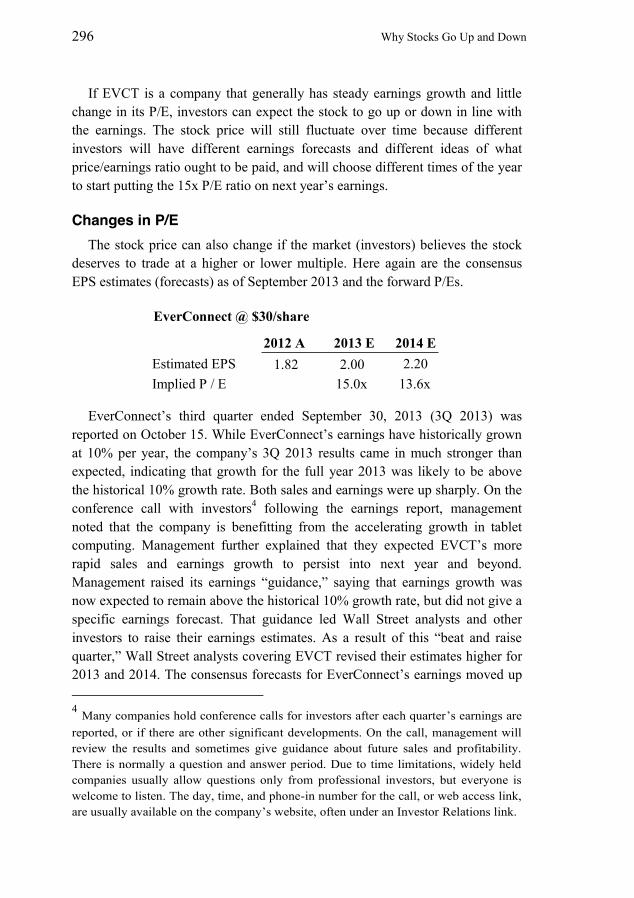
The stock price can also change if the market (investors) believes the stock
deserves to trade at a higher or lower multiple. Here again are the consensus
EPS estimates (forecasts) as of September 2013 and the forward P/Es.
EverConnect’s third quarter ended September 30, 2013 (3Q 2013) was reported on October 15. While EverConnect’s earnings have historically grown
at 10% per year, the company’s 3Q 2013 results came in much stronger than
expected, indicating that growth for the full year 2013 was likely to be above
the historical 10% growth rate. Both sales and earnings were up sharply. On the
conference call with investors4 following the earnings report, management
noted that the company is benefitting from the accelerating growth in tablet
computing. Management further explained that they expected EVCT’s more
rapid sales and earnings growth to persist into next year and beyond.
Management raised its earnings “guidance,” saying that earnings growth was
now expected to remain above the historical 10% growth rate, but did not give a
specific earnings forecast. That guidance led Wall Street analysts and other
investors to raise their earnings estimates. As a result of this “beat and raise quarter,” Wall Street analysts covering EVCT revised their estimates higher for
2013 and 2014. The consensus forecasts for EverConnect’s earnings moved up
4 Many companies hold conference calls for investors after each quarter’s earnings are
reported, or if there are other significant developments. On the call, management will
review the results and sometimes give guidance about future sales and profitability.
There is normally a question and answer period. Due to time limitations, widely held
companies usually allow questions only from professional investors, but everyone is
welcome to listen. The day, time, and phone-in number for the call, or web access link,
are usually available on the company’s website, often under an Investor Relations link.
2012 A 2013 E 2014 E
Estimated EPS 1.82 2.00 2.20
Implied P / E 15.0x 13.6x
EverConnect @ $30/share

Price/Earnings and Other Evaluation Ratios: When Is a Stock Cheap or Expensive? 297
to $2.18 for 2013 and $2.60 for 2014, and expectations for the company’s long-
term growth rate were increased from 10% per year to between 16% and 20%.
In November, a month after the earnings announcement, the stock moved up to
$40/share (see Table 18.2). As a result, the P/E on 2013 earnings expanded from
15.0x to 18.3x, and the P/E on the 2014 consensus estimate rose from 13.6x to
15.4x. The stock’s move from $30 to $40 reflects both higher earnings forecasts
and a higher multiple.
The higher P/E that investors are willing to pay for EverConnect in
November reflects their anticipation of more rapid growth in late 2013 and
beyond as a result of the company’s exposure to the rapid growth in the tablet
market EVCT serves. In other words, the company’s P/E multiple “expanded” to reflect the company’s higher growth profile.
In this example, EverConnect’s P/E multiple expanded rapidly as the stock
moved from $30 to $40 in a month following the 3Q earnings “upside” surprise. Investors did not wait for the higher expected growth in earnings per share to
occur. This anticipation by the market is a key concept that investors must
understand. We will return to it.
The higher P/E that investors were willing to pay for EVCT reflected
anticipation of more rapid growth beginning in late 2013 and beyond. It did not
reflect investors deciding that the $2 or $2.18 earnings estimates for 2013 by
themselves deserved a higher P/E. The higher P/E based on 2013 earnings was a
byproduct of the stock’s price move to reflect the more rapid growth expected in 2014 and beyond.
Changes in P/E generally occur much faster than changes in earnings.
Investors who buy stocks where they see slow, steady earnings growth in stable
Table 18.2 Effect of Better-than-Expected Earnings
Stock price, EPS estimates, and P/E before the quarter (as of Sept. 2013)
Stock Price EPS Est. P/E EPS Est. P/E
$30 $2.00 15.0x $2.20 13.6x
Stock price, EPS estimates, and P/E after the quarter (as of Nov. 2013)
Stock Price EPS Est. P/E EPS Est. P/E
$40 $2.18 18.3x $2.60 15.4x
2013 2014
2014 2013
298 Why Stocks Go Up and Down
companies can expect more or less steady stock performance relative to the
market. Investors who buy stock in companies where they anticipate changes in
the P/E ratio can generally expect faster and bigger stock price moves relative to
the market.
THE PRICE LEVEL OF A STOCK DOES NOT DETERMINE
WHETHER THE STOCK IS “HIGH” OR “LOW”
How often have you heard someone say, “I am not going to buy that stock.
The price is so high that I cannot buy enough shares to matter?” The following
example illustrates the fallacy in that statement.
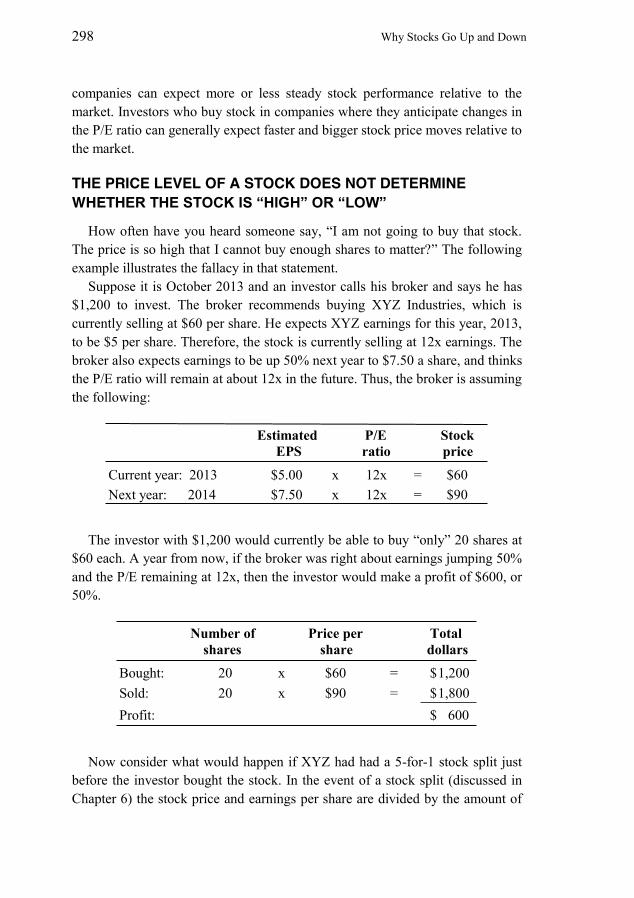
Suppose it is October 2013 and an investor calls his broker and says he has
$1,200 to invest. The broker recommends buying XYZ Industries, which is
currently selling at $60 per share. He expects XYZ earnings for this year, 2013,
to be $5 per share. Therefore, the stock is currently selling at 12x earnings. The
broker also expects earnings to be up 50% next year to $7.50 a share, and thinks
the P/E ratio will remain at about 12x in the future. Thus, the broker is assuming
the following:
The investor with $1,200 would currently be able to buy “only” 20 shares at
$60 each. A year from now, if the broker was right about earnings jumping 50%
and the P/E remaining at 12x, then the investor would make a profit of $600, or
50%.
Now consider what would happen if XYZ had had a 5-for-1 stock split just
before the investor bought the stock. In the event of a stock split (discussed in
Chapter 6) the stock price and earnings per share are divided by the amount of
Estimated P/E Stock
EPS ratio price
Current year: 2013 $5.00 x 12x = $60
Next year: 2014 $7.50 x 12x = $90
Number of Price per Total
shares share dollars
Bought: 20 x $60 = 1,200 $
Sold: 20 x $90 = 1,800 $
Profit: 600 $
Price/Earnings and Other Evaluation Ratios: When Is a Stock Cheap or Expensive? 299
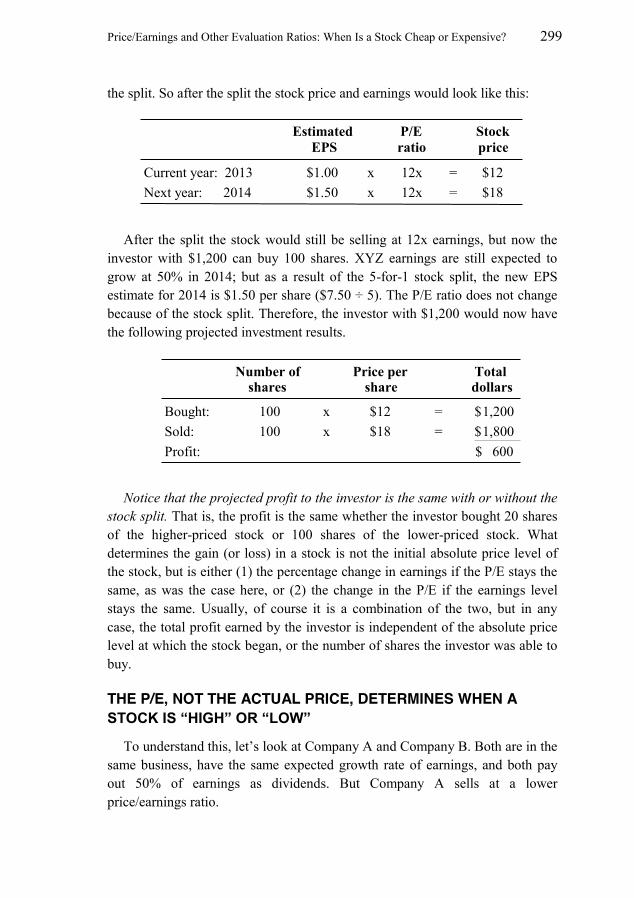
the split. So after the split the stock price and earnings would look like this:
After the split the stock would still be selling at 12x earnings, but now the
investor with $1,200 can buy 100 shares. XYZ earnings are still expected to
grow at 50% in 2014; but as a result of the 5-for-1 stock split, the new EPS
estimate for 2014 is $1.50 per share ($7.50 ÷ 5). The P/E ratio does not change
because of the stock split. Therefore, the investor with $1,200 would now have
the following projected investment results.
Notice that the projected profit to the investor is the same with or without the
stock split. That is, the profit is the same whether the investor bought 20 shares
of the higher-priced stock or 100 shares of the lower-priced stock. What
determines the gain (or loss) in a stock is not the initial absolute price level of
the stock, but is either (1) the percentage change in earnings if the P/E stays the
same, as was the case here, or (2) the change in the P/E if the earnings level
stays the same. Usually, of course it is a combination of the two, but in any
case, the total profit earned by the investor is independent of the absolute price
level at which the stock began, or the number of shares the investor was able to
buy.
THE P/E, NOT THE ACTUAL PRICE, DETERMINES WHEN A
STOCK IS “HIGH” OR “LOW”
To understand this, let’s look at Company A and Company B. Both are in the
same business, have the same expected growth rate of earnings, and both pay
out 50% of earnings as dividends. But Company A sells at a lower
price/earnings ratio.
Estimated P/E Stock
EPS ratio price
Current year: 2013 $1.00 x 12x = $12
Next year: 2014 $1.50 x 12x = $18
Number of Price per Total shares share dollars
Bought: 100 x $12 = 1,200 $
Sold: 100 x $18 = 1,800 $
Profit: 600 $

300 Why Stocks Go Up and Down
An investor with $100 could buy one share of Company A and get a 5%
yield on his money.
If the same $100 were used to buy two shares of Company B, the investor
would receive $2 in dividends ($1 per share), or a 2% yield on his investment.
Therefore, although a share of Company A (selling at $100) costs twice as
much as a share of Company B (selling at $50), we can say Company A is
really the cheaper or lower priced stock, because it is yielding more dividends
to the investor per dollar of investment. This higher dividend yield is a result of
Company A’s lower price/earnings ratio.
To see this another way, look again at the comparison of Company A and
Company B, but this time, assume Company B’s price/earnings ratio has fallen
from 25x to 10x, equal to that of Company A. Each company still has the same
EPS it had before, but since investors are now only willing to pay 10 times earn-
ings for Company B, its stock has fallen to $20. Let’s see how much dividend
the investor can get for a $100 investment in Company A or Company B.
Earnings per
share P/E
ratio
Price of
stock
Dividend per share at 50% of earnings
Yield to investor
per share of stock
Company A $10 10x $100 $5 5.0%
Company B 2 25x 50 1 2.0
$5 Dividend
$100 Investment = 5% 1 share Company A:
$2 Dividend
$100 Investment 2 shares Company B: = 2%
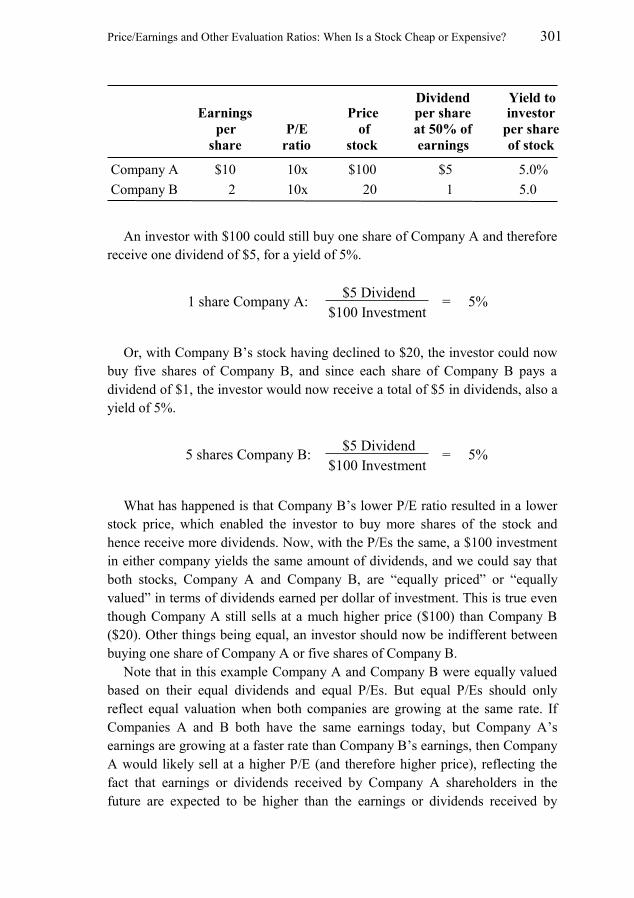
Price/Earnings and Other Evaluation Ratios: When Is a Stock Cheap or Expensive? 301
An investor with $100 could still buy one share of Company A and therefore
receive one dividend of $5, for a yield of 5%.
Or, with Company B’s stock having declined to $20, the investor could now
buy five shares of Company B, and since each share of Company B pays a
dividend of $1, the investor would now receive a total of $5 in dividends, also a
yield of 5%.
What has happened is that Company B’s lower P/E ratio resulted in a lower
stock price, which enabled the investor to buy more shares of the stock and
hence receive more dividends. Now, with the P/Es the same, a $100 investment
in either company yields the same amount of dividends, and we could say that
both stocks, Company A and Company B, are “equally priced” or “equally
valued” in terms of dividends earned per dollar of investment. This is true even
though Company A still sells at a much higher price ($100) than Company B
($20). Other things being equal, an investor should now be indifferent between
buying one share of Company A or five shares of Company B.
Note that in this example Company A and Company B were equally valued
based on their equal dividends and equal P/Es. But equal P/Es should only
reflect equal valuation when both companies are growing at the same rate. If
Companies A and B both have the same earnings today, but Company A’s
earnings are growing at a faster rate than Company B’s earnings, then Company
A would likely sell at a higher P/E (and therefore higher price), reflecting the
fact that earnings or dividends received by Company A shareholders in the
future are expected to be higher than the earnings or dividends received by
Earnings
per
share
P/E
ratio
Price
of
stock
Dividend per share
at 50% of
earnings
Yield to investor
per share
of stock
Company A $10 10x $100 $5 5.0%
Company B 2 10x 20 1 5.0
$5 Dividend
$100 Investment = 5% 1 share Company A:
$5 Dividend
$100 Investment 5 shares Company B: = 5%

302 Why Stocks Go Up and Down
Company B shareholders.
At this point we have talked about the P/E being related to the expected
earnings growth rate. The P/E an investor will be willing to pay for a stock is
also related to the risk, or his confidence in his projected earnings growth. For
example, an investor who is highly confident that a company will grow at a
10% annual rate would likely be willing to pay a higher P/E than another
investor who also thinks that the company’s most likely growth rate is 10%, but
is less confident in her estimate because she is worried that an unexpected
competitor may emerge, which increases the risk that her 10% earnings growth
forecast will not be met.
WHETHER A STOCK’S P/E IS “HIGH” OR “LOW” MAY BE BETTER
JUDGED ON FUTURE EARNINGS THAN PRESENT EARNINGS
If two companies were identical today except that they were expected to have
different earnings growth rates, the P/E would still be the best way to judge
which stock is cheaper, but now the comparison is more difficult. In this case, it
is more useful to determine which stock is cheaper by comparing the current
price to the expected earnings a few years out.
Let’s look again at EverConnect and compare it to its competitor
DisConnect. Both companies have EPS in the current year of $2 and a dividend
payout ratio of 50% of earnings. DisConnect’s product has become less popular
with consumers, and as a result, the company’s earnings are expected to grow at
a rate of only 6% a year despite the strong industry growth trends.
EverConnect’s earnings are expected to grow at 16% annually, so the earnings
growth progression will look as shown below. Note that in this example, the
earnings and earnings growth rates of EVCT are unrelated to the levels in the
prior EVCT examples.
* Y/Y = year over year, meaning this year’s period compared to the same period a year ago. In
this case we are comparing each full year to the prior full year. Y/Y can also denote a speci-
fied quarter compared to the same quarter a year earlier.
Table 18.3 High Growth vs. Low Growth Earnings Estimates
FY1 FY2 FY3 FY4 FY5
EverConnect $2.00 $2.32 $2.69 $3.12 $3.63
Y/Y Growth* + 16% + 16% + 16% + 16%
DisConnect $2.00 $2.12 $2.25 $2.38 $2.52
Y/Y Growth + 6% + 6% + 6% + 6%

Price/Earnings and Other Evaluation Ratios: When Is a Stock Cheap or Expensive? 303
Now, using today’s stock prices of $30 for DisConnect and $36 for
EverConnect, let’s compare the price/earnings ratio and the dividend yield for
the two companies this year, three years out, and five years out.
Based on the current year, DisConnect appears to be the cheaper stock. It
has a lower P/E and a higher dividend yield. But based on the expected EPS
and dividends 3 years out, the P/E ratios and dividend yield comparisons
look different.
Using the three-year-out EPS estimates and today’s stock price, it appears
that EverConnect and DisConnect are trading at about the same multiple of
13.4x, and have the same expected dividend yield. So it’s hard to say which
is the cheaper stock based on these measures.
Now let’s look five years out.
Looking at the expected P/E’s and yields five years out, would you rather own EVCT at $36 or DSCT at $30 today? With EVCT’s lower P/E and higher yield, and faster growth rate, EVCT is clearly the cheaper stock. If investors are
confident about their forecasts, we would expect EVCT to start moving higher
Current Year (2013)
Stock Price EPS Est. P/E
Current Dividend
(50% payout) Dividend
Yield
DisConnect $30 ÷ $2.00 = 15x $1 3.3%
EverConnect 36 ÷ 2.00 = 18x 1 2.8
Expected 3 years out
Stock Price EPS Est. P/E
Est. Dividend (50% payout)
Expected Yield
DisConnect $30 ÷ $2.25 = 13.3x $1.13 3.8%
EverConnect 36 ÷ 2.69 = 13.4x 1.35 3.8
Expected 5 years out
Stock
Price EPS Est. P/E
Est. Dividend
(50% payout)
Expected
Yield
DisConnect $30 ÷ $2.52 = 11.9x $1.26 4.2%
EverConnect 36 ÷ 3.63 = 9.9x 1.82 5.1%
304 Why Stocks Go Up and Down
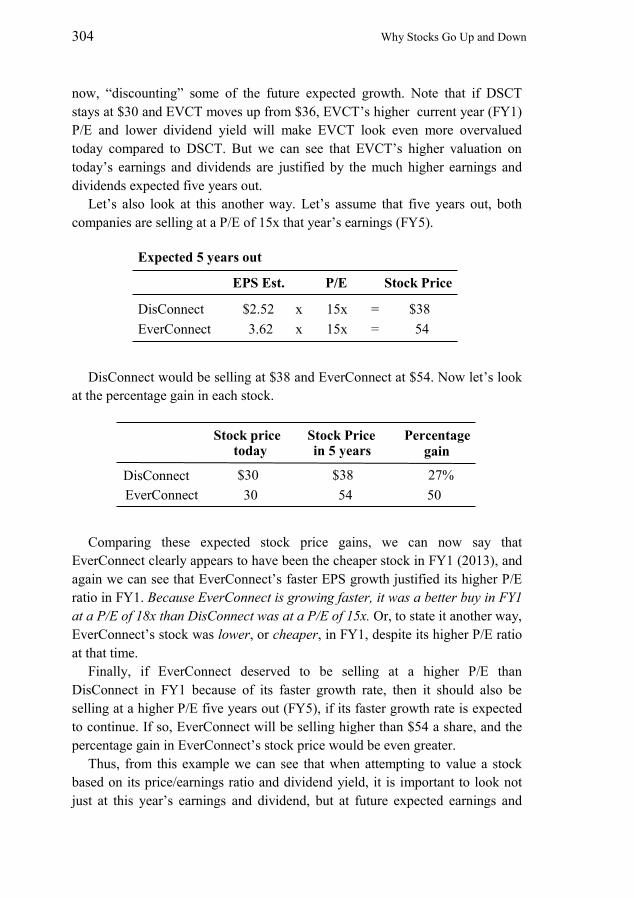
now, “discounting” some of the future expected growth. Note that if DSCT
stays at $30 and EVCT moves up from $36, EVCT’s higher current year (FY1)
P/E and lower dividend yield will make EVCT look even more overvalued
today compared to DSCT. But we can see that EVCT’s higher valuation on today’s earnings and dividends are justified by the much higher earnings and dividends expected five years out.
Let’s also look at this another way. Let’s assume that five years out, both
companies are selling at a P/E of 15x that year’s earnings (FY5).
DisConnect would be selling at $38 and EverConnect at $54. Now let’s look
at the percentage gain in each stock.
Comparing these expected stock price gains, we can now say that
EverConnect clearly appears to have been the cheaper stock in FY1 (2013), and
again we can see that EverConnect’s faster EPS growth justified its higher P/E
ratio in FY1. Because EverConnect is growing faster, it was a better buy in FY1
at a P/E of 18x than DisConnect was at a P/E of 15x. Or, to state it another way,
EverConnect’s stock was lower, or cheaper, in FY1, despite its higher P/E ratio
at that time.
Finally, if EverConnect deserved to be selling at a higher P/E than
DisConnect in FY1 because of its faster growth rate, then it should also be
selling at a higher P/E five years out (FY5), if its faster growth rate is expected
to continue. If so, EverConnect will be selling higher than $54 a share, and the
percentage gain in EverConnect’s stock price would be even greater.
Thus, from this example we can see that when attempting to value a stock
based on its price/earnings ratio and dividend yield, it is important to look not
just at this year’s earnings and dividend, but at future expected earnings and
Expected 5 years out
EPS Est. P/E Stock Price
DisConnect $2.52 x 15x = $38
EverConnect 3.62 x 15x = 54
Stock price today
Stock Price in 5 years
Percentage
gain
DisConnect $30 $38 27%
EverConnect 30 54 50

Price/Earnings and Other Evaluation Ratios: When Is a Stock Cheap or Expensive? 305
dividends as well.
A few words of caution are needed here. First, forecasting the future with
precision is impossible. The best that we – or any analyst – can do is look at
available information and using our experience and judgment, make informed
forecasts. But even without precision, our forecasts about earnings, and
reasonable judgments about P/Es, enable us to establish parameters about stock
prices and valuation which are useful in our decision making.
THERE IS NO SUCH THING AS A CORRECT PRICE/EARNINGS
RATIO, BUT THERE ARE WAYS TO HELP DETERMINE AN
APPROPRIATE LEVEL
We just saw that if two companies are growing at different rates, the
company with the faster growth rate should have the higher P/E. But there is no
absolute measure of what P/E an investor should pay for a given growth rate.
There have been many studies attempting to determine what P/E should be paid
for a given growth rate of earnings or dividends, but there have always been too
many “other” factors for such studies to be very useful. This does not mean that
investors should not try to compare growth rates to P/Es. Studying this
relationship for a number of stocks you follow is an excellent way to increase
your comfort level with those P/Es and stock prices, even though you probably
will not find the perfect formula.
In practice, most investors do not try to calculate a mathematically “correct” P/E. Rather, by watching the prices, earnings, and P/Es of a group of stocks
over a period of time, they develop a feel for how the stocks behave, both
individually and compared to each other.
In this section, we present three ways to look at P/Es to help judge what P/E
appears reasonable for a given stock. First, we look at the company’s historical
P/E ratios, i.e. what were the high and low P/Es in prior years? If the company’s
past growth rate is expected to be about the same in the future, and if market
conditions in general are about the same, then the past P/E ratios may be a good
guide in helping to decide what P/E should be appropriate today. One should
then consider what might be different to cause the stock to sell at a higher or
lower P/E today. That is, what might be happening to the company, or the
industry it serves, or in the economy in general, that could cause an increase or
decrease in the company’s growth rate or other factors that impact the P/E?
What might happen to change investors’ confidence that the forecasted growth
rate can be achieved? For example, if a major competitor went out of business,
investors might not only expect a company’s future growth rate to be faster, but
in addition, investors would have more confidence in their forecasts of company

306 Why Stocks Go Up and Down
earnings because there is less fear of competition. Conversely, if a company
were dependent on a raw material that was getting harder to obtain and subject
to steep price increases, then investors’ confidence in their earnings estimates
would be lower and the stock might sell at a lower P/E.
A second step in trying to determine a P/E for a company is to look at the
P/Es of similar companies and then consider what is different between the
companies and why one should have a higher or lower P/E than the others.
Looking at the computer software industry for example, some small companies
with one or two good products might be growing very rapidly initially, but
when they get bigger they will find themselves competing against the giant
software companies that have a larger market share. As the smaller companies
find it difficult to compete successfully against the larger, dominant companies,
their growth might come to an abrupt halt. So the smaller companies, although
growing rapidly now, may deserve a lower P/E than their current growth rate
would suggest. Many small software companies encountering this problem
ultimately sell themselves to a large software company. So investors in small
software companies should look at recent software company buyouts to see
what was the typical P/E or range of P/Es that the acquiring company paid.
The third step is to compare the P/E of the stock you are analyzing to the P/E
of the stock market as a whole. P/Es are affected by broad market conditions.
When interest rates are low, P/Es in general tend to be high. An old rule of
thumb says that at times when interest rates are low, the P/E should be twice the
expected growth rate of earnings. For example, if a company’s earnings had
been growing at a rate of 10% a year and were expected to continue to grow at
that rate, a P/E of 20x would be considered reasonable. Of course, companies
never grow at exactly the same rate each year, and in fact growth rates often
come in spurts and then slow down. So even if a company’s growth rate had
“averaged” 10% a year, investors will still have to make a judgment as to
whether they feel comfortable paying a P/E of twice the growth rate.
When interest rates are high, stocks generally sell at lower P/Es, often at P/Es
that are less than their growth rate. For example, a company that had been
growing at 10% a year might trade at a P/E of 9x or less.
In sum, investors trying to decide what P/E to pay for a stock, or at what P/E
to sell the stock, can look at: (1) the company’s historical P/Es, (2) comparable
companies’ P/Es and (3) relative P/Es, as a guide. They should also look at
broad market trends to see if P/Es in general are rising or falling. By comparing
past conditions with current conditions, investors will often have a good basis
for determining an appropriate price/earnings ratio today. The next three
sections will look at the three types of P/E analyses listed above.
Price/Earnings and Other Evaluation Ratios: When Is a Stock Cheap or Expensive? 307
HISTORICAL P/E MULTIPLE ANALYSIS: WHEN IS A STOCK
“LOW” OR “HIGH”? (CHEAP OR EXPENSIVE)
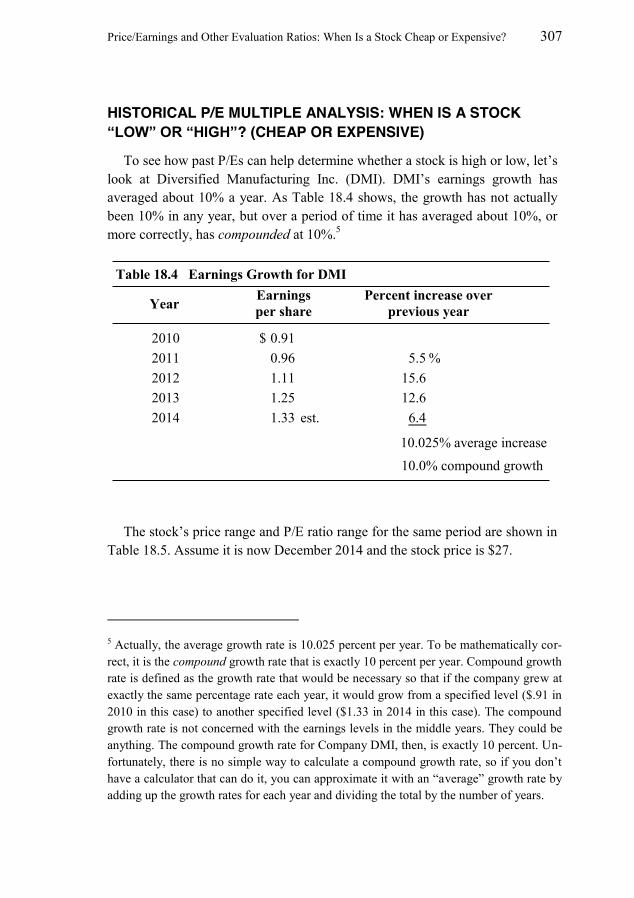
To see how past P/Es can help determine whether a stock is high or low, let’s look at Diversified Manufacturing Inc. (DMI). DMI’s earnings growth has
averaged about 10% a year. As Table 18.4 shows, the growth has not actually
been 10% in any year, but over a period of time it has averaged about 10%, or
more correctly, has compounded at 10%.5
The stock’s price range and P/E ratio range for the same period are shown in
Table 18.5. Assume it is now December 2014 and the stock price is $27.
5 Actually, the average growth rate is 10.025 percent per year. To be mathematically cor-
rect, it is the compound growth rate that is exactly 10 percent per year. Compound growth
rate is defined as the growth rate that would be necessary so that if the company grew at
exactly the same percentage rate each year, it would grow from a specified level ($.91 in
2010 in this case) to another specified level ($1.33 in 2014 in this case). The compound
growth rate is not concerned with the earnings levels in the middle years. They could be
anything. The compound growth rate for Company DMI, then, is exactly 10 percent. Un-
fortunately, there is no simple way to calculate a compound growth rate, so if you don’t have a calculator that can do it, you can approximate it with an “average” growth rate by adding up the growth rates for each year and dividing the total by the number of years.
Table 18.4 Earnings Growth for DMI
Year
2010 $ 0.91
2011 0.96 5.5 %
2012 1.11 15.6
2013 1.25 12.6
2014 1.33 est. 6.4
Earnings
per share
Percent increase over
previous year
10.025% average increase
10.0% compound growth

308 Why Stocks Go Up and Down
Table 18.5 shows that the stock price has typically fluctuated in a wide range
each year, and the P/E has reached at least 25x each year and has typically been
as low as 15x–16x each year. This does not necessarily mean that it will be this
high or this low each year, or that it cannot go higher or lower in any future
year, but the historical range is still a good first guidepost to forecasting the
future P/Es.
With the stock at $27 in December 2014, investors will probably be focusing
on 2015 earnings. This is because investors typically buy a stock today focusing
on where they think it will be 6 to 12 months in the future. With 2015 EPS
estimated at $1.60, and the stock at $27, it would then be selling at 16.9x 2015
earnings and would look “low” – that is, it is selling at the low end of its
historical P/E range. Let’s try to estimate the upside potential of the stock, and
the downside risk.
Unless the stock market is depressed in 2015, or there is some development
suggesting a decline in the company’s expected growth rate, it is reasonable to
assume, based on the stock’s history, that at some point during the year the
stock price will reach 25x earnings or more. This suggests the stock could reach
as high as $40 per share.
With the stock currently at $27, we can see a possible $13 upside move to
$40, or a 48% gain. On the other hand, the downside risk, based on the
historical P/E range, is that the stock could get as low as 15x 2015 earnings.
Table 18.5 Stock Price Range and P/E Ratio Range for DMI
Price P/E
EPS High Low High Low
2010 $ 0.91 $23 – $13 25x – 14x
2011 0.96 27 – 15 28x – 16x
2012 1.11 28 – 17 25x – 15x
2013 1.25 34 – 20 27x – 16x
2014 1.33 est. 37 – 23 28x – 17x
2015 1.60 est.
$1.60 25x $40
2015 EPS estimate Assumed P / E Expected stock price x =
2015 EPS estimate Assumed P / E Expected stock price
$1.60 15x $24 x =

Price/Earnings and Other Evaluation Ratios: When Is a Stock Cheap or Expensive? 309
Thus, we can see a downside risk of $3, to $24, or an 11% loss. Looking at
an expected upside gain of 48% and a downside risk of only 11%, the
reward/risk ratio is 48% / 11%, about 4:1, so the stock looks “low,” or attractive
based on historical P/Es, and should be bought.
Now let’s assume the stock has appreciated to $32 by March 2015. Assume,
also, that the 2014 earnings came in at $1.35, slightly above the $1.33 estimate,
and the $1.60 estimate for 2015 remains unchanged.
At this point, the stock is selling at 20x estimated 2015 earnings, about the
middle of its historical P/E range of 16x–25x, and the expected gain and risk
appear to be as follows:
With the stock at $32, the appreciation potential now appears to be about $8,
a 25% gain, and the downside risk is about $6, from $32 to $26, a 19% loss.
The reward/risk ratio is now 25%/19%, or 1.3x, a much less attractive ratio than
in December.6 One might now say the stock is fairly valued based on 2015
estimated earnings.
If the market as a whole was expected to fall, DMI might be expected to fall
with it, and the stock should be sold. But if the market were expected to rise, the
stock should be held, or more purchased, because in a strong up market, stocks
often go to the high end of their historical P/E range, or higher.
By August 2015 the stock reached $41, a new high. The earnings estimate
for 2015 was still $1.60, so the stock was selling at 26x expected 2015 earnings,
near the high end of its historical range. But at this point, even if the stock went
6 Some investors look for a reward/risk ratio of 3:1 or 4:1 when evaluating potential “longs”
(i.e. stocks they want to hold.)
EPS Price P/E
2014 $ 1.35 $32
2015 $ 1.60 est. $32 20.0x
Expected P/E
Expected price
Gain or loss
from $32
Upside: $ 1.60 est. x 25x = $40 $8 gain
Risk: $ 1.60 est. x 16x = $26 $6 loss
2015 EPS
310 Why Stocks Go Up and Down
to 28x earnings, or $45 per share, there would only be $4 further upside per
share, whereas the downside risk from $41 could be to 15x earnings, or $24 per
share, a $17 decline ($41 – $24 = $17) if the market went down, or if some
unexpected bad news came out about the company. The likelihood of a decline
all the way to $24 does not seem too great, however, since by early fall
investors may begin to focus on 2016 earnings, which, if higher, will make the
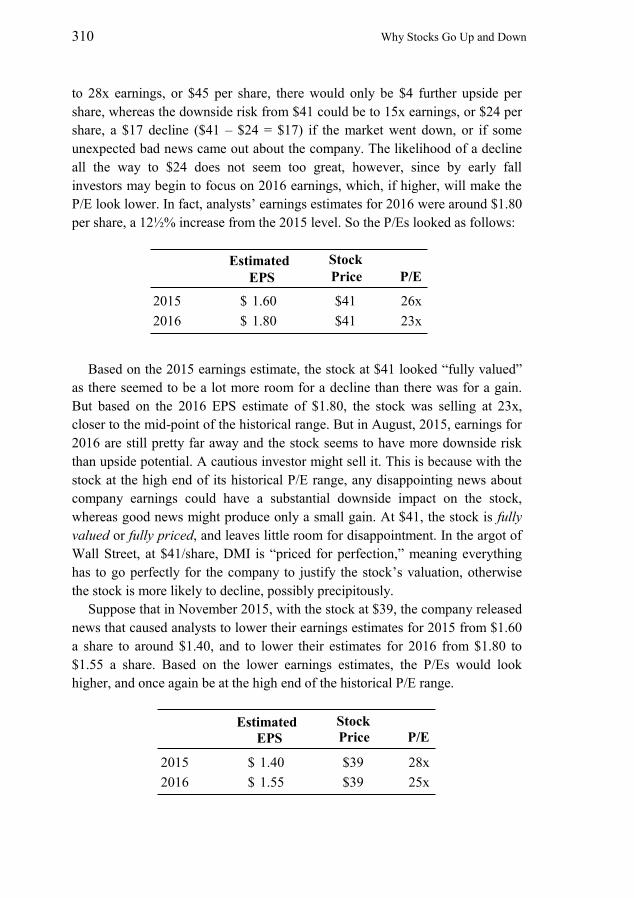
P/E look lower. In fact, analysts’ earnings estimates for 2016 were around $1.80
per share, a 12½% increase from the 2015 level. So the P/Es looked as follows:
Based on the 2015 earnings estimate, the stock at $41 looked “fully valued” as there seemed to be a lot more room for a decline than there was for a gain.
But based on the 2016 EPS estimate of $1.80, the stock was selling at 23x,
closer to the mid-point of the historical range. But in August, 2015, earnings for
2016 are still pretty far away and the stock seems to have more downside risk
than upside potential. A cautious investor might sell it. This is because with the
stock at the high end of its historical P/E range, any disappointing news about
company earnings could have a substantial downside impact on the stock,
whereas good news might produce only a small gain. At $41, the stock is fully
valued or fully priced, and leaves little room for disappointment. In the argot of
Wall Street, at $41/share, DMI is “priced for perfection,” meaning everything
has to go perfectly for the company to justify the stock’s valuation, otherwise
the stock is more likely to decline, possibly precipitously.
Suppose that in November 2015, with the stock at $39, the company released
news that caused analysts to lower their earnings estimates for 2015 from $1.60
a share to around $1.40, and to lower their estimates for 2016 from $1.80 to
$1.55 a share. Based on the lower earnings estimates, the P/Es would look
higher, and once again be at the high end of the historical P/E range.
Stock
Price P/E
2015 $ 1.60 $41 26x
2016 $ 1.80 $41 23x
Estimated
EPS
Stock
Price P/E
2015 $ 1.40 $39 28x
2016 $ 1.55 $39 25x
Estimated
EPS

Price/Earnings and Other Evaluation Ratios: When Is a Stock Cheap or Expensive? 311
In addition, having been surprised by the company announcements in
November, investors would have a lot less confidence in their earnings
estimates, and may only be comfortable buying or holding the stock at a lower
P/E than previously. Also, the growth rate of earnings would suddenly look a lot
lower, also causing investors to revise downward the P/E they might be willing
to pay for the stock. At this point we might say the stock appears to be
overpriced based on the new 2015 and 2016 earnings forecasts, and should be
sold.
The lowering of the earnings forecasts in November points to a problem with
using past year’s P/E as a guide to the future. Recall that the stock reached a
high of $41 in August when 2015 earnings were forecast to be $1.60. But
assuming that 2015 earnings eventually come in at $1.38, the historical record
would show the high price for the year of $41 and the actual EPS of $1.38,
which implies a price/earnings ratio of 29.7x. This would appear to be a new
high P/E. But investors did not actually think they were paying 29.7x earnings
for the stock. At the time the stock reached $41, the 2015 earnings forecast was
$1.60 and the apparent P/E was 25.6x. The historical record does not reflect the
change in investors’ EPS forecasts. For this reason, historical P/Es, especially
the high and low extremes, must be treated cautiously.
We can now give one definition, with qualifications, of low and high.
Definitions
x Low—When a stock is selling at the lower end of its normal or expected
P/E range (or below), it is low, or undervalued, underpriced or cheap.
x High—When a stock is selling at the upper end of its normal or expected
P/E range (or higher), it is high, or overvalued, overpriced, or expensive.
The qualifications are these. The historical P/E range of a stock can only be
considered a reasonable guide to the future P/E range if: (1) the growth rate of
earnings is expected to remain about the same as it was; (2) nothing has
changed in the company or the industry it serves, or the economy in general to
affect one’s confidence in his earnings estimates; and (3) the whole market’s
evaluation of P/Es has not changed. That is a big set of “ifs,” and reminds us
that there are no simple quantitative rules for stock selection. Investing is
arguably more an art than a science.
In the case of DMI, the stock sold in a normal (excluding extremes) P/E
range of 16x–25x while it was achieving a growth record averaging 10% a year.
When it briefly looked like the company was going to achieve a higher growth
rate, its P/E tended to be higher, 25x–28x. If the growth rate is expected to

312 Why Stocks Go Up and Down
return to about 10%, the P/E range of 16x–25x might again be considered more
likely. But if the recent lowering of earnings estimates reflects problems at the
company which are expected to persist, then there may be a decline in the
growth rate for an extended period, and the stock may be more likely to trade at
the lower end of the P/E range, perhaps 14x–17x, or even lower. Over a few
years the stock could establish a new P/E range of perhaps 10x–18x, rendering
the old 16x–25x range no longer relevant.
Words such as overpriced, fully valued, undervalued, cheap, and the like, are
constantly used on Wall Street and are best thought of in terms of the
price/earnings ratio, or in some cases, as we will see later, in terms of the
price/cash flow ratio or EV/EBITDA ratio. The distinctions between overvalued
and fairly valued, or fairly valued and undervalued, are fuzzy as you can see
from the preceding example. Nevertheless, Table 18.6 might help put some
perspective on these words.
Again, these ranges are subjective. Another writer might say the stock is
overpriced, or overvalued, only above 28x earnings, undervalued only below
17x earnings, and so on.
A would-be investor once asked a Wall Street magnate how to make money
in the stock market. The magnate replied, “Buy low and sell high.” The would-
Table 18.6 Historical Record for DMI
Price P/E
EPS High Low High Low
2010 $ 0.91 $23 – $13 25x – 14x
2011 0.96 27 – 15 28x – 16x
2012 1.11 28 – 17 25x – 15x
2013 1.25 34 – 20 27x – 16x
2014 1.33 41 – 23 30x – 17x
P/E range Evaluation
Over 26 ……. High, overpriced, overvalued
26–23 ……… Fully priced, fully valued
23–19 ……… Fairly priced, fairly valued
19–16 ……… Low, underpriced, undervalued
16–14 ……… Cheap
Below 14 Very Cheap!
Price/Earnings and Other Evaluation Ratios: When Is a Stock Cheap or Expensive? 313
be investor walked away muttering, “Yes, but how do I know what is low and
what is high except in retrospect, and then it is too late.” In light of this analysis,
it is evident that the would-be investor misinterpreted the answer. What the
magnate meant was this: It is best to buy a stock only if it is selling at the lower
end of its P/E range relative to your best estimate of earnings. Then the
probability of price appreciation as the future unfolds is greater than the
probability of decline. If a stock is selling at the upper end of its historical P/E
range, perhaps you should not buy it, or should sell it if you own it, not because
it cannot go higher, but because the downside in the event of bad news is greater
than the upside if all goes well.
COMPARING THE P/E’S OF SIMILAR COMPANIES
In addition to assessing whether a stock is expensive or cheap by looking at
the current multiple relative to its historical range, we can also look at the
company’s current multiple relative to that of other, similar companies. In The
Little Book of Valuation, Aswath Damodaran notes that “a comparable firm is
one with cash flows, growth potential, and risk similar to the firm being
analyzed.”7 Realistically, one is unlikely to find a comparable company that
meets all of these requirements, so most investors find it easier to make a list of
peers; companies in the same industry that are somewhat similar in their
characteristics. Then, after comparing their P/E’s, one can look at the
differences between the companies to try to explain why the P/E’s were
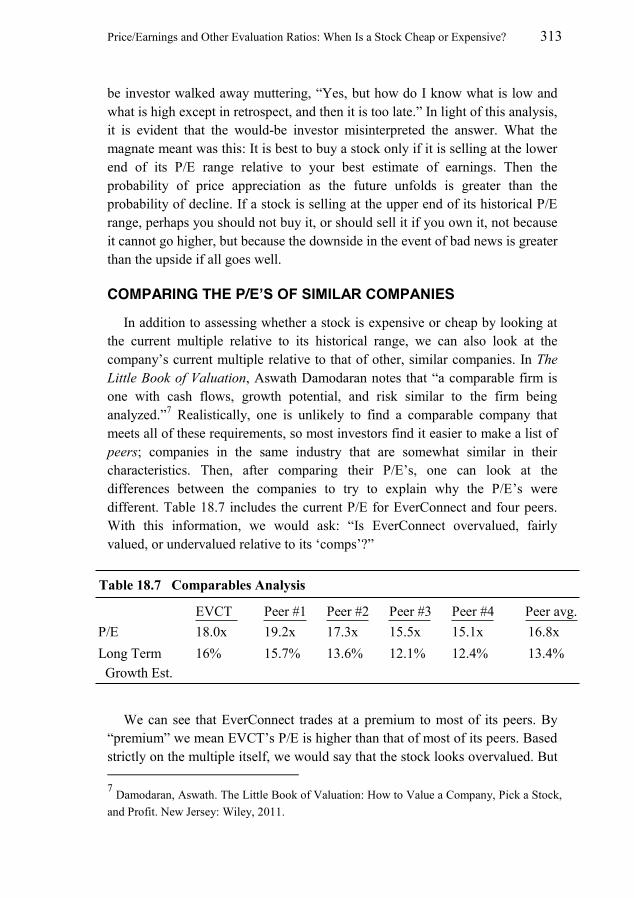
different. Table 18.7 includes the current P/E for EverConnect and four peers.
With this information, we would ask: “Is EverConnect overvalued, fairly
valued, or undervalued relative to its ‘comps’?”
We can see that EverConnect trades at a premium to most of its peers. By
“premium” we mean EVCT’s P/E is higher than that of most of its peers. Based
strictly on the multiple itself, we would say that the stock looks overvalued. But
7 Damodaran, Aswath. The Little Book of Valuation: How to Value a Company, Pick a Stock,
and Profit. New Jersey: Wiley, 2011.
Table 18.7 Comparables Analysis
EVCT Peer #1 Peer #2 Peer #3 Peer #4 Peer avg.
P/E 18.0x 19.2x 17.3x 15.5x 15.1x 16.8x
Long Term 16% 15.7% 13.6% 12.1% 12.4% 13.4%
Growth Est.

314 Why Stocks Go Up and Down
this would be a naïve conclusion. We need to look at what factors are driving
the P/E multiple. While a stock’s P/E multiple is influenced by many factors,
we have established that the dominant factor is expected future earnings growth.
(This is why some growth investors argue that the most expensive (highest
P/Es) firms are often the best investments.) Therefore, any good relative value
comparison will include growth rate estimates for the companies being
compared. Table 18.7 also includes the expected long-term growth rate for each
company.8 With the expected growth rates, we can now compare the P/Es of
different companies, adjusting for different expected growth rates. This can be
done with the price/earnings-to-growth (or PEG) ratio, which is calculated by
dividing the P/E multiple by the expected growth rate. As you would expect,
different investors will have different growth rate expectations, and therefore
come to different figures for the PEG ratio, and therefore, about stock valuation.
Often times, investors will simply use the consensus long-term growth estimate
provided by the published services covering the stock.
Using consensus estimates for long-term growth, the PEG ratio for
EverConnect and the PEG ratio for the peer group are as follows:
8 Where do long-term expected growth rates come from? As discussed earlier, on Wall Street,
many investment banks, brokerage firms and advisory services have investment analysts who
spend years analyzing an industry and the companies in it. For example, an analyst following
the pharmaceutical industry will look at all the major drugs a company sells, make an estimate
of the annual sales and profitability of each, how many years each has left on patent, what new
drugs are being developed (that the company is willing to talk about) and what is the
competition, market size, and expected market share for the new drugs, and importantly, the
probability that those drugs will get FDA approval to be sold. Based on his or her research and
years of experience following the industry, he or she will come up with an expected earnings
growth rate. Data gathering firms such as FactSet, Bloomberg and others can pull together all
the publicly available forecasts of a company’s expected growth and publish a “consensus” or average of the forecasts. Expected growth rates for companies can often be found in public
libraries in services such as The Value Line, or do a Google search for “Abbott Labs growth
rate”, or similar.
P/E ratio 18.0
EPS Growth Rate 16.0 = = = 1.13 PEG EverConnect
Average P/E 16.8
Average Growth Rate 13.4 PEG Industry = = = 1.26

Price/Earnings and Other Evaluation Ratios: When Is a Stock Cheap or Expensive? 315
In this case, EverConnect’s PEG ratio (1.13) is lower than that of the peer
group (1.26). This indicates that while EverConnect has a higher P/E multiple
than the group, the stock may be undervalued after adjusting for the
EverConnect’s faster expected growth rate. This assumes that the companies
being compared are all perceived to have equivalent levels of risk (a very
subjective factor). It also assumes that P/E’s are in fact higher for companies
with faster growth rates (which isn’t always true). Thus, the PEG ratio, like P/E
or other valuation metrics, is not a perfect measure. As we have said before,
there is NO perfect measure, but experience watching these valuation ratios,
along with quarterly earnings reports, changes in management’s guidance, and
changes in consensus estimates (i.e., earnings estimate revisions), as well as
company and industry news, will help you make more informed decisions.
At this point, we have only talked about the P/E being related to the expected
earnings growth rate. The P/E an investor will be willing to pay for a stock is
also related to many other factors, quantitative as well as subjective; how well
management is regarded, product reputation, the company’s market share and niche within the industry, geographic exposure, debt ratios, return on asset
ratios (see Chapter 4), operating margins, and more. Many investors set up a
matrix, listing the companies across the top, and company characteristics such
as those just listed, down the side. After filling in the spaces, you will often see
patterns emerging which correlate well with the companies’ P/E’s.
USING RELATIVE MULTIPLES
To evaluate a company relative to the market, some investors use a relative
P/E multiple; that is, they compare the P/E of their stock to the P/E of the
market. For the P/E of the market, investors typically use the P/E for a readily
available index such as the Standard and Poor’s 500 Index or the Russell 1000
Index. For example, the relative P/E – commonly referred to as the relative
multiple - for EverConnect, using the S&P 500 index, is shown below. The P/E
for the S&P 500 index is currently 14.3x.9
9 The P/E for an index is typically calculated by dividing the index price by the combined
earnings of all the companies. For example, the S&P 500 index as well as the trailing twelve
months combined S&P 500 earnings is readily available in the Wall Street Journal and on Ya-
hoo! Finance.
P/E ratio EverConnect 18.0x
P/E ratio S&P 500 14.3x Relative P/E = = = = 26% premium 1.26