wic itfps-2 second year report...wic infant and toddler feeding practices study-2: second year...
TRANSCRIPT

WIC Infant and Toddler Feeding Practices Study-2: Second Year Report
Authors
Christine Borger, Ph.D. Nancy Weinfield, Ph.D. Thea Zimmerman, M.S., R.D. Crystal MacAllum, Ph.D. Jill DeMatteis, Ph.D. Shannon Whaley, Ph.D.
Lorrene Ritchie, Ph.D., R.D. Linnea Sallack, M.P.H, R.D. Lauren Au, Ph.D., R.D. Frank Jenkins, Ph.D. Laurie May, Ph.D.
April 2018
Prepared for: Courtney Paolicelli, DrPH, R.D. Office of Policy Research Food and Nutrition Service, USDA 3101 Park Center Drive Alexandria, VA 22302 (703) 305-2098
Prepared by: Westat An Employee-Owned Research Corporation® 1600 Research Boulevard Rockville, Maryland 20850-3129 (301) 251-1500

USDA is an equal opportunity provider, employer, and lender.
WIC Infant and Toddler Feeding Practices Study-2: Second Year Report
April 2018
Task Order Number: AG-3198-K-11-0073
Authors: Christine Borger, Ph.D., Westat Nancy Weinfield, Ph.D., Westat Thea Zimmerman, M.S., R.D., Westat Crystal MacAllum, Ph.D., Westat Jill DeMatteis, Ph.D., Westat Shannon Whaley, Ph.D., PHFE WIC Lorrene Ritchie, Ph.D., R.D., Nutrition Policy Institute, Division of Agriculture and Natural Resources,
University of California Linnea Sallack, M.P.H., R.D., Altarum Institute Lauren Au, Ph.D., R.D., Nutrition Policy Institute, Division of Agriculture and Natural Resources, University of
California Frank Jenkins, Ph.D., Westat Laurie May, Ph.D., Westat
Submitted by: Westat 1600 Research Blvd. Rockville, MD 20850-3129
Submitted to: Courtney Paolicelli, DrPH, R.D. Office of Policy Support Food and Nutrition Service, USDA 3101 Park Center Drive Alexandria, VA 22302

WIC Infant and Toddler Feeding Practices Study-2: Second Year Report iii
Acknowledgement
The WIC Infant and Toddler Feeding Practices Study (ITFPS-2) is being conducted under the direction of the Office of Policy Support in the Food and Nutrition Service, USDA. We would like to thank Jay Hirschman, Melissa Abelev, Reneé Arroyo-Lee Sing, Tameka Owens, Allison Magness, Courtney Paolicelli, Danielle Berman, Kelley Scanlon, Anne Bartholomew, Valery Soto, Lisa Southworth, and Patricia MacNeil for their guidance and support of the study. Study recruitment would not have been possible without the generous support of the 27 WIC State Agencies and the 80 WIC sites within those states and territories. Their cooperation and collaboration with the Westat team resulted in a highly successful recruitment phase and high response rates for the subsequent interviews. Suzanne McNutt, who led the study at Westat from its inception until 2015, is the source of many of the study’s strengths and innovations. Her leadership and its lasting effects allow the study to continue to flow and reach its goals. We are also grateful to Dr. Gail Harrison (University of California, Los Angeles) for her insightful contributions to the study during her tenure as Principal Investigator of the study from its inception in 2011 until 2015. The Peer Advisory Panel offered valuable guidance on study design and analysis issues. The Advisory Panel members, experts in the fields of child development, infant feeding, and WIC research, included Maureen Black (Department of Pediatrics and Epidemiology, University of Maryland); Sally Findley (Columbia University Population Center); Larry Grummer-Strawn (formerly of the Division of Nutrition, Physical Activity, and Obesity, Centers for Disease Control and Prevention); Suzanne Murphy (Cancer Research Center of Hawaii, University of Hawaii); Zoë Neuberger (Center on Budget and Policy Priorities); Peggy Trouba (State WIC Director, Nebraska Department of Health and Human Services); and Pat Crawford (Nutrition Policy Institute, Division of Agriculture and Natural Resources, University of California). At Westat, Beth Mittl played a key role in coordinating the systems development and data management activities. Brenda Sun, a statistical programmer, supported the analytic work. Bibi Gollapudi managed the day-to-day recruitment activities. Chris Manglitz assisted with analysis. Through the Westat Telephone Research Center several staff members led computer-assisted telephone interview (CATI) activities, including Karen Molloy (CATI instrument design), Shannon Evans (CATI instrument development), and Peggy Corp (CATI training and operations).

WIC Infant and Toddler Feeding Practices Study-2: Second Year Report iv
Human subjects’ protections for the study are overseen by 17 Institutional Review Boards (IRBs), including: Westat; state Department of Health IRBs in CA, CT, FL, GA, LA, MD, MI, NY, OH, OK, PA, SC, TN, and TX; and local IRBs at Arrowhead Regional Medical Center in San Bernadino, CA, and Los Angeles Biomedical Research Institute at Harbor-UCLA Medical Center, CA. We appreciate the effort these IRBs have made in overseeing human subjects’ protections. We also appreciate the cooperation of all participating State Departments of Health in providing WIC administrative data for the study. Use of these data does not imply that the IRBs, State Departments of Health, or WIC State Agencies and sites agree or disagree with any presentations, analyses, interpretations or conclusions in this report.

WIC Infant and Toddler Feeding Practices Study-2: Second Year Report v
Table of Contents
Chapter Page
Acknowledgement .............................................................................................. iii WIC ITFPS-2 Second Year Report Executive Summary ............................. xx
Overview of Study Goals and Methods .......................................................... xx Work, School, Child Care, and Breastfeeding ................................................ xxii
Work and Breastfeeding ....................................................................... xxii Child Care and Feeding Practices ....................................................... xxiv
Complementary Feeding Practices ................................................................... xxv
Methods of Feeding Infants and Young Children ........................... xxv Self-Feeding Skills of Infants and Young Children ......................... xxv
Food Intake, Meals, and Snacks ....................................................................... xxvii Fruits, Vegetables, Cow’s Milk, and Meats and Other
Protein Sources ..................................................................... xxvii Desserts, Sugar Sweetened Beverages, and Salty Snacks................. xxviii Meal and Snack Patterns ...................................................................... xxix
Energy and Nutrient Intake .............................................................................. xxxi
Energy Intake ........................................................................................ xxxi Macronutrient and Micronutrient Intake........................................... xxxii
Weight and Growth ............................................................................................ xxxiv
Distribution of Weight-for-Length .................................................... xxxv Predictors of High Weight-for-Length .............................................. xxxv
Summary, Limitations, and Next Steps ........................................................... xxxvi
Summary of Findings ........................................................................... xxxvi Interpreting Study Findings ................................................................. xxxvii Next Steps .............................................................................................. xxxvii

WIC Infant and Toddler Feeding Practices Study-2: Second Year Report vi
Contents (continued)
1 Study Overview ................................................................................................... 1-1
1.1 Background ............................................................................................ 1-1 1.2 Study Design .......................................................................................... 1-3 1.3 Sample Selection.................................................................................... 1-3
1.3.1 Sampling WIC Sites .............................................................. 1-4 1.3.2 Sampling WIC Enrollees ..................................................... 1-5
1.4 Data Sources .......................................................................................... 1-6 1.5 Data Collection Procedures ................................................................. 1-7
1.5.1 Recruiting WIC Participants ............................................... 1-7 1.5.2 Interviewing WIC Participants ........................................... 1-9 1.5.3 Collecting Food Package Data ............................................ 1-11 1.5.4 Collecting Height and Weight Data ................................... 1-12 1.5.5 Conducting Site Visits and Key Informant
Interviews ............................................................................... 1-12 1.5.6 Conducting the WIC Staff Survey ...................................... 1-12
1.6 Weighting and Imputation ................................................................... 1-13 1.7 Sample Characteristics .......................................................................... 1-14 1.8 Analysis ................................................................................................... 1-18
1.8.1 Descriptive Analyses ............................................................ 1-18 1.8.2 Behavioral Models ................................................................ 1-19 1.8.3 Statistical Tests ...................................................................... 1-20 1.8.4 Missing Item Data ................................................................ 1-20
2 Work, School, Child Care, and Breastfeeding ................................................ 2-1
2.1 Overview ................................................................................................ 2-1 2.2 Background ............................................................................................ 2-1
2.2.1 Work and Breastfeeding ...................................................... 2-1 2.2.2 Child Care Use and Feeding Practices ............................... 2-2

WIC Infant and Toddler Feeding Practices Study-2: Second Year Report vii
Contents (continued)
Chapter Page
2.3 Sample and Analysis Approach ........................................................... 2-3
2.3.1 Sample .................................................................................... 2-3 2.3.2 Analysis .................................................................................. 2-4
2.4 Work, School, Child Care, and Feeding Choices ............................. 2-5
2.4.1 Work and School .................................................................. 2-6 2.4.2 Work and Breastfeeding ...................................................... 2-8 2.4.3 Child Care Use ...................................................................... 2-12 2.4.4 Child Care and Work ........................................................... 2-14 2.4.5 Child Care and Breastfeeding ............................................. 2-15 2.4.6 Child Care and Other Foods ............................................... 2-17
2.5 Summary ................................................................................................. 2-20
3 Complementary Feeding Practices ................................................................... 3-1
3.1 Overview ................................................................................................ 3-1 3.2 Background ............................................................................................ 3-1 3.3 Sample and Analysis Approach ........................................................... 3-2
3.3.1 Sample .................................................................................... 3-2 3.3.2 Analysis .................................................................................. 3-3
3.4 Complementary Feeding Practices ..................................................... 3-4
3.4.1 Food Purchasing ................................................................... 3-5 3.4.2 Preparation of Complementary Foods .............................. 3-7 3.4.3 Methods of Feeding Infants and Young
Children .................................................................................. 3-10 3.4.4 Self-Feeding Skills of Infants and Young
Children .................................................................................. 3-12
3.5 Summary ................................................................................................. 3-16
4 Food Intake, Meals, and Snacks ....................................................................... 4-1
4.1 Overview ................................................................................................ 4-1 4.2 Background ............................................................................................ 4-1

WIC Infant and Toddler Feeding Practices Study-2: Second Year Report viii
Contents (continued)
Chapter Page
4.3 Sample and Analysis Approach ........................................................... 4-3
4.3.1 Sample .................................................................................... 4-3 4.3.2 Analysis .................................................................................. 4-3
4.4 Food Intake ............................................................................................ 4-5
4.4.1 Fruit Consumption ............................................................... 4-6 4.4.2 Vegetable Consumption ...................................................... 4-8 4.4.3 Dairy Consumption .............................................................. 4-12 4.4.4 Meats and Other Protein Consumption ............................ 4-15 4.4.5 Dessert, Sugar Sweetened Beverage, and Salty
Snack Consumption ............................................................. 4-17
4.5 Meal and Snack Patterns ...................................................................... 4-20 4.6 Summary ................................................................................................. 4-22
5 Energy and Nutrient Intake .............................................................................. 5-1
5.1 Overview ................................................................................................ 5-1 5.2 Background ............................................................................................ 5-1
5.2.1 Energy and Nutrient Intake ................................................ 5-2
5.3 Sample and Analysis Approach ........................................................... 5-4
5.3.1 Sample .................................................................................... 5-4 5.3.2 Analysis .................................................................................. 5-5
5.4 Energy and Nutrient Intake ................................................................. 5-7
5.4.1 Energy Intake ........................................................................ 5-7 5.4.2 Macronutrient Intake ........................................................... 5-9 5.4.3 Micronutrient Intake ............................................................ 5-12 5.4.4 Energy and Nutrient Intake by WIC Infant
Food Package ........................................................................ 5-16
5.5 Summary ................................................................................................. 5-24

WIC Infant and Toddler Feeding Practices Study-2: Second Year Report ix
Contents (continued)
Chapter Page
6 Weight and Growth ............................................................................................ 6-1
6.1 Overview ................................................................................................ 6-1 6.2 Background ............................................................................................ 6-1
6.2.1 Importance of Weight and Growth in Young Children .................................................................................. 6-1
6.2.2 Factors Affecting Weight and Growth .............................. 6-2
6.3 Sample and Analysis Approach ........................................................... 6-3
6.3.1 Sample .................................................................................... 6-3 6.3.2 Growth Standards ................................................................. 6-5 6.3.3 Caregiver Dietary Intake Data ............................................ 6-6 6.3.4 Analysis .................................................................................. 6-7
6.4 Weight-for-Length Outcomes for Study Children ........................... 6-8
6.4.1 Weight-for-Length Distribution by Age Period ............... 6-8 6.4.2 Characteristics of Children in the High Weight-
for-Length Group ................................................................. 6-11 6.4.3 Models Predicting Weight-for-Length
Outcomes ............................................................................... 6-19
6.5 Summary ................................................................................................. 6-21
7 Summary, Conclusions, and Interpreting the Data ....................................... 7-1
7.1 Summary and Conclusions .................................................................. 7-1
7.1.1 Work, School, Child Care, and Breastfeeding .................. 7-2 7.1.2 Complementary Feeding Practices ..................................... 7-2 7.1.3 Food Intake, Meals, and Snacks ......................................... 7-3 7.1.4 Nutrient Intake ...................................................................... 7-4 7.1.5 Weight and Growth .............................................................. 7-4

WIC Infant and Toddler Feeding Practices Study-2: Second Year Report x
Contents (continued)
Chapter Page
7.2 Interpreting the Data: Study Limitations ........................................... 7-5
7.2.1 Establishing Causal Relations ............................................. 7-5 7.2.2 Generalizing Findings .......................................................... 7-5 7.2.3 Comparisons to Other Studies ........................................... 7-6 7.2.4 Influence of Caregiver Perceptions .................................... 7-6 7.2.5 Estimation of Breastmilk Intake......................................... 7-7 7.2.6 Scope of the Study ................................................................ 7-7
7.3 Next Steps .............................................................................................. 7-7
References ............................................................................................................ R-1
Appendixes
A Study Research Questions ................................................................................. A-1 B1 Details of Sampling and Weighting Procedures ............................................. B1-1 B2 Development of WIC Program Composite Variables .................................. B2-1 B3a Additional Analysis Details from Chapter 2 ................................................... B3a-1 B3b Additional Analysis Details from Chapter 4 ................................................... B3b-1 B3c Additional Analysis Details from Chapter 6 ................................................... B3c-1 B4 Dietary Intake Coding Procedures and Estimating Usual Intake ................ B4-1 C Introduction to Primary Tables by Key Socio-Demographic
Variables ............................................................................................................... C-1 C1 Work, School, Child Care, and Breastfeeding Tables ................................... C1-1 C2 Complementary Feeding Practices Tables ..................................................... C2-1 C3 Food Intake Tables ............................................................................................. C3-1 C4 Energy and Nutrient Intake Tables.................................................................. C4-1 C5 Weight and Growth Tables ............................................................................... C5-1

WIC Infant and Toddler Feeding Practices Study-2: Second Year Report xi
Contents (continued)
Tables Page
1 Percentage of infants and young children who show self-feeding skills by interview month ................................................................................... xxvi
2 Top five foods or beverages consumed on a given day at each
eating occasion by study children, at 13 and 24 months............................... xxx 3 Estimated prevalence of inadequate intake levels of
micronutrients among study children during the second year of life.......................................................................................................................... xxxiii
1-1 Domains by source of data ............................................................................... 1-8 1-2 Status of all referred participants ...................................................................... 1-9 1-3 Frequency of interviews for core and supplemental samples ...................... 1-10 1-4 Study sample participation ................................................................................ 1-14 1-5 Counts and percentage of respondents who completed interviews
by sample type and interview month ............................................................... 1-15 1-6 Counts and percentage of analysis sample respondents on whom
the study received weight and length data, and food package data ............. 1-15 1-7 Socio-demographic characteristics of main analysis sample ........................ 1-16 1-8 Correlated socio-demographic variables ......................................................... 1-19 2-1a Number of respondents by interview month, first year of life .................... 2-4 2-1b Number of respondents by interview month, second year of life ............... 2-4 2-2 Breastfeeding duration by employment status at 13 months ....................... 2-11 2-3 Percentage of study children in regular child care by type of child
care (Months 3-24) ............................................................................................. 2-13 2-4 Percentage of caregivers currently using regular child care by
employment status (Months 3-24) ................................................................... 2-14

WIC Infant and Toddler Feeding Practices Study-2: Second Year Report xii
Contents (continued)
Tables Page
2-5 Among breastfeeding mothers who encounter problems with breastfeeding while the infant is in child care, the percentage reporting select barriers ..................................................................................... 2-16
2-6 Among study children in regular child care, percentage of
children by source of food ................................................................................ 2-18 2-7 Among children whose child care providers also provide food,
timing of introduction of select foods at child care ...................................... 2-19 3-1 Number of respondents by interview month ................................................. 3-3 3-2 Among caregivers who prepare baby food at home, the
percentage using different food preparation methods, by interview month .................................................................................................. 3-7
3-3 Percentage of infants and young children who show self-feeding
skills by interview month ................................................................................... 3-13 4-1 Number of respondents by interview month ................................................. 4-3 4-2 Top five fruits consumed by study children on a given day, 7- ,
13-, and 24-month interviews ........................................................................... 4-7 4-3 Percentage of study children consuming different types of
vegetables on a given day by interview month (months 7-24) ..................... 4-10 4-4 Top five vegetables consumed by study children on a given day,
7-, 13-, and 24-month interviews ..................................................................... 4-11 4-5 Top five foods or beverages consumed on a given day at each
eating occasion by study children, at 13 and 24 months............................... 4-21 5-1 Number of respondents by interview month ................................................. 5-4 5-2a Median macronutrient intake of study children compared to
recommendations (months 5-11) ..................................................................... 5-10 5-2b Median macronutrient intake of study children compared to
recommendations (months 13-24) ................................................................... 5-11

WIC Infant and Toddler Feeding Practices Study-2: Second Year Report xiii
Contents (continued)
Tables Page
5-3a Median micronutrient intake of study children compared to recommendations (months 3-5) ....................................................................... 5-12
5-3b Median micronutrient intake of study children compared to recommendations (months 7-11) ..................................................................... 5-13
5-3c Median micronutrient intake of study children compared to recommendations (months 13-24) ................................................................... 5-15
5-4 Estimated prevalence of inadequate intake levels of micronutrients among study children (months 13-24) .................................. 5-16
5-5 WIC food package maximum monthly allowances for infants ages 6-11 months ................................................................................................ 5-17
5-6 Median macronutrient intake of study infants by food package, compared to recommendations (months 7 and 11) ...................................... 5-20
5-7 Median micronutrient intake of study infants at 7 months, by 6-month food package, compared to recommendations .............................. 5-21
5-8 Median micronutrient intake per 100 kcal of energy intake for study infants at 7 months, by 6-month food package ................................... 5-22
5-9 Median micronutrient intake of study infants at 11 months, by 11 month food package, compared to recommendations ............................ 5-23
6-1a Number of respondents by interview month, first year of life .................... 6-4
6-1b Number of respondents by interview month, second year of life ............... 6-4
6-2 Number of analysis sample children on whom the study received weight and length data, by source of measurement ....................................... 6-5
6-3 The number of study children with weight and length measurement data in each age group for analysis .......................................... 6-5
6-4 Percentage of children by weight-for-length group and breastfeeding duration ....................................................................................... 6-12
6-5 The percentage of study children who did and did not experience rapid weight gain by breastfeeding duration ................................................... 6-13

WIC Infant and Toddler Feeding Practices Study-2: Second Year Report xiv
Contents (continued)
Tables Page
6-6 Caregivers’ average intake of added sugar from SSBs, by toddlerhood weight-for-length group and caregiver socio-demographic characteristics .............................................................................. 6-16
6-7 The percentages of study children by toddlerhood weight-for-
length groups and by select characteristics associated with health, physical activity, and family eating routines .................................................... 6-18
6-8 Results of logistic regression predicting likelihood of high weight-
for-length in toddlerhood .................................................................................. 6-20 A-1 Study research questions .................................................................................... A1-1 B1-1 Definitions of the strata used for site sampling and key sampling
statistics by stratum ............................................................................................ B1-8 B3a-1 The percentage of WIC ITFPS-2 caregivers working and going to
school by work status ......................................................................................... B3a-1 B3a-2 The percentage of WIC ITFPS-2 caregivers who attend school by
work status ........................................................................................................... B3a-1 B3a-3 Breastfeeding rates by employment status groups by interview
month ................................................................................................................... B3a-1 B3a-4 Percentage of employed, breastfeeding caregivers reporting
accommodations for pumping breastmilk by number of accommodations ................................................................................................. B3a-2
B3a-5 Percentage of employed, breastfeeding caregivers reporting
accommodations for pumping breastmilk by type of accommodation ................................................................................................... B3a-2
B3a-6 Median breastfeeding duration by select characteristics ............................... B3a-3 B3a-7 The percentage of study children in regular child care, currently
and ever ................................................................................................................ B3a-3 B3a-8 Breastfeeding rates by child care status ........................................................... B3a-3

WIC Infant and Toddler Feeding Practices Study-2: Second Year Report xv
Contents (continued)
Tables Page
B3a-9 Among breastfed infants in regular child care, the percentage distribution of infants by method of breastmilk receipt ............................... B3a-4
B3a-10 Median and mean breastfeeding duration by use of regular child
care by age 13 months ........................................................................................ B3a-4 B3b-1 Percentage of study children consuming different types of fruit
products on a given day by interview month (Month 3 - 24) ...................... B3b-2 B3b-2 Percentage of study children consuming different types of
vegetables on a given day by interview month (Month 3 - 24) .................... B3b-2 B3b-3 Percentage of study children consuming cow’s milk and milk
alternatives on a given day (Months 3-24) ...................................................... B3b-3 B3b-4 Percentage of study children consuming desserts and candy, sugar
sweetened beverages, and salty snacks on a given day by interview month (Month 3 - 24) ........................................................................................ B3b-4
B3b-5 Percentage of study children eating breakfast, lunch, dinner, and
snacks by interview month (Month 3 - 24) ..................................................... B3b-4 B3c-1 The percentage distribution of study children in weight-for-length
categories by age group ...................................................................................... B3c-1 B3c-2 Percentage of children in each weight-for-length percentile range
by household food security ............................................................................... B3c-2 Bc3-3 Percentage of children in each weight-for-length percentile range
by participation in non-WIC benefit program(s) ........................................... B3c-3 B3c-4 Percentage of children in each weight-for-length percentile range
by ethnicity ........................................................................................................... B3c-4 B3c-5 Percentage of children in weight-for-length percentile ranges by
time until introduction of select foods ............................................................ B3c-5 B3c-6 Odds ratio estimates for logistic regression predicting the
likelihood of high weight-for length status in toddlerhood.......................... B3c-9

WIC Infant and Toddler Feeding Practices Study-2: Second Year Report xvi
Contents (continued)
Figures Page
1 The percentage of WIC ITFPS-2 mothers working and going to school (Months 3-24) ......................................................................................... xxii
2 Breastfeeding rates by employment status groups (Months 3, 7,
and 13) .................................................................................................................. xxii 3 Number of workplace accommodations reported by employed,
breastfeeding mothers ........................................................................................ xxiii 4 Among breastfeeding women, median breast-feeding duration in
days, by employment status ............................................................................... xxiv 5 The percentage of study children in regular child care, currently
and ever, by month ............................................................................................. xxiv 6 Among children receiving complementary foods, percentage fed
with a spoon within the past 7 days ................................................................. xxv 7 Percentage of study infants using a bottle at 13 months .............................. xxvi 8 Percentage of study children consuming any fruit, any vegetable,
cow’s milk, and any meat or protein source on a given day, by month ................................................................................................................... xxvii
9 Percentage of study children consuming desserts and candy, sugar
sweetened beverages, and salty snacks on a given day, by month ............... xxviii 10 Median energy intake, by gender and age........................................................ xxxii 11 Percentage of study children by age and weight-for-length ......................... xxxv 2-1 The percentage of WIC ITFPS-2 caregivers working and going to
school by work status (Months 3-24) .............................................................. 2-6 2-2 The percentage of WIC ITFPS-2 caregivers attending school, by
work status (Months 3-24) ................................................................................ 2-7 2-3 Breastfeeding rates by employment status groups (Months 3, 7,
and 13) .................................................................................................................. 2-8

WIC Infant and Toddler Feeding Practices Study-2: Second Year Report xvii
Contents (continued)
Figures Page
2-4 Percentage of employed, breastfeeding mothers reporting workplace accommodations for pumping breastmilk, by number of accommodations reported ............................................................................ 2-9
2-5 Percentage of employed, breastfeeding mothers reporting each
type of workplace accommodation for pumping breastmilk ....................... 2-10 2-6 The percentage of study children in regular child care, currently
and ever ................................................................................................................ 2-12 2-7 Percentage of breastfeeding mothers by child care status ............................ 2-15 2-8 The percentage of breastfed infants in regular child care, by
method of breastmilk receipt in child care ..................................................... 2-17 3-1 Percentage of caregivers feeding baby foods by proportion of
foods that are store-bought (months 7-13) ..................................................... 3-5 3-2 Percentage of caregivers receiving WIC indicating the WIC food
package allows them to purchase foods they typically feed their child ...................................................................................................................... 3-6
3-3 Among caregivers preparing foods at home, significant
differences in percentage pureeing, chopping/dicing, or premasticating food before giving it to infants, by caregiver race ............... 3-8
3-4 Among caregivers preparing foods at home, significant
differences in percentage pureeing, mashing, or premasticating food before giving it to infants, by caregiver ethnicity ................................. 3-9
3-5 Among study children receiving complementary foods,
percentage of caregivers reporting feeding with a spoon within the past 7 days, by interview month ................................................................ 3-10
3-6 Percentage of study infants using a bottle at 13 months .............................. 3-12 3-7 Percentage of infants using a bottle at 13 months by caregiver
race and ethnicity ................................................................................................ 3-13 3-8 Percentage of children drinking from cups independently
(months 9-18) ...................................................................................................... 3-15

WIC Infant and Toddler Feeding Practices Study-2: Second Year Report xix
Contents (continued)
Figures Page
5-3 Study children’s median energy intake at 7 months, by 6-month food package and gender ................................................................................... 5-18
5-4 Study children’s median energy intake at 11 months, by 11-month
food package and gender ................................................................................... 5-19 6-1 The percentage of study children by age and weight-for-length ................. 6-9 B1-1 Overview of WIC site sampling process ......................................................... B1-2 B1-2 Exclusion of ineligibles from unit selection process ..................................... B1-5

WIC Infant and Toddler Feeding Practices Study-2: Second Year Report xx
WIC ITFPS-2 Second Year Report Executive Summary
Key Findings: WIC mothers are returning to school and work, and many are continuing to breastfeed while working. By
7 months postpartum 48 percent of mothers are in school, working for pay, or both, and by 24 months it rises to 56 percent. By 7 months, significantly fewer full-time employed mothers are breastfeeding (20 percent) than are those who are not employed (28 percent). Mothers who work full-time and breastfeed also have a shorter median duration of breastfeeding (60 days) than those employed part-time (79 days), and then those not employed (91 days).
WIC children are making expected developmental progressions in self-feeding. At 13 months, 97 percent of WIC children are picking up food with their fingers to self-feed, and 47 percent are no longer drinking anything from a bottle. At 18 months, 66 percent of WIC children are feeding themselves with a spoon.
WIC children are consuming a varied diet as they move through the second year of life, including fruits, vegetables, dairy, and meats and other proteins. They are also, however, increasing their consumption of desserts, candy, sugar-sweetened beverages, and salty snacks.
WIC children have median nutrient intake levels that mostly meet or exceed recommended levels through the first 2 years of life. Vitamin D is a notable exception, falling below recommended levels at all ages. Iron and zinc intake, which are nutrients of particular concern for infants and young children, each have estimated prevalence of inadequate intake below 20 percent during the first year of life, and below 5 percent during the second year of life.
There is an increasing trend in the prevalence of high weight-for-length status in WIC children over the first 2 years of life. In early infancy, about 16 percent of WIC infants are high weight-for-length by World Health Organization standards, and this statistic rises to about 23 percent around the time of the second birthday. Although this trend is consistent with other research on WIC and low-income children, it is nonetheless concerning and warrants future tracking.
Overview of Study Goals and Methods
The Special Supplemental Nutrition Program for Women, Infants, and Children (WIC) was established to safeguard the health of low-income pregnant women, infants, and children who are at nutritional risk. The program was established by Congress as a pilot in 1972 under Public Law 92-433, Section 17 of the Child Nutrition Act of 1966, and made permanent in 1974.1 The program, administered by the Food and Nutrition Services (FNS) of the U.S. Department of Agriculture (USDA), provides supplemental foods, nutrition education, including breastfeeding promotion and support, and health care referrals for low-income pregnant, non-breastfeeding and breastfeeding postpartum women and their infants and children up to age 5.
1 U.S. Department of Agriculture, Food and Nutrition Service. (n.d.). About WIC’s Mission. Retrieved from
http://www.fns.usda.gov/wic/about-wic-wics-mission on September 27, 2017.

WIC Infant and Toddler Feeding Practices Study-2: Second Year Report xxi
This report describes feeding practices, nutrition, and weight status of WIC children through age 2 years as a part of the longitudinal WIC Infant and Toddler Feeding Practices Study (WIC ITFPS-2). By capturing data on WIC caregivers2 and their children over the first 5 years of the child’s life, the study will inform a series of research questions regarding feeding practices, the associations between WIC services and those practices, and the health and nutrition outcomes of children on WIC. The study will update past analyses to assess changes in behaviors and trends that may have occurred in the WIC population over the past 20+ years—that is since WIC Infant Feeding Practices Study-1 (WIC IFPS-1), the last major study of the diets of infants and toddlers who were WIC participants. Additionally, the study will draw comparisons to other national infant and toddler feeding studies that include both WIC and non-WIC participants. WIC ITFPS-2 incorporates a core longitudinal sample (with up to 17 caregiver interviews occurring over the course of 60 months) and a supplemental sample with less frequent interviews to ensure cross-sectional precision in estimates at key points in time. Study mothers are recruited in person as they enrolled in WIC during the summer or fall of 2013 (either prenatally or before their infant was 2.5 months old). They are recruited from 80 WIC sites across 27 states and territories nationwide. Interviews are conducted by telephone in English or Spanish. In addition, the study team periodically obtains data on food package prescriptions from WIC administrative records, and data on child weight and length from WIC administrative records or from child health care providers. The study also collects data from WIC site staff using a web survey, and from State and local agencies staff using a mix of in-person and telephone interviews. This report on the second year of life uses data from the 1-, 3-, 5-, 7-, 9-, 11-, 13-, 15-, 18-, and 24-month interviews, as well as from WIC administrative data and child health care providers. The data in this report are based on the 3,777 caregivers who completed at least a 1- or 3-month interview, although analyses sometimes utilize a subset the data to address subgroups of interest. The data are weighted to represent the national population of infants enrolled in WIC for the first time during the study’s 20-week recruitment period.3 Study findings represent the characteristics, views, behaviors, and experiences of this population.
2 Over 98 percent of respondents are biological mothers. Throughout the report the terms “mother” and “caregiver”
are used interchangeably. 3 Eligible mothers were either pregnant, or their infants were less than 3 months old. Mothers were at least 16 years old
at the time of enrollment, and spoke either English or Spanish.

WIC Infant and Toddler Feeding Practices Study-2: Second Year Report xxii
Work, School, Child Care, and Breastfeeding
At the time of the 3-month interview, 38 percent of WIC ITFPS-2 mothers are working for pay, going to school, or both. By 24 months, that number rises to 56 percent. At 3 months about 30 percent of WIC ITFPS-2 mothers report working for pay, and at 24 months, nearly half (48%) of the mothers are employed. Figure 1 presents the total percentage of caregivers in school, working full-time (FT) and part-time (PT), or in school while working. There is a subtle shift toward FT employment during later infancy and the second year of life: 52 percent of those who report working for pay work FT at 3 months, and 57 percent of those who report working for pay work FT at 24 months.
Figure 1. The percentage of WIC ITFPS-2 mothers working and going to school (Months 3-24)
8% 9% 9% 8% 8%
14% 18% 20% 22% 23%2%
2%3% 2% 4%
13%16%
17% 16%17%
2%
3%4% 4%
4%
38%
48%53% 51%
56%
Month 3 Month 7 Month 13 Month 18 Month 24
School only FT work onlyFT work, and school PT work onlyPT work, and school
Work and Breastfeeding
Many WIC women who return to work continue to breastfeed their infants, despite the challenges that working may present for breastfeeding. Figure 2 shows breastfeeding rates by employment status for interview months 3, 7, and 13. Among FT employed caregivers, 34 percent are breastfeeding (either partially or fully4) at 3 months; 20 percent are breastfeeding at seven months; and, 10 percent are breastfeeding at 13 months. A similar pattern of decline in
Figure 2. Breastfeeding rates by employment status groups (Months 3, 7, and 13)
4 Fully breastfeeding is defined in the current study as feeding breastmilk, but not infant formula. Fully breastfeeding
mothers may be feeding other complementary foods or beverages, including water.

WIC Infant and Toddler Feeding Practices Study-2: Second Year Report xxiii
breastfeeding rates is evident among those working PT, and among those not employed. Level of workplace support for breastfeeding women may facilitate or hinder breastfeeding. The Affordable Care Act specifies three types of accommodations that most5 workplaces should provide to breastfeeding women: reasonable break time to pump, a private space other than a bathroom for pumping, and a reasonable place to store pumped milk.6 Among employed, breastfeeding WIC ITFPS-2 mothers, 76 percent of employed breastfeeding mothers report that their employers allow reasonable breaks to pump milk. Seventy percent indicate that their workplace provides a private space to pump that is not a bathroom, and 69 percent indicate that their employer provides a reasonable place to store pumped milk. Figure 3 shows how many of these three accommodations breastfeeding WIC ITFPS-2 mothers reported having available at their workplaces. In total, 85 percent of the employed breastfeeding women reported at least one workplace accommodation, and 57 percent reported having all three accommodations available. Nonetheless, a notable minority of working women who are breastfeeding (15%) report no accommodations at work for breastfeeding.
Figure 3. Number of workplace accommodations reported by employed, breastfeeding mothers
15%
11%
17%
57%
No accommodations 1 accommodation2 accommodations 3 accommodations
5 U.S. Department of Labor, Wage and Hour Division. (n.d.). Break Time for Nursing Mothers. Retrieved from
https://www.dol.gov/whd/nursingmothers/ on September 27, 2017. 6 The term “reasonable” is not defined in the legislation.

WIC Infant and Toddler Feeding Practices Study-2: Second Year Report xxiv
Employment status is also associated with breastfeeding duration. As shown in Figure 4, among mothers who initiated breastfeeding, median breastfeeding duration is 60 days for mothers employed FT, 79 days for mothers employed PT, and 91 days for those not employed. Women employed FT have significantly shorter breastfeeding durations than those employed PT or those not working.
Figure 4. Among breastfeeding women, median breast-feeding duration in days, by employment status
60
7991
Employed full-time Employed part-time Not employed
Child Care and Feeding Practices
Regular child care is defined for WIC ITFPS-2 as an arrangement in which someone other than the child’s primary caregiver or the other parent cares for the child on a regular basis. Figure 5 presents the percentage of study children currently in regular child care, and the percentage who have ever been in regular child care, by month. The percentage currently in regular care is 22 percent at 3 months, and rises to 44 percent by 24 months. At 3 months, significantly fewer infants in regular care are being breastfed (37%), as compared to children not in regular care (43%). By 13 months, these drop to 12 percent and 18 percent, respectively, which is also a significant difference. At 3 months, most breastfeeding mothers who use regular child care report providing pumped milk for their infants to consume at child care (68%). Notably, the next most common strategy for feeding breastmilk to infants in regular care is not to feed any breastmilk while in the care arrangement (20%).
Figure 5. The percentage of study children in regular child care, currently and ever, by month
22%
34%39%
44%
23%
39%50%
60%
Month 3 Month 7 Month 13 Month 24
Currently in regular care Ever in regular care

WIC Infant and Toddler Feeding Practices Study-2: Second Year Report xxv
Complementary Feeding Practices
Once infants are ready to begin consuming complementary foods, there is a progression over time from assisted feeding to self-feeding. Initial complementary foods are typically fed to the infant by an adult, using a spoon. The American Academy of Pediatrics recommends discontinuing bottle use entirely before 18 months of age,7 and encouraging self-feeding skills as soon as the child becomes developmentally ready. These skills include: using a cup; self-feeding with fingers; and self-feeding with a spoon. Methods of Feeding Infants and Young Children
At 3 months, few infants have started complementary foods, and spoon feeding is not yet a common feeding method. By 5 months, when more infants have started complementary foods, the percentage of caregivers reporting spoon feeding in the past 7 days increases dramatically to 65 percent. By 7 months, spoon feeding becomes a dominant practice among those feeding complementary foods (see Figure 6), with about 95 percent of caregivers spoon-feeding their infants. This jump between 5 and 7 months aligns with the age when the majority of healthy infants should have become developmentally ready to begin spoon feeding.
Figure 6. Among children receiving complementary foods, percentage fed with a spoon within the past 7 days
95%
65%
16%
Month 7
Month 5
Month 3
Self-Feeding Skills of Infants and Young Children
Self-feeding skills progress gradually over the latter half of the first year, and through the second year. WIC ITFPS-2 explored the development of self-feeding skills between 9 and 18 months, including: drinking from a cup held by someone else; drinking from a self-held open cup; picking up
7 Kleinman, R.E., and Greer, F.R. (2013). Pediatric nutrition, 7th Edition. Elk Gove Village, IL: American Academy of
Pediatrics.

WIC Infant and Toddler Feeding Practices Study-2: Second Year Report xxvi
food with fingers to self-feed; and, self-feeding with a spoon (see Table 1). The infants are picking up food with their fingers to self-feed at 9 months, and almost all (97%) are doing it by 13 months. By 18 months, nearly half of all children are drinking from a regular cup without a lid. Self-feeding with a spoon, which requires greater fine-motor coordination, is developing more slowly with only 23 percent of children feeding themselves with a spoon at 13 months, and 66 percent doing so at 18 months. Table 1. Percentage of infants and young children who show self-feeding skills by interview
month
Self-feeding skills Month 9 Month 13 Month 18 Child drinks from a cup held by other within the last 7 days 33.8% 48.2% 46.1% Child drinks from an open cup 4.8 17.6 48.6 Child picks up food to feed self 74.4 97.0 NA Child feeds self with a spoon 6.4 23.4 65.6 Unweighted n 2,150 2,669 1,940 Weighted n 389,723 421,046 431,521
Note: NA denotes not applicable. The question is not asked at this age.
As infants reach their first birthdays, WIC recommends that they be weaned from the bottle to lessen the risk of early childhood dental caries.8 At 13 months, 47 percent of children are no longer using a bottle (see Figure 7). Among the children who are no longer using a bottle by 13 months, the average age of bottle weaning is 10.6 months.
Figure 7. Percentage of study infants using a bottle at 13 months
Still using a bottle,
53%
No longer using a bottle,
47%
8 Special Supplemental Nutrition Program for Women, Infants, and Children (U.S.), Commodity Supplemental Food
Program (U.S.). (2009). Infant nutrition and feeding: A guide for use in the WIC and CSF programs. Washington, DC: U.S. Department of Agriculture, Food and Nutrition Service, Special Supplemental Nutrition Program for Women, Infants, and Children (WIC).

WIC Infant and Toddler Feeding Practices Study-2: Second Year Report xxvii
Food Intake, Meals, and Snacks
Fruits, Vegetables, Cow’s Milk, and Meats and Other Protein Sources
WIC ITFPS-2 study children are consuming a varied diet on a given day as they move into the second year of life, including fruits, vegetables, dairy, and meats and other proteins9 (see Figure 8). Figure 8. Percentage of study children consuming any fruit, any vegetable, cow’s milk, and
any meat or protein source on a given day, by month
0
10
20
30
40
50
60
70
80
90
100
3 5 7 9 11 13 15 18 24
Perc
enta
ge o
f Stu
dy C
hild
ren
Age (in months)
Any fruit, excluding juice Any vegetable Cow's milk Any meat or protein source The percentage of WIC ITFPS-2 children consuming fruit on a given day increases sharply between 5 and 7 months of age, and gradually evens off after that. By 24 months, 70 percent of the children are consuming a non-juice fruit on a given day. The pattern is very similar for vegetables, with a sharp increase between 5 and 7 months, and 62 percent of the children consuming a vegetable on a given day at 24 months. Although fruit and vegetable consumption increases as the children get older, a substantial percentage at each month are still not consuming a fruit or vegetable on a given day. Consumption of cow’s milk on a given day remains at very low levels through 11 months, in line with WIC recommendations to delay introduction of cow’s milk until 12 months. By 13 months,
9 Other protein sources include dried beans or peas; vegetarian meat substitutes; eggs; peanut butter, nuts, and seeds;
cheese; yogurt; and, protein sources in mixed dishes such as: baby food dinners; beans and rice, chili, and other bean mixtures; mixtures with vegetables and/or rice or pasta.

WIC Infant and Toddler Feeding Practices Study-2: Second Year Report xxviii
75 percent of the children’s are consuming cow’s milk on a given day, and by 24 months it rises to 85 percent. Consumption of meats and other protein sources on a given day rises from 18 percent at 7 months to 86 percent at 13 months. By 24 months, nearly all WIC ITFPS-2 children (96%) are consuming a meat or other protein source on a given day. Desserts, Sugar Sweetened Beverages, and Salty Snacks
The percentages of WIC ITFPS-2 children consuming desserts and candy, sugar sweetened beverages (SSBs), and salty snacks on a given day all increase with age (see Figure 9). Dessert and candy increase at the fastest rate, with consumption on a given day increasing from 11 percent of children at 7 months to 52 percent of children by 24 months. Figure 9. Percentage of study children consuming desserts and candy, sugar sweetened
beverages, and salty snacks on a given day, by month
0102030405060708090
100
3 5 7 9 11 13 15 18 24
Perc
enta
ge o
f Stu
dy C
hild
ren
Age (in months)
Desserts and candy Sugar sweetened beverages Salty snacks
The percentage of children consuming SSBs on a given day remains relatively low during the infant year, but 11 percent of WIC ITFPS-2 children are consuming an SSB on a given day at 13 months, and nearly a quarter (23%) are doing so by 24 months. Most of those sweetened beverages are fruit flavored drinks; only 4 percent of study children are consuming carbonated sodas, and only 5 percent are consuming other sweetened beverages, such as sweet tea or Gatorade, at 24 months.

WIC Infant and Toddler Feeding Practices Study-2: Second Year Report xxix
Consumption of salty snacks (e.g., potato chips, popcorn, cheese curls/puffs, tortilla chips, and other types of chips and salty snacks) also rises steadily, with 24 percent of children consuming a salty snack on a given day at 24 months. Meal and Snack Patterns
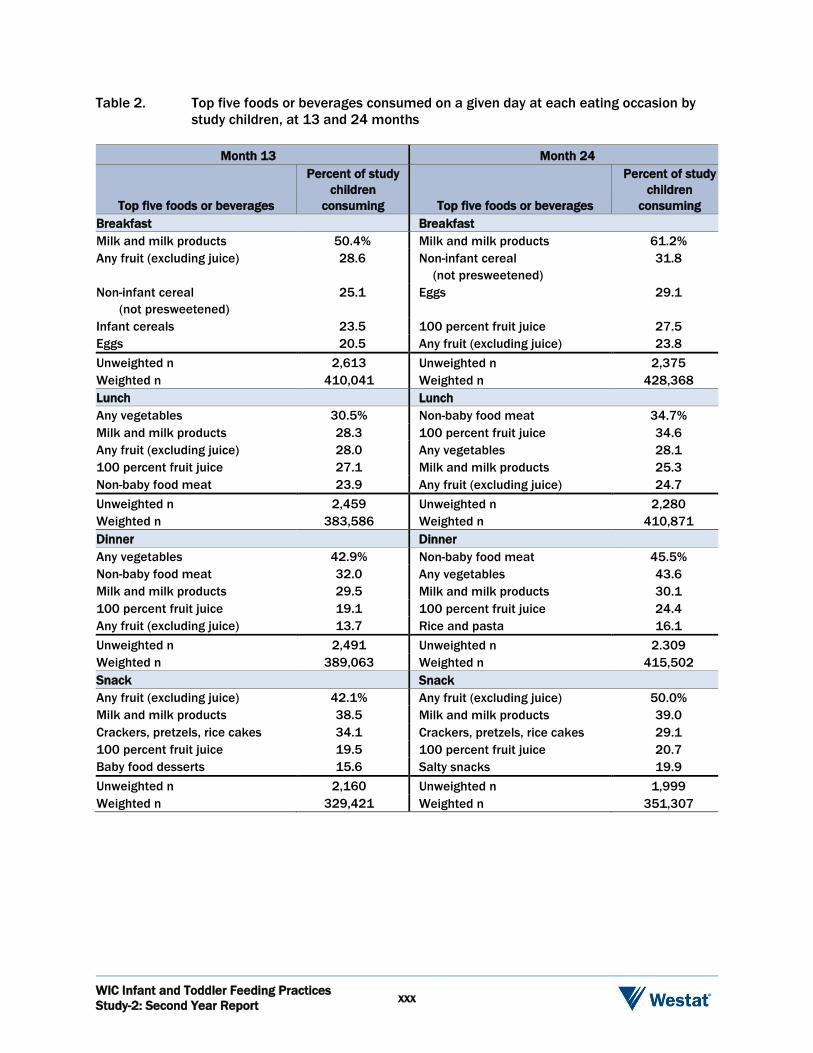
As WIC ITFPS-2 children become more established in eating complementary foods, and move into the second year of life, more children also begin consuming breakfast, lunch, dinner, and snacks as distinct eating events. By 24 months, 98 percent of the children are eating breakfast on a given day, 94 percent are eating lunch, 95 percent are eating dinner, and 80 percent are eating as least one snack. The most commonly consumed foods or beverages at each eating occasion at 13 and 24 months appear in Table 2. At 13 months, milk and milk products (excluding breastmilk and infant formula) and fruit (excluding juice) are commonly consumed at every eating occasion, and 100 percent fruit juice is commonly consumed at lunch, dinner, and snacks. Eggs, infant cereals, and non-infant cereals (not presweetened)10 are common at breakfast. Lunches and dinners include vegetables and non-baby food meats. Snacks commonly include crackers, pretzels, rice cakes, fruit, and, for a subset of children, baby food desserts. Most of these foods are available as a part of the WIC food package. At both 7 and 15 months, approximately 9 in 10 study mothers agree that the WIC food package allows them to purchase foods they would typically feed their children. On a given day at 24 months, many children still commonly consume milk and milk products at every eating occasion, and 100 percent fruit juice is now commonly consumed at every eating occasion. Fruit and eggs are still common at breakfast, but non-infant cereals (not presweetened) become the most commonly consumed breakfast food. Lunches include the same foods as at 13 months, although the order has changed. Rice and pasta join non-baby food meats and vegetables as common dinner foods. Snacks still include crackers, pretzels, rice cakes, or fruit, but salty snacks join the top five, and baby food desserts are no longer in the top five. Once again, many of the top five foods are available as a part of the child’s WIC food package at 24 months, but other non-WIC foods, such as salty snacks, have become more common.
10 Non-infant cereals (not presweetened) are defined as breakfast cereal with no more than 21.2 g total sugars/100 g dry
cereal.
WIC Infant and Toddler Feeding Practices Study-2: Second Year Report xxx
Table 2. Top five foods or beverages consumed on a given day at each eating occasion by study children, at 13 and 24 months
Month 13
Top five foods or beverages
Percent of study children
consuming Breakfast Milk and milk products Any fruit (excluding juice)
Non-infant cereal (not presweetened) Infant cereals Eggs
50.4% 28.6
25.1
23.5 20.5
Unweighted n Weighted n
2,613 410,041
Lunch Any vegetables Milk and milk products Any fruit (excluding juice) 100 percent fruit juice Non-baby food meat
30.5% 28.3 28.0 27.1 23.9
Unweighted n Weighted n
2,459 383,586
Dinner Any vegetables Non-baby food meat Milk and milk products 100 percent fruit juice Any fruit (excluding juice)
42.9% 32.0 29.5 19.1 13.7
Unweighted n Weighted n
2,491 389,063
Snack Any fruit (excluding juice) Milk and milk products Crackers, pretzels, rice cakes 100 percent fruit juice Baby food desserts
42.1% 38.5 34.1 19.5 15.6
Unweighted n Weighted n
2,160 329,421
Month 24
Top five foods or beverages
Percent of study children
consuming Breakfast Milk and milk products 61.2% Non-infant cereal (not presweetened)
31.8
Eggs 29.1
100 percent fruit juice 27.5 Any fruit (excluding juice) 23.8 Unweighted n 2,375 Weighted n 428,368 Lunch Non-baby food meat 34.7% 100 percent fruit juice 34.6 Any vegetables 28.1 Milk and milk products 25.3 Any fruit (excluding juice) 24.7 Unweighted n 2,280 Weighted n 410,871 Dinner Non-baby food meat 45.5% Any vegetables 43.6 Milk and milk products 30.1 100 percent fruit juice 24.4 Rice and pasta 16.1 Unweighted n 2.309 Weighted n 415,502 Snack Any fruit (excluding juice) 50.0% Milk and milk products 39.0 Crackers, pretzels, rice cakes 29.1 100 percent fruit juice 20.7 Salty snacks 19.9 Unweighted n 1,999 Weighted n 351,307

WIC Infant and Toddler Feeding Practices Study-2: Second Year Report xxxi
Energy and Nutrient Intake
To examine dietary intake comprehensively, the total energy (as measured in kilocalories), macronutrient, and micronutrient contents of individuals’ diets are typically calculated, and nutrient intake is compared to existing standards or references. Evaluating young children’s dietary intake can be challenging, because there are no current national dietary guidelines for children from birth to 24 months. The Dietary Guidelines for Americans for birth through age 24 months are currently in development, and are expected to be released in 2020.11 Nonetheless, it is possible to evaluate the nutrient intakes of groups of children birth through 24 months using Dietary Reference Intakes (DRI). DRIs are nutrient standards, developed by the Institute of Medicine of the National Academy of Sciences,12 that can be used as a point of comparison to estimate the prevalence of inadequate intakes. Energy Intake
Data from WIC ITFPS-2 suggest that young children’s median energy intakes increase as the children age (see Figure 10). This is consistent with the increased calorie needs children experience as they grow, develop more lean body mass, and become more mobile. Between ages 7 and 13 months, median energy intake increases by 50 percent for males, and 48 percent for females. Between ages 13 and 24 months, median energy intake increases again by 28 percent for males, and 26 percent for females. At all time points between 5 and 24 months, males consistently have a higher median energy intake than females; however, this is expected given that energy requirements for male infants are slightly higher than those of females infants.13,14
11 U.S. Department of Agriculture, Center for Nutrition Policy and Promotion. (n.d.). Pregnancy and Birth to 24 Months
Project. Retrieved from https://www.cnpp.usda.gov/birthto24months on September 27, 2017. 12 Institute of Medicine (IOM). (2000). Dietary Reference Intakes: Applications in Dietary Assessment. Washington, DC: The
National Academies Press. 13 Butte, N.F. (2005). Energy requirements of infants. Public Health Nutrition, 8(7a), 953-967. 14 Institute of Medicine (IOM). (2005). Dietary Reference Intakes for Energy, Carbohydrate, Fiber, Fat, Fatty Acids, Cholesterol,
Protein, and Amino Acids. Washington, DC: The National Academies Press. https://doi.org/10.17226/10490.

WIC Infant and Toddler Feeding Practices Study-2: Second Year Report xxxii
Figure 10. Median energy intake, by gender and age
627 689788
8861034 1103
11951324
594 654730
820970
10461140
1227
0200400600800
1000120014001600
5 7 9 11 13 15 18 24
kcal
/day
Age (in months)
Male Female
Energy intakes could not be compared to energy requirements, because calculating Estimated Energy Requirements (EERs) for a child requires accurate body weight and length measurements obtained concurrently with the dietary intake data. Because WIC ITFPS-2’s interviews were conducted by telephone, objective measurements of weight and length on the day of the 24-hour dietary recall could not be obtained, thus prohibiting calculation of the EER and comparisons of energy intake to the EER. Macronutrient and Micronutrient Intake
WIC ITFPS-2 examines both macronutrient and micronutrient intake of the study children. Essential macronutrients (i.e., protein, carbohydrate, and fat) are needed in large amounts to provide energy for healthy nutrition and growth, whereas micronutrients (i.e., vitamins and minerals) are needed in smaller quantities but are still essential for various physiological and metabolic processes. When evaluating micronutrient intake of young children, it is particularly important to consider the intake of several micronutrients that are essential for growth and development, including iron, vitamin D, and zinc. Median fat, carbohydrate, and protein intakes meet or exceed recommended levels at most ages between 5 and 24 months for which standards have been identified. During the second year of life,

WIC Infant and Toddler Feeding Practices Study-2: Second Year Report xxxiii
they fall within acceptable levels as percentages of total daily energy intake, which are based on the ideal range necessary to reduce chronic disease risk.15 At 3 and 5 months, median levels of most micronutrients exceed the levels specified as adequate intake in the DRIs for these ages. Vitamin D is the exception, with levels consistently below the recommended level. The same pattern is seen from 7 to 11 months, with median levels of most micronutrients exceeding the levels specified as adequate intake in the DRIs for these ages. Vitamin D is again an exception, with the median level falling below recommended levels at every month. Looking specifically at iron and zinc, two micronutrients of particular concern in infancy and early childhood, estimates of the prevalence of inadequate intakes for iron are 20 percent at month 7, 16.7 percent at month 9, and 14.7 percent at month 11. Estimates of the prevalence of inadequate intakes for zinc are 17.4 percent at month 7, 11.4 at month 9, and 6.9 percent at month 11. During the second year of life, both vitamin E and vitamin D have high estimated prevalence of inadequate intakes (see Table 3). Estimates of the prevalence of inadequate intakes for vitamin D are all above 75 percent. Estimates of inadequate intakes of vitamin E are also high. All other median levels of micronutrients, including iron and zinc, have estimates of the prevalence of inadequate intake below 5 percent. Table 3. Estimated prevalence of inadequate intake levelsa of micronutrients among study
children during the second year of life
Micronutrients
Estimated average
requirement
Percentage of study children with inadequate intakes
Month 13 Month 15 Month 18 Month 24 Antioxidants Vitamin C (mg/d) 13 0.0% 0.4% 0.0% 0.0% Vitamin E (mg/d) 5 66.6 77.4 71.8 55.0 B vitamins Thiamin (mg/d) 0.4 0.2 0.2 0.2 0.1 Riboflavin (mg/d) 0.4 0.1 0.1 0.0 0.0 Niacin (mg/d) 5 0.6 1.4 0.2 0.3 Vitamin B-6 (mg/d) 0.4 0.2 0.3 0.0 0.1 Folate (µg/d) 120 2.6 3.0 0.7 0.9 Vitamin B-12 (µg/d) 0.7 0.1 .3 0.0 0.9 Bone-related nutrients Calcium (mg/d) 500 3.6 4.9 2.8 0.9 Phosphorus (mg/d) 380 1.4 0.8 0.6 0.1 Magnesium (mg/d) 65 0.4 0.3 0.3 0.0 Vitamin D (µg/d) 10 75.6 76.3 78.8 77.6
15 These types of acceptable level standards have not yet been identified for infants.

WIC Infant and Toddler Feeding Practices Study-2: Second Year Report xxxiv
Table 3. Estimated prevalence of inadequate intake levelsa of micronutrients among study children during the second year of life (continued)
Micronutrients
Estimated average
requirement
Percentage of study children with inadequate intakes
Month 13 Month 15 Month 18 Month 24 Other micronutrients Vitamin A (µg RAE/d) 210 0.2 0.3 0.5 0.5 Iron (mg/d) 3.0 1.5 2.9 0.8 0.3 Zinc (mg/d) 2.5 0.2 0.0 0.4 0.2 Unweighted n 2,763 2,048 1,973 2,434 Weighted n 434,035 437,375 437,505 438,206
a Estimated Average Requirements (EARs) represent levels of daily intake sufficient to meet the nutrient requirements of half of all healthy individuals, and are the standard used within each age group to estimate the prevalence of inadequate intakes. The prevalence of inadequate intakes is estimated as the proportion of the population with intakes below the EAR.
Weight and Growth
WIC ITFPS-2 explores weight-for-length among WIC infants and children, and the relationship between feeding practices and weight-for-length, in three measurement periods: early infancy (1 to less than 7 months), late infancy (7 to 15 months), and toddlerhood (20 to 28 months). To evaluate weight-for-length in study children, WIC ITFPS-2 compared study children against international weight and length standards for children from birth to age 24 months put forward by the World Health Organization (WHO) in 2006, and adopted by the Centers for Disease Control and Prevention (CDC). The WHO standards allow categorization of study children’s weight and growth outcomes into low, healthy, and high groupings. Consistent with WHO and CDC guidelines, those in the low group have weight-for-length outcomes that fall below the 2.3rd percentile; those in the healthy group have outcomes that fall between the second and 97.7th percentile; and, those in the high group have outcomes that fall above the 97.7th percentile.

WIC Infant and Toddler Feeding Practices Study-2: Second Year Report xxxv
Distribution of Weight-for-Length
Figure 11 presents the percentage distribution of study children in each weight-for-length category by the three measurement age periods, early infancy (1 to <7 months), late infancy (7 to 15 months), and toddlerhood (20 to 28 months). In early infancy, 83 percent of study children fall within the healthy group; in late infancy, 80 percent do; and, in toddlerhood, 76 percent do. As the percentage of children with a healthy weight-for-length falls, the percentage of children in the high weight-for-length group rises, from 16 percent in early infancy to 19 percent in late infancy, and 23 percent in toddlerhood. These increasing rates of high weight-for-length are consistent with other research on low-income WIC children,16,17 but are nonetheless concerning.
Figure 11. Percentage of study children by age and weight-for-length
1%
83%
16%
1%
80%
19%
1%
76%
23%
Low Healthy High
Weight for Length Groups
Early infancy Late Infancy Toddlerhood
Predictors of High Weight-for-Length
In bivariate analyses, few socio-demographic or behavioral variables emerge as statistically significant predictors of high weight-for-length across the first 2 years of life. Breastfeeding duration, however, is positively related to weight-for-length status around the second birthday: children who are never breastfed, or breastfed less than 2 months, are significantly more likely to be high weight-for-length, whereas children who are breastfed at least 13 months are significantly less likely to be high weight-for-length. In multivariate analyses, the only feeding practice that significantly increases the odds of high weight-for-length around the second birthday is the introduction of complementary foods prior to four months of age. Rapid weight gain into toddlerhood, time the child spends playing video games, and high birth weight also increase the odds of being high weight-for-length. 16 Aldrich, H., and Gance-Cleveland, B. (2016). Comparing weight-for-length status of young children in two infant
feeding programs. Maternal and Child Health Journal, 20(12), 2518-2526. 17 Freedman, D.S., Sharma, A.J., Hamner, H.C., Pan, L., Panzera, A., Smith, R.B., and Blanck, H.M. (2017). Trends in
weight-for-length among infants in WIC from 2000-2014. Pediatrics, 139(1), e20162034.

WIC Infant and Toddler Feeding Practices Study-2: Second Year Report xxxvi
Summary, Limitations, and Next Steps
Summary of Findings
Results through the second year show that most of today’s WIC families are engaging in a variety of health-promoting feeding practices:
Balancing work and breastfeeding. Among WIC ITFPS-2 mothers who have returned to work full-time by 3 months, 34 percent are breastfeeding.
Making expected developmental progress. At 13 months, 97 percent of WIC ITFPS-2 children are picking up food with their fingers to self-feed, and 66 percent are feeding themselves with a spoon at 18 months. These findings demonstrate that the children are making expected developmental progressions in self-feeding.
Eating a varied diet of healthy foods. WIC ITFPS-2 study children are consuming a varied diet as they move into the second year, including fruits, vegetables, dairy, and meats and other proteins. Many of the most commonly consumed foods are those included in the WIC food packages.
Meeting recommended nutrient intake. WIC children have median nutrient intake levels that mostly meet or exceed recommended levels through the first 2 years of life. Vitamin D is a notable exception, falling below recommended levels at all ages. Iron and zinc intake, which are nutrients of particular concern for infants and young children, each have estimated prevalence of inadequate intake below 20 percent during the first year of life, and below 5 percent during the second year of life.
Some practices and outcomes are less encouraging, and warrant monitoring as WIC ITFPS-2 continues:
Increasing consumption of sweetened and salty foods. By 24 months, 52 percent of study children consume a dessert or candy, 23 percent consume a sugar-sweetened beverage, and 24 percent consume a salty snack on a given day.
Falling short of recommended levels of vitamin D. WIC ITFPS-2 children have consistently high prevalence of inadequate intake of vitamin D.
Increasing rates of high weight-for-length. In early infancy, about 16 percent of the children are high weight-for-length. By the time around their second birthday, 23 percent of children fall with the WHO’s high weight-for-length range.

WIC Infant and Toddler Feeding Practices Study-2: Second Year Report xxxvii
Interpreting Study Findings
As with all research studies, design decisions and study-specific goals for WIC ITFPS-2 result in limitations to the conclusions that the study team can draw, both now and in future analyses. There are several issues in the design and implementation of WIC ITFPS-2 that should be considered when interpreting results. First, as an observational study, WIC ITFPS-2 is well-suited to studying the influences of an ongoing public program. Because of this observational study design, however, the study team can only infer causality between program predictors and outcomes, rather than establishing it with certainty. Second, sample eligibility and weighting should be considered in interpreting the data. Women who were eligible for the study met specific enrollment criteria described earlier in this document. Additionally, the weighted sample represents the infants from this population who enrolled in WIC during our 20-week enrollment period. Consequently, findings may not apply fully to WIC mothers with different characteristics, nor can the sample be interpreted as representing a full year of WIC enrollments. Finally, the scope of the study must be considered. Much of the data for WIC ITFPS-2 came from interviews with the caregivers themselves. These data are therefore filtered through the perceptions and memories of those caregivers. The study data also do not cover all potential influences on feeding practices and health. Factors beyond those explored in this study may influence, and continue to influence, dietary intake, health behaviors, and weight status. Next Steps
This is the third in what will be a series of reports from the ongoing WIC ITFPS-2. Subsequent reports from the study will cover ages 3, 4, and 5 years, examining dietary intake, health outcomes, and family feeding practices of WIC children. The data from WIC ITFPS-2, which the FNS will make available, will also provide scientific researchers and the public with a landmark platform of data from which to pursue further analyses on nutrition and health in children of low-income families.

WIC Infant and Toddler Feeding Practices Study-2: Second Year Report xxxviii
There are many research topics from this report that will be carried forward and explored further in subsequent WIC ITFPS-2 reports. Two that are particularly notable are:
WIC ITFPS-2 will continue to track median energy and nutrient intake among children beyond the first 2 years of life. Given WIC’s goal of safeguarding the health of low-income children by providing nutritious supplemental foods, it will be important to continue examining participants’ dietary intake.
WIC ITFPS-2 will continue to follow the weight and height of WIC children through age 5 years, to understand the future trajectory of high weight-for-length children in this population, and determine how high weight-for-length by age 2 years relates to subsequent overweight or obesity status.

Study Overview 1
WIC Infant and Toddler Feeding Practices Study-2: Second Year Report 1-1
1.1 Background
The Special Supplemental Nutrition Program for Women, Infants, and Children (WIC) was established to safeguard the health of low-income pregnant women and infants who are at nutritional risk. The program was established by Congress as a pilot in 1972 under Public Law 92-433, Section 17 to the Child Nutrition Act of 1966, and made permanent in 1974.18 The program provides nutrition assistance to pregnant, postpartum, and breastfeeding women and their infants and children up to age 5. Participants must meet the income guidelines and have a household income at or below 185 percent of the Federal Poverty Level ($44,123 for a family of four in 2014) or be eligible based on participation in certain other means-tested benefit programs. The Food and Nutrition Service (FNS) of the U.S. Department of Agriculture (USDA) administers WIC, which is a Federal grant program, to 90 WIC State Agencies (SAs), including Indian Tribal Organizations (ITOs) and U.S. Territories. The SAs are responsible for program operations within their jurisdictions, and they provide services primarily through contracts with local WIC-sponsoring agencies (e.g., health departments, community centers, hospitals) that provide services to WIC participants at local service sites or clinics. The WIC Infant and Toddler Feeding Practices Study (WIC ITFPS-2) is a longitudinal study designed to measure the feeding practices employed by caregivers and the nutrition outcomes of children who participate in WIC. By capturing data on caregivers and their children over the first 5 years of the child’s life, the study informs a series of research questions regarding feeding practices, the association between WIC services and those practices, and the health and nutrition outcomes of children on WIC. Additionally, the study updates past analyses to assess changes in behaviors and trends that may have occurred over the past 20 years—that is, since the last major study of the diets of infants who were WIC participants.
18 USDA Food and Nutrition Service. (n.d.). About WIC-WIC’s Mission. Retrieved from
http://www.fns.usda.gov/wic/about-wic-wics-mission on October 20, 2017.
WIC Infant and Toddler Feeding Practices Study-2: Second Year Report 1-2
The study is heavily predicated on the design used for the 1997 Food and Consumer Service’s19 longitudinal WIC Infant Feeding Practices Study (WIC IFPS-1) (Baydar, McCann, Williams, & Vesper, 1997). WIC ITFPS-2 also makes comparisons to some studies that did not focus specifically on the WIC population. The Food and Drug Administration’s Infant Feeding Practices Study II (FDA IFPS-II) (Fein et al., 2008b), which is a well-known longitudinal study of infant feeding practices, was used extensively as a frame of reference during planning. Building on past longitudinal work maximizes the comparability between current study data and past work, which facilitates assessing changes over time. The study also makes comparisons the Gerber/Nestle Feeding Infants and Toddlers Studies (FITS) conducted in 2002 and 2008 to address nutrition and feeding practices of toddlers (Briefel et al., 2010; Ponza, Devaney, Ziegler, Reidy, & Squatrito, 2004; Ziegler, Briefel, Clausen, & Devaney, 2006). Additionally, in developing and revising the instruments, the study team has leveraged many of the approaches used in previous studies, such as rotating question modules, to ensure study efficiency. The seven primary objectives for the WIC ITFPS-2 include:
Update results of data collected in the 1997 WIC IFPS-1.
Compare new findings with other major studies (WIC IFPS-1, FDA IFPS-II, and the FITS 2002 and 2008).
Assess effectiveness of different education and breastfeeding promotion approaches in achieving recommended feeding patterns and behaviors.
Assess conditions of overfeeding, overconsumption, underfeeding, and inappropriate feeding.
Identify WIC nutrition education influences on feeding practices.
Assess impact of WIC food packages on feeding-related outcomes.
Determine change in maternal feeding practices and behaviors over time as infants and children transition into or out of WIC.
The study is designed to meet the seven objectives as well as answer 60 research questions specified by FNS. These questions are listed in Appendix A.
19 In 1998, the Food and Consumer Service was renamed as the Food and Nutrition Service.

WIC Infant and Toddler Feeding Practices Study-2: Second Year Report 1-3
1.2 Study Design
This observational study follows a hybrid design, incorporating a core longitudinal sample (the “core” sample) and a supplemental cross-sectional sample (the “supplemental” sample) to ensure precision in estimates at key points in time. The core longitudinal sample of women and their infants was enrolled in the study as they enrolled in WIC (either prenatally or before their infant is 2.5 months old if they did not enroll prenatally). The babies are followed until they are 60 months old, with up to 17 maternal (or primary caregiver20) interviews occurring prenatally, and at 1, 3, 5, 7, 9, 11, 13, 15, 18, 24, 30, 36, 42, 48, 54, and 60 months. The supplemental cross-sectional sample was also recruited as the women and their infants enrolled in WIC. This sample is interviewed at 10 key time periods (1 or 3, 7, 13, 24, 30, 36, 42, 48, 54, and 60 months).21 To become eligible for inclusion in the analysis sample, participants must complete either a 1-month or 3-month interview. This report uses data from the prenatal interview and the 1-, 3-, 5-, 7-, 9-, 11-, 13-, 15-, 18-, and 24-month interviews. Observational studies are well suited to social programs such as WIC for which random assignment is not feasible. The direct observation of individuals in their natural setting captures the multiple effects of participation in WIC. However, as an observational study, it should be noted that it is impossible to definitively attribute causality. The study team hypothesizes relationships and the analyses infer causality based on the correlations between variables; but causality cannot be unequivocally established. 1.3 Sample Selection
The goal of the WIC ITFPS-2 is to collect data from a nationally representative sample of participants who enroll in WIC prior to 3 months of age. This includes both those who enroll while the mother was pregnant, and those who first enroll as infants. To obtain a representative sample of WIC participants for WIC ITFPS-2, first a sample of WIC sites was selected, and then a sample of
20 Over 98 percent of respondents are biological mothers. Throughout the report the terms “mother” and “caregiver”
are used interchangeably. Throughout this report the term “infant” applies to the 0-13 month period; the term “child” applies to the entire period from 0-60 months.
21 Study interviews are more frequent during the infant year to capture the rapid changes in feeding practices, and less frequent in subsequent years to reduce burden on participants. The supplemental sample interviews were selected with attention to achieving desired precision levels for subgroups at key time periods.

WIC Infant and Toddler Feeding Practices Study-2: Second Year Report 1-4
participants enrolling in WIC at each of the selected WIC sites was selected. A summary of the sampling plan is given below and further details of these procedures are provided in Appendix B1. 1.3.1 Sampling WIC Sites
The WIC sites were selected using a stratified two-stage sampling approach. Because no national list of service sites exists, a summary file at the level of the unit (either local agency or service site/clinic) reported by each SA in the census of April 2010 (the WIC Program and Participant Characteristics 2010, or PC2010) was used as the sampling frame. This census resulted in a file with one record for each participant being served by WIC in that month. Because SAs had flexibility for how they reported local agency and service site/clinic identifiers for PC2010, the IDs provided in the records varied; some provided the service site ID in addition to a local agency code, while others included only a local agency code. As a result, two stages of selection were used to sample sites. The first stage involved the sampling of “PC2010 tabulation units”—the units for which IDs were provided in the PC2010 data. The second stage involved the sampling of local sites/clinics for situations in which the sampled tabulation unit was a local agency. The sample was stratified to improve the precision of survey estimates. To achieve this goal, the strata were formed in such a way that the units within the strata were more similar to each other (in terms of characteristics related to key survey outcomes) than units in general (i.e., strata should be internally homogeneous). Five characteristics of the first-stage sampling unit or its SA were used to group the sites into a total of 40 strata for selection (see Appendix B1, Table B1-1 for more details). The first three of these five characteristics are actually features of the WIC State Agency Plan and were included because they may be associated with key survey outcomes related to breastfeeding and nutrition. The characteristics included:
Peer Counseling Program. Whether the SA has a breastfeeding peer counseling program in place.22
Trained Paraprofessionals. Whether SA policy allows for trained paraprofessionals to provide nutrition education (versus requiring that staff members that provide nutrition education have professional training or credentials).
22 Ultimately there was no variation in this characteristic; all states reported offering a breastfeeding peer counseling
program.

WIC Infant and Toddler Feeding Practices Study-2: Second Year Report 1-5
Policy to Provide Formula. Whether SA policy permits providing one can of formula for breastfeeding infants during the first 30 days of life.
Percent of Women Who Used the Fully Breastfeeding Package. The PC2010 data were used to measure food-package selection by first-stage sampling unit, and this rate was computed by taking the ratio of the number of postpartum women who received the fully breastfeeding package during April 2010 to the total number of postpartum women receiving any food package that same month.
Average of Children’s and Mothers’ High Weight for Height Rates. The PC2010 data were used to estimate the percent of children and the percent of mothers who are “high weight for height”23 at the first-stage sampling unit level, and these percentages were averaged together to get a measure of risk of being overweight for all participants at the first-stage sampling unit level.
Within each stratum, two sites were sampled with probabilities proportional to size, where the measure of size was the expected number of eligible enrollees. Thus, a total of 80 WIC sites were sampled. These sites are operated by 27 WIC SAs. 1.3.2 Sampling WIC Enrollees
The study sampled new WIC participants who enrolled at the sampled sites during a pre-specified time period deemed the “recruitment window.” Specifically, the sample included all new women enrolling in WIC for the first time for either their current pregnancy or their newborn at the site during the recruitment window.24 The recruitment window was a consecutive string of days during the study recruitment period in which all new WIC enrollees in that site were screened for eligibility and recruited into the WIC ITFPS-2. The length of the recruitment window for each site was pre-determined based on the estimated amount of time needed to yield 98 eligible new WIC enrollees per site (the target sample size for each site).25 The start date for the recruitment window was randomly assigned to each site. Because the flow of new WIC enrollees into the 80 sites varied substantially, the window length was much shorter in sites with a “high flow” of new enrollees 23 For children (12 months or older), “high weight for height” is determined based on nutrition risk code 110 (see
http://www.fns.usda.gov/sites/default/files/WICPC2010.pdf, accessed May 8, 2017). For children 24 months and older, it is defined as higher than the 95th percentile of body mass index (BMI) for age. For children 12 to 24 months, it is defined as at risk of being overweight by virtue of having a mother or father who is obese (BMI of 30 or greater). For mothers, the criterion is a pregravid BMI of 25 kg/m2 or higher.
24 Women who had enrolled in WIC for previous pregnancies and/or enrolled other children in WIC were eligible for the study. Women below the age of 16, those who did not speak English or Spanish, and those enrolling a child over 2.5 months of age were not eligible for the study.
25 Estimated amount of time needed to yield 98 new WIC enrollees was based on July 2012 enrollment figures from the sites.

WIC Infant and Toddler Feeding Practices Study-2: Second Year Report 1-6
compared to sites with a “low-flow.” The study participants must have enrolled in WIC at the site during the recruitment period, although the study screening and enrollment could occur at a later date. Core and Supplemental Samples. Two samples were selected at each service site: a core longitudinal and supplemental cross-sectional sample. The core sample was originally designed to be an equal probability sample of all new enrollees. The supplemental sample was designed to focus on subpopulations with specific characteristics of interest to FNS such as African American mothers and infants enrolled postnatally with no prenatal WIC exposure. During the study recruitment period, changes were made to the approach for assigning cases to the core and supplemental samples, as well as to subsampling cases for the supplemental sample, which are discussed in more detail in Appendix B1. For some interviews, both the core and supplemental sample (combined) are interviewed; for other interviews, only the core sample is interviewed. Multiple Births. For those study mothers who had multiple births such as twins, a single infant was sampled at the first postnatal interview. 1.4 Data Sources
During the 6-year data collection period beginning in July 2013,26 the study is collecting data from numerous sources. The main source is a series of follow-up telephone interviews with the mother. Other key information such as child’s weight and length is being obtained periodically from WIC administrative records or health care providers; and contextual information about the WIC sites and State policies is obtained from clinic and WIC program staff.27 The data sources include:
Screening and enrollment interviews with recruited WIC enrollees;
Telephone follow-up interviews with study participants conducted prenatally and when their babies are 1, 3, 5, 7, 9, 11, 13, 15, 18, 24, 30, 36, 42, 48, 54, and 60 months of age;
26 The study collects data over a 6-year period, but the length of time a mother is a participant is dependent on when she
was recruited. Mothers recruited when they were 1-month pregnant are participants for 5.8 years, whereas mothers enrolled when their baby was 2.5 months old are in the study for about 4.8 years.
27 Information about the WIC sites is used as covariates in exploring the variation in feeding practices. Only site-level data on modes of nutrition education delivery are available for this study; no data are available on the mode of nutrition education received by individual study participants. See Appendix B2 for details.

WIC Infant and Toddler Feeding Practices Study-2: Second Year Report 1-7
WIC administrative records or health care provider records for height and weight measures when the babies are born and at 6, 12, 24, 36, 48, and 60 months of age;
WIC administrative records for WIC food packages provided to mothers and infants;
Site visits to participating WIC sites and key informant interviews that profile state and local policies and practices; and
A WIC site staff survey that collects information on local WIC programs and the training and experience of the staff.
Table 1-1 presents an overview of the information being obtained from each data source. Key content areas include socio-demographic characteristics, knowledge, and lifestyle; feeding practices and experiences; childrearing practices; and weight and length outcomes. 1.5 Data Collection Procedures
The study is using multiple modes of data collection to obtain the necessary information to support the study objectives. Study mothers were recruited in-person at WIC sites, and are administered regular follow-up interviews by telephone. In addition, study staff periodically submit requests to SAs for data on the mother and child from WIC administrative records (e.g., length and weight data and food package data). The study also collected data from WIC site staff using a web survey, and from State and local agencies staff using a mix of in-person and telephone interviews. 1.5.1 Recruiting WIC Participants
Recruitment activities were rolled out over a 12-week period in the 80 sampled sites, with recruitment starting July 1, 2013 and ending November 18, 2013. Each site was assigned a recruitment window with the length of the recruitment window determined by the flow of new enrollees in the site. The target for each site was to sample 98 women and enroll in the study an average of 55 to 56 respondents per site during the recruitment window.

WIC Infant and Toddler Feeding Practices
Study-2: Second Year Report
1-8
Table 1-1. Domains by source of data
Domain
Source of data
Scre
enin
g/
enro
llmen
t
WIC participant survey interview
WIC
Adm
in. d
ata
Staf
f sur
vey/
ke
y in
form
ant
inte
rvie
ws
Base
linea
Pren
atal
1 m
onth
3 m
onth
s
5 m
onth
s
7 m
onth
s
9 m
onth
s
11 m
onth
s
13 m
onth
s
15 m
onth
s
18 m
onth
s
24 m
onth
s
30 m
onth
s
36 m
onth
s
42 m
onth
s
48 m
onth
s
54 m
onth
s
60 m
onth
s
Socio-demographic characteristics
WIC site characteristics and policies
WIC program awareness and utilization
Maternal health and lifestyle Feeding experience, knowledge, attitudes, beliefs, information, advice
Hospital feeding related practices
Current feeding practices 24-hour dietary recall Child health behavior/rearing practices
Food access and preferences Child developmental milestones
Child weight and lengthb WIC food package typec Contact updates New caregiver characteristics * * * * * * * * * * * * * * * *
a After Screening/Enrollment, baseline module questions are asked at the first interview (could be prenatal, 1 month, or 3 month) in addition to the other survey module completed at that same interview.
b Reported height and weight are gathered from interviews at months 30, 36, 48, and 60. WIC administrative records or health care provider records are used for actual height and weight measures when the babies are born and at months 6, 12, 24, 36, 48, and 60.
c Maternal food package data are collected at postnatal certification and at 6 months. Infant food package data are collected at initial infant certification, 6-month mid-certification, and 11 months. Food package data are not collected after 11 months because there is only one non-medical food package for children ages 1-4 years.
* These questions are asked anytime someone permanently replaces the primary caregiver.

WIC Infant and Toddler Feeding Practices Study-2: Second Year Report 1-9
In all but three of the 80 sites, an on-site Westat field recruiter was responsible for screening and enrolling eligible participants into the study.28 To be eligible for the study, the participant needed to speak English or Spanish, be at least 16 years of age, and enroll in WIC for the first time for her current pregnancy or enroll a new baby less than 3 months old. WIC staff certifying new WIC enrollees identified eligible study participants. The on-site recruiter explained the study to the potential study participant, who was randomly assigned as a candidate for either the core or supplemental group. The recruiter then completed a computerized screener to verify study eligibility, obtained written informed consent, and conducted a computerized 10-minute enrollment interview. If interested participants could not stay to be enrolled on site, the recruiter followed up by telephone and conducted the screener and enrollment interview over the phone. All participants were given a $50 incentive for enrolling in the study and subsequent cash incentives for each completed interview. A total of 6,775 WIC participants were referred to the study across the 80 sites and 4,367 were enrolled. Table 1-2 shows the disposition status of all participants referred. Study eligibility was undetermined for 987 referred participants, 816 refused to complete the referral form or screener, and 171 left the WIC site before completing the screener and could not be reached by telephone. Table 1-2. Status of all referred participants
Total referred Eligible Enrolled Ineligible Eligibility undetermined 6,775 4,489 4,367 1,299 987
1.5.2 Interviewing WIC Participants
The study is conducting follow-up interviews with WIC participants over a 6-year period, beginning in July 2013 and ending in July 2019. Study participants assigned to the core sample are interviewed more frequently than those in the supplemental sample. As shown in Table 1-3, WIC participants in the core sample who enrolled prenatally are contacted to be interviewed 17 times over approximately a 5-year period, and women who enrolled in WIC after giving birth participate in 15 or 16 interviews (depending on the age of their child when they enroll). If their baby is less than 6 weeks old, they start with the 1-month interview; however, if their baby is between 6 weeks and 2.5 months old, they start with the 3-month interview. In the supplemental sample, women either
28 In three sites, WIC staff identified eligible women and sent their contact information to Westat; Westat interviewers
recruited the women by telephone.

WIC Infant and Toddler Feeding Practices Study-2: Second Year Report 1-10
receive a 1-month or a 3-month interview, but not both. Those who enrolled prenatally or before their child was 6 weeks old receive a 1-month interview, whereas those enrolled after the baby is 6 weeks old receive a 3-month interview. All supplemental sample women are interviewed at nine additional time points. Table 1-3. Frequency of interviews for core and supplemental samples
Status of pregnancy at time of WIC enrollment
Interview schedule
Tota
l
Pren
atal
1 m
onth
3 m
onth
s
5 m
onth
s
7 m
onth
s
9 m
onth
s
11 m
onth
s
13 m
onth
s
15 m
onth
s
18 m
onth
s
24 m
onth
s
30 m
onth
s
36 m
onth
s
42 m
onth
s
48 m
onth
s
54 m
onth
s
60 m
onth
s
Core sample Prenatal 17 Infant <6 weeks 16
Infant 6 weeks – 2.5 months
15
Supplemental sample Prenatal 10 Infant <6 weeks 10
Infant 6 weeks – 2.5 months
10
The prenatal interviews were all completed within 60 days of enrollment. The follow-up interviews are scheduled based on the child’s birthday and the window for conducting the follow-up interview starts 14 days before the child turns the age of the interview (e.g., 14 days before the child is 1 month old, 3 months old, etc.). Because women could enroll in WIC at any stage in their pregnancy and many participants were recruited after the baby was already born, the length of time each follow-up interview is in the field is about 15 months. Per the caregiver’s preference, the telephone interviews are conducted in English or Spanish. All post-birth interviews except the 30-, 42-, and 54-month interviews include a 24-hour dietary recall using the USDA’s Automated Multi-Pass Method (AMPM) (Raper, Perloff, Ingwersen, Steinfeldt, & Anand, 2004). The AMPM has been used to assess infant and child diet in other nationally representative studies, including the National Health and Nutrition Examination Survey (NHANES) (Ahluwalia et al., 2016). The AMPM is constructed such that the caregiver is asked to recall all her

WIC Infant and Toddler Feeding Practices Study-2: Second Year Report 1-11
child’s dietary intake from 12:00 a.m. through 11:59 p.m. on the previous day. There are five steps to the AMPM method of collecting intake information from a respondent (Moshfegh et al., 2008):
1. Collect a quick list of all foods consumed during the target period;
2. Elicit information on nine categories of often forgotten foods;
3. Collect information on when each food was consumed, and the name of each eating occasion;
4. Collect detailed information on each food reported;
5. Provide a final opportunity to recall easily forgotten or disregarded foods.
Using this method, the caregiver is guided through the day and asked to report all foods, beverages, and dietary supplements for each eating event during the 24-hour period, which are recorded by the interviewer. Because the dietary recalls are conducted over the telephone, caregivers receive a package of measuring guides to help them more accurately report their child’s portion sizes during the interview. Within 10 days of the initial dietary intake interview, the study collects a second, replicate intake on a randomly selected 10 percent subsample of children at 13, 15, 18, 24, 36, 48, and 60 months to use in estimating “usual” intake of energy and nutrients for all respondents.29 The interview data are then coded and analyzed for nutrient and food group content. When breastmilk is fed directly from the breast, the caregiver cannot report exact quantities consumed. For such circumstances WIC ITFPS-2 follows the same procedures as the FITS 2008 study (Butte et al., 2010) and other research (Heinig, Nommsen, Peerson, Lonnerdal, & Dewey, 1993), using the child’s age and breastfeeding exclusivity status to estimate breastmilk intake quantities.30 1.5.3 Collecting Food Package Data
Throughout the first year of the child’s life, WIC administrative data are used to identify what WIC food packages the mother and child are receiving. The study collects maternal food package information at postnatal certification and at 6 months, while infant food package information is collected at initial infant certification, at 6-month mid-certification, and at 11 months. Food package
29 See Appendix B4 for details of the computation of usual intake using the NCI Method. 30 Nutrient content of breastmilk is listed in the USDA Food and Nutrient Database for Dietary Studies (Ahuja et al.,
2012) used to determine nutrient content of all AMPM reported foods.

WIC Infant and Toddler Feeding Practices Study-2: Second Year Report 1-12
data are not collected after 11 months because there is only one non-medical food package for children ages 1-4 years (food package IV). 1.5.4 Collecting Height and Weight Data
The study collects administrative weight and length/height measurements of the children at birth, 6 months, 12 months, 24 months, 36 months, 48 months, and 60 months. As part of regular clinic visits, WIC sites collect these data for most enrolled participants and report the information to the State. The study then requests these measurements from the state’s WIC administrative data. Through 24 months, for participants who are in the core sample and have left WIC, the study attempts to collect weight and length information from the child’s health care provider. For those who do not have a health care provider, study staff arrange for a local home health agency to obtain weight and length measurements. After 24 months, the study asks all participants who are no longer receiving WIC to return to the WIC site to be measured, visit their health care provider for measurement, or agree to a home health agency visit. Caregiver reports of child weight and height are also sought during telephone interview at ages 30-, 36-, 48-, and 60-months. 1.5.5 Conducting Site Visits and Key Informant Interviews
To characterize the policies and services of the sites, an onsite visit was conducted by Westat’s partner, Altarum Institute, to each of the 80 sites between June and November 2013. The visits included observation of service delivery and a 1-hour key informant interview with the site supervisor or coordinator and other staff identified by the State or site. Additional key informant interviews were also conducted with one or more staff of each of the 27 SAs by telephone. The State WIC Director determined the appropriate staff member(s) for the SA interviews. The key informant interviews covered staff qualifications and training, nutrition education, breastfeeding support, and food package choices and policies. These data were used to create WIC program-related composite variables for analyses (see Appendix B2 for details). 1.5.6 Conducting the WIC Staff Survey
To obtain detailed information about staff qualifications that may affect how services are delivered, Altarum conducted a web survey between July and December 2013 to collect information from

WIC Infant and Toddler Feeding Practices Study-2: Second Year Report 1-13
WIC staff members who were working in the study sites during the time period when participants were being recruited for the study. The online survey took approximately 30 minutes to complete, and covered staff demographic characteristics and education, WIC training, beliefs about WIC program impacts and influences on infant and child feeding practices, nutrition and breastfeeding education, materials, recommendations, and staff health behaviors. All staff members at each of the 80 study sites were asked by local leadership to complete a survey. A total of 802 staff completed the survey, and surveys were received from all 80 sites. These data were used to create WIC program-related composite variables for analyses (see Appendix B2 for details). 1.6 Weighting and Imputation
The data are weighted to support national estimates. The weights inflate the sample to represent the population and compensate for both the unequal sampling rates and nonresponse. For WIC ITFPS-2, the sample is weighted to represent the national population of infants enrolled in WIC for the first time either while the mother is pregnant, or postnatally before 3 months of age, whose mothers are at least 16 years old and speak either English or Spanish. All study findings are reported as percentages or proportions, and represent the characteristics, views, behaviors, and experiences of this population. Because the recruitment period for the study spanned 20 weeks, the weighted number of cases shown in the report tables is an estimate of the number of infants in the represented population who enrolled nationally during that 20-week period (July – November 2013), rather than an estimate of the monthly or annualized total number of WIC participants nationally, and should not be used as such. The complex sample design also affects variance estimation. Replicate weights that facilitate accurately estimating the variances given the sample design are provided. Additionally, although almost all study participants have answered all the questions regarding key socio-demographic characteristics, there are few cases of item nonresponse for these variables. As these variables are used repeatedly in the analysis, missing baseline socio-demographic information has been imputed. Appendix B1 offers additional detail on weighting and imputation.

WIC Infant and Toddler Feeding Practices Study-2: Second Year Report 1-14
1.7 Sample Characteristics
As shown in Table 1-4, 4,489 new WIC enrollees were eligible to participate in the study and of those 4,367 (97%) were enrolled. Of these enrollees, 2,649 women are in the prenatal core sample and completed a prenatal interview. Similarly, across all the sampling groups, 3,777 respondents completed at least 50 percent of the core baseline module questions in the 1- or 3-month interview and were therefore eligible to continue in the study. These individuals comprise the main analysis sample. Table 1-4. Study sample participation
Sample and enrollment timing
Eligible sample, screened and
eligible
Enrolled sample,
consented and enrolled
Percentage of enrolled sample used for prenatal
analysis (N)
Percentage of enrolled sample used
for main analysis (N)
Total sample 4,489 4,367 60.7% (2,649) 86.5% (3,777) Core sample 3,605 3,503 ‒ 86.2% (3,020)
Prenatal core sample 3,122 3,037 87.2% (2,649) 85.5% (2,596) Postnatal core sample 483 466 ‒ 91.0% (424)
Supplemental sample 884 864 ‒ 87.6% (757) Prenatal supplemental sample 688 678 ‒ 86.9% (589) Postnatal supplemental sample 196 186 ‒ 90.3% (168)
Because women are both recruited into the study and have their babies over a long time window, their interviews are occurring at different times. Table 1-5 shows the percentage of the analysis sample that has completed interviews through 24 months postpartum. Table 1-6 shows the percentage of participants on whom the study received weight/length and food package data through 24 months.

WIC Infant and Toddler Feeding Practices Study-2: Second Year Report 1-15
Table 1-5. Counts and percentage of respondents who completed interviews by sample type and interview month
Interview
Percentage of the analysis sample that completed the interviews Total combined sample
(N=3,777) Core sample (N=3,020)
Supplemental samplea (N=757)
Prenatal 70.1% (2,649) 87.7% (2,649) NA Month 1 90.0% (3,398) 90.5% (2,734) 87.7% (664) Month 3 76.3% (2,881) 92.3% (2,788) 12.3% (93) Month 5 69.8% (2,636) 87.3% (2,636) NA Month 7 83.0% (3,134) 83.2% (2,514) 81.8% (620) Month 9 64.9% (2,451) 81.2% (2,451) NA Month 11 61.5% (2,322) 76.9% (2,322) NA Month 13 74.3% (2,807) 74.1% (2,239) 75.0% (568) Month 15 54.7% (2,067) 68.4% (2,067) NA Month 18 52.7% (1,992) 65.9% (1,992) NA Month 24 65.2% (2,461) 64.1% (1,937) 69.2% (524)
a Supplemental sample is interviewed at either 1 month or 3 months, but not both.
NA denotes not applicable.
Table 1-6. Counts and percentage of analysis sample respondents on whom the study received
weight and length data, and food package data
Number received Number expected Percent received of
expected Weight and length measurementsa 6-month measurements 2,568 3,551 72.3% 12-month measurements 2,577 3,497 73.7% 24-month measurements 1,731 3,291 52.6% Infant food package prescriptionsb Initial infant certification 3,199 NA NA 6 month 3,047 NA NA 11 month 2,979 NA NA a Supplemental sample measurements for 6-, 12-, and 24-months were only sought from WIC records, and therefore not expected from
participants not receiving WIC, thus numbers are smaller than the full analysis sample of 3,777.
b Mothers’ food package data were also collected at postpartum certification and at 6 months.
NA denotes not applicable. Food package data are received on every study participant the selected WIC SAs identify as currently enrolled in WIC in that state and therefore receiving a food package.
Table 1-7 provides a summary of the initial socio-demographic characteristics of the main analysis sample. The data in this table are based on the 3,777 women who completed a 1- or 3-month interview. The variables in the table represent the socio-demographic variables used in the analyses over the course of the WIC ITFPS-2. Some counts in Table 1-6 do not total to 3,777 because of item nonresponse, but these missing demographic variables are imputed for use in the analyses.

WIC Infant and Toddler Feeding Practices Study-2: Second Year Report 1-16
Table 1-7. Socio-demographic characteristics of main analysis sample
Socio-demographic characteristics Percentage of main analysis sample (count)a Race of mother/caregiver African American 25.7 (956) White 59.0 (2,193) All Other 15.3 (567)
Ethnicity of mother/caregiver Hispanic or Latino 38.3 (1,443) Not Hispanic or Latino 61.7 (2,329)
Maternal marital status at 13 monthsb Married 33.6 (1,268) Not married (including divorced and widowed) 66.4 (2,506)
Household Food security (measured using 6-item module) at 13 monthsb High or Marginal Food Security 64.4 (2,389) Low Food Security 22.7 (841) Very Low Food Security 12.9 (479)
Participation in non-WIC programs at 13 monthsb Does not participate in other programs 14.9 (562) Participates in SNAP or in SNAP and other programs 39.8 (1,502) Participates in Other Programs Excluding SNAP 45.4 (1,713)
Birth order First born 41.3 (1,546) Second born 27.2 (1,018) Third or subsequent born 31.6 (1,183)
Timing of WIC enrollment 1st trimester 29.6 (1,118) 2nd trimester 38.9 (1,471) 3rd trimester 16.1 (608) Postnatal 15.4 (580)
Weight status of mother before pregnancy Normal or underweight 44.6 (1,653) Overweight 27.6 (1,023) Obese 27.9 (1,033)
Poverty levela 75% of poverty guideline or below 54.9 (2,036) Above 75% but ≤ 130% of poverty guideline 29.2 (1,082) Above 130% of poverty guideline 15.9 (588)
Breastfeeding history No history 54.3 (2,034) 3 or less months 21.9 (821) More than 3 months 23.7 (888)
Age of mother or caregiver at child birth 16-19 years 11.9 (446) 20-25 years 41.5 (1,569) 26 years or older 46.6 (1,762)
Birth weight Low 7.3 (248) Normal 91.5 (3,120) High 1.2 (42)
Delivery type Vaginal 67.8 (2,294) Caesarean 32.2 (1,091)
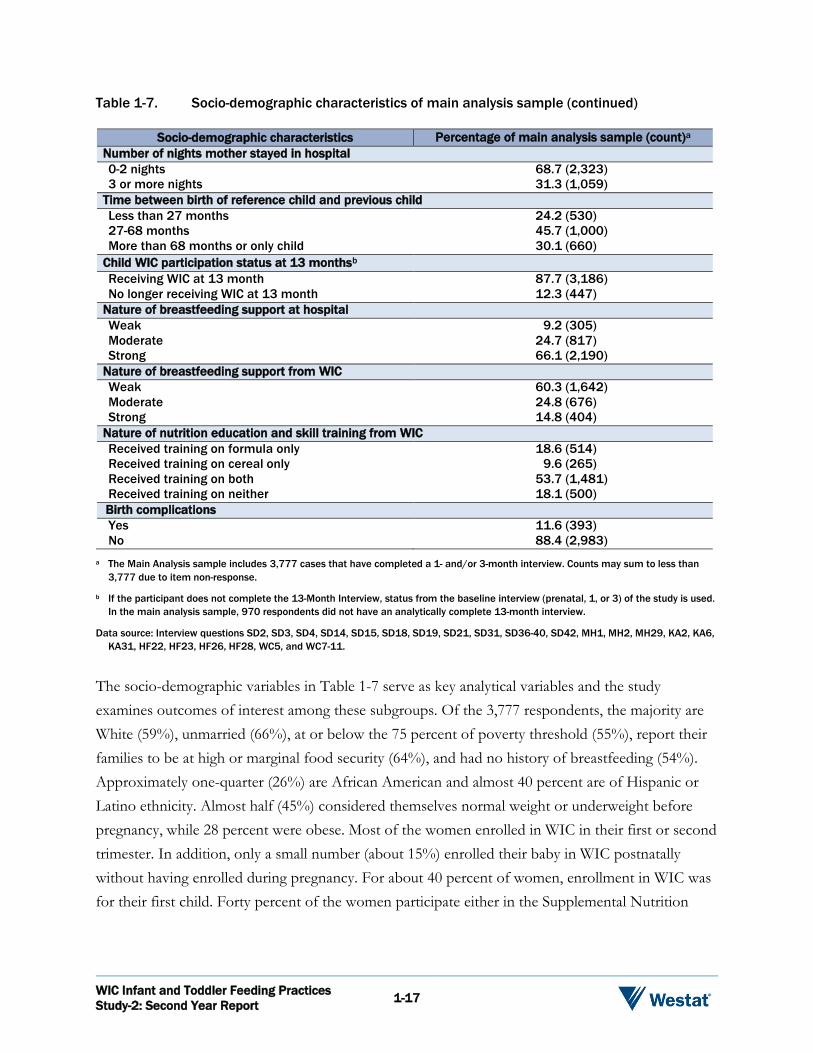
WIC Infant and Toddler Feeding Practices Study-2: Second Year Report 1-17
Table 1-7. Socio-demographic characteristics of main analysis sample (continued)
Socio-demographic characteristics Percentage of main analysis sample (count)a Number of nights mother stayed in hospital 0-2 nights 68.7 (2,323) 3 or more nights 31.3 (1,059)
Time between birth of reference child and previous child Less than 27 months 24.2 (530) 27-68 months 45.7 (1,000) More than 68 months or only child 30.1 (660)
Child WIC participation status at 13 monthsb Receiving WIC at 13 month 87.7 (3,186) No longer receiving WIC at 13 month 12.3 (447)
Nature of breastfeeding support at hospital Weak 9.2 (305) Moderate 24.7 (817) Strong 66.1 (2,190)
Nature of breastfeeding support from WIC Weak 60.3 (1,642) Moderate 24.8 (676) Strong 14.8 (404)
Nature of nutrition education and skill training from WIC Received training on formula only 18.6 (514) Received training on cereal only 9.6 (265) Received training on both 53.7 (1,481) Received training on neither 18.1 (500) Birth complications Yes 11.6 (393) No 88.4 (2,983)
a The Main Analysis sample includes 3,777 cases that have completed a 1- and/or 3-month interview. Counts may sum to less than 3,777 due to item non-response.
b If the participant does not complete the 13-Month Interview, status from the baseline interview (prenatal, 1, or 3) of the study is used. In the main analysis sample, 970 respondents did not have an analytically complete 13-month interview.
Data source: Interview questions SD2, SD3, SD4, SD14, SD15, SD18, SD19, SD21, SD31, SD36-40, SD42, MH1, MH2, MH29, KA2, KA6, KA31, HF22, HF23, HF26, HF28, WC5, and WC7-11.
The socio-demographic variables in Table 1-7 serve as key analytical variables and the study examines outcomes of interest among these subgroups. Of the 3,777 respondents, the majority are White (59%), unmarried (66%), at or below the 75 percent of poverty threshold (55%), report their families to be at high or marginal food security (64%), and had no history of breastfeeding (54%). Approximately one-quarter (26%) are African American and almost 40 percent are of Hispanic or Latino ethnicity. Almost half (45%) considered themselves normal weight or underweight before pregnancy, while 28 percent were obese. Most of the women enrolled in WIC in their first or second trimester. In addition, only a small number (about 15%) enrolled their baby in WIC postnatally without having enrolled during pregnancy. For about 40 percent of women, enrollment in WIC was for their first child. Forty percent of the women participate either in the Supplemental Nutrition

WIC Infant and Toddler Feeding Practices Study-2: Second Year Report 1-18
Assistance Program (SNAP), or in SNAP plus other public assistance programs such as Temporary Assistance for Needy Families (TANF), Medicaid, or the National School Lunch Program (NSLP). 1.8 Analysis
The analysis addresses the research questions posed by FNS, as well as supplementary questions. Many of the research questions can be answered by descriptive analyses that tabulate the responses to specific interview questions;31 however, a subset focuses on understanding the underlying population and program factors that may drive nutritional and weight outcomes. Behavioral models are used to answer these types of questions. Additionally, past analyses are repeated from the FNS-sponsored WIC IFPS-1 and the two Gerber/Nestle FITS studies. This report compares current findings to relevant past work and to current objectives and standards. 1.8.1 Descriptive Analyses
Descriptive statistics (e.g., counts, proportions, means, medians, and cross-tabulations) are used throughout the report to examine outcomes by subgroups of interest. Measures of interest are analyzed by a standard set of socio-demographic variables shown previously in Table 1-7, and then compare the subgroups to determine if the differences between them are statistically significant. Bivariate analyses consider the impact of each variable individually on the outcome of interest. Bivariate analyses, such as chi-square tests of independence, are used to explore whether these associations are statistically significant. Although chi-square indicates whether an outcome varies significantly by subgroups (for example whether breastfeeding initiation rates vary across racial subgroups), it does not identify which subgroup(s) are different from others. To examine whether the difference between two specific subgroups is statistically significant (for example whether breastfeeding rates are significantly different between White and African American women), followup tests such as t-tests are conducted between pairs of subgroups, also called pairwise tests. Throughout the report, results of these follow-up pairwise tests are described alongside the bivariate chi-square results. As many socio-demographic factors are known to affect infant feeding practices, Appendix C presents variables of interest from each chapter crossed by key socio-demographic
31 Composite measures reflecting differences in WIC clinics’ policies, service delivery, and staffing were developed to
facilitate analysis of the influence of site-level activities on WIC participant feeding choices (see Appendix B2).

WIC Infant and Toddler Feeding Practices Study-2: Second Year Report 1-19
variables and provides more detailed analyses on a number of topics. This appendix serves as a reference for answering how the results differ by WIC participant characteristics. As many of these socio-demographic variables measure similar concepts, initial analyses explore the associations between each pair of variables using our prenatal analysis sample of 2,649 women based on chi-square tests of independence32 as shown in Table 1-8. Ethnicity, marital status, and participation in non-WIC benefit programs are significantly associated with the greatest number (six) of socio-demographic variables used in this study. This suggests that many of these socio-demographic variables are strongly related and may be measuring the same phenomenon. Table 1-8. Correlateda socio-demographic variables
Rac
e
Ethn
icity
Mar
ital s
tatu
s
Food
sec
urity
Non
-WIC
ben
efits
Parit
y
Tim
ing
of W
IC
enro
llmen
t
Wei
ght b
efor
e pr
egna
ncy
Brea
stfe
edin
g hi
stor
y
Pove
rty
leve
l
Race Ethnicity Marital status Food security Non-WIC benefits Parity Timing of WIC enrollment Weight before pregnancy Breastfeeding history Poverty level
a Check marks indicate statistically significant correlations at p < 0.05.
Data source: Interview questions SD2, SD3, SD4, SD14, SD15, SD18, SD19, SD21, SD36 – 40, MH1, MH2, MH29, KA2, and KA6.
1.8.2 Behavioral Models
For the subset of the research questions that focus on identifying the relationships that drive the outcomes and decisions observed, bivariate analyses alone are not sufficient to address the questions. Outcomes are jointly determined by a variety of factors, thus multivariate analyses such as regression analysis use weighted data to explore how choices and characteristics impact outcomes such as child weight-for-length status. Multivariate analyses isolate the unique effects of individual 32 Chi-square tests are appropriately adjusted for our complex sample design. Statistical significance is at the 95 percent
confidence level.

WIC Infant and Toddler Feeding Practices Study-2: Second Year Report 1-20
variables on an outcome, while holding the influence of other variables constant. For example, multiple regression can be used to capture the unique effect of income on weight-for-length, independent of any influence of the caregiver’s marital status. As compared to bivariate analyses, multivariate analysis typically finds a more limited set of socio-demographic variables have a statistically significant association with the outcome. 1.8.3 Statistical Tests
The majority of analyses for this report involve cross-tabulations of topical variables by one or more key socio-demographic variables. Significance tests are conducted on the cross-tabs to determine whether the variable of interest is associated with the socio-demographic variable. When the variable of interest is a proportion, a chi-square test, appropriately adjusted for our complex sample design, is used to determine if observed differences were statistically significant or more likely the result of random sampling error. If the variable of interest is a mean, a t-test, also adjusted for our complex sample design, is used to determine whether the differences were statistically significant. The Bonferroni correction method for comparing multiple means is employed as well. For the models, replication methods are used to estimate the sampling errors of estimators, based on our complex sample design. Statistical significance for analyses is at the level of p < 0.05. 1.8.4 Missing Item Data
Item nonresponse is reflected in the total number of observations available for analysis. Responses of “Don’t Know” are typically considered item nonresponse and are, therefore, treated as missing for the purposes of analysis. The one exception involves statements of belief or intention. In such cases, the response of “Don’t Know” is included as a valid response. Missing responses for key socio-demographic variables were imputed. Any difference in sample sizes between interview questions is attributable to item nonresponse for variables of interest that were not one of the standard set of key socio-demographic variables.

Work, School, Child Care, and Breastfeeding 2
WIC Infant and Toddler Feeding Practices Study-2: Second Year Report 2-1
2.1 Overview
This chapter focuses on associations between WIC caregivers’ feeding practices and external factors including work, school, and child care. Data for this chapter are drawn from interviews conducted between 3 and 24 months postpartum, with an emphasis on the second year of life. Research questions addressed in this chapter33,34 include the following:
Do employers provide workplace accommodations for breastfeeding WIC mothers?
When did the child go into a child care facility, and what type of facility did the child attend?
For infants in child care, what are the general barriers to breastfeeding in these facilities?
Is human milk given by bottle or breast when the child is at a child care facility?
Who provides the food to children in child care?
2.2 Background
2.2.1 Work and Breastfeeding
For new mothers, return to work is associated with lower rates of intention, initiation, duration, and exclusivity of breastfeeding. Intention to return to work significantly influences how long a mother intends to breastfeed (Thomas-Jackson et al., 2016). The Food and Drug Administration’s Infant Feeding Practices Study II (FDA IFPS-II) (Mirkovic, Perrine, Scanlon, & Grummer-Strawn, 2014a), found that planning to return to work soon after giving birth also affects plans to breastfeed exclusively: mothers planning to return to work within 12 weeks postpartum are significantly less likely to plan to exclusively breastfeed compared to mothers planning to return to work after 12 weeks. The same study found that mothers who return to full-time (FT) work before 3 months
33 A complete list of research questions appears in Appendix A. 34 Some additional topics relevant to feeding practices are addressed through data tables in Appendix C1.
WIC Infant and Toddler Feeding Practices Study-2: Second Year Report 2-2
have significantly lower odds of meeting their breastfeeding goals, as compared to mothers not working at 3 months (Mirkovic, Perrine, Scanlon, & Grummer-Strawn, 2014b). In a study of mothers from the Early Childhood Longitudinal Study-Birth Cohort (ECLS-B) (Ogbuanu, Glover, Probst, Liu, & Hussey, 2011), women who have not yet returned to work in the first 6 weeks postpartum have greater odds of initiating breastfeeding, and continuing any breastfeeding beyond 6 months, compared to those returning to work within 1 to 6 weeks. Returning to work has been cited as the most common reason for discontinuing breastfeeding at 6 to 9 weeks postpartum (Schwartz et al., 2002). Similarly, the timing of return to work has been closely associated with the timing of discontinuation of breastfeeding, with mothers twice as likely to stop breastfeeding in the month they return to work compared to mothers not starting to work (Kimbro, 2006). Once a woman returns to her place of employment, support at the worksite may also be a factor in breastfeeding continuation. In March 2010, the “Break Time for Nursing Mothers” provision of the Affordable Care Act went into effect, stipulating that most worksites must provide breastfeeding mothers with adequate time and space to pump breast milk, and to store pumped milk, for up to 1 year after the baby is born.35 A study of the effects of adequate time and space at work to pump breastmilk (Kozhimannil, Jou, Gjerdingen, & McGovern, 2016) found that women who report having both accommodations at work are more than twice as likely to be breastfeeding exclusively at 6 months, as compared to women without accommodations at work. 2.2.2 Child Care Use and Feeding Practices
The National Household Education Surveys (NHES) Program’s 2012 report on early childhood program participation (Mamedova & Redford, 2015) documents the use of nonparental, regular child care arrangements in children ages 0-5 years. The report found that approximately 60 percent of U.S. children under age 5 years of age spend time each week in regular nonparental care. Infants and children under age 2 years are most often cared for by relatives. The next most common type of child care for infants is individual nonrelative care, whereas the next most common type of care for slightly older children is center-based care. Research has found some differences in use of child care exist by socioeconomic status. Children of single mothers are more likely to use child care, regardless of household income, than children with two parents (Kim & Gallien, 2016; Mamedova & Redford, 2015). Lower income families are less likely to use nonparental child care, and among
35 U.S. Department of Labor, Wage and Hour Division. (n.d.). Break Time for Nursing Mothers. Retrieved from
https://www.dol.gov/whd/nursingmothers/on September 27, 2017.
WIC Infant and Toddler Feeding Practices Study-2: Second Year Report 2-3
those who do use nonparental care, are more likely to rely on relatives, than higher income families (Mamedova & Redford, 2015). A study of low-income African American mother-infant dyads, followed from 3 to 18 months postpartum, reports that nonmaternal care (relative or licensed child care provider) is associated with decreased likelihood of breastfeeding (Wasser et al., 2013). However, in a small study of WIC mothers and infants 2-8 months of age, researchers report no difference in breastfeeding initiation or duration between those using versus not using child care, and report slightly earlier formula introduction for children not in regular child care as compared to those in regular child care (Kim & Mathai, 2015). This study also reports no differences in the timing of introduction of complementary foods, and types of complementary foods introduced, across the two groups. 2.3 Sample and Analysis Approach
2.3.1 Sample
The analysis in this chapter uses data from the 3- through 24-month interviews. The core sample is offered every interview, whereas the supplemental completes interviews at 1 or 3 months, and 7-, 13-, and 24-months. Because the supplemental sample is not offered every interview, and some participants do not respond to interview requests, the responses to some interviews are less than the full sample size. The responses to specific interview questions may also be less than the totals in these tables because not all questions are relevant for all respondents. For example, only breastfeeding mothers who use regular child care receive interview questions about barriers to breastfeeding children in regular child care. Moreover, some respondents may decline to answer questions they are asked. In analyses, the responses to each interview are weighted so that findings reflect the WIC population as described in Chapter 1. Tables 2-1a and 2-1b show the number of respondents to the 3- through 24-month interviews.
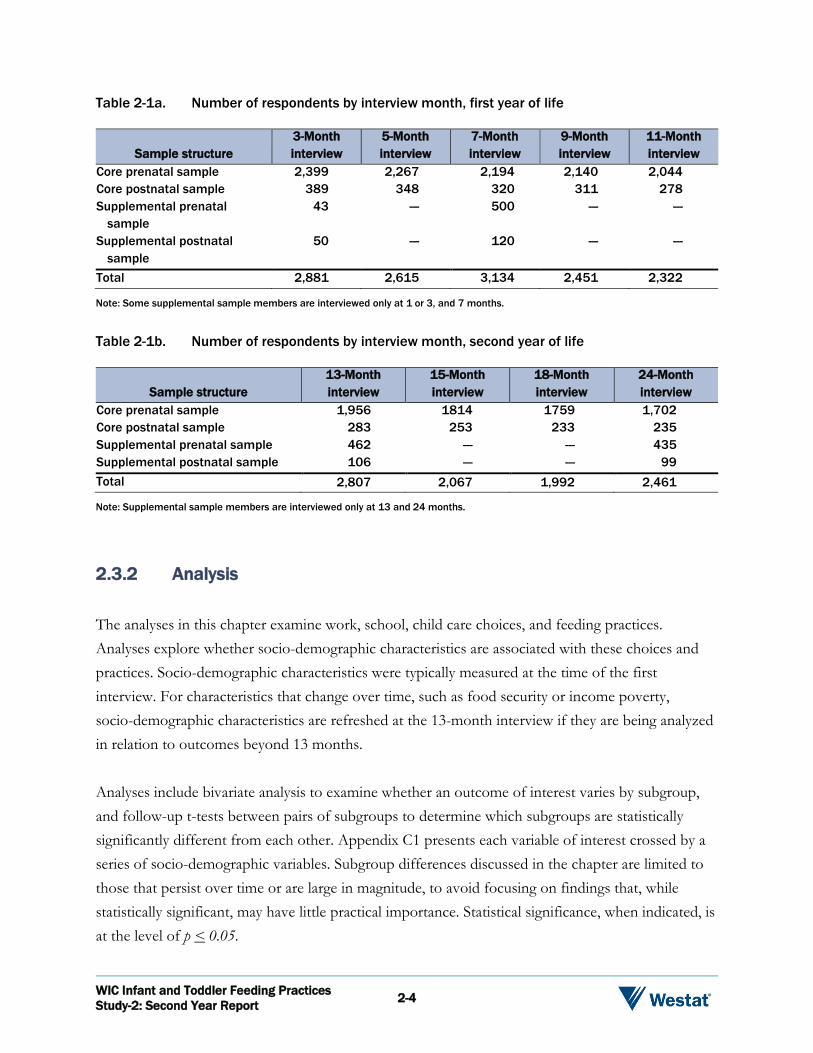
WIC Infant and Toddler Feeding Practices Study-2: Second Year Report 2-4
Table 2-1a. Number of respondents by interview month, first year of life
Sample structure 3-Month interview
5-Month interview
7-Month interview
9-Month interview
11-Month interview
Core prenatal sample 2,399 2,267 2,194 2,140 2,044 Core postnatal sample 389 348 320 311 278 Supplemental prenatal
sample 43 --- 500 --- ---
Supplemental postnatal sample
50 --- 120 --- ---
Total 2,881 2,615 3,134 2,451 2,322
Note: Some supplemental sample members are interviewed only at 1 or 3, and 7 months.
Table 2-1b. Number of respondents by interview month, second year of life
Sample structure 13-Month interview
15-Month interview
18-Month interview
24-Month interview
Core prenatal sample 1,956 1814 1759 1,702 Core postnatal sample 283 253 233 235 Supplemental prenatal sample 462 --- --- 435 Supplemental postnatal sample 106 --- --- 99 Total 2,807 2,067 1,992 2,461
Note: Supplemental sample members are interviewed only at 13 and 24 months.
2.3.2 Analysis
The analyses in this chapter examine work, school, child care choices, and feeding practices. Analyses explore whether socio-demographic characteristics are associated with these choices and practices. Socio-demographic characteristics were typically measured at the time of the first interview. For characteristics that change over time, such as food security or income poverty, socio-demographic characteristics are refreshed at the 13-month interview if they are being analyzed in relation to outcomes beyond 13 months. Analyses include bivariate analysis to examine whether an outcome of interest varies by subgroup, and follow-up t-tests between pairs of subgroups to determine which subgroups are statistically significantly different from each other. Appendix C1 presents each variable of interest crossed by a series of socio-demographic variables. Subgroup differences discussed in the chapter are limited to those that persist over time or are large in magnitude, to avoid focusing on findings that, while statistically significant, may have little practical importance. Statistical significance, when indicated, is at the level of p < 0.05.

WIC Infant and Toddler Feeding Practices Study-2: Second Year Report 2-5
When available, data are presented from the 1997 WIC Infant Feeding Practice Study (WIC IFPS-1) (Baydar, McCann, Williams, & Vesper, 1997) and other relevant studies alongside current findings to examine differences and similarities between studies. The additional relevant study used most consistently as a point of comparison in this chapter is the FDA IFPS-II study (Fein et al., 2008b), a well-known national study of infant feeding practices. The particular study used for comparison is driven by the nature and timing of the data available from each study. WIC IFPS-1, while often the main relevant source of comparison, follows infants through age 1 year and does not report extensive analyses on work, child care, and feeding practices. FDA IFPS-II, which also followed infants through age 1 year, collects more detailed data on work, child care, and feeding practices and choices. Differences between these studies and the WIC Infant and Toddler Feeding Practices Study (WIC ITFPS-2) in methodology, as well as limits in the availability of data from other studies on which to conduct analyses, prevent making direct statistical comparisons between the studies. Consequently, comparisons focus on the magnitude of differences, rather than statistical significance of the differences. 2.4 Work, School, Child Care, and Feeding Choices
The following analyses explore the intersection of work and/or school and feeding practices, particularly breastfeeding practices. This includes whether working mothers have adequate workplace accommodations for pumping breastmilk, how mothers provide breastmilk to children in child care, and whether parents or child care providers are providing food for children while they are in child care.
Key Findings: By the end of the second year of life, nearly 56 percent of
WIC ITFPS-2 caregivers are working for pay, going to school, or both.
Among breastfeeding mothers who work, 85 percent report that their employers offer at least one workplace accommodation for pumping breastmilk.
Sixty percent of study children have been in regular child care at some point by 24 months. Among breastfed infants attending child care, 80 percent and 75 percent are fed breastmilk while attending child care at 3 and 7 months, respectively.
At 3 months, 15 percent of study children in regular child care get at least some of their food from the child care provider; by 13 months, 51 percent do.

WIC Infant and Toddler Feeding Practices Study-2: Second Year Report 2-6
2.4.1 Work and School
Demands on a caregiver’s time influence feeding choices, including breastfeeding. To capture the influence of work and school demands on feeding choices, WIC ITFPS-2 interviews at 3-, 7-, 13-, 18-, and 24-months inquire about employment and school. By 13 months, 53.0 percent of WIC ITFPS-2 caregivers are working for pay, going to school, or both. By 24 months, the percentage rises to 55.6 percent. At the time of the 3-month interview, about 30 percent of WIC ITFPS-2 caregivers report working for pay, and that percentage increases at each subsequent interview through 24 months. At 24 months, nearly half (48%) of WIC ITFPS-2 caregivers are employed. The percentage of WIC ITFPS-2 caregivers working matches closely the percentage of FDA IFPS-II mothers who are WIC recipients and employed at 3 months (36%), 6 months (40%), and 12 months (45%) (IFPS II, 2017).
Figure 2-1. The percentage of WIC ITFPS-2 caregivers working and going to school by work status (Months 3-24)
14% 18% 20% 22% 23%2%
2%3% 2%
4%13%
16%17% 16%
17%
2%
3%4% 4%
4%
30%
40%44% 44%
48%
Month 3 Month 7 Month 13 Month 18 Month 24Full-time, only Full-time and school Part-time only Part-time and school
Note: See Appendix B3a, Table B3a-1 for more details.
Figure 2-1 presents the total percentage of caregivers working, and the breakdown by full-time (FT) and part-time (PT) employment, including whether the caregiver is in school while working. The data suggest a subtle shift to FT employment during later infancy and the second year of life. At the 3-month interview, 16 percent of WIC ITFPS-2 caregivers report FT employment. This comprises slightly more than half (52%) of those who report working for pay. By the 24-month interview, 57 percent of those who report working for pay are working FT.

WIC Infant and Toddler Feeding Practices Study-2: Second Year Report 2-7
The percentage of caregivers in school or college does not follow the same pattern as employment. Figure 2-2 shows the percentage of WIC ITFPS-2 caregivers who report being in school, and includes whether caregivers are also working while going to school. At the 3-month interview, 11 percent of WIC ITFPS-2 caregivers are in school; by the 13-month interview, it rises to 16 percent. This 4-percentage-point change represents about a 45 percent increase in the percentage of caregivers in school between 3 and 13 months. Between 13 months and 24 months, however, the percentage remains relatively stable with about 16 percent of caregivers reporting being in school. The percentage of caregivers who report being in school, but are not working, is steady over time at approximately 8 percent. Caregivers who work and go to school drive the increase over time in the total percentage going to school. The percentage who work and go to school increases about 75 percent between month 3 and month 13, and doubles between month 3 and month 24.
Figure 2-2. The percentage of WIC ITFPS-2 caregivers attending school, by work status (Months 3-24)
8% 9% 9% 8% 8%2%
3% 4% 4% 4%2%2% 3%
2% 4%11%14%
16%14%
16%
Month 3 Month 7 Month 13 Month 18 Month 24
School only Also working part-time Also working full-time
Note: See Appendix B3a, Table B3a-2 for more details.
At each of the five interview months (3, 7, 13, 18, and 24 months), there is a statistically significant association between working and/or going to school and race, ethnicity, age, marital status, parity and income poverty. Follow-up pairwise t-tests on the 3-month data indicate that African American caregivers are significantly more likely to work and/or go to school than are White caregivers or those in the Other racial category. Non-Hispanic caregivers are significantly more likely to be working and/or going to school than are Hispanic caregivers. Unmarried caregivers work and/or go to school at significantly higher rates than do their married counterparts. Caregivers with only one child are more likely to be working and/or going to school than are caregivers with more children. Younger groups of caregivers are more likely to be working and/or going to school than their older counterparts. Those in the lowest income category have lower percentages working and/or going to

WIC Infant and Toddler Feeding Practices Study-2: Second Year Report 2-8
school than those in higher income categories. With the exception of age, these statistically significant differences hold at each month through 24 months. Because the percentage of caregivers who only attend school is relatively small, and the WIC ITFPS-2 interviews did not inquire about issues directly related to breastfeeding while attending school, subsequent analyses focus on the influence of work on feeding decisions. As Figure 2-2 makes clear, however, many of the caregivers who work also attend school. Overall, at 24 months, 48 percent of caregivers are working, and 16 percent are in school. Although these percentages do vary by some socio-demographic characteristics, they indicate that many WIC caregivers have employment and academic demands that compete for their time, and could potentially influence feeding practices and decisions. 2.4.2 Work and Breastfeeding
Breastfeeding Rates
Because employment may present challenges for breastfeeding, the following analyses examine whether there are differences in breastfeeding rates by employment status. Figure 2-3 presents the breastfeeding rates by employment status groups for interview months 3, 7, and 13, the last month in which WIC ITFPS-2 asks about breastfeeding. Among FT employed caregivers, 34 percent are breastfeeding (either partially or exclusively) at 3 months; 20 percent are breastfeeding at 7 months;
Figure 2-3. Breastfeeding rates by employment status groups (Months 3, 7, and 13)a
Note: See Appendix B3a, Table B3a-3 for more details.
a At 7 and 13 months, breastfeeding rates are significantly lower for women working FT than for those not working.

WIC Infant and Toddler Feeding Practices Study-2: Second Year Report 2-9
and, 10 percent are breastfeeding at 13 months. A similar pattern of decline in breastfeeding rates is evident among those working PT, and among those not employed. Chi-square tests indicate that there is a statistically significant association between employment status and breastfeeding rates at 7 and 13 months, but not at 3 months.36 Consistent with previous literature showing that returning to work is associated with shorter duration of breastfeeding (Ogbuanu et al., 2011), follow-up pairwise t-tests indicate that at all three interview months breastfeeding rates are significantly higher for those not employed, compared to those who work FT. The breastfeeding rates for those who work PT, however, are not significantly higher than rates for those who do not work. Workplace Accommodations
Because workplace support for breastfeeding women may influence breastfeeding duration, WIC ITFPS-2 examines whether breastfeeding mothers who work report having accommodations available at their workplaces to support pumping milk. The Affordable Care Act37 specifies three types of accommodations that most workplaces should provide to breastfeeding women: reasonable break time to pump, a private space other than a bathroom for pumping, and a reasonable place to store pumped milk.38 Figure 2-4 shows how many of these three accommodations breastfeeding WIC ITFPS-2 mothers report having available at their workplaces. In total, 85 percent of the
Figure 2-4. Percentage of employed, breastfeeding mothers reporting workplace accommodations for pumping breastmilk, by number of accommodations reported
15%11%
17%
57%
No accommodations
1 accommodation
2 accommodations
3 accommodations
Note: See Appendix B3a, Table B3a-4 for more details.
36 Although the pattern is similar at 3 months, results of the Chi-square test of association are not statistically significant.
This may be due to the small number of employed women at 3 months. 37 U.S. Department of Labor, Wage and Hour Division. (n.d.). Break Time for Nursing Mothers. Retrieved from
https://www.dol.gov/whd/nursingmothers/on September 27, 2017. 38 The term “reasonable” is not defined in the legislation.

WIC Infant and Toddler Feeding Practices Study-2: Second Year Report 2-10
employed breastfeeding women report at least one workplace accommodation, and 57 percent report having all three accommodations available. Nonetheless, a notable minority of working women who are breastfeeding (15%) report no accommodations at work for breastfeeding. Turning to the types of accommodations available for pumping breastmilk at work, Figure 2-5 summarizes the findings. Seventy-six percent of employed breastfeeding mothers report that their employers allow reasonable breaks to pump milk. Seventy percent indicate that their workplace provides a private space to pump that is not a bathroom, and 69 percent indicate that their employer provides a reasonable place to store pumped milk.
breastmilk
76% 70% 69%
Reasonable breaks to pump
A place other than a bathroom for pumping
Reasonable place to store pumped milk
Figure 2-5. Percentage of employed, breastfeeding mothers reporting each type of workplace accommodation for pumping
Note: See Appendix B3a, Table B3a-5 for more details.
Chi-square tests indicate that there are relatively few significant associations between the workplace accommodations and key socio-demographic variables. Reasonable breaks to pump are associated with race, and follow-up pairwise t-tests indicate that African American mothers are less likely than are White mothers to report having employers that offer reasonable breaks to pump. Having a reasonable place to store breastmilk at work is associated with marital status, and with food security. Follow-up pairwise t-tests indicate that unmarried mothers are less likely than are married mothers to report having employers that offer a reasonable place to store breastmilk.
Additionally, mothers in households with very low food security are less likely than are mothers with high or marginal food security to report having employers that offer a reasonable place to store pumped milk. These findings are similar to those of other research on breastfeeding accommodations (Kozhimannil et al., 2016), which also found lower levels of access to accommodations in jobs taken by lower income women and single mothers. Further multivariate research would be necessary to determine which of these characteristics are uniquely associated with access to accommodations.

WIC Infant and Toddler Feeding Practices Study-2: Second Year Report 2-11
Employment and Breastfeeding Duration
To explore the relationship between employment and breastfeeding duration, analyses examine breastfeeding duration among women who initiated breastfeeding, by employment status at 13 months. As shown in Table 2-2, among mothers who initiated breastfeeding, median breastfeeding duration is 60 days for mothers employed FT at 13 months postpartum, 79 days for mothers employed PT, and 91 days for those not employed.39 The typical mother who did not work breastfed about one month longer than the typical mother who worked FT. Follow-up pairwise t-tests indicate that those employed FT have shorter breastfeeding duration than those employed PT or those not working. To explore whether the number of accommodations for breastfeeding are related to duration among working women, analyses also examine whether median breastfeeding duration varies by the number of workplace accommodations the mother reports at the 3-month interview. Among breastfeeding mothers who have returned to work by 3 months postpartum, median breastfeeding duration is 189 days, 166 days, 144 days, and 140 days for those with three, two, one, or no accommodations, respectively. Although the differences in duration seem striking, follow-up pairwise t-tests indicate that none of them is statistically significant.40 Overall, the current study finds that returning to work is associated with a shorter duration of breastfeeding; however, most study mothers who are working and breastfeeding report having at least one workplace accommodation to support pumping breastmilk. Although having specific workplace accommodations varies by socio-demographic characteristics, the number of accommodations does not significantly impact median breastfeeding duration. 39 For breastfeeding duration, the means and medians differ notably because some women breastfed for extremely long
periods, and these cases at the high end of duration influence the mean by making it higher and less informative about the sample as a whole. Therefore, conclusions should be based on median duration (i.e., the length of time that the women at the 50th percentile breastfed given employment status) because it is not as sensitive to outliers and is considered reflective of the typical experience.
40 With such a small number of observations, the standard errors on these estimates are relatively high. High standard errors reduce the likelihood of an analysis being statistically significant. See Appendix B3a, Table B3a-6, for details.
Table 2-2. Breastfeeding duration by employment status at 13 monthsa
Employment status Median breastfeeding duration (in days)
Mean breastfeeding duration (in days)
Employed full-time 60 125 Employed part-time 79 134 Not employed 91 155 Unweighted n 2,287 2,287 Weighted n 368,579 368,579 a Mothers employed full-time have significantly shorter breastfeeding duration than
those employed part-time or those not working.

WIC Infant and Toddler Feeding Practices Study-2: Second Year Report 2-12
2.4.3 Child Care Use
WIC ITFPS-2 explores use of child care throughout the first 2 years of the child’s life. WIC ITFPS-2 defines regular child care as an arrangement in which someone other than the child’s primary caregiver or the other parent cares for the child on a regular basis. Figure 2-6 presents the percentage of study children currently in regular child care, and the percentage who have ever been in regular child care, at months 3, 7, 13, and 24. At 3 months, 22 percent of study infants are in regular child care. The percentage increases at each interview through 24 months, when 44 percent of study children are in regular child care. The overall trend is consistent with the previously discussed trend in employment and schooling. Rates of regular child care use are slightly higher among the FDA IFPS II participants who are also WIC recipients (IFPS II, 2017), with 33 percent using child care at 3 months, 38 percent at 6 months, and 41 percent at 13 months.41 WIC ITFPS-2 asks caregivers who currently use regular child care to indicate the type of child care used. Response options include: child care centers; family daycare homes; Early Head Start; someone cares for the child in their home; someone cares for the child in the child’s home; or another kind of arrangement not specified. Table 2-3 presents the percentage distribution of study children currently in regular child care at each month, by type of child care arrangement.42
41 One source of the differences may be that the FDA IFPS II survey item included care by anyone other than the
primary caregiver as regular child care, whereas WIC ITFPS-2 did not include care by the other parent as regular child care.
42 Due to small numbers of people endorsing some types of child care, in Table 2-3 family daycare home, Early Head Start, and some other kind of arrangement are collapsed into a single category. See Appendix C1, Tables C1-2a-w, for further details.
Figure 2-6. The percentage of study children in regular child care, currently and ever
Note: See Appendix B3a, Table B3a-7, for more details.

WIC Infant and Toddler Feeding Practices Study-2: Second Year Report 2-13
Looking across interview months, shifts in usage are evident. The percentage of study children in home-based care shrinks while the percentage in center-based and other types of care grows. For example, of the 22 percent of study children in regular child care at 3 months, 45 percent are cared for in someone else’s home, 41 percent are care for in their home, and 9 percent are cared for in a child care center. Of the 44 percent of study children in regular child care at 24 months, 35 percent are cared for in someone else’s home, 32 percent are cared for in their own home, and 23 percent are cared for in a child care center. Table 2-3. Percentage of study children in regular child care by type of child care (Months
3-24)
Type of child care Month 3 Month 7 Month 13 Month 24 Someone cares for child in their home 44.9% 42.8% 37.7% 35.4% Someone cares for child in the child’s home 40.9 34.9 36.6 31.7 Child care center 8.8 14.7 16.7 23.1 Othera 5.4 7.6 9.0 9.7 Unweighted n 651 1,089 1,126 1,130 Weighted n 98,341 147,992 172,269 193,358
Note: See Appendix C1, Tables C1-2a-w for more details.
a Other child care includes family daycare homes, Early Head Start, and other arrangements.
Chi-square testing indicates that at months 3, 7, 13, and 24, there is a statistically significant association between current use of regular child care and marital status, and between current use of regular child care and income poverty. Follow-up pairwise t-tests indicate that at each of these interview months, unmarried caregivers are more likely than married caregivers to be using regular child care, and those in the lowest income category are less likely than those in the highest income category to be using regular child care. These findings are consistent with previous work by Kim & Gallien (2016), and with data from the NHES Program of 2012 (Mamedova & Redford, 2015).43 If WIC ITFPS-2 caregivers indicate that they have ever used regular child care, the interview probes for the age at which the child started regular child care use. Among children who have ever been in regular child care by 24 months, the average age when they started regular child care was 5.6 months. Some socio-demographic differences in average age at start of regular child care are noteworthy. Infants of married caregivers start regular child care at 6.5 months of age, on average, whereas infants of unmarried caregivers start at 5.3 months. Infants of mothers who enroll in WIC postnatally begin regular child care at 4.3 months of age, on average, which is over a month earlier
43 See Appendix C1, Tables C1-2a-w for information on other analyses on child care use by socio-demographic
characteristics.

WIC Infant and Toddler Feeding Practices Study-2: Second Year Report 2-14
than infants whose mothers enroll in WIC during their first trimester. Infants of mothers in the youngest age group (16-19 years) start regular child care at 4.7 months, on average, whereas infants of mothers in the oldest age group (26 years or older) start at 6.2 months.44 2.4.4 Child Care and Work
One possible reason for using regular child care is to allow parents to go to work. Although the majority of employed WIC ITFPS-2 caregivers use regular child care, not all do so. In addition, some WIC ITFPS-2 caregivers who do not work use regular child care. Table 2-4 presents data on regular child care use and caregiver employment status. About 55 percent of those employed at the 3-month interview are currently using regular child care. By the 24-month interview, about 76 percent of those employed are currently using regular child care. Unsurprisingly, at each interview month there is a statistically significant association between employment status and use of regular child care, with a greater percentage of employed caregivers, as compared to those who are not employed, currently using child care. This pattern parallels that seen in findings from WIC IFPS-1 (Baydar et al., 1997). Table 2-4. Percentage of caregivers currently using regular child care by employment status
(Months 3-24)
Employment status Month 3 Month 7 Month 13 Month 24 Employed (full-time or part-time) Currently using regular child care 54.9% 67.0% 71.6% 75.8% Not currently using regular child care 45.1 33.0 28.4 24.1 Unweighted n 872 1,290 1,276 1,255 Weighted n 133,059 174,208 194,706 212,345 Not employed Currently using regular child care 8.2% 11.7% 13.3% 14.1% Not currently using regular child care 91.8 88.3 86.7 85.9 Unweighted n 1,909 1,828 1,526 1,201 Weighted n 308,106 267,018 247,086 229,425
The percentage of WIC ITFPS-2 caregivers who are not employed but use regular child care is small, but does increase over time. Between the 3- and 24-month interviews, the percentage of WIC ITFPS-2 caregivers not working but using regular child care increases from 8 percent to 14 percent. These caregivers may be using child care for reasons other than going to work, such as school, other responsibilities, or socialization opportunities for the child. 44 See Appendix C1, Tables C1-3a-w for more details on average age at start of regular child care by each of the key
socio-demographic characteristics used in this study.

WIC Infant and Toddler Feeding Practices Study-2: Second Year Report 2-15
In summary, more than half (60%) of WIC ITFPS-2 children have been, or are currently, in a regular child care arrangement by age 24 months. Although the study does not probe the number of hours spent in regular care arrangements, children may be spending a substantial amount of time in these settings, thus it remains important to understand the feeding practices implemented in these arrangements. Support for breastfeeding and complementary feeding practices by the child care providers may influence both parental feeding decisions and the food the child receives. 2.4.5 Child Care and Breastfeeding
Feeding breastmilk to a child who is in a regular child care arrangement presents potential challenges. Consequently, WIC ITFPS-2 examines the percentage of breastfed children in regular child care, challenges associated with feeding breastmilk to children in regular care arrangements, how mothers navigate the logistics of feeding breastmilk in these arrangements, and breastfeeding duration for those in regular care. Breastfeeding Rates
Figure 2-7 shows the percentage of breastfeeding mothers, by child care status, for interview months containing both questions. Chi-square testing indicates that there is a statistically significant association between child care status and breastfeeding rates at both the 3- and 13-month time points. Follow-up pairwise t-tests confirm that at 3 and 13 months, breastfeeding rates among mothers who do not use child care are significantly higher than breastfeeding rates among mothers who use regular child care. This parallels results from WIC IFPS-1 (Baydar et al., 1997), which found that women who were using child care were significantly more likely to stop breastfeeding early as compared to those not using child care.
Figure 2-7. Percentage of breastfeeding mothers by child care statusa
Note: See Appendix B3a, Table B3a-8, for more details. a At 3 and 13 months, breastfeeding rates are significantly
higher for children not in regular child care than for children in regular care.

WIC Infant and Toddler Feeding Practices Study-2: Second Year Report 2-16
Breastfeeding Barriers
Among breastfeeding mothers who use regular child care, only a small percentage (4% at 3 months, and 6% at 7 months) report facing challenges to feeding breastmilk to their infants while the infants are in child care. As noted in Table 2-5, when asked about the barriers to breastfeeding while their infants are in child care, lack of time was the problem mothers reported most frequently at both 3 and 7 months. Other notable barriers include lack of privacy, difficulty transporting pumped milk, the child care provider discouraging breastfeeding, and other barriers not specified. Interestingly, lack of privacy is cited less frequently as a problem at 7 months (5% of breastfeeding mothers) than at 3 months (31% of breastfeeding mothers). Table 2-5. Among breastfeeding mothers who encounter problems with breastfeeding while
the infant is in child care, the percentage reporting select barriers
Type of barrier Month 3 Month 7 Any barrier reported 80.7 80.4
Lack of time 73.0 65.4 Lack of privacy at the site 31.0 4.6 Too difficult to transport pumped milk to site 31.6 28.5 Child care provider doesn’t encourage it 9.6 8.7 Other barriers 11.2 32.7
Unweighted n 38 46 Weighted n 7,166 6,016
Feeding Logistics
To understand better how breastfeeding WIC ITFPS-2 mothers are providing breastmilk to their children in regular child care, mothers are asked whether they pump milk and bring it to child care, go to child care to feed their child, do both, or do neither (and therefore only feed breastmilk at other times, not at child care). Most breastfeeding mothers who use regular child care report providing pumped milk for their infants to consume at child care: 68 percent and 63 percent report doing so at 3 months and 7 months, respectively, either as the only method, or combined with going to the site to feed the infant. Figure 2-8 shows the percentage of breastfed infants in regular child care, by method of receipt of breastmilk. The percentage of breastfed study infants in regular child care who do not receive breastmilk while in child care is noteworthy, with 20 percent at 3 months, and 25 percent at 7 months, only consuming breastmilk outside the child care setting.

WIC Infant and Toddler Feeding Practices Study-2: Second Year Report 2-17
Figure 2-8. The percentage of breastfed infants in regular child care, by method of breastmilk receipt in child care
60%11%
8%
20%
Month 3
Pumped milk
Mother goes to site to feed
Both pumped milk and mother goes to site to feed
Not fed breastmilk at site
52%
13%
11%
25%
Month 7
Pumped milk
Mother goes to site to feed
Both pumped milk and mother goes to site to feed
Not fed breastmilk at site
Note: See Appendix B3a, Table B3a-9, for more details.
Breastfeeding Duration
Given potential challenges of feeding breastmilk to children in regular child care, it is worthwhile to explore whether breastfeeding duration is shorter for children in regular child care than for children not in regular child care. To explore this, the current study examines whether breastfeeding duration varies with child care use. Breastfeeding WIC ITFPS-2 mothers who never use regular child care by 13 months have a median duration of 91 days (about 3 months), whereas those who use regular child care prior to 13 months have a median duration of 69 days (about 2.3 months). Although the 22-day difference is striking, statistical testing indicates that the difference is not statistically significant due to high standard errors (see Appendix B3a, Table B3a-10 for details).45 2.4.6 Child Care and Other Foods
In addition to breastmilk, children in regular child care may consume other foods and beverages. To understand the feeding practices for children in regular child care better, analyses explore who
45 As in previous analysis of breastfeeding duration, testing focused on the median values since they often represent the
typical experience when there are extreme outliers in the data. Details of mean breastfeeding duration by child care use appear in Appendix B3a, Table B3a-10.

WIC Infant and Toddler Feeding Practices Study-2: Second Year Report 2-18
provides the foods children eat while in child care, and the timing of introduction of complementary foods eaten at child care. Providing Food for Children in Regular Care
Food provided to children in regular child care may come from the child care provider, the child’s mother, or both the provider and the child’s mother (see Table 2-6). Among mothers who report using regular child care when their infants are 3 months old, 85 percent report that they provide the food the child eats in child care; 10 percent report that they and the child care providers equally split the provision of food; and, 5 percent report that the child care provider is responsible for all the food. When the study children are 24 months old, 42 percent of mothers report that they provide the food; 27 percent report that they and the providers equally split the provision of food; and, 31 percent report that the child care provider is responsible for all food. After the first year, child care providers play a much larger role in the provision of food for study children. Table 2-6. Among study children in regular child care, percentage of children by source of food
Source of food Month 3 Month 7 Month 13 Month 24 Among all WIC ITFPS-2 mothers using regular child care Child care provider 5.4% 6.3% 20.5% 31.0% Mother 84.9 75.3 49.0 42.0 Equally divided 9.6 18.4 30.5 27.0 Unweighted n 649 1,087 1,125 1,126 Weighted n 97,805 147,816 171,943 192,728 Among non-breastfeeding WIC ITFPS-2 mothers using regular child care Child care provider 4.6 5.9 20.2 NA Mother 85.0 75.8 49.0 NA Equally divided 10.4 18.3 30.8 NA Unweighted n 422 851 1,000 NA Weighted n 61,619 114,326 150,667 NA
Note: See Appendix C1, Table C1-6a-w for more details on provision of food.
NA indicates not applicable because the 24-month interview did not ask about breastfeeding.
To explore whether breastfeeding may drive this trend among all mothers who use regular child care, additional analyses are conducted on non-breastfeeding mothers. As also indicated in Table 2-6, the trend was not notably different when analysis was limited to nonbreastfeeding mothers: for younger infants the caregivers generally provide the food fed to children in regular child care, but as the child ages the child care providers increasingly assume this role.

WIC Infant and Toddler Feeding Practices Study-2: Second Year Report 2-19
Timing of Introduction of Foods
For study children who are in a child care setting in which the child care provider is fully or partially responsible for providing the food the child eats, WIC ITFPS-2 explores the timing of introduction of various types of complementary foods. At the 7-month interview, mothers who indicate that their child care provider provides at least some of the food to their child are asked the age at which the provider starts feeding infants jarred or homemade baby foods. The average age for introducing baby foods across all types of child care providers is 5.5 months (see Table 2-7). The variation in the timing of the introduction of baby foods among types of providers is minimal, ranging from an average of 5.3 months in child care centers to an average of 6.0 months in other settings, which includes family daycare homes, Early Head Start, and other unspecified arrangements. As a point of comparison, in the full WIC ITFPS-2 sample, the median timing of introduction of the first non-cereal baby foods (baby food fruits and vegetables) is 6.0 months (May et al., 2017, Chapter 5).46 Table 2-7. Among children whose child care providers also provide food, timing of introduction
of select foods at child care
Type of child carea Timing of introduction of food (in months)
Baby foods Table foods Cow’s milk Any child care type 5.5 9.1 11.1
Someone cares for child in their home 5.6 8.7 11.2 Someone cares for child in the child’s home 5.5 9.1 10.9 Child care center 5.3 10.0 11.8 Otherb 6.0 9.5 10.5
Unweighted n 227 383 254 Weighted n 32,442 57,425 39,372
a Child care type is the type of care the child is in when the food introduction timing is probed: Baby foods, 7 months; Table foods and Cow’s milk, 13 months.
b Other child care includes family daycare homes, Early Head Start, and other arrangements.
At the 13-month interview, mothers who indicate that their child care provider provides food to their child are asked the age at which the provider starts giving table foods and cow’s milk. Across all types of child care providers, the average age for the introduction of table foods in child care settings is 9.1 months, and the average age of introduction of cow’s milk is 11.1 months. The American Academy of Pediatrics recommends that infants not be fed cow’s milk during the first year of life (Kleinman & Greer, 2013), and the WIC food package does not include cow’s milk until the child is 1 year old. Findings from the current study indicate, however, that some infants may be receiving cow’s milk as early as 10.5 months from their child care providers. 46 In the full WIC ITFPS-2 sample, cereals are introduced slightly earlier than jarred or homemade baby foods, at a
median age of 4.5 months.

WIC Infant and Toddler Feeding Practices Study-2: Second Year Report 2-20
Overall, 80 percent of breastfeeding mothers who use regular child care at 3 months are providing breastmilk for their children to consume at child care, with 60 percent doing so by providing pumped milk. The most frequently reported challenge in breastfeeding an infant in regular child care is lack of time. Although mothers typically provide the food consumed in child care during infancy, by 24 months, 58 percent of mothers report that child care providers are responsible for at least some of the child’s food. On average, child care providers introduce select complementary foods slightly earlier than recommended. 2.5 Summary
A substantial percentage of WIC caregivers with young children have work and/or school commitments. The current study demonstrates that as their children age, the percentage of WIC ITFPS-2 caregivers who are working increases from 30 percent at 3 months postpartum to 44 percent at 13 months. The latter finding is consistent with the FDA IFPS II, which found that 45 percent of WIC participants worked for pay at 12 months (IFPS II, 2017). By 24 months, nearly half (48%) of WIC ITFPS-2 caregivers are working. In addition, a small but notable percentage of caregivers (between 7% and 8%) both works and attends school. These work and school commitments are important to consider given their potential influences of children’s feeding practices. Employment status is associated with breastfeeding practices among study mothers. Mothers employed FT have lower breastfeeding rates than mothers who are not employed. Mothers employed FT have about a month shorter median duration of breastfeeding than those not employed, and about 19 days shorter median duration than those employed PT. Most employed, breastfeeding mothers (85%) report that they have at least one workplace accommodation for pumping breastmilk. Future work could further elucidate the relation between work and breastfeeding by examining other factors that influence feeding practices, such as the type of employment, or the types of duties new mothers perform on the job. The current study also found that as the percentage of mothers who work increases over the first 2 years of life, so does the percentage of children in regular child care arrangements. Nearly two-in-five WIC ITFPS-2 children (39%) are currently in child care at 13 months, which is similar to the 41 percent of WIC participants who reported that their babies had been cared for regularly by someone other than their mother in the FDA IFPS-2 study (IFPS II, 2017). About 44 percent of

WIC Infant and Toddler Feeding Practices Study-2: Second Year Report 2-21
WIC ITFPS-2 children are currently in child care at age 24-months. There is also an increasing trend with age in the percentage of children who attend child care centers. At 3 months, only 9 percent of infants who are in regular care attend child care centers, but by 24 months, nearly one-quarter (23%) of WIC ITFPS-2 children in regular child care attend child care centers. This dramatic increase in the percentage of children attending child care centers underscores the importance of understanding how these centers influence children’s dietary intake. Breastfeeding a child who is attending child care can be challenging. Among WIC ITFPS-2 mothers who use child care and experience barriers to continued breastfeeding, the most frequently reported barrier is lack of time (65% at 7 months), although difficulties associated with transporting pumped breastmilk are also common (29% at 7 months). Nonetheless, at 3 months, 80 percent of breastfed WIC ITFPS-2 infants in regular child care are being fed breastmilk while at child care, and this figure drops only a few percentage points (to 75%) by 7 months postpartum. The fact that such a high percentage of mothers continue to feed breastmilk even while their infants are not in their care is a strong indication of these mothers’ commitment to breastfeeding. At both 3 months and 7 months, the majority (60% and 52%, respectively) of breastfeeding mothers who use regular child care provide pumped breastmilk for their children to consume at child care. Food consumed at child care may be provided by the mother, the child care provider, or both. In WIC ITFPS-2 there is a notable increase in the percentage of child care providers who provide the food for children between 3 and 24 months, and a concomitant decline in the percentage of mothers who provide the food for their children in child care. This shift after age 1 toward WIC ITFPS-2 children consuming foods provided by the child care provider indicates the increasingly important role child care providers play in children’s dietary intake. Furthermore, child care providers are also influencing the dietary intakes of younger children, including infants who consume complementary foods. The current study found little variation in the average age for introducing baby foods, table foods, or cow’s milk across types of child care providers. The average ages for the introduction of complementary foods at child care are 5.5 months for jarred or homemade baby foods, 9.1 months for table foods, and 11.1 months for cow’s milk. These data on caregiver work and school engagement, and on use of regular child care, demonstrate that beginning in the early months postpartum and continuing through the second year, external settings may play an important role in feeding decisions and infant and child nutrition.

Complementary Feeding Practices 3
WIC Infant and Toddler Feeding Practices Study-2: Second Year Report 3-1
3.1 Overview
This chapter focuses on complementary feeding practices, with an emphasis on the latter half of infancy and the beginning of the second year. Examples of research questions addressed in this chapter47,48 include the following:
How are caregivers obtaining or preparing baby foods?
What do mothers/caregivers perceive to be the impact of their food package choices on the food their child receives?
What is the frequency of methods used by the caregiver to prepare foods?
At each age, what percentages of WIC children use a cup (with and without assistance), a spoon, or a sippy cup throughout the first years of life? What percentage of WIC infants self-feed during mealtimes?
3.2 Background
The American Academy of Pediatrics (AAP) currently recommends that infants be exclusively breastfed for the first 6 months of life and that breastfeeding continue with appropriate complementary foods until at least 12 months (AAP, 2012). Within a few months of starting solid foods, an infant’s diet should be varied, with meals and snacks including meats, cereal, vegetables, fruits, eggs, and fish (Hansen-Petrik, 2012; Kleinman & Greer, 2013). Important issues in complementary feeding include not only the foods consumed by the child, but also food preparation, feeding methods, and the child’s development of self-feeding skills. Initial complementary foods are typically strained or pureed and fed to the infant by an adult, using a spoon. Then foods with increasing texture (e.g., moving from mashed, to finely chopped, to soft
47 A complete list of research questions appears in Appendix A. 48 Some additional topics relevant to feeding practices are addressed through data tables in Appendix C2.

WIC Infant and Toddler Feeding Practices Study-2: Second Year Report 3-2
table foods) are introduced as the infant becomes developmentally ready, closer to 9 months of age. This progression is recommended both by medical professionals and by WIC (Kleinman & Greer, 2013; Special Supplemental Nutrition Program for Women, Infants, and Children (U.S.), Commodity Supplemental Food Program (U.S.), 2009). WIC includes infant cereal and baby food fruits and vegetables starting at 6 months of age, plus jarred baby food meats for fully breastfed infants. Food packages for 1 to 4 year olds include foods such as milk, eggs, breakfast cereal, whole wheat or whole grain bread, 100 percent fruit juice, legumes/peanut butter, and fresh fruits and vegetables. Data from the Food and Drug Administration’s Infant Feeding Practices Study II (FDA IFPS-II), showed high consumption rates of jarred baby foods particularly from months 6 to 9, but by the end of the first year the majority of caregivers reported that all or most food given to infants was not commercial baby food (Fein, Labiner-Wolfe, Scanlon, & Grummer-Strawn, 2008a), suggesting that the time during which WIC provides jarred baby foods coincides well with the spike in purchasing and feeding such foods in the broader population. There are several feeding practice recommendations for both infants and toddlers. Recommendations for home preparation of infant and toddler foods start with pureeing foods; and progress to mashing, dicing, and chopping; and then feeding soft whole foods (Kleinman & Greer, 2013; Special Supplemental Nutrition Program for Women, Infants, and Children (U.S.), Commodity Supplemental Food Program (U.S.), 2009). Recommended methods for feeding infants and toddlers include the use of spoons and cups. Additionally, the AAP recommends discontinuing bottle use entirely before 18 months of age (Kleinman & Greer, 2013), and encouraging self-feeding skills as soon as the child becomes developmentally ready. These skills include: using a cup; self-feeding with fingers; and self-feeding with a spoon. 3.3 Sample and Analysis Approach
3.3.1 Sample
The analyses in this chapter utilize data throughout the infant year and through the 18-month interview, although many of the analyses focus on the period from 7-18 months. While the entire sample (core plus supplemental) receives the 7- and 13-month interviews, only the core sample

WIC Infant and Toddler Feeding Practices Study-2: Second Year Report 3-3
receives the 9-, 11-, 15-, and 18-month interviews. Because not everyone in the sample is offered the 9-, 11-, 15-, and 18-month interviews, and some participants do not respond to interview requests, the responses to some interviews are less than the full sample size. In analyses, the responses to each interview are weighted so that findings reflect the WIC population as described in Chapter 1. Table 3-1 shows the number of respondents to the 7- to 18-month interviews. Table 3-1. Number of respondents by interview month
Sample structure 7-Month interview
9-Month interview
11-Month interview
13-Month interview
15-Month interview
18-Month interview
Core prenatal sample 2,194 2,140 2,044 1,956 1814 1759 Core postnatal sample 320 311 278 283 253 233 Supplemental prenatal
sample 500 -- -- 462 -- --
Supplemental postnatal sample
120 -- -- 106 -- --
Total 3,134 2,451 2,322 2,807 2,067 1,992
Note: Supplemental sample members are interviewed only at 7 and 13 months.
3.3.2 Analysis
The analyses in this chapter examine complementary feeding choices and practices, including purchasing, preparation, and feeding methods. Analyses explore whether socio-demographic characteristics are associated with these choices and practices. Socio-demographic characteristics are measured at the time of the first interview. For characteristics that change over time, such as food security or income poverty, socio-demographic characteristics are refreshed at the 13-month interview if they are being analyzed in relation to outcomes after 13 months. As in previous chapters, analyses include bivariate analysis to examine whether an outcome of interest varies by subgroup, and follow-up t-tests between pairs of subgroups to determine which subgroups are statistically significantly different from each other. Appendix C2 presents each variable of interest crossed by a series of socio-demographic variables. Subgroup differences discussed in the chapter are limited to those that persist over time or are large in magnitude, to avoid focusing on findings that, while statistically significant, may have little practical importance. Statistical significance, when indicated, is at the level of p < 0.05. When available, data are presented from the 1997 WIC Infant Feeding Practice Study (WIC IFPS-1) and other relevant studies alongside current findings to examine differences and similarities between

WIC Infant and Toddler Feeding Practices Study-2: Second Year Report 3-4
studies. The additional relevant studies used as points of comparison in this chapter include the FDA IFPS-II study (Fein et al., 2008b) and the Gerber/Nestle Feeding Infants and Toddlers Study (FITS) conducted in 2002 (Ponza, Devaney, Ziegler, Reidy, & Squatrito, 2004; Ziegler, Briefel, Clusen, & Devaney, 2006), both well-known national studies of infant and toddler feeding practices that include both WIC and non-WIC children.49 The particular study used for comparison is driven by the nature and timing of the data available from each study. WIC IFPS-1, while often the main relevant source of comparison, only followed infants through age 1 year. FDA IFPS-II, which also followed infants through age 1 year, collected data on reliance on commercial baby foods not reported by WIC IFPS-1 or the 2002 FITS study. The FITS studies were cross-sectional and included older children; FITS 2002 included children from ages 4 months to 2 years.50 Differences between these studies and the WIC Infant and Toddler Feeding Practices Study (WIC ITFPS-2) in methodology, as well as limits in the availability of data from other studies on which to conduct analyses, prevent making direct statistical comparisons between the studies. Consequently, comparisons focus on the magnitude of differences, rather than statistical significance of the differences. 3.4 Complementary Feeding Practices
Most (about 80%) WIC ITFPS-2 infants are introduced to complementary foods between 4-6 months of age. Beginning at this age and extending through the second year, important issues include not only what foods the child is consuming, but how the foods are prepared, the methods used to feed them to the child, and the development of self-feeding skills.
Key Findings: WIC ITFPS-2 children are following expected progressions in
feeding: – By 7 months, 95 percent of infants are being fed with a spoon. – At 13 months, 47 percent of children are no longer drinking
anything from a bottle. – At 18 months, 87 percent of caregivers are feeding chunky
chopped or diced foods, and 66 percent of the children are feeding themselves with a spoon.
At 11 months, use of an infant feeder is down by 19 percentage points as compared to WIC IFPS-1.
At 7 and 15 months, most caregivers agree (89% and 96%, respectively) that the food package contains the types of food they would typically feed their child.
49 FITS 2008 did not report on complementary feeding practices as completely as FITS 2002, thus comparisons in this
chapter are with FITS 2002. 50 Because FITS 2002 is a cross-sectional study covering a range of ages, their findings are published in bands of ages.
Comparisons between WIC ITFPS-2 and FITS 2002 data therefore match the WIC ITFPS-2 month to the closest relevant FITS age band.

WIC Infant and Toddler Feeding Practices Study-2: Second Year Report 3-5
3.4.1 Food Purchasing
The WIC ITFPS-2 interviews ask caregivers whether they feed their children store-bought baby foods in a jar or container, including: fruit and vegetable juices, fruits, vegetables, meats, and combination dinners. Respondents indicate whether the baby foods they fed to their child in the past 7 days were all store bought, mostly store bought, some store bought, or if none were store bought. Combining results across the various types of baby food, the data show a pattern of early reliance on store-bought, jarred baby food, and a gradual decrease over the period from 7 to 13 months (see Figure 3-1). Figure 3-1. Percentage of caregivers feeding baby foods by proportion of foods that are
store-bought (months 7-13)
66%59%
45%
27%
13% 15% 16% 12%10% 14%18% 21%
11% 12%21%
39%
Month 7 Month 9 Month 11 Month 13
All store bought Mostly store bought Some store bought No store bought
Note: See Appendix C2, Table C2-3a-w for more details.
The shift in reliance on store-bought baby food as their infants get older is dramatic. At 7 months, 79 percent of caregivers report feeding only or mostly store-bought baby foods. By 13 months, however, just under 40 percent were relying only or mostly on store-bought baby foods. The percentage of caregivers not feeding any store-bought baby food rises from 11 percent at 7 months to 39 percent at 13 months. There are no significant patterns of socio-demographic subgroup differences. These changes coincide with developmental shifts in most infants’ ability to eat food with thicker and chunkier textures. The FDA IFPS-II study found a similar pattern in their sample, with high reliance on commercial baby foods after 6 months that declined gradually until the majority of caregivers were feeding only some or no commercial baby foods by 12 months (Fein et al., 2008a).

WIC Infant and Toddler Feeding Practices Study-2: Second Year Report 3-6
This pattern of decreasing reliance on store-bought baby foods mirrors the types of foods provided by WIC. Beginning at 6 months of age, and through 11 months, WIC provides commercial pureed baby food as a part of the infant food packages. Beginning at 12 months, WIC provides foods for children including items such as cow’s milk, eggs, breakfast cereal, whole wheat or whole grain bread, 100 percent fruit juice, legumes/peanut butter, and fresh fruits and vegetables. At both the 7- and 15-month interviews, caregivers who are feeding complementary foods overwhelmingly agree that the food package contains the types of food they would typically feed their child (89% and 96% respectively; see Figure 3-2). Figure 3-2. Percentage of caregivers receiving WIC indicating the WIC food package allows
them to purchase foods they typically feed their child
89%
11%
7 months
Yes
No
96%
4%
15 months
Yes
No
Note: See Appendix C2, Table C2-2a-w for more details.
Although study mothers overall are extremely positive about the food package contents, at 7 months views of the food package do vary significantly between ethnic and income poverty subgroups. Compared to their counterparts, a higher percentage of both Hispanic caregivers, and caregivers in the lowest income group, report that the WIC food package allows them to buy foods they would typically feed their child (see Tables C2-2b and C2-2i in Appendix C2 for details). There are no significant socio-demographic subgroup differences in views of the package by 15 months. Overall, findings suggest that food purchasing behaviors shift across the first 2 years of life; however, purchasing behaviors appear to align with the contents of the WIC food packages, and most caregivers report favorable views of these food packages.

WIC Infant and Toddler Feeding Practices Study-2: Second Year Report 3-7
3.4.2 Preparation of Complementary Foods
Although many caregivers report feeding store-bought baby foods to their infants, some caregivers at each interview report feeding few or no store-bought baby foods over the past 7 days. At each age, therefore, caregivers are likely to be preparing at least some food for their infants at home. Common techniques caregivers report using to prepare homemade baby food include: pureeing, as in a blender; mashing with a fork or spoon; and, chopping or dicing. All of these practices are considered appropriate means to prepare infant foods (Kleinman & Greer, 2013; Special Supplemental Nutrition Program for Women, Infants, and Children (U.S.), Commodity Supplemental Food Program (U.S.), 2009). At 7, 9, 11, and 13 months, caregivers are asked to indicate all the techniques they use at home to prepare complementary foods. At 7 months, caregivers report preparing homemade baby foods primarily through mashing (61%) or pureeing (57%) (see Table 3-2). As the infants age, however, fewer caregivers are pureeing food and more are offering mashed or chopped foods. This is consistent with the older infants’ greater readiness for foods with thicker and lumpier textures. Table 3-2. Among caregivers who prepare baby food at home, the percentage using different
food preparation methods, by interview month
Method of food preparation Month 7 Month 9 Month 11 Month 13 Mash, such as with a fork or spoon 60.6% 78.5% 82.8% 82.6% Puree 56.5 51.8 47.4 36.4 Chop or dice 25.3 50.8 70.7 86.8 Premasticate 12.9 18.0 18.1 18.7 Other method 5.9 5.0 3.8 3.6 Unweighted n 1,000 1,137 1,425 2,227 Weighted n 152,061 209,473 279,335 353,177
Note: See Appendix C2, Table C2-1a-w for more details.
In addition to these practices, some WIC ITFPS-2 caregivers also report premasticating food for their infants, which involves having the caregiver pre-chew food and then feed it to the infant. Premasticating food for infants is not included in professional guidance for parents in the United States because illnesses may be transmitted through this process (Fein et al., 2008a; Steinkuller, Chan, & Rinehouse, 1992). In WIC ITFPS-2, premastication is reported by 13 percent of caregivers at 7 months, and rises to about 18 percent of caregivers between 9 and 13 months. This is comparable to the rates found in FDA IFPS-II, in which 14 percent of mothers reported premasticating food for their infant (Fein et al., 2008a).

WIC Infant and Toddler Feeding Practices Study-2: Second Year Report 3-8
Some food preparation techniques vary statistically significantly by race. As compared to White caregivers or caregivers who are of a race other than White or African American (i.e., Other race), African American caregivers are less likely to puree foods at 7, 9, 11, and 13 months. African American caregivers are also less likely than White or Other race caregivers to chop or dice foods at 9, 11, and 13 months, and more likely to report premasticating food for their infants at 9, 11, and 13 months. Other race caregivers are more likely than White caregivers to report premasticating foods at 11 months (see Figure 3-3).
Figure 3-3. Among caregivers preparing foods at home, significant differences in percentage pureeing, chopping/dicing, or premasticatinga food before giving it to infants, by caregiver race
Pureeingb
Chopping/Dicingc Premasticatingd
37% 28% 32% 26%
61% 55% 49% 37%58% 61% 57%
45%
Month 7 Month 9 Month 11 Month 13
African American White Other
39%57%
79%53%
74% 89%
52%73%
88%
Month 9 Month 11 Month 13
African American White Other
38% 42% 37%
12% 11% 14%20% 19% 16%
Month 9 Month 11 Month 13
African American White Other
Note: See Appendix C2, Table C2-1a for more details.
a Premastication is not a recommended infant feeding practice.
b African American caregivers are significantly different from White or Other race caregivers in the percentage who puree foods at 7, 9, 11, and 13 months.
c African American caregivers are significantly different from White or Other race caregivers in the percentage who chop or dice foods at 9, 11, and 13 months.
d African American caregivers are significantly different from White or Other race caregivers in the percentage who report premasticating food for their infants at 9, 11, and 13 months.

WIC Infant and Toddler Feeding Practices Study-2: Second Year Report 3-9
The data also show some significant differences in food preparation method by ethnicity (see Figure 3-4). At months 7, 9, 11, and 13, significantly more Hispanic caregivers, as compared to non-Hispanic caregivers, report pureeing homemade baby food. At 11 and 13 months, a greater percentage of Hispanic caregivers than non-Hispanic caregivers report mashing food for their babies. At 9, 11, and 13 months, a lower percentage of Hispanic caregivers than non-Hispanic caregivers report premasticating food before giving it to their babies.
Figure 3-4. Among caregivers preparing foods at home, significant differences in percentage pureeing, mashing, or premasticating food before giving it to infants, by caregiver ethnicity
Pureeingb
Mashingc Premasticatingd
65% 66% 61%49%44% 35% 33% 25%
Month 7 Month 9 Month 11 Month 13Hispanic Non-Hispanic
86% 87%80% 79%
Month 11 Month 13
Hispanic Non-Hispanic
13% 12% 13%25% 25% 24%
Month 9 Month 11 Month 13Hispanic Non-Hispanic
Note: See Appendix C2, Table C2-1b for more details
a Premastication is not a recommended infant feeding practice.
b Hispanic caregivers are significantly different from non-Hispanic caregivers in the percentage who report pureeing food at months 7, 9, 11, and 13.
c Hispanic caregivers are significantly different from non-Hispanic caregivers in the percentage who report mashing food at months 11 and 13.
d Hispanic caregivers are significantly different from non-Hispanic caregivers in the percentage who report premasticating food at months 9, 11, and 13.
Overall, findings suggest that caregivers are shifting their methods of preparing homemade foods to account for the growing abilities of their infants to consume thicker and chunkier foods, with pureed foods decreasing over time, and mashed and then chopped foods becoming more common.

WIC Infant and Toddler Feeding Practices Study-2: Second Year Report 3-10
3.4.3 Methods of Feeding Infants and Young Children
Initial complementary foods are typically fed to the infant by an adult, using a spoon, once the infant is developmentally ready. Some caregivers also use infant feeders as they transition between bottle feeding and self-feeding. Infant feeders, which are bottles designed to push smooth solid foods into the infant’s mouth,51 are not recommended as a feeding method as they may cause choking. Infant feeders were nonetheless popular among mothers in WIC IFPS-1, with 48 percent of mothers reporting having used one by 11 months of age (Baydar, McCann, Williams, & Vesper, 1997). Figure 3-5 shows the percentage of caregivers reporting spoon feeding within the past 7 days, among children receiving complementary foods, by interview month.
Figure 3-5. Among study children receiving complementary foods, percentage of caregivers reporting feeding with a spoon within the past 7 days, by interview month
16%
65%
95% 96% 96% 96% 96%
Month 3 Month 5 Month 7 Month 9 Month 11 Month 13 Month 15
Note: See Table Appendix C2, C2-5a-w for more details.
At 3 months, few infants have started complementary foods, and spoon-feeding is not common. At this age, caregivers who are feeding complementary foods, such as cereal, may doing so by adding it to a bottle of formula or breastmilk.52 By 5 months, when more infants have started complementary foods, the percentage of caregivers reporting spoon-feeding in the past 7 days increases dramatically 51 Infant feeders are commercially available bottles with a large nipple hole and a flexible bottom to push food into the
nipple. The interview question also included bottles modified to approximate infant feeders by cross-cutting nipples to create a large opening through which solid food can flow.
52 As reported in the WIC ITFPS-2 Infant Year Report (May et al., 2017), Chapter 4, Section 4.6.3, 11 percent of study mothers were making additions to bottles at 3 months, a practice WIC does not encourage for healthy infants. Only 20 percent of WIC ITFPS-2 caregivers reported introducing complementary foods before 4 months. Early introduction of complementary foods was defined as prior to 4 months of age for WIC ITFPS-2 because at the time of data collection some health professionals were recommending introduction of complementary foods between 4 to 6 months of age.

WIC Infant and Toddler Feeding Practices Study-2: Second Year Report 3-11
to 65 percent. By 7 months, spoon-feeding becomes a dominant practice among those feeding complementary foods, with about 96 percent of caregivers spoon-feeding their infants between 7 and 15 months. This jump between 5 and 7 months aligns with the age when the majority of healthy infants should have become developmentally ready to begin spoon-feeding. The use of infant feeders also increases with age, and 12 percent of caregivers report using feeders at 5 months. The use of infant feeders peaks at 9 months, with 15 percent of caregivers using this method, and decreases steadily back to only 6 percent using infant feeders to feed complementary foods by 15 months (see Tables C2-5a-w in Appendix C2 for details). Infant feeders are not recommended as a feeding method because they may cause choking or overconsumption. The percentage of WIC ITFPS-2 infants being fed complementary foods with a spoon is consistent the rates reported in WIC IFPS-1, with both studies finding that the rate of spoon-feeding reaches over 90 percent by 7 months. The percentage of caregivers reporting using an infant feeder, however, has gone down substantially since WIC IFPS-1, with 29 percent of WIC ITFPS-2 caregivers reporting ever having used an infant feeder by 11 months as compared to 48 percent of WIC IFPS-1 caregivers. There are no substantive patterns of socio-demographic subgroup differences in spoon-feeding for WIC ITFPS-2. Although the data show some statistically significant differences in later infancy by race and ethnicity (see Tables C2-5a and C2-5b in Appendix C2 for details), these differences are small in magnitude and more than 90 percent of infants in all subgroups are spoon-fed at these ages. More patterns of subgroup differences emerge for the use of infant feeders. As compared to White caregivers and caregivers of Other races, African American caregivers are significantly more likely to be using infant feeders at 7 and 9 months, and significantly more likely than White caregivers to be using an infant feeder at 11 and 13 months. This pattern of African American caregivers being the racial subgroup more likely to use infant feeders parallels the pattern seen in WIC IFPS-1. Patterns of statistically significant findings by ethnicity and parity are smaller in magnitude: more non-Hispanic caregivers than Hispanic caregivers are using infant feeders early in infancy, at 3 and 5 months; but this trend reverses at 15 months. With regard to parity, more caregivers of first-born children, as compared to caregivers of third or subsequent-born children, are using an infant feeder at 11 months, and caregivers of first-born children are doing so more often than all other mothers at 13 months (see Tables C2-5b and f in Appendix C2 for details).

WIC Infant and Toddler Feeding Practices Study-2: Second Year Report 3-12
Overall, findings suggest that almost all (95%) study infants are spoon-fed by 7 months, aligning well with the age when most healthy infants are expected to be developmentally ready for spoon-feeding. Feeding complementary foods using infant feeders, a method not recommended due to risks of choking and overconsumption, is still used by some caregivers, peaking at 15 percent at 9 months. Nonetheless, use of infant feeders is greatly reduced since WIC IFPS-1. 3.4.4 Self-Feeding Skills of Infants and Young Children
As infants reach their first birthdays, WIC recommends that they be weaned from the bottle to lessen the risk of early childhood dental caries (Special Supplemental Nutrition Program for Women, Infants, and Children (U.S.), Commodity Supplemental Food Program (U.S.), 2009). At 13 months, only about half (53%) of WIC ITFPS-2 infants are still drinking from a bottle at least occasionally (see Figure 3-6). Among the 47 percent of children who are no longer using a bottle by 13 months, the average age of bottle weaning is 10.6 months. Even among those who continue to use a bottle at 13 months, the study does not probe what is consumed by bottle. There are statistically significant subgroup differences in bottle use at 13 months by both race and ethnicity (see Figure 3-7). Among infants of African American caregivers, 38 percent are still using a bottle at 13 months, as compared to 57 percent of infants of White caregivers and 60 percent of infants of Other race caregivers. Fewer infants of non-Hispanic caregivers (45%) as compared to infants of Hispanic caregivers (64%) are using a bottle by this age.
Figure 3-6. Percentage of study infants using a bottle at 13 months
Note: See Appendix C2, Table C2-8 for more details.
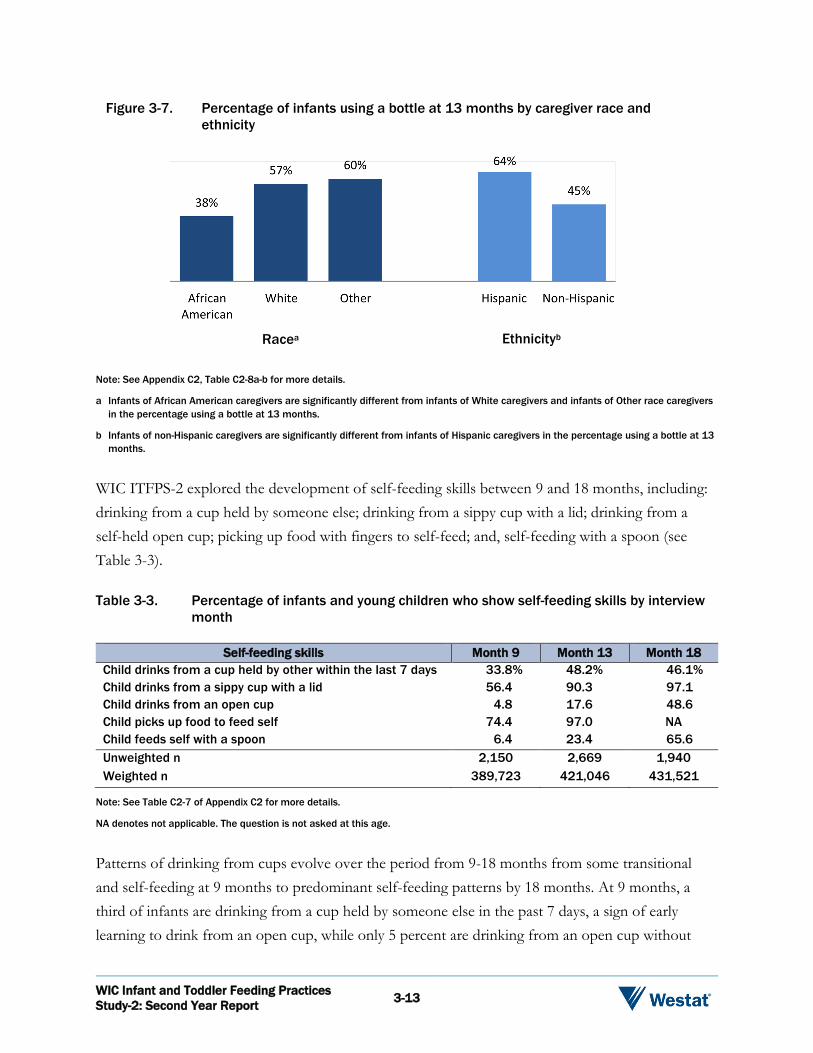
Figure 3-7. Percentage of infants using a bottle at 13 months by caregiver race and ethnicity
Racea Ethnicityb
WIC Infant and Toddler Feeding Practices Study-2: Second Year Report 3-13
Note: See Appendix C2, Table C2-8a-b for more details.
a Infants of African American caregivers are significantly different from infants of White caregivers and infants of Other race caregivers in the percentage using a bottle at 13 months.
b Infants of non-Hispanic caregivers are significantly different from infants of Hispanic caregivers in the percentage using a bottle at 13 months.
WIC ITFPS-2 explored the development of self-feeding skills between 9 and 18 months, including: drinking from a cup held by someone else; drinking from a sippy cup with a lid; drinking from a self-held open cup; picking up food with fingers to self-feed; and, self-feeding with a spoon (see Table 3-3). Table 3-3. Percentage of infants and young children who show self-feeding skills by interview
month
Self-feeding skills Month 9 Month 13 Month 18 Child drinks from a cup held by other within the last 7 days 33.8% 48.2% 46.1% Child drinks from a sippy cup with a lid 56.4 90.3 97.1 Child drinks from an open cup 4.8 17.6 48.6 Child picks up food to feed self 74.4 97.0 NA Child feeds self with a spoon 6.4 23.4 65.6 Unweighted n 2,150 2,669 1,940 Weighted n 389,723 421,046 431,521
Note: See Table C2-7 of Appendix C2 for more details.
NA denotes not applicable. The question is not asked at this age.
Patterns of drinking from cups evolve over the period from 9-18 months from some transitional and self-feeding at 9 months to predominant self-feeding patterns by 18 months. At 9 months, a third of infants are drinking from a cup held by someone else in the past 7 days, a sign of early learning to drink from an open cup, while only 5 percent are drinking from an open cup without

WIC Infant and Toddler Feeding Practices Study-2: Second Year Report 3-14
assistance. More than half (56%) of 9 month olds are using sippy cups. By 13 months, nearly half (48%) of infants are drinking from a cup held by someone else, and 90 percent are drinking from a sippy cup. Only 18 percent of infants are drinking from an open cup without assistance at 13 months. By 18 months, nearly all children (97%) are drinking from sippy cups. Although nearly half (49%) of children are drinking from an open cup without assistance, the data show that sippy cups are the most common cup type by this age. It should be noted that WIC does not recommend long-term use of sippy cups. Instead, these cups are intended to be used as a training tool, and children should transition from the sippy cup to an open cup when developmentally ready. Socio-demographic subgroup analyses yield few substantive and statistically significant differences in self-feeding skills for drinking. African American caregivers are significantly different from White or Other race mothers: fewer African American caregivers have their children drinking from a cup held by someone else at all ages. Although long-term use of sippy cups is not recommended, the youngest group of mothers (ages 16-19 at the child’s birth) is significantly more likely than older mothers to have their children drinking from sippy cups at both 9 and 18 months, and significantly more likely than the oldest group of mothers (ages 26+) to use sippy cups at 13 months. The patterns seen for independent drinking from cups in WIC ITFPS-2 align with findings from comparable age groups from FITS 2002 (Carruth, Ziegler, Gordon, & Hendricks, 2004).53 Although fewer WIC ITFPS-2 infants are using sippy cups without assistance at 9 months (56%) as compared to FITS 2002 9-11 month group (70%), by 13 months the rates are nearly identical (90% and 91%, respectively; see Figure 3-8). For open cups, WIC ITFPS-2 infants start at a lower rate at 9 months (5% in WIC ITFPS-2 versus 10% in the FITS 2002 sample), but increase steadily in comparison to the FITS 2002 sample. By 15-18 months a higher percentage of WIC ITFPS-2 children are using open cups (49% versus 34%), but this may be attributable to the WIC ITFPS-2 group being 17-18 months old at the time this question is asked, rather than ranging from 15-18 months like the FITS 2002 group.
53 FITS 2002 is a cross-sectional study covering a range of ages. Their data are presented only in age bands, not at
individual ages by month. Comparisons between WIC ITFPS-2 and FITS 2002 data therefore match the WIC ITFPS-2 month to the closest relevant FITS 2002 age group.

WIC Infant and Toddler Feeding Practices Study-2: Second Year Report 3-15
Figure 3-8. Percentage of children drinking from cups independently (months 9-18)
Sippy cups Open cups
5%
18%
49%
10% 14%
34%
9-11 months 12-14 months 15-18 months
WIC ITFPS-2 FITS 2002
56%
90% 97%
70%91% 96%
9-11 months 12-14 months 15-18 months
WIC ITFPS-2 FITS 2002
Patterns of self-feeding solid foods follow a clear developmental progression, and correspond well to the findings reported in Section 3.4.2 showing an increase in preparation of thicker and chunkier foods that are appropriate for self-feeding. Most (74%) WIC ITFPS-2 infants are picking up food with their fingers to self-feed at 9 months, and almost all (97%) are doing it by 13 months. Self-feeding with a spoon, which requires greater fine-motor coordination, is developing more slowly with only 23 percent of children feeding themselves with a spoon at 13 months, and 66 percent doing so at 18 months. There are few socio-demographic subgroup differences in self-feeding of solid foods, and none that are sustained over time or large in magnitude, suggesting that these skills develop as children age, and not necessarily because of the influence of socio-demographic factors (see Tables C2-7a-w in Appendix C2 for details). WIC ITFPS-2 children develop self-feeding skills with the same pattern and timing as both their WIC IFPS-1 predecessors, and the broader FITS 2002 sample, suggesting that WIC ITFPS-2 children are meeting expected milestones. For self-feeding with fingers, most (98%) WIC IFPS-1 infants are demonstrating this ability by the end of the first year, like the WIC ITFPS-2 infants. Data from FITS 2002 on self-feeding with a spoon show that their study children are on trajectory for this feeding skill that closely mirrors that of the WIC ITFPS-2 children (see Figure 3-9).
Note: The FITS 2002 cross-sectional sample is divided into the ranges depicted above for analysis. To make comparisons between the two studies, WIC ITFPS-2 longitudinal interviews from 9, 13, and 18 months, the closest corresponding

WIC Infant and Toddler Feeding Practices Study-2: Second Year Report 3-16
Figure 3-9. Percentage children self-feeding with a spoon (months 9-18)
6%
23%
66%
11%
29%
64%
9-11 months 12-14 months 15-18 months
WIC ITFPS-2 FITS 2002
Note: The FITS 2002 cross-sectional sample is divided into the ranges depicted above for analysis. To make comparisons between the two studies, WIC ITFPS-2 longitudinal interviews from 9, 13, and 18 months, the closest corresponding months, are used.
Overall, self-feeding is progressing along expected developmental trajectories. Approximately half of study infants are no longer using a bottle by 13 months. During the same month, almost all are picking up foods to self-feed. By 18 months, more than half are self-feeding with a spoon, and almost half are drinking from a self-held open cup. 3.5 Summary
Complementary feeding practices among WIC ITFPS-2 caregivers are showing expected progressions in purchasing, food preparation, methods of feeding, and the promotion of self-feeding skills. WIC food packages for infants include commercial baby food fruits and vegetables, infant cereal, and infant formula for infants not breastfeeding or partially breastfeeding. Food packages for 1 to 4 year olds include foods such as cow’s milk, eggs, breakfast cereal, whole wheat or whole grain bread, 100 percent fruit juice, legumes/peanut butter, and fresh fruits and vegetables. At both 7 and 15 months, approximately 9 in 10 mothers agree that the WIC food package allows them to purchase foods they would typically feed their children. The data show WIC ITFPS-2 caregivers relying on store-bought, jarred baby food at 7 months of age. This decreases gradually from 7 to 13 months. Among caregivers who prepare homemade baby

WIC Infant and Toddler Feeding Practices Study-2: Second Year Report 3-17
foods, most are mashing (61%) or pureeing (57%) foods at 7 months. By 13 months, however, fewer caregivers are pureeing food (36%) and more are offering chopped or diced foods (87%). This is consistent with the ability of children beyond the infant year to chew thicker and lumpier foods. Some caregivers (19% at 13 months) report premasticating food before offering it to their infants, although this technique is not recommended by WIC. By 5 months of age, 65 percent of caregivers report using a spoon to feed their infants, and by 7 months, 95 percent are doing so. The use of infant feeders to feed complementary foods, a method not recommended due to risks of choking and overconsumption, also rises, with 15 percent of caregivers reporting infant feeder use at 9 months. At 9 months, 34 percent of infants are drinking from a cup held by someone else, and 56 percent are using sippy cups, but only 5 percent are drinking from an open cup without assistance. Bottle use continues into the second year, although WIC encourages bottle weaning once the child turns 1 year old. At 13 months, 47 percent of WIC ITFPS-2 infants are no longer drinking anything from a bottle. Among the 53 percent who continue to use a bottle at least occasionally, however, the study does not have data on what is being consumed by bottle. Expected progressions in self-feeding continue, evolving from the transitional and initial self-feeding activities at 9 months to predominant self-feeding patterns by 18 months. Most (74%) WIC ITFPS-2 infants are picking up food with their fingers to self-feed at 9 months, and 97 percent are doing it by 13 months. Only 23 percent of children are feeding themselves with a spoon at 13 months, but by 18 months, 66 percent are doing so. By 18 months, 97 percent of children are drinking from sippy cups, and almost half (49%) are able to drink from an open cup without assistance. Because use of open cups is probed only through 18 months, it is not possible to ascertain from these data when this milestone is reached by nearly all WIC children. The progression of self-feeding abilities seen in WIC ITFPS-2 aligns well with those reported in WIC IFPS-1 and in the FITS 2002 study. The only notable point of divergence from WIC IFPS-1 is a positive change with regard to use of potentially detrimental infant feeders: the percentage of caregivers reporting use of an infant feeder by 11 months has dropped by 19 percentage points as compared to WIC IFPS-1. These findings show that WIC children are meeting expected progressions in complementary feeding as they transition from infancy into the second year.

Food Intake, Meals, and Snacks 4
WIC Infant and Toddler Feeding Practices Study-2: Second Year Report 4-1
4.1 Overview
This chapter focuses on food intake and meal and snack patterns. The timeframe addressed in this chapter runs from 3 through 24 months, with an emphasis on the period from 7 to 24 months. Topics addressed in this chapter54 include the following:
What percentage of study children are consuming fruit on a given day?
What percentage of study children are consuming vegetables on a given day?
What percentage of study children are consuming dairy products on a given day?
What percentage of study children are consuming meat and other proteins on a given day?
What percentage of study children are consuming desserts, sugar sweetened beverages, and salty snacks?
What are the study children’s meal and snack patterns?
4.2 Background
Early infant feeding and nutrition patterns play an important role in later dietary habits and health outcomes, and provide an opportunity for primary prevention of chronic diseases (Agostoni, Baselli, & Mazzoni, 2013; Arenz, Rückerl, Koletzko, & von Kries, 2004; Campbell et al., 2016; Harder, Bergmann, Kallischnigg, & Plagemann, 2005; Owen, Martin, Whincup, Smith, & Cook, 2005). Varied diets rich in fruits and vegetables are associated with long-term reductions in disease risk (Kant, 2004). The American Academy of Pediatrics (AAP) recommends that infants be exclusively breastfed for the first 6 months of life, and that breastfeeding continue with appropriate complementary foods until at least 12 months (AAP, 2012). At the time when the WIC Infant and Toddler Feeding Practices Study (WIC ITFPS-2) infants were beginning to consume complementary foods, WIC and AAP recommendations were to introduce complementary foods around 6 months,
54 Some additional topics relevant to food intake, meals, and snacks are addressed through data tables in Appendix C3.

WIC Infant and Toddler Feeding Practices Study-2: Second Year Report 4-2
or when the infant seems developmentally ready, but not before age 4 months. Recommendations have evolved recently, and currently both WIC and AAP recommend that infants start receiving complementary foods at 6 months of age. AAP recommends feeding complementary foods 2-3 times a day between 6-8 months, increasing to 3-4 times daily between 9-11 months (AAP, 2016). AAP also currently recommends that fruit juice not be introduced during infancy, unless it is clinically indicated (Heyman & Abrams, 2017). Starting at 7-8 months, children should be guided in eating meals and snacks that include a variety of meats, cereals, vegetables, and fruits (Kleinman & Greer, 2013). There are no current national dietary guidelines for children from birth to 24 months, although Dietary Guidelines for Americans for this age group are currently in development, and are expected to be released in 2020.55 Nonetheless, several research studies have characterized children’s food intake during this period of life. The Gerber/Nestle Feeding Infants and Toddlers Study 2002 (FITS 2002) (Skinner, Ziegler, Pac, & Devamey, 2004), which includes both WIC and non-WIC participants, reports that infants and toddlers in the United States are fed seven times per day on average, including breakfast, lunch, and dinner meals, and supplemental snacks. According to FITS 2002, snacks provide about 25 percent of children’s daily energy intake in the second year of life, and are typically comprised of milk, water, cookies, crackers, chips, and fruit drinks. High intakes of energy-dense, nutrient poor snack foods such as sugar-sweetened beverages (SSBs), savory snacks, and sweet bakery products are associated with lower intakes of nutrient-dense foods such as fruits and vegetables (AAP, 2016). Data from the National Health and Nutrition Examination Survey (NHANES) 2005-2012 (Grimes, Szymlek-Gay, Campbell, & Nicklas, 2015) show that although top food sources from birth to 24 months include nutrient-dense foods (e.g., milk, fruits, and starchy vegetables), SSBs, savory snacks, and sweet bakery products also contribute substantially to total energy intake. According to FITS 2008 (Saavedra, Deming, Dattilo, & Reidy, 2013), by preschool age more children are consuming sweets or SSBs than fruits or vegetables on a given day. Fruits and vegetables are excellent sources of nutrients such as potassium, folate, fiber, vitamin A, vitamin C, vitamin K, and various phytochemicals (Nebeling, 2002; U.S. Department of Agriculture (USDA) and U.S. Department of Health and Human Services, 2011). Despite the well-known health benefits of fruits and vegetables (He, Nowson, & MacGregor, 2006; He, Nowson, Lucas, & MacGregor, 2007; Montonen, Knekt, Järvinen, & Reunanen, 2004; World Cancer Research Fund, 2007), FITS 2008 finds that among infants 9 months to 1 year old, approximately 30 percent do not
55 U.S. Department of Agriculture, Center for Nutrition Policy and Promotion. (n.d.). Pregnancy and Birth to 24 Months
Project. Retrieved from https://www.cnpp.usda.gov/birthto24months on July 27, 2017.

WIC Infant and Toddler Feeding Practices Study-2: Second Year Report 4-3
eat a fruit and 28 percent do not eat a vegetable on a given day (Siega-Riz et al., 2010). Weaning diets are often characterized by low intakes of fruits, with the exception of fruit juice, and low intakes of vegetables, with the exception of starchy varieties (Saavedra et al., 2013) 4.3 Sample and Analysis Approach
4.3.1 Sample
The analyses in this chapter utilize data throughout the infant year and up to the 24-month interview, although many of the analyses focus on the period from 7-24 months. Table 4-1 shows the number of respondents to the 7- to 24-month interviews. While the entire sample (core plus supplemental) receives the 7-, 13-, and 24-month interviews, only the core sample receives the 9-, 11-, 15-, and 18-month interviews. Because not everyone in the sample is offered the 9-, 11-, 15-, and 18-month interviews, and some participants do not respond to interview requests, the responses to some interviews are less than the full sample size. In analyses, the responses to each interview are weighted so that findings reflect the WIC population as described in Chapter 1. Table 4-1. Number of respondents by interview month
Sample structure 7-Month interview
9-Month interview
11-Month interview
13-Month interview
15-Month interview
18-Month interview
24-Month interview
Core prenatal sample 2,194 2,140 2,044 1,956 1,814 1,759 1,702 Core postnatal sample 320 311 278 283 253 233 235 Supplemental prenatal sample
500 -- -- 462 -- -- 425
Supplemental postnatal sample
120 -- -- 106 -- -- 99
Total 3,134 2,451 2,322 2,807 2,067 1,992 2,461
Note: Supplemental sample members were interviewed only at 7- , 13-, and 24-months.
4.3.2 Analysis
The analyses in this chapter examine food intake, as well as meal and snack patterns, from 3 to 24 months, with an emphasis on the period from 7 to 24 months. Analyses explore socio-demographic characteristics associated with these patterns of intake. Socio-demographic characteristics are typically measured at the time of the first interview. For characteristics that change over time, such as food security or income poverty, socio-demographic characteristics are updated to values

WIC Infant and Toddler Feeding Practices Study-2: Second Year Report 4-4
reported at the 13-month interview if they are being analyzed in relation to outcomes from 15 through 24 months. Analyses include bivariate analysis to examine whether an outcome of interest varies by subgroup, and follow-up t-tests between pairs of subgroups to determine which subgroups are statistically significantly different from each other. Appendix C3 presents each variable of interest crossed by a series of socio-demographic variables. Subgroup differences discussed in the chapter are limited to those that persist over time and are large in magnitude, to avoid focusing on findings that, while statistically significant, may have little practical importance. Statistical significance, when indicated, is at the level of p < 0.05. When available, data are presented from other relevant studies alongside current findings to examine differences and similarities between studies. The additional relevant studies used as points of comparison in this chapter include the Gerber/Nestle Feeding Infants and Toddlers Studies (FITS) conducted in 2002 and 2008 (Briefel et al., 2010; Ponza, Devaney, Ziegler, Reidy, & Squatrito, 2004; Ziegler, Briefel, Clusen, & Devaney, 2006), well-known national studies of infant and toddler feeding practices which include both WIC and non-WIC children. The FITS studies are cross-sectional studies. FITS 2002 includes children from ages 4 months to 2 years, and FITS 2008 includes children from birth to age 4 years.56 Both studies collect 24-hour dietary recall data,57 making them good sources of comparison for food intake and meal and snack patterns. When comparison data are available from both studies FITS 2008 data are used, as they are closer in time to the WIC ITFPS-2 data collection than are the data from FITS 2002. Differences between these studies and WIC ITFPS-2 in methodology, as well as limits in the availability of data from other studies on which to conduct analyses, prevent making direct statistical comparisons between the studies. Consequently, comparisons focus on the magnitude differences between the studies, rather than statistical significance of the differences. All post-birth interviews through 24-months include a 24-hour dietary recall using USDA’s Automated Multi-Pass Method (AMPM) (Raper, Perloff, Ingwersen, Steinfeldt, & Anand, 2004), as described in Chapter 1. When conducting a 24-hour dietary recall, an interviewer guides the
56 Because FITS 2002 and 2008 are cross-sectional studies covering a range of ages, their findings are published in bands
of ages. Comparisons between WIC ITFPS-2 and FITS data therefore match the WIC ITFPS-2 month to the closest relevant FITS age band.
57 The methodology for coding dietary intakes differs slightly between FITS 2002 and 2008 and WIC ITFPS-2 such that some of the changes observed when comparing food groups or nutrient intakes over time may be due in part to the codes applied to the various foods and the food grouping scheme used to classify foods.

WIC Infant and Toddler Feeding Practices Study-2: Second Year Report 4-5
caregiver through the prior day’s intake, and asks the caregiver to report all foods, beverages, and dietary supplements the child consumed for each eating occasion during a 24-hour period. The interviewer records all information, and trained coders then code and analyze the data for nutrient and food group content. Analyses in this chapter use food group content and eating event (e.g., breakfast, snack), to describe food intake and meal and snack patterns as a snapshot of foods consumed on the day of the 24-hour dietary recall (i.e., on a given day). Because one of the goals of WIC ITFPS-2 is to enable comparisons to past studies, particularly the FITS studies, food group classifications used for WIC ITFPS-2 are the same as those used for FITS 2002 and 2008. The FITS classifications (Fox, Pac, Devaney, & Jankowski, 2004) are based on the Continuing Survey of Food Intakes by Individuals, and may therefore not always be an exact match to the food groups described in the 2015-2020 Dietary Guidelines for Americans, and the USDA Food Pattern Equivalents Database; however, using older definitions is necessary to allow comparisons to the previous work. 4.4 Food Intake
Understanding what foods children are eating is essential to understanding dietary improvements that are needed, and associations between diet and health outcomes. The following sections explore the foods eaten on a given day by the WIC ITFPS-2 children through 24 months, and their meal and snack patterns. Dietary intake information for WIC ITFPS-2 is compared to the data from the FITS 2002 (Devaney, Ziegler, Pac, Karwe, & Barr, 2004) and FITS 2008 (Briefel et al., 2010) studies to give context to the WIC ITFPS-2 findings. Data addressing the timing of introduction of complementary foods, including (but not limited to) fruits, vegetables, 100 percent fruit juice, sweet foods, and salty snacks, are presented in the WIC ITFPS-2: Infant Year Report, Chapter 5 (May et al., 2017). Data presented here focus on the percentages of 3-24 month olds consuming these foods on a given day. The foods addressed include
Key Findings: During the first 2 years, children are consuming many of the healthy foods offered by the WIC food packages for infants and children: At 24 months, 70 percent of children are eating any
fruit and 62 percent are eating any vegetable on a given day.
Only 9 percent of 11-month-old infants are consuming cow’s milk on a given day, a beverage not included in the WIC infant food package.
Cow’s milk is a part of the children’s WIC food package, and by 24 months, 85 percent of children are consuming it on a given day.

WIC Infant and Toddler Feeding Practices Study-2: Second Year Report 4-6
fruits, vegetables, milk and other dairy, meats and other proteins, and desserts, SSBs, and salty snacks.58 4.4.1 Fruit Consumption
The percentage of WIC ITFPS-2 children consuming fruit on a given day increases with age. Types of fruit include baby food fruit59 and non-baby food fruit. Non-baby food fruit includes fresh, canned, frozen, or dried fruit. Consumption of 100 percent fruit juice is considered separately. From 5 months to 7 months, the percentage of study infants consuming any type of non-juice fruit on a given day more than triples, from 16.2 percent to 57.7 percent. By 24 months, nearly 70 percent of study infants are consuming some type of baby-food or non-baby food fruit on a given day. From 5 to 11 months, more than 50 percent of infants are consuming baby food fruit. Consumption of baby food fruit begins to decline by 9 months, while consumption of non-baby food fruit and 100 percent fruit juice increases. Through 11 months, more infants consume 100 percent fruit juice than non-baby food fruit. These percentages begin to converge by 13 months, however, when over half of study infants consume 100 percent fruit juice (60%) and non-baby food fruit (56%) (Figure 4-1). Figure 4-1. Percentage of study children consuming fruit on a given day (months 3-24)
0
10
20
30
40
50
60
70
80
90
100
3 5 7 9 11 13 15 18 24
Perc
enta
ge o
f Stu
dy C
hild
ren
Age (in months)
Any fruit Baby food fruit Non-baby food fruit 100% fruit juice
58 Data on consumption of grains are not reported in this chapter, but appear in Tables C3-2 and C3-2a-w, Appendix C3. 59 Baby food fruits and baby food vegetables are commercially produced foods specifically for babies, and do not
include pureed baby foods made at home.
Note: See Appendix B3b, Table B3b-1, and Appendix C3, Table C3-3, for more details. Any fruit includes baby food fruit or non-baby food fruit, but not 100 fruit juice.

WIC Infant and Toddler Feeding Practices Study-2: Second Year Report 4-7
There are some patterns of socio-demographic characteristics associated with fruit consumption that are sustained over time, particularly with regard to consumption of non-baby food fruits and 100 percent fruit juice. At 7 and 13 months there are statistically significant differences by ethnicity; significantly more children of Hispanic mothers are consuming non-baby food fruit than are children of non-Hispanic mothers, but these differences resolve by 24 months. At 7, 13, and 24 months there are statistically significant differences by caregiver marital status; significantly more children of married caregivers are consuming non-baby food fruits, and significantly fewer are consuming 100 percent fruit juice, than are children of unmarried caregivers (see Appendix C3, Table C3-3a-w, for more details). The top five most commonly consumed fruits on a given day at 7, 13, and 24 months are shown in Table 4-2. At 7 months, baby food fruits make up the majority of the study infants’ top five fruits. By 13 months, a greater variety of non-baby food fruits appears within the top five fruits. By 24 months, no baby food fruits are present in the top five. When compared to the fruit consumption findings from the FITS 2008 study (Siega-Riz et al., 2010), the percentages of WIC ITFPS-2 infants consuming any fruit (excluding 100% fruit juice) are similar to, but slightly lower than, the FITS percentages (see Figure 4-2). The gap widens, however, when comparing the current study’s 18-month data (69%) to the FITS 18-20 month group (84%), and narrows again when comparing WIC ITFPS-2 24-month data (70%) to the FITS 21-24 month group (73%). One source of the differences may be that the samples for WIC ITFPS-2
Table 4-2. Top five fruits consumed by study children on a given day, 7- , 13-, and 24-month interviews
Top five fruits Percent of study infants who consumed
the fruit on a given day 7 months Baby food applesauce 21.1% Baby food bananas 19.8 Baby food pears 9.6 Banana 6.6 Baby food peaches 5.1 Unweighted n 3,081 Weighted n 435,294 13 months Banana 28.7% Apple 10.7 Baby food applesauce 10.4 Grapes 7.6 Strawberries 7.4 Unweighted n 2,763 Weighted n 434,035 24 months Banana 30.3% Apple 23.4 Grapes 13.5 Orange 11.0 Strawberries 9.5 Unweighted n 2,438 Weighted n 439,020
Note: See Appendix C3, Tables C3-4a-w, for more details. One hundred percent fruit juice is excluded from this table.

WIC Infant and Toddler Feeding Practices Study-2: Second Year Report 4-8
and FITS 2008 are different, as FITS 2008 contains both WIC participants, and participants who are not income-eligible for WIC. Additionally, because the FITS data fall within a range of ages, it is possible that this age discrepancy between studies’ data drives the widened gap during the 18-20 month period. Figure 4-2. Percentages of children consuming any fruit on a given day in WIC ITFPS-2 and FITS
2008
58%70% 71% 69% 70%65%
81%74%
84%73%
6-8 months 9-11 months 12-14 months 18-20 months 21-24 months
WIC ITFPS-2 FITS 2008
Note: The FITS 2008 cross-sectional sample is divided into the ranges depicted above for analysis. To make comparisons between the two studies, WIC ITFPS-2 longitudinal interviews from 7, 11, 13, 18, and 24 months, the closest corresponding months, are used. Any fruit includes baby food and non-baby food fruits, but excludes 100 percent fruit juice.
The WIC ITFPS-2 18 month interviews took place during a window between 17.5 – 18.5 months of age. Looking at the FITS data for 15-17 month old children, only 75 percent consumed any fruit on a given day, which is closer to the WIC ITFPS-2 18-month percentage. 4.4.2 Vegetable Consumption
The percentage of WIC ITFPS-2 children, ages 3 to 24 months, consuming any type of vegetable, including 100 percent vegetable juice, on a given day ranges from a low of 15 percent at 5 months, to a high of 66 percent at 11 months of age (see Figure 4-3). The percentage of study infants consuming vegetables, including baby food vegetables, cooked,60 and raw vegetables, nearly quadruples between 5 and 7 months, from 15 percent to 59 percent, consistent with the timing of the introduction of complementary foods. After 13 months, as baby food vegetable consumption becomes less common, the proportion consuming any vegetable on a given day plateaus to approximately 60 percent. 60 One hundred percent vegetable juice, when reported, is coded as a cooked vegetable.

WIC Infant and Toddler Feeding Practices Study-2: Second Year Report 4-9
Figure 4-3. Percentage of study children consuming vegetables on a given day (months 3-24)
0
10
20
30
40
50
60
70
80
90
100
3 5 7 9 11 13 15 18 24
Perc
enta
ge o
f Stu
dy C
hild
ren
Age (in months)
Any vegetable Baby food vegetables Cooked vegetables Raw vegetables
Several different subtypes of vegetables are examined, including dark green vegetables, deep yellow or orange vegetables, white potatoes, french fries or other fried potatoes, other starchy vegetables, and other vegetables.61 Looking more specifically at types of vegetables consumed, with the exception of deep yellow vegetables, and to a lesser extent other starchy vegetables, the intake of most types of vegetables gradually increases with age (see Table 4-3). On a given day, deep yellow or orange vegetables are consumed by moderate percentages of study infants from 7 months (43%) to 11 months (38%), and then decline to a low of 13 percent at 24 months. Consumption of french fries and other fried potatoes remains the lowest from 7 months (<1%) to 11 months (5%), after which consumption of dark green vegetables becomes the lowest (ranging from 8% at 13 months, to 11% at 24 months).
61 Vegetable type names do not match the vegetable subgroups in the Dietary Guidelines for Americans (DGAs)
because food groups are constructed to facilitate comparisons to the FITS 2002 and 2008 studies. Examples of dark-green vegetables include broccoli, spinach, other greens, and romaine lettuce; examples of deep-yellow or orange vegetables include carrots, pumpkin, sweet potatoes, and winter squash; examples of starchy vegetables include corn, green peas, immature lima beans, black-eyed peas (not dried), cassava, and rutabaga; and examples of other reported vegetables include artichoke, asparagus, beets, Brussels sprouts, cabbage, cauliflower, celery, cucumber, eggplant, green beans, lettuce, mushrooms, okra, onion, pea pods, peppers, tomatoes/tomato sauce, wax/yellow beans, and zucchini/summer squash.

WIC Infant and Toddler Feeding Practices Study-2: Second Year Report 4-10
Table 4-3. Percentage of study children consuming different types of vegetables on a given day by interview month (months 7-24)
Type of vegetable Month 7 Month 9 Month 11 Month 13 Month 15 Month 18 Month 24
Dark green vegetablesa 1.2% 2.9% 5.8% 8.1% 7.6% 10.1% 10.6% Deep yellow or orange
vegetablesb 43.1 43.9 37.5 24.0 16.5 15.6 12.9
White potatoes 3.8 7.5 12.1 19.5 20.3 17.6 15.2 French fries and other
fried potatoes 0.3 1.5 4.7 8.2 11.7 11.9 14.5
Other starchy vegetablesc 15.4 19.6 19.3 15.7 15.2 14.4 13.9 Other vegetablesd 11.6 15.7 18.8 23.6 24.9 27.6 31.7
Unweighted n 3,081 2,412 2,285 2,763 2,048 1,973 2,438 Weighted n 435,294 435,705 435,281 434,035 437,375 437,505 439,020
Note: See Appendix C3, Table C3-5 for more details.
a Reported dark green vegetables include broccoli, spinach, other greens, and romaine lettuce.
b Reported deep yellow or orange vegetables include carrots, pumpkin, sweet potatoes, and winter squash.
c Reported starchy vegetables include corn, green peas, immature lima beans, black-eyed peas (not dried), cassava, and rutabaga.
d Other reported vegetables include artichoke, asparagus, beets, Brussels sprouts, cabbage, cauliflower, celery, cucumber, eggplant, green beans, lettuce, mushrooms, okra, onion, pea pods, peppers, tomatoes/tomato sauce, wax/yellow beans, and zucchini/summer squash.
There are few sustained patterns over time of socio-demographic differences in vegetable consumption.62 Race is consistently associated with vegetable consumption through 24 months, but the nature of the relation changes over time. At 7 months, a significantly lower percentage of infants of African American mothers (53%) consume vegetables than do infants of White mothers (62%). By 13 months, however, a significantly higher percentage of children of African American mothers (70.4%) are consuming vegetables as compared to children of White (63%) or Other race (54%) mothers. This appears to be due, at least in part, to a higher percentage of children of African American mothers consuming white potatoes, and a higher percentage consuming french fries or fried potatoes, at 13 months. Again at 24 months, a higher percentage of children of African American mothers (67%) are consuming any vegetable as compared to children of White (63%) and Other race (55%) mothers. The top five vegetables consumed on a given day at 7 months and at 13 months show a shift in the types of vegetables most often consumed (see Table 4-4). At 7 months, infants are consuming more nutrient-rich dark green and deep yellow or orange baby food vegetables. By 13 months, however, mashed and fried potatoes and green beans occupy the top spots. At 24 months, tomatoes, which may be cooked and in sauces, top the list of vegetables.
62 See Tables C3-5a-w in Appendix C3 for more details on socio-demographic differences.

WIC Infant and Toddler Feeding Practices Study-2: Second Year Report 4-11
When compared to the vegetable consumption findings from the FITS 2008 study (Siega-Riz et al., 2010), the percentages of WIC ITFPS-2 infants consuming any vegetable show a widening gap as the children get older, with a smaller percentage of WIC ITFPS-2 children consuming any vegetable on a given day (see Figure 4-4). This gap lessens again at 24 months, when 62 percent of WIC ITFPS-2 children, and 68 percent of FITS 2008 children, are consuming any vegetable on a given day. In both studies, dark green vegetables are the least consumed, and deep yellow or orange vegetables are consumed at a higher rate during the infant period when, presumably, consumption may be in the form of baby food vegetables. More FITS 2008 children than WIC ITFPS-2 children are consuming white potatoes, particularly when comparing the FITS 2008 12-14 month data (32%) to the WIC ITFPS-2 13-month data (20%). As with fruit consumption, age discrepancies and sample differences between the studies’ data may drive some of these differences.
Table 4-4. Top five vegetables consumed by study children on a given day, 7-, 13-, and 24-month interviews
Top five vegetables
Percent of study children who consumed the
vegetable on a given day 7 months Baby food carrots 17.5% Baby food sweet potatoes 13.2 Baby food winter squash 10.6 Baby food green beans 8.7 Baby food peas 8.0 Unweighted n 3,081 Weighted n 435,294 13 months Mashed potatoes 12.5% Green beans 10.0 French fries or other fried potatoes
8.2
Carrots 8.0 Broccoli 5.9 Unweighted n 2,763 Weighted n 434,035 24 months Tomatoes 15.6% French fries or other fried potatoes
14.4
Mashed potatoes 10.4 Green beans 8.9 Corn 8.1 Unweighted n 2,438 Weighted n 439,020
Note: See Appendix C3, Tables C3-6a-w, for more details.

WIC Infant and Toddler Feeding Practices Study-2: Second Year Report 4-12
Figure 4-4. Percentages of children consuming any vegetable on a given day in WIC ITFPS-2 and FITS 2008
59%66% 63% 60% 62%63%
72% 72% 72% 68%
6-8 months 9-11 months 12-14 months 18-20 months 21-24 months
WIC ITFPS-2 FITS 2008
Note: The FITS 2008 cross-sectional sample is divided into the ranges depicted above for analysis. To make comparisons between the two studies, WIC ITFPS-2 longitudinal interviews from 7, 11, 13, 18, and 24 months, the closest corresponding months, are used. Any vegetable includes baby food vegetables, cooked vegetables, and raw vegetables.
Overall, between 11 and 24 months, about 70 percent of WIC ITFPS-2 children are consuming any fruit on a given day, and about 60 percent of WIC ITFPS-2 children are consuming any vegetable on a given day. Although these consumption patterns are relatively stable between late infancy and the second year of life, consumption of 100 percent fruit juice rises with age, with 47 percent of WIC ITFPS-2 children consuming 100 percent fruit juice on a given day at 11 months, and 70 percent doing so on a given day at 24 months. 4.4.3 Dairy Consumption
The percentage of WIC ITFPS-2 children, ages 3 to 24 months, consuming dairy products on a given day remains very low until cow’s milk is introduced at the end of the infant year (see Figure 4-5). The percentage of study infants consuming cow’s milk increases dramatically, from 9 percent at 11 months to 75 percent at 13 months, then rises slightly and plateaus at approximately 84 percent through 24 months. Consumption of cheese and yogurt rises steadily after 7 months, but even at the months with the highest percentages, these dairy foods are consumed on a given day by less than half of WIC ITFPS-2 children: at 24 months 36 percent of children consume cheese, and 19 percent consume yogurt. Between 3 and 24 months, milk alternatives, including soy milk and rice milk, are consumed by only small percentages (less than 3%) of the study children. At 24 months, fewer

WIC Infant and Toddler Feeding Practices Study-2: Second Year Report 4-13
African American children are consuming cheese or yogurt than White or Other race children (see Table C3-7a, Appendix C3, for more details), which may be due in part to the high rate of lactose intolerance in African Americans (Heyman, 2006). Figure 4-5. Percentage of study children consuming dairy or milk alternative products on a
given day (months 3 to 24)
0
10
20
30
40
50
60
70
80
90
100
3 5 7 9 11 13 15 18 24
Perc
enta
ge o
f Stu
dy C
hild
ren
Age (in months)
Cow's milk Soy or rice milk Cheese Yogurt
Note: See Appendix B3b, Table B3b-3, and Appendix C3, Table C3-7, for more details.
When compared to the dairy consumption findings from the FITS 2008 study (Siega-Riz et al., 2010), the percentages of WIC ITFPS-2 infants consuming dairy products on a given day follow a similar pattern overall to the FITS 2008 data (see Figure 4-6), but there are some notable differences. Between 9-11 months, the percentage of WIC ITFPS-2 infants consuming cow’s milk on a given day (9%) is somewhat lower than in the FITS 2008 group (17%), perhaps reflecting WIC education on delaying introduction of cow’s milk until 1 year. During the second year of life, the percentages of children consuming cow’s milk for the two studies run in close parallel. The pattern for cheese consumption is very similar to that for cow’s milk consumption, with the percentages of children consuming it being slightly lower for WIC ITFPS-2 (8%) than for FITS 2008 (13%) from 9-11 months, but the percentages for the two studies remaining very close during the second year. Yogurt consumption, in contrast, does seem to differ slightly across the two studies. Throughout the period from 6-8 months until 21-24 months, higher percentages of FITS 2008 children are consuming yogurt on a given day than are WIC ITFPS-2 children.

WIC Infant and Toddler Feeding Practices Study-2: Second Year Report 4-14
Figure 4-6. Percentages of study children consuming dairy foods on a given day in WIC ITFPS-2 and FITS 2008
Note: The FITS 2008 cross-sectional sample is divided into the ranges depicted above for analysis. To make comparisons between the
two studies, WIC ITFPS-2 longitudinal interviews from 7, 11, 13, 18, and 24 months, the closest corresponding months, are used.

WIC Infant and Toddler Feeding Practices Study-2: Second Year Report 4-15
Overall, consumption of dairy on a given day is low for WIC ITFPS-2 infants through 11 months. This is consistent with the WIC food package for infants, which does not include any dairy products, and could also be due in part to WIC caregivers delaying introduction of cow’s milk until their children are the recommended age of 12 months old. By 24 months, however, on a given day 85 percent report consuming cow’s milk, 36 percent report consuming cheese, and 19 percent report consuming yogurt. 4.4.4 Meats and Other Protein Consumption
Few WIC ITFPS-2 infants are consuming any meats or other protein sources63 prior to age 7 months. From 7 to 13 months, however, the percentage of children consuming meats or other proteins increases sharply (see Figure 4-7). By 13 months, 86 percent of WIC ITFPS-2 children are consuming a meat or another protein source on a given day. This continues to rise until nearly all (96%) the children are consuming a meat or other protein on a given day at 24 months. Consistently over time, fewer children are consuming meats not in mixed dishes than are consuming other protein sources, which may include non-meat proteins or meats mixed into other dishes. Baby food meats64 are not consumed by high percentages of WIC ITFPS-2 children, although baby food meats are included in the infant fully breastfed WIC food package for ages 6 to 11 months. The percentage of children consuming baby food meats peaks at 9 months (12%) then begins to decline, with less than 5 percent of children consuming them on a given day after 13 months. There are no associations between socio-demographic characteristics and any meat and other protein consumption that persist over time, or are large in magnitude (see Tables C3-7a-w, Appendix C3, for details).
63 Other protein sources include dried beans or peas; vegetarian meat substitutes; eggs; peanut butter, nuts, and seeds;
cheese; yogurt; and, protein sources in mixed dishes such as: baby food dinners; beans and rice, chili, and other bean mixtures; mixtures with vegetables and/or rice or pasta. Cheese and yogurt, while also noted as dairy foods in this chapter, are included as other protein sources to align with food classifications in FITS 2002 and 2008.
64 Baby food meats are commercially produced foods specifically for babies, and do not includes pureed meats made at home for babies. Non-baby food meats include beef, chicken, fish or shellfish, hot dogs, sausages, cold cuts, pork/ham, or other meats.

Figure 4-7. Percentage of study children consuming meats and other proteins on a given day (months 3 to 24)
WIC Infant and Toddler Feeding Practices Study-2: Second Year Report 4-16
0
10
20
30
40
50
60
70
80
90
100
3 5 7 9 11 13 15 18 24
Perc
enta
ge o
f Stu
dy C
hild
ren
Age (in months)
Any meat or protein Baby food meat Non-baby food meat Other protein sources
Note: See Appendix C3, Table C3-7, for more details. Other protein sources include dried beans or peas; vegetarian meat substitutes;
eggs; peanut butter, nuts, and seeds; cheese; yogurt; and, protein sources in mixed dishes.
When comparing meat and other protein consumption in WIC ITFPS-2 to the FITS 2008 study (Siega-Riz et al., 2010), in the 6- to 8-month range the WIC ITFPS-2 percentage is less than half that of FITS 2008 (18% versus 39%; see Figure 4-8). The gap narrows for older children, however, and by 21 to 24 months, the rates are an identical 96 percent. During the 6-to 8-month period, one of the sources of difference seems to be the percentage of children consuming meats or other proteins in mixed dishes, particularly baby food dinners: 24 percent of FITS 2008 infants, as compared to 3 percent of WIC ITFPS-2 infants, are consuming baby food dinners on a given day during this time. Overall, consumption of meats and other protein sources on a given day rises from 18 percent at 7 months to 86 percent at 13 months. By 24 months, nearly all WIC ITFPS-2 children (96%) are consuming a meat or other protein source on a given day.

WIC Infant and Toddler Feeding Practices Study-2: Second Year Report 4-17
Figure 4-8. Percentages of children consuming any meats or proteins on a given day in WIC ITFPS-2 and FITS 2008
18%
60%
86%
95% 96%
39%
77%
91%98% 96%
6-8 months 9-11 months 12-14 months 18-20 months 21-24 months
WIC ITFPS-2 FITS 2008
Note: The FITS 2008 cross-sectional sample is divided into the ranges depicted above for analysis. To make comparisons between the
two studies, WIC ITFPS-2 longitudinal interviews from 7, 11, 13, 18, and 24 months, the closest corresponding months, are used. Any meats or proteins includes baby food meats, non-baby food meats, and other protein sources.
4.4.5 Dessert, Sugar Sweetened Beverage, and Salty Snack Consumption
The percentages of WIC ITFPS-2 children consuming desserts and candy, SSBs (excluding 100% fruit juice), and salty snacks on a given day all increase with age (see Figure 4-9). Desserts and candy increases at the fastest rate, with consumption on a given day increasing from 11 percent of children at 7 months to 52 percent of children by 24 months. Cakes, pies, cookies, and pastries are the most commonly consumed dessert items, with 20 percent of children consuming cookies (not including baby cookies, teething biscuits, or animal crackers) at 24 months. Consumption of candy doubles between 18 and 24 months, from 8 percent to 16 percent of children consuming it on a given day. Consumption of baby food desserts peaks at 19 percent by 11 months, and declines after that. The percentage of children consuming SSBs on a given day remains relatively low during the infant year, but 11 percent of WIC ITFPS-2 children are consuming an SSB at 13 months. The percentage continues to rise through 24 months, and by 24 months nearly a quarter (23%) of the children are

WIC Infant and Toddler Feeding Practices Study-2: Second Year Report 4-18
consuming an SSB on a given day. Most of those sweetened beverages are fruit flavored drinks; only 4 percent of study children are consuming carbonated sodas, and only 5 percent are consuming other sweetened beverages, such as sweet tea or Gatorade, at 24 months. Figure 4-9. Percentage of study children consuming desserts and candy, sugar-sweetened
beverages, and salty snacks on a given day (months 3 to 24)
0
10
20
30
40
50
60
70
80
90
100
3 5 7 9 11 13 15 18 24
Perc
enta
ge o
f Stu
dy C
hild
ren
Age (in months)
Desserts and candy Sugar sweetened beverages Salty snacks
Note: See Appendix B3b, Table B3b-4, and Appendix C3, Table C3-8, for more details.
Consumption of salty snacks (e.g., potato chips, popcorn, cheese curls/puffs, tortilla chips, and other types of chips and salty snacks) also rises steadily, with 24 percent of children consuming a salty snack on a given day at 24 months. Analyses at 7, 13, and 24 months yield few consistent patterns of socio-demographic differences in the percentages of children consuming desserts, candy, SSBs, or salty snacks, and the few that are significant are small in magnitude (see Tables C3-8a-w, Appendix C3, for details). One statistically significant pattern that does seem to be emerging is that more children of non-Hispanic caregivers are consuming salty snacks on a given day than are children of Hispanic caregivers. This association between ethnicity and consumption of salty snacks is statistically significant at 7, 13, and 24 months. By 24 months, the gap widens such that 30 percent of children of non-Hispanic caregivers, as compared to 18 percent of children of Hispanic caregivers, are consuming salty snacks. Because not all children are consuming desserts, SSBs, and salty snacks at these ages, other patterns of socio-demographic differences may not emerge until later ages.
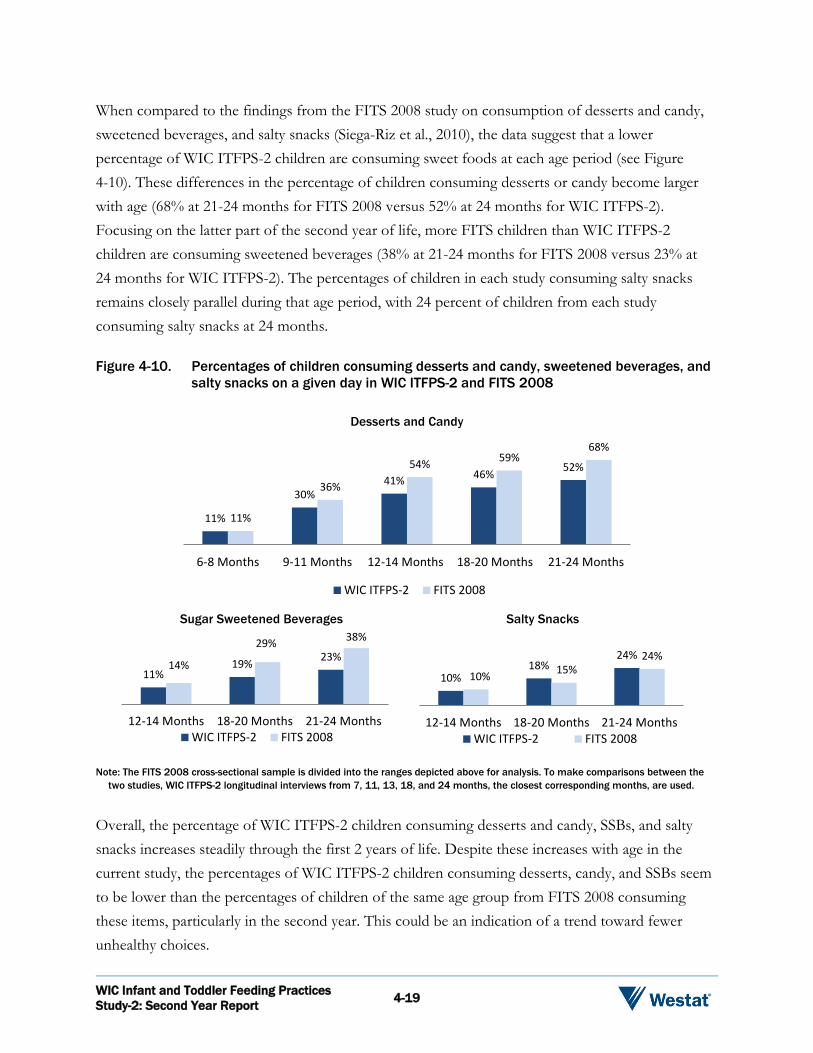
WIC Infant and Toddler Feeding Practices Study-2: Second Year Report 4-19
When compared to the findings from the FITS 2008 study on consumption of desserts and candy, sweetened beverages, and salty snacks (Siega-Riz et al., 2010), the data suggest that a lower percentage of WIC ITFPS-2 children are consuming sweet foods at each age period (see Figure 4-10). These differences in the percentage of children consuming desserts or candy become larger with age (68% at 21-24 months for FITS 2008 versus 52% at 24 months for WIC ITFPS-2). Focusing on the latter part of the second year of life, more FITS children than WIC ITFPS-2 children are consuming sweetened beverages (38% at 21-24 months for FITS 2008 versus 23% at 24 months for WIC ITFPS-2). The percentages of children in each study consuming salty snacks remains closely parallel during that age period, with 24 percent of children from each study consuming salty snacks at 24 months. Figure 4-10. Percentages of children consuming desserts and candy, sweetened beverages, and
salty snacks on a given day in WIC ITFPS-2 and FITS 2008
Desserts and Candy
Sugar Sweetened Beverages Salty Snacks
11%
30%41% 46% 52%
11%
36%
54% 59%68%
6-8 Months 9-11 Months 12-14 Months 18-20 Months 21-24 Months
WIC ITFPS-2 FITS 2008
11%19% 23%
14%
29% 38%
12-14 Months 18-20 Months 21-24 MonthsWIC ITFPS-2 FITS 2008
10%18%
24%
10% 15%24%
12-14 Months 18-20 Months 21-24 MonthsWIC ITFPS-2 FITS 2008
Note: The FITS 2008 cross-sectional sample is divided into the ranges depicted above for analysis. To make comparisons between the
two studies, WIC ITFPS-2 longitudinal interviews from 7, 11, 13, 18, and 24 months, the closest corresponding months, are used.
Overall, the percentage of WIC ITFPS-2 children consuming desserts and candy, SSBs, and salty snacks increases steadily through the first 2 years of life. Despite these increases with age in the current study, the percentages of WIC ITFPS-2 children consuming desserts, candy, and SSBs seem to be lower than the percentages of children of the same age group from FITS 2008 consuming these items, particularly in the second year. This could be an indication of a trend toward fewer unhealthy choices.

WIC Infant and Toddler Feeding Practices Study-2: Second Year Report 4-20
4.5 Meal and Snack Patterns
As a part of the study protocol, WIC ITFPS-2 caregivers are asked to identify each eating occasion when completing their child’s 24-hour dietary recall interview. Findings from those interviews indicate that as the WIC ITFPS-2 children become more established in eating complementary foods and move into the second year of life, breakfast, lunch, and dinner as distinct eating events become more common (see Figure 4-11; see Table B3b-5 in Appendix B3b for full details). Between 7 and 24 months, breakfast remains the most common meal event reported at each dietary recall, ranging from 82 percent of children at 7 months, to 98 percent of children at 24 months, eating breakfast. Distinct lunch and dinner meals become more standard over time, and by 24 months almost all study children are eating breakfast (98%), lunch (94%), and dinner (95%). Snacks become more common over time, and by 24 months four out of five study children are eating at least one snack on a given day.
82%94% 96% 98%
75%88% 93% 94%
75%
90% 92% 95%
53%
76% 78% 80%
7 13 18 24Age (in months)
Breakfast Lunch Dinner Snack
Figure 4-11. Percentages of study children eating meals and snacks by month
Note: See Appendix B3b, Table B3b-5, for more details.
The most commonly consumed foods or beverages at each eating occasion at 13 and 24 months appear in Table 4-5. At 13 months, milk and milk products (excluding breastmilk and infant formula) and fruit (excluding juice) are commonly consumed at every eating occasion, and 100 percent fruit juice is commonly consumed at lunch, dinner, and snacks. Eggs, infant cereals, and non-infant cereals (not presweetened) are common at breakfast. Lunches and dinners include vegetables and non-baby food meats. Snacks commonly include crackers, pretzels, rice cakes, fruit,

WIC Infant and Toddler Feeding Practices Study-2: Second Year Report 4-21
and, for a subset of children, baby food desserts. Most of these foods are available as a part of the WIC food package at 13 months. These commonly consumed items are similar to those reported by FITS 2002 for 12-14 month old children (Skinner et al., 2004). Table 4-5. Top five foods or beverages consumed on a given day at each eating occasion by
study children, at 13 and 24 months
Month 13
Top five foods or beverages Percent of study
children consuming Breakfast Milk and milk products Any fruit (excluding juice)
Non-infant cereal (not presweetened) Infant cereals Eggs
50.4% 28.6
25.1
23.5 20.5
Unweighted n Weighted n
2,613 410,041
Lunch Any vegetables Milk and milk products Any fruit (excluding juice) 100 percent fruit juice Non-baby food meat
30.5% 28.3 28.0 27.1 23.9
Unweighted n Weighted n
2,459 383,586
Dinner Any vegetables Non-baby food meat Milk and milk products 100 percent fruit juice Any fruit (excluding juice)
42.9% 32.0 29.5 19.1 13.7
Unweighted n Weighted n
2,491 389,063
Snack Any fruit (excluding juice) Milk and milk products Crackers, pretzels, rice cakes 100 percent fruit juice Baby food desserts
42.1% 38.5 34.1 19.5 15.6
Unweighted n Weighted n
2,160 329,421
Month 24
Top five foods or beverages Percent of study
children consuming Breakfast Milk and milk products 61.2% Non-infant cereal (not presweetened)
31.8
Eggs 29.1
100 percent fruit juice 27.5 Any fruit (excluding juice) 23.8 Unweighted n 2,375 Weighted n 428,368 Lunch Non-baby food meat 34.7% 100 percent fruit juice 34.6 Any vegetables 28.1 Milk and milk products 25.3 Any fruit (excluding juice) 24.7 Unweighted n 2,280 Weighted n 410,871 Dinner Non-baby food meat 45.5% Any vegetables 43.6 Milk and milk products 30.1 100 percent fruit juice 24.4 Rice and pasta 16.1 Unweighted n 2,309 Weighted n 415,502 Snack Any fruit (excluding juice) 50.0% Milk and milk products 39.0 Crackers, pretzels, rice cakes 29.1 100 percent fruit juice 20.7 Salty snacks 19.9 Unweighted n 1,999 Weighted n 351,307

WIC Infant and Toddler Feeding Practices Study-2: Second Year Report 4-22
On a given day, 24 month old children are still commonly consuming milk and milk products at every eating occasion, and 100 percent fruit juice is now commonly consumed at every eating occasion. Fruit and eggs are still common at breakfast, but non-infant cereals (not presweetened) become the most commonly consumed breakfast food.65 Lunches include the same foods as at 13 months, although the order has changed. Rice and pasta join non-baby food meats and vegetables as common dinner foods. Snacks still include crackers, pretzels, rice cakes, or fruit, but salty snacks join the top five, and baby food desserts are no longer in the top five. Many of the top five foods are available as a part of the child’s WIC food package at 24 months, but other non-WIC foods, such as salty snacks, have become more common. These top five items are similar to those reported by FITS 2002 for 19-24 month old children, although the children in the FITS 2002 study were also commonly consuming SSBs and cookies, particularly for snacks (Skinner et al., 2004). Overall, WIC ITFPS-2 children settle into a pattern of breakfast, lunch, dinner, and snacks over the first 2 years of life. On a given day for those eating occasions, they are consuming a varied diet that includes many of the foods available through the WIC food package. 4.6 Summary
WIC ITFPS-2 study children are consuming a varied diet as they move into the second year of life, including fruits, vegetables, dairy, and meats and other proteins. As they get older they are, however, also increasing their consumption of energy-dense, nutrient poor foods such as desserts, candy, SSBs, and salty snacks. WIC ITFPS-2 children’s fruit consumption increases sharply between 5 and 7 months of age, and gradually evens off after that. By 24 months, 70 percent of the children are consuming a non-juice fruit on a given day. Consumption of 100 percent fruit juice also rises over time, and by 24 months, 70 percent of the children are consuming 100 percent juice on a given day. Toward the end of the infant year, there is a gradual transition away from baby-food fruits, and by 24 months, very few children (1%) are consuming baby food fruits. Vegetable consumption among WIC ITFPS-2 study children also rises as children get older, with 62 percent consuming a vegetable on a given day at 24 months. As with fruit, baby-food vegetables
65 Non-infant cereals (not presweetened) are defined as breakfast cereal with no more than 21.2g total sugars/100g dry
cereal.

WIC Infant and Toddler Feeding Practices Study-2: Second Year Report 4-23
decline gradually toward the end of the infant year, and by 24 months few children (1%) are consuming them. Cooked vegetables are the most common form of vegetables consumed by 24 months (57%), although some children (14%) are consuming raw vegetables. Although fruit and vegetable consumption increases as the WIC ITFPS-2 children get older, on a given day at 24 months, 30 percent of children are not consuming a non-juice fruit, and 38 percent are not consuming a vegetable. Consumption of dairy products is low during the infant year. Cow’s milk, the most commonly reported dairy product, is consumed by only 9 percent of infants on a given day at 11 months, perhaps due to WIC recommendations to delay introduction of cow’s milk until 1 year. Consumption of cow’s milk, cheese, and yogurt all increase starting at 13 months, and by 24 months 85 percent of children are drinking cow’s milk on a given day, 36 percent are consuming cheese, and 19 percent are consuming yogurt. Consumption of protein foods, including both meats and other non-meat proteins, increases steadily from 7 to 18 months and then stabilizes, with 96 percent of children consuming a meat or another protein on a given day at 24 months. Increases in the consumption of desserts and candy, SSBs, and salty snacks accelerates during the second year of life. By 24 months, slightly more than half (52%) of study children are consuming a dessert or candy on a given day, driven in part by the percentage consuming cookies (20%) and candy (16%). Also at 24 months, 23 percent of the children are consuming an SSB such as fruit drinks, and 24 percent are consuming a salty snack on a given day. These foods and beverages are not offered as part of the WIC food package. Nonetheless, a large number of WIC ITFPS-2 children are consuming them despite the minimal contribution these foods make to nutrient intake. Meal and snack patterns stabilize quickly during the second year of life, and by 24 months, almost all children are eating breakfast (98%), lunch (94%), and dinner (95%). By 24 months, 80 percent of children are also eating at least one snack between meals. At 13 and 24 months, the most commonly consumed foods at each eating occasion represent many of the foods contained in the WIC food package at those ages. Snacks pose an emerging challenge, however, as 16 percent of 13 month olds are eating baby food desserts for snack, and 20 percent of 24 month olds are consuming salty snacks. These consumption patterns follow the same basic trends seen in the FITS 2008 data (Siega-Riz et al., 2010). Although some differences emerge between the studies during the first 2 years, by
WIC Infant and Toddler Feeding Practices Study-2: Second Year Report 4-24
24 months the consumption rates of fruits, vegetables, meats and other proteins, and cow’s milk are similar across the two studies. Some promising differences persist between the two studies after 20 months, notably that fewer WIC ITFPS-2 children than FITS 2008 children are consuming desserts and candy (52% versus 68%), and fewer WIC ITFPS-2 children than FITS 2008 children are consuming SSBs (23% versus 38%). These findings on food consumption and meal patterns demonstrate that WIC ITFPS-2 study children are eating a variety of fruits, vegetables, dairy, and meats and proteins. At meals, many of the top foods consumed are those that are also included in WIC food packages, indicating the important role WIC plays in helping caregivers purchase healthy foods that are commonly consumed by their children.

Energy and Nutrient Intake 5
WIC Infant and Toddler Feeding Practices Study-2: Second Year Report 5-1
5.1 Overview
This chapter focuses on energy and nutrient intake. The timeframe addressed runs from 3 through 24 months, with an emphasis on the latter half of infancy and the second year of life, addressing the patterns and trends in nutrient intake of study children. Examples of questions addressed are:
What is the energy intake of infants and young children?
What is the macronutrient intake of infants and young children?
What is the micronutrient intake of infants and young children?
How do infants’ energy and nutrient intake vary by WIC Infant Food Package?
5.2 Background
When evaluating the dietary intakes of older children and adults, the 2015-2020 Dietary Guidelines for Americans can be used as a point of reference. Evaluating young children’s dietary intake can be challenging, however, because there are no current national dietary guidelines for children from birth to 24 months. The Dietary Guidelines for Americans for pregnant women and children from birth through age 24 months are currently in development, and are expected to be released in 2020.66 Nonetheless, it is possible to evaluate the nutrient intakes of groups of children birth through 24 months using Dietary Reference Intakes (DRIs). DRIs are nutrient standards, developed by the Institute of Medicine of the National Academy of Sciences (Institute of Medicine, 2000), that can be used as a point of comparison to estimate the prevalence of inadequate or excessive intakes.
66 U.S. Department of Agriculture, Center for Nutrition Policy and Promotion. (n.d.). Pregnancy and Birth to 24 Months
Project. Retrieved from https://www.cnpp.usda.gov/birthto24months on October 18, 2017.

WIC Infant and Toddler Feeding Practices Study-2: Second Year Report 5-2
5.2.1 Energy and Nutrient Intake
To examine dietary intake comprehensively, the total energy (as measured in kilocalories), macronutrient, and micronutrient contents of individuals’ diets are typically calculated and, when appropriate, compared to existing standards or references. For total energy, comparisons may be made using the estimated energy requirement (EER). EER is the average estimated amount of energy necessary to promote adequate and appropriate growth among various age groups. The EER for infants (Butte, 2005), and for children (Institute of Medicine, 2005), which is based on both total energy expenditure, and energy deposition during growth, requires an accurate body weight and length for the child at the same time point as the dietary intake. Although the current study did collect data on weight and length at three time points during the study period, measurements were not obtained at each interview. As such, individual-level EERs could not be determined for each study child, and comparisons between median energy intake and EERs were not appropriate for the WIC Infant and Toddler Feeding Practices Study (WIC ITFPS-2) data.67 Comprehensive dietary evaluations will also examine the macronutrient and micronutrient contents of individuals’ diets. Essential macronutrients (i.e., protein, carbohydrate, and fat) are needed in large amounts to provide energy and promote growth, whereas micronutrients (i.e., vitamins and minerals) are needed in smaller quantities but are still essential for various physiological and metabolic processes. The National Academies of Science, Engineering and Medicine (formerly the Institute of Medicine) has established various standards, or Dietary Reference Intakes (DRIs), for the essential nutrients.68 Examples of these standards include Recommended Dietary Allowances (RDAs), Estimated Average Requirements (EARs), adequate intake levels (AIs), and tolerable upper intake levels (ULs). RDAs represent levels of daily intake sufficient to meet the needs of the majority of the population, and are typically used when assessing diets at the individual level. When an RDA cannot be established, EARs may be used as they represent levels of daily intake sufficient to meet the nutrient
67 A similar determination regarding energy intake for children and EER comparisons was made for FITS 2008 (Butte et
al., 2010). 68 Dietary Reference Intakes for calcium, phosphorous, magnesium, vitamin D, and fluoride (1997); Dietary Reference
Intakes for thiamin, riboflavin, niacin, vitamin B6, folate, vitamin B12, pantothenic acid, biotin, and choline (1998); Dietary Reference Intakes for vitamin C, vitamin E, selenium, and carotenoids(2000); Dietary Reference Intakes for vitamin A, vitamin K, arsenic, boron, chromium, copper, iodine, iron, manganese, molybdenum, nickel, silicon, vanadium, and zinc (2001); Dietary Reference Intakes for energy, carbohydrate, fiber, fat, fatty acids, cholesterol, protein, and amino acids (2002/2005); and Dietary Reference Intakes for calcium and vitamin D (2011). Retrieved from http://www.nationalacademies.org/hmd/~/media/Files/Activity%20Files/Nutrition/DRI-Tables/5Summary%20TableTables%2014.pdf?la=en on October 18, 2017.

WIC Infant and Toddler Feeding Practices Study-2: Second Year Report 5-3
requirements of half of all healthy individuals, and are the standard used within each age group to estimate the prevalence of inadequate intakes. EARs can be used as a cut point for most nutrients (i.e., those that are normally distributed); the prevalence of inadequate intakes is estimated as the proportion of the population with intakes below the EAR (Murphy, Guenther, & Kretsch, 2006). In the absence of sufficient data to produce EARs, AIs are estimated. AIs are average nutrient levels believed to meet the nutrient requirements of most or all healthy members of the age group. If the average group intake is at or above the AI, while the prevalence of low intakes cannot be determined, a low prevalence of inadequate intake is assumed (Murphy et al., 2006). Nutrient intake levels may also be compared to UL, which the highest level of daily nutrient intake that is likely to pose no risk of adverse health effects. If a sizeable proportion of a group has intakes above the UL, it may be appropriate to reduce intakes (Murphy et al., 2006). In addition to the DRIs referenced previously, macronutrients can also be expressed as percentages of total daily energy intake. For example, when assessing daily carbohydrate intake, dietary intakes can be expressed in absolute amounts (as measured in grams) or as a percentage of total energy. The latter is then compared with a range known as the Acceptable Macronutrient Distribution Range (AMDR). Like the other DRIs, AMDRs vary between the essential macronutrients, and each AMDR is based on the ideal range necessary to promote health and growth while reducing chronic disease risk. When evaluating nutrient intake of young children, it is important to consider the intake of several micronutrients that are essential for growth and development, including iron, vitamin D, and zinc. Iron deficiency among infants continues to be a worldwide concern, as the iron stores that infants accumulate during gestation begin declining after the first 6 months of life (Baker & Greer, 2010). Inadequate iron intake can adversely affect long-term neurodevelopment and behavior, and may be irreversible (Bruner, Joffe, Duggan, Casella, & Brandt, 1996; Lozoff, Jimenenz, & Smith, 2006). For infants the major food sources of iron are infant formulas, which are typically fortified with iron, and commercial baby foods such as iron-fortified cereals or iron-rich meats (Grimes, Szymlek-Gay, Campbell, & Nicklas, 2015). Risk factors for iron deficiency among infants include the introduction of cow’s milk, which is relatively low in iron, prior to 1 year old, or the failure to introduce iron-rich complementary foods. To combat iron deficiency, all infant formulas provided by WIC are iron-fortified. Additionally, WIC provides iron-fortified cereals to all infants ages 6 to 11 months, and provides iron-rich baby-food meats to infants who continue to be fully breastfed during these months.

WIC Infant and Toddler Feeding Practices Study-2: Second Year Report 5-4
Levels of vitamin D and zinc are also of particular concern for breastfed infants (Butte, Lopez-Alarcon, & Garza, 2002), as breastmilk alone is not a sufficient source of either vitamin D or zinc. Vitamin D can come from sunlight exposure and prenatal stores, but those sources may not be sufficient, particularly among exclusively breastfed infants, so the American Academy of Pediatrics recommends supplementation for infants beginning shortly after birth (Wagner & Greer, 2008). Zinc also has prenatal stores, but is poorly absorbed from breastmilk, and the amount of zinc in breastmilk declines from early infancy onward (Jensen, 1995). 5.3 Sample and Analysis Approach
5.3.1 Sample
The analyses in this chapter utilize data throughout the infant year and up to the 24-month interview, although many of the analyses focus on the period from 7-24 months. Table 5-1 shows the number of respondents to the 7- to 24-month interviews. While the entire sample (core plus supplemental) receives the 7-, 13-, and 24-month interviews, only the core sample receives the 9-, 11-, 15-, and 18-month interviews. Because not everyone in the sample is offered the 9-, 11-, 15-, and 18-month interviews, and some participants do not respond to interview requests, the responses to some interviews are less than the full sample size. In analyses, the responses to each interview are weighted so that findings reflect the WIC population as described in Chapter 1. Table 5-1 shows the number of respondents to the 7- to 24-month interviews. Table 5-1. Number of respondents by interview month
Sample structure 7-Month interview
9-Month interview
11-Month interview
13-Month interview
15-Month interview
18-Month interview
24-Month interview
Core prenatal sample 2,194 2,140 2,044 1,956 1,814 1,759 1,702 Core postnatal sample 320 311 278 283 253 233 235 Supplemental
prenatal sample 500 -- -- 462 -- -- 425
Supplemental postnatal sample
120 -- -- 106 -- -- 99
Total 3,134 2,451 2,322 2,807 2,067 1,992 2,461
Note: Supplemental sample members were interviewed only at 7- , 13-, and 24-months.

WIC Infant and Toddler Feeding Practices Study-2: Second Year Report 5-5
5.3.2 Analysis
The analyses in this chapter examine energy and nutrient intake through age 24 months. All energy and nutrient intakes for the group of WIC ITFPS-2 children are reported as median intakes, rather than as mean intakes, to reduce the influence of extreme values in the summary statistics. Analyses presented in Appendix C4 also explore whether socio-demographic characteristics are associated with these intakes. Socio-demographic characteristics are typically measured at the time of the first study interview (prenatal, 1-, or 3-month interview). For characteristics that change over time, such as food security or income poverty, socio-demographic characteristics are updated to values reported at the 13-month interview if they are being analyzed in relation to 15- to 24-month outcomes. When available, data are presented from other relevant studies alongside current findings to examine differences and similarities between studies. The additional relevant studies used as points of comparison in this chapter include the Gerber/Nestle Feeding Infants and Toddlers Studies (FITS) conducted in 2002 and 2008 (Briefel et al., 2010; Ponza, Devaney, Ziegler, Reidy, & Squatrito, 2004; Ziegler, Briefel, Clusen, & Devaney, 2006), which are both well-known national studies of infant and toddler feeding practices including both WIC and non-WIC children. The FITS studies are cross-sectional studies. FITS 2002 includes children from ages 4 months to 2 years, and FITS 2008 includes children from birth to age 4 years.69 Both studies collect 24-hour dietary recall data,70 making them a good source of comparison for energy and nutrient intake patterns. When data are available from both studies, WIC ITFPS-2 is compared to FITS 2008 because its data collection is closer in time to WIC ITFPS-2. Differences between these studies and WIC ITFPS-2 in methodology, as well as limits in the availability of data from other studies on which to conduct analyses, prevented testing direct statistical comparisons of the studies. Consequently, comparisons focus on the magnitude and patterns of differences between the studies, rather than statistical significance of the differences. All post-birth interviews through 24-months include a 24-hour dietary recall using the U.S. Department of Agriculture’s (USDA) Automated Multi-Pass Method (AMPM) (Raper, Perloff,
69 Because FITS 2002 and 2008 are cross-sectional studies covering a range of ages, their findings are published in bands
of ages. Comparisons between WIC ITFPS-2 and FITS data therefore match the WIC ITFPS-2 month to the closest relevant FITS age band.
70 The methodology for coding dietary intakes differs slightly between FITS 2002 and 2008 and WIC ITFPS-2 such that some of the changes observed when comparing food groups or nutrient intakes over time may be due in part to the codes applied to the various foods and the food grouping scheme used to classify foods.

WIC Infant and Toddler Feeding Practices Study-2: Second Year Report 5-6
Ingwersen, Steinfeldt, & Anand, 2004), as described in Chapter 1. When conducting the 24-hour dietary recall, an interviewer guides the caregiver through the prior day’s intake, and asks the caregiver to report all foods, beverages, and dietary supplements the child consumed for each eating occasion during the 24-hour period, including breastfeeding occasions. The interviewer records all information, and trained coders then code and analyze the data for nutrient content. Intakes after 11 months of age are adjusted statistically for day-to-day variation. Within 10 days of the initial dietary intake interview, the study collects a second, replicate intake on a randomly selected 10 percent subsample of children at 13, 15, 18, 24, 36, 48, and 60 months to use in estimating “usual” intake of energy and nutrients for all study children.71 Between 1 and 11 months, a single dietary recall is collected per individual for usual intake.72 Analyses in this chapter use energy and nutrient content of reported foods, beverages, and dietary supplements, and eating occasion, to describe usual intake. When breastmilk is fed directly from the breast, the caregiver cannot report exact quantities consumed during the 24-hour dietary recall. For such circumstances WIC ITFPS-2 follows the same procedures as the FITS 2008 study and other research (Butte et al., 2010; Heinig, Nommsen, Peerson, Lonnerdal, & Dewey et al., 1993), using the child’s age and breastfeeding exclusivity status to estimate intake quantities. For fully breastfed infants (i.e., those who did not report consuming infant formula or any other milks) between birth and 5.9 months, a total breastmilk intake of 780 ml/day is assumed. For fully breastfed infants between 6 and 11.9 months, a total breastmilk intake of 600 ml/day is assumed. For partially breastfed infants between birth and 5.9 months, breastmilk intake is imputed by summing the amounts of infant formula and other milks reported, and subtracting that total amount from 780 ml/day (e.g., if a partially breastfed, 3 month old infant reported consuming 240 ml of infant formula and no other milks, then the infant was coded as also consuming 540 ml of breastmilk). For partially breastfed infants between 6 and 11.9 months, breastmilk intake is imputed by summing the amounts of infant formula and other milks reported and subtracting that total amount from 600 ml/day. For partially breastfed infants whose reported intake is more than 780 ml or 600 ml of formula and/or other milks, a total breastmilk intake of 78 ml or 60 ml per day is assumed, respectively. In the study sample, only 1.2 percent of young infants (birth to 5.9 months) and 0.7 percent of older infants (6 to 11.9 months) were partially breastfed and reported consuming more than 780 ml/day or 600 ml/day, respectively, of formula and other milks.
71 See Appendix B4 for details of the computation of usual intake using the National Cancer Institute (NCI) Method. 72 See Appendix B4, section B4.2, for a description of the rationale for using a single intake during the infant year.
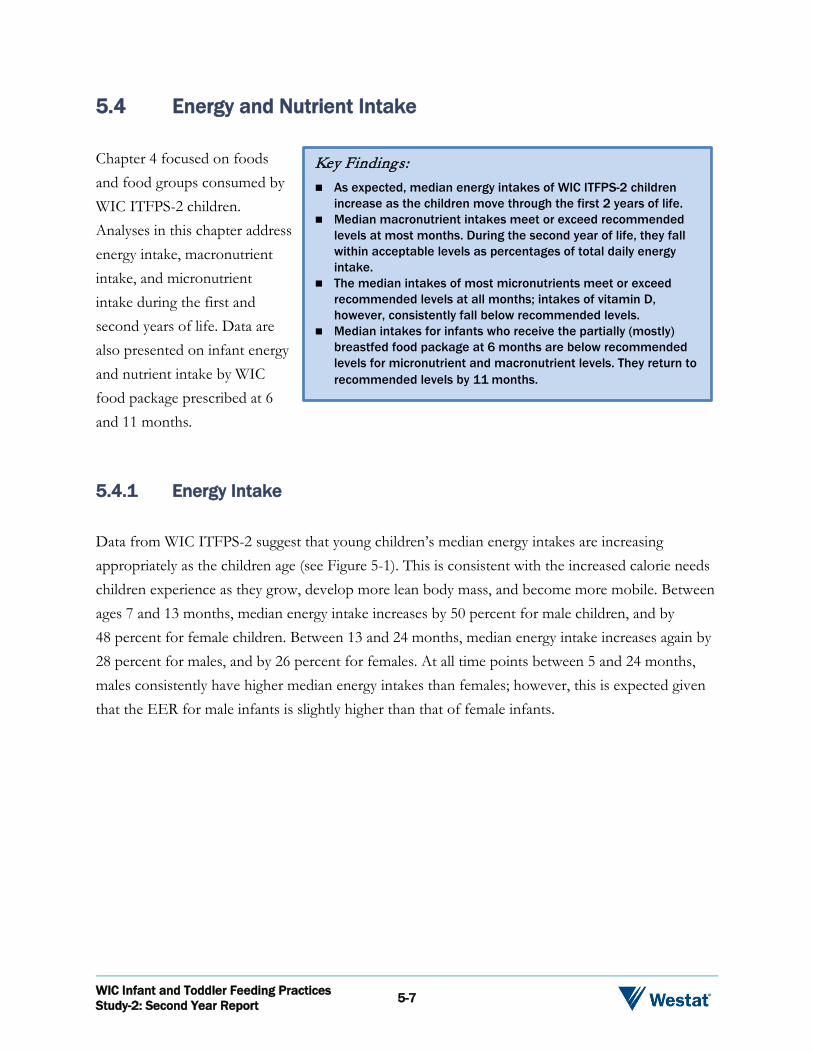
WIC Infant and Toddler Feeding Practices Study-2: Second Year Report 5-7
5.4 Energy and Nutrient Intake
Chapter 4 focused on foods and food groups consumed by WIC ITFPS-2 children. Analyses in this chapter address energy intake, macronutrient intake, and micronutrient intake during the first and second years of life. Data are also presented on infant energy and nutrient intake by WIC food package prescribed at 6 and 11 months.
Key Findings: As expected, median energy intakes of WIC ITFPS-2 children
increase as the children move through the first 2 years of life. Median macronutrient intakes meet or exceed recommended
levels at most months. During the second year of life, they fall within acceptable levels as percentages of total daily energy intake.
The median intakes of most micronutrients meet or exceed recommended levels at all months; intakes of vitamin D, however, consistently fall below recommended levels.
Median intakes for infants who receive the partially (mostly) breastfed food package at 6 months are below recommended levels for micronutrient and macronutrient levels. They return to recommended levels by 11 months.
5.4.1 Energy Intake
Data from WIC ITFPS-2 suggest that young children’s median energy intakes are increasing appropriately as the children age (see Figure 5-1). This is consistent with the increased calorie needs children experience as they grow, develop more lean body mass, and become more mobile. Between ages 7 and 13 months, median energy intake increases by 50 percent for male children, and by 48 percent for female children. Between 13 and 24 months, median energy intake increases again by 28 percent for males, and by 26 percent for females. At all time points between 5 and 24 months, males consistently have higher median energy intakes than females; however, this is expected given that the EER for male infants is slightly higher than that of female infants.

WIC Infant and Toddler Feeding Practices Study-2: Second Year Report 5-8
Figure 5-1. Study children’s median energy intake by gender (months 5-24)
627689
788886
10341103
1195
1324
594654
730820
9701046
11401227
0
200
400
600
800
1000
1200
1400
5 7 9 11 13 15 18 24
kcal
/day
Age (in months)
Male Female
Note: See Appendix C4, Table C4-3, for more details.
Another way to examine energy intake is to look at the median percentage of daily energy intake contributed by each eating occasion (see Figure 5-2).73 From 7 months to 11 months, breakfast accounts for a slightly higher median percentage of energy in the infants’ diets than does lunch or dinner. Snacks account for a substantial median percentage of daily energy relative to that contributed by lunch or dinner from 7 months to 9 months, but by 15 months, snacks contribute the lowest median percentage of dietary energy. The median percentage of energy from lunch and dinner continue to increase through 24 months, becoming slightly higher than breakfast.
73 The percentage of total energy by eating occasion = (sum of energy for foods reported at the eating occasion)/(total
energy for the day)*100. No specific recommendations about calories per meal exist for children under age 2 years. The median percentage of energy intake for each eating occasion is the point at which half the WIC ITFPS-2 children fall at a lower percentage contribution of that eating occasion to total daily energy, and half fall at a higher percentage. Because of the way it is calculated, the sum of the median percentages is not expected to sum to 100 percent.

WIC Infant and Toddler Feeding Practices Study-2: Second Year Report 5-9
Figure 5-2. Median percentage of total energy intake contributed by each eating occasion (months 7-24)
10
12
14
16
18
20
22
24
26
28
30
7 9 11 13 15 18 24
Med
ian
perc
enta
ge o
f tot
al
daily
ene
rgy
inta
ke
Age (in months)
Breakfast Lunch Dinner Snack
Note: See Table C4-6, Appendix C4, for more information. Because of the way it is calculated, the sum of the median percentages is not
expected to sum to 100 percent.
Overall, WIC ITFPS-2 children are consuming more energy as they age, a trend which is expected as these young children grow. Given the constraints of the current study’s data, it was not possible to make direct comparisons between median energy intakes and EERs for study children. 5.4.2 Macronutrient Intake
WIC ITFPS-2 examines median macronutrient intakes of dietary fat, carbohydrate, and protein (see Appendix C4, Table C4-2 for more details), using the AIs/RDAs, EARs, and AMDRs as points of comparison when available. For dietary fat, median intakes among 5 to 11 month olds are similar to the AIs. For carbohydrate, median intakes of 5 to 11 month olds meet AIs; in month 7, however, median intake falls below the AI by nearly 10 grams. Between 13 and 24 months EARs are available for carbohydrate, thus the cut point method is used to estimate prevalence of inadequate intakes. The cut point method for estimating the prevalence of inadequate intakes in a group (Murphy et al., 2006) involves examining the distribution of intakes to determine the proportion that falls below the EAR. At 13 months, 14.7 percent of WIC ITFPS-2 children fall below the EAR for carbohydrate. As the children age, the proportion of intakes below

WIC Infant and Toddler Feeding Practices Study-2: Second Year Report 5-10
the EAR continues to decline, with 8.9 percent below the EAR at 15 months, 5.0 percent below at 18 months, and only 2.4 below the EAR at 24 months. For protein, prevalence of inadequate intakes could not be measured; however, median protein intakes exceeded the RDA74 at all interview months, with the greatest overage occurring at 13 months, and protein intake remaining high through 24 months (see Tables 5-2a-b). Table 5-2a. Median macronutrient intake of study children compared to recommendations
(months 5-11)
Macronutrients Median intake
5 month 7 month 9 month 11 month Intake Fat (g/d) 35.2 30.0 31.6 34.1 AI 31 30 30 30 Carbohydrate (g/d) 67.5 85.5 99.9 114.5 AI 60 95 95 95 Protein (g/d) 13.0 14.6 17.0 21.0 AI or RDA 9.1 11a 11a 11a Intake as a median percentage of energy intake Fat 47.3% 41.8% 38.3% 36.8% AMDRb ND ND ND ND Carbohydrate 43.6 49.9 53.3 53.7 AMDRb ND ND ND ND Protein 8.3 8.5 8.8 9.7 AMDRb ND ND ND ND Unweighted n 2,596 3,081 2,412 2,285 Weighted n 438,284 435,294 435,705 435,281
Note: See Appendix C4, Table C4-2, for more details.
a Recommended dietary allowance (RDA)
b Acceptable Macronutrient Distribution Range, measured as calories from macronutrient as a percent of total energy
ND indicates not determined for this age.
74 Recommended dietary allowance is the intake level sufficient to meet the nutrient requirements of nearly all healthy
individuals in a group. Comparisons to the RDA are not reliable indicators of inadequate intakes.
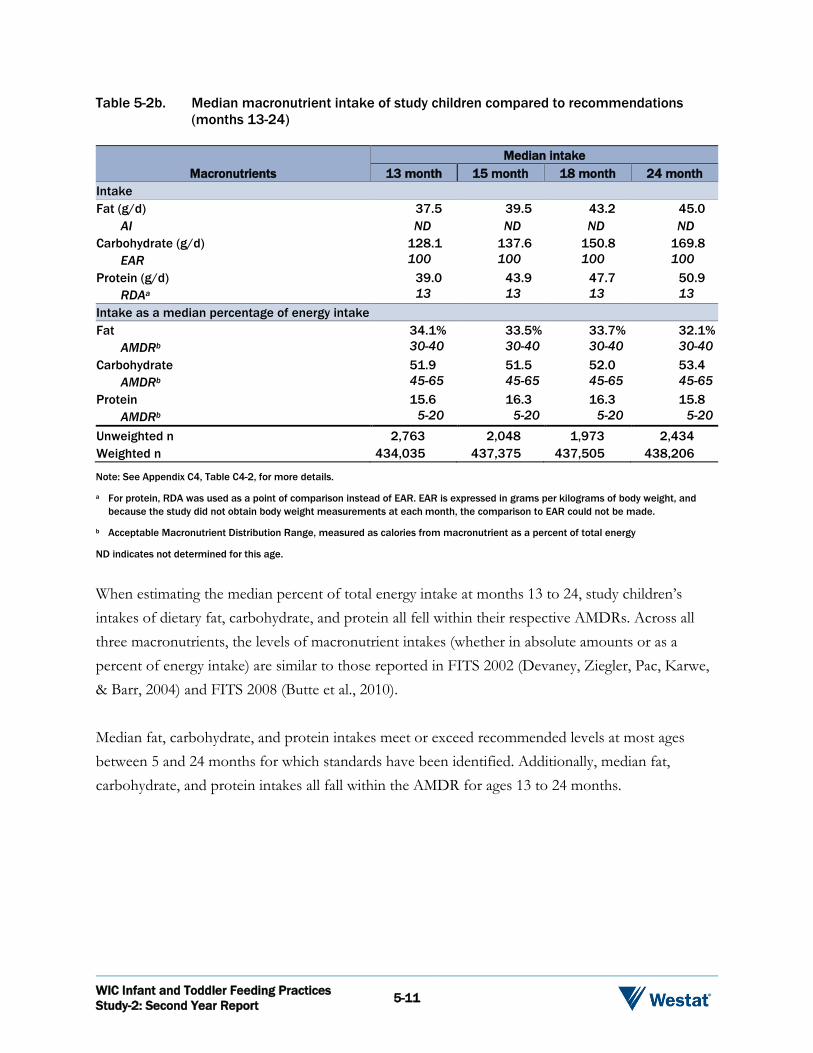
WIC Infant and Toddler Feeding Practices Study-2: Second Year Report 5-11
Table 5-2b. Median macronutrient intake of study children compared to recommendations (months 13-24)
Macronutrients Median intake
13 month 15 month 18 month 24 month Intake Fat (g/d) 37.5 39.5 43.2 45.0 AI ND ND ND ND Carbohydrate (g/d) 128.1 137.6 150.8 169.8 EAR 100 100 100 100 Protein (g/d) 39.0 43.9 47.7 50.9 RDAa 13 13 13 13 Intake as a median percentage of energy intake Fat 34.1% 33.5% 33.7% 32.1% AMDRb 30-40 30-40 30-40 30-40 Carbohydrate 51.9 51.5 52.0 53.4 AMDRb 45-65 45-65 45-65 45-65 Protein 15.6 16.3 16.3 15.8 AMDRb 5-20 5-20 5-20 5-20 Unweighted n 2,763 2,048 1,973 2,434 Weighted n 434,035 437,375 437,505 438,206
Note: See Appendix C4, Table C4-2, for more details.
a For protein, RDA was used as a point of comparison instead of EAR. EAR is expressed in grams per kilograms of body weight, and because the study did not obtain body weight measurements at each month, the comparison to EAR could not be made.
b Acceptable Macronutrient Distribution Range, measured as calories from macronutrient as a percent of total energy
ND indicates not determined for this age.
When estimating the median percent of total energy intake at months 13 to 24, study children’s intakes of dietary fat, carbohydrate, and protein all fell within their respective AMDRs. Across all three macronutrients, the levels of macronutrient intakes (whether in absolute amounts or as a percent of energy intake) are similar to those reported in FITS 2002 (Devaney, Ziegler, Pac, Karwe, & Barr, 2004) and FITS 2008 (Butte et al., 2010). Median fat, carbohydrate, and protein intakes meet or exceed recommended levels at most ages between 5 and 24 months for which standards have been identified. Additionally, median fat, carbohydrate, and protein intakes all fall within the AMDR for ages 13 to 24 months.
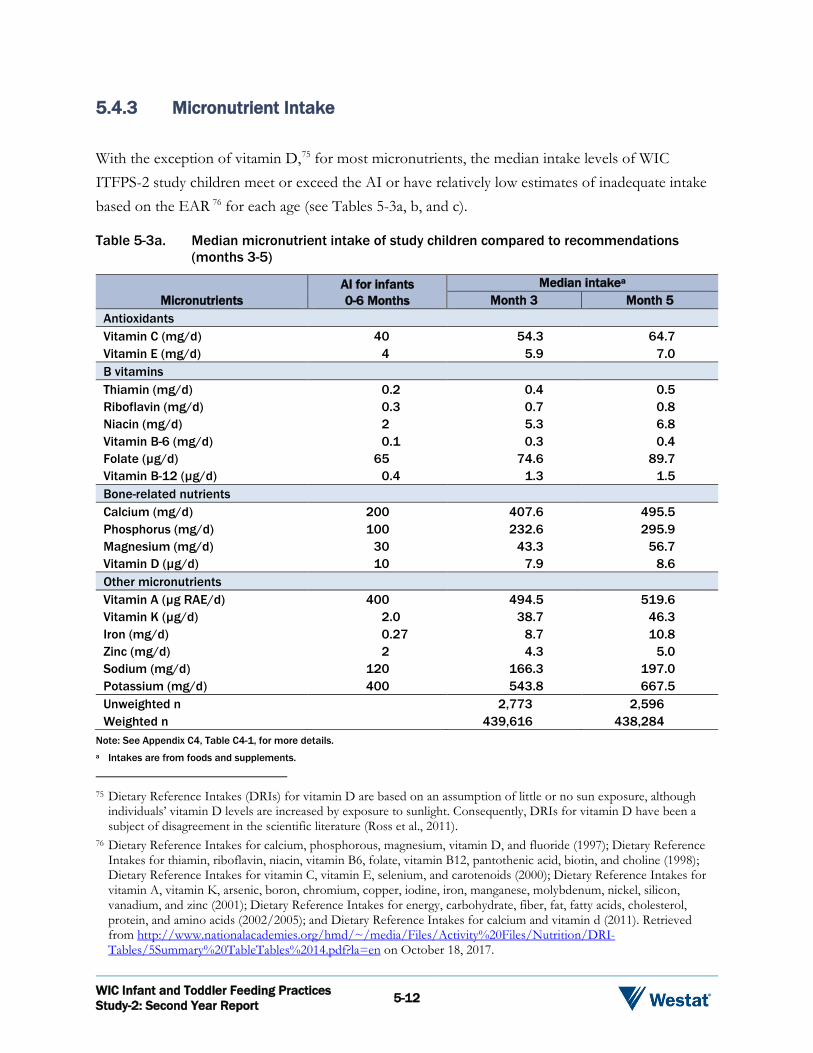
WIC Infant and Toddler Feeding Practices Study-2: Second Year Report 5-12
5.4.3 Micronutrient Intake
With the exception of vitamin D,75 for most micronutrients, the median intake levels of WIC ITFPS-2 study children meet or exceed the AI or have relatively low estimates of inadequate intake based on the EAR 76 for each age (see Tables 5-3a, b, and c). Table 5-3a. Median micronutrient intake of study children compared to recommendations
(months 3-5)
Micronutrients AI for infants 0-6 Months
Median intakea Month 3 Month 5
Antioxidants Vitamin C (mg/d) 40 54.3 64.7 Vitamin E (mg/d) 4 5.9 7.0 B vitamins Thiamin (mg/d) 0.2 0.4 0.5 Riboflavin (mg/d) 0.3 0.7 0.8 Niacin (mg/d) 2 5.3 6.8 Vitamin B-6 (mg/d) 0.1 0.3 0.4 Folate (µg/d) 65 74.6 89.7 Vitamin B-12 (µg/d) 0.4 1.3 1.5 Bone-related nutrients Calcium (mg/d) 200 407.6 495.5 Phosphorus (mg/d) 100 232.6 295.9 Magnesium (mg/d) 30 43.3 56.7 Vitamin D (µg/d) 10 7.9 8.6 Other micronutrients Vitamin A (µg RAE/d) 400 494.5 519.6 Vitamin K (µg/d) 2.0 38.7 46.3 Iron (mg/d) 0.27 8.7 10.8 Zinc (mg/d) 2 4.3 5.0 Sodium (mg/d) 120 166.3 197.0 Potassium (mg/d) 400 543.8 667.5 Unweighted n 2,773 2,596 Weighted n 439,616 438,284
Note: See Appendix C4, Table C4-1, for more details. a Intakes are from foods and supplements.
75 Dietary Reference Intakes (DRIs) for vitamin D are based on an assumption of little or no sun exposure, although
individuals’ vitamin D levels are increased by exposure to sunlight. Consequently, DRIs for vitamin D have been a subject of disagreement in the scientific literature (Ross et al., 2011).
76 Dietary Reference Intakes for calcium, phosphorous, magnesium, vitamin D, and fluoride (1997); Dietary Reference Intakes for thiamin, riboflavin, niacin, vitamin B6, folate, vitamin B12, pantothenic acid, biotin, and choline (1998); Dietary Reference Intakes for vitamin C, vitamin E, selenium, and carotenoids (2000); Dietary Reference Intakes for vitamin A, vitamin K, arsenic, boron, chromium, copper, iodine, iron, manganese, molybdenum, nickel, silicon, vanadium, and zinc (2001); Dietary Reference Intakes for energy, carbohydrate, fiber, fat, fatty acids, cholesterol, protein, and amino acids (2002/2005); and Dietary Reference Intakes for calcium and vitamin d (2011). Retrieved from http://www.nationalacademies.org/hmd/~/media/Files/Activity%20Files/Nutrition/DRI-Tables/5Summary%20TableTables%2014.pdf?la=en on October 18, 2017.

WIC Infant and Toddler Feeding Practices Study-2: Second Year Report 5-13
At 3 and 5 months, median intakes of most micronutrients exceed the AIs. Vitamin D is the exception, with levels consistently below the AI. While most micronutrients do not have an established UL for this age period, zinc does have a UL of 4mg/d, and the median zinc intake at 3 and 5 months exceeds this UL. This median intake pattern for micronutrients is similar to that from FITS 2008 (Butte et al., 2010).77 Table 5-3b. Median micronutrient intake of study children compared to recommendations
(months 7-11)
Micronutrients
AI/EAR for infants
6-12 months Median intake
Month 7 Month 9 Month 11 Antioxidants Vitamin C (mg/d) 50a 82.9 95.6 100.6 Vitamin E (mg/d) 5a 7.2 7.5 7.4 B vitamins Thiamin (mg/d) 0.3a 0.7 0.8 0.9 Riboflavin (mg/d) 0.4a 1.0 1.1 1.3 Niacin (mg/d) 4a 8.7 10.0 11.6 Vitamin B-6 (mg/d) 0.3a 0.5 0.6 0.8 Folate (µg/d) 80a 102.9 115.8 137.1 Vitamin B-12 (µg/d) 0.5a 1.4 1.5 1.6 Bone-related nutrients Calcium (mg/d) 260a 524.8 567.2 599.6 Phosphorus (mg/d) 275a 344.0 403.5 479.6 Magnesium (mg/d) 75a 80.6 96.1 111.6 Vitamin D (µg/d) 10a 7.8 7.5 7.4 Other micronutrients Vitamin A (µg RAE/d) 500a 595.3 640.7 623.9 Vitamin K (µg/d) 2.5a 50.6 53.1 54.3 Iron (mg/d) 6.9b 12.9 14.4 14.6 Zinc (mg/d) 2.5b 5.2 5.7 6.0 Sodium (mg/d) 370a 226.1 278.7 477.1 Potassium (mg/d) 700a 877.2 1031.0 1179.0 Unweighted n 3,081 2,412 2,285 Weighted n 435,294 435,705 435,281
Note: See Appendix C4, Table C4-1, for more details.
a Adequate Intake (AI)
b Estimated Average Requirement (EAR)
77 Butte et al. (2010) report Vitamin D levels above the DRI (AI) for this age period, but the AI has changed since FITS
2008 data were reported, and median intake levels for FITS are similar to those for WIC ITFPS-2.

WIC Infant and Toddler Feeding Practices Study-2: Second Year Report 5-14
From 7 to 11 months, median levels of most micronutrients exceed the AI or EAR for those ages (see Table 5-3b). Vitamin D is again an exception, with the median level falling below the AI at every month. Sodium falls below the AI at 7 and 9 months, but rises to a median level that exceeds the AI at 11 months. These findings relative to AI are similar to those from FITS 2008 (Butte et al., 2010). For iron and zinc, the two nutrients with established EARs during this age period, the median intakes exceed the EARs. Estimates of the prevalence of inadequate intakes for iron78 decrease from 20 percent at month 7, to 16.7 percent at month 9, and 14.7 percent at month 11. Estimates of the prevalence of inadequate intakes for zinc also decrease from 17.4 percent at month 7, to 11.4 at month 9, and 6.9 percent at month 11. In some cases, median intakes also exceed ULs. At both 9 and 11 months, the median intake of vitamin A slightly exceeds the UL of 600 µg/d, and the median intake of zinc slightly exceeds the UL of 5 mg/d. Median zinc intake in FITS 2008 also exceeds the UL; vitamin A in their sample does not exceed the UL. At 13, 15, 18, and 24 months, median intakes of several micronutrients do not meet recommendations. Median intakes of vitamin D are steady, but still substantially below the EAR (see Table 5-3c). Estimates of the prevalence of inadequate intakes for vitamin D are all above 75 percent (see Table 5-4). Vitamin E also falls below the EAR at each month, with estimates of inadequate intakes between 55 and 72 percent at months 13, 18, and 24, and 77 percent at month 15 (see Tables 5-3c and 5-4). All other median levels of micronutrients are above the EAR, and have estimates of the prevalence of inadequate intake below 5 percent. FITS 2008 toddlers (ages 12-23 months) show similar levels of median intake of micronutrients (Butte et al., 2010), including for vitamins D and E. Throughout the first 2 years of life, iron intake among WIC ITFPS-2 children remains relatively high. This is in contrast to other studies that concluded that iron deficiency becomes a problem after 6 months of age (Baker & Greer, 2010; Grimes et al., 2015). At the other end of the spectrum, median intakes of several micronutrients are above the UL. At all four time points in the second year of life, median niacin intake exceeds the UL of 10 mg/d,79 and
78 The cut-point method cannot be applied to iron intake because the distribution of iron requirements is skewed, and
does not meet the statistical assumptions for that method (see Murphy et al., 2006). Estimates of prevalence of inadequate iron intake at months 9 and older use the full probability method rather than the cut-point method.
79 Fortified bread is a major source of niacin. Niacin-rich foods that are not fortified include fish, chicken, liver, peanuts, beef, mushrooms, peas, seeds, and avocado.

WIC Infant and Toddler Feeding Practices Study-2: Second Year Report 5-15
median magnesium is also above the UL of 65 mg/d. Additionally, median sodium intake gradually increases throughout the second year of life, and by 18 months, median intake exceeds the UL of 1500 mg/d. Table 5-3c. Median micronutrient intake of study children compared to recommendations
(months 13-24)
Micronutrients
AI/EAR for children
1-3 years
Median intake
Month 13 Month 15 Month 18 Month 24 Antioxidants Vitamin C (mg/d) 13b 78.7 72.1 71.8 80.6 Vitamin E (mg/d) 5b 4.1 3.7 4.0 4.8 B vitamins Thiamin (mg/d) 0.4b 1.0 1.1 1.1 1.2 Riboflavin (mg/d) 0.4b 1.7 1.7 1.8 1.8 Niacin (mg/d) 5b 12.4 12.8 14.2 15.2 Vitamin B-6 (mg/d) 0.4b 1.1 1.2 1.4 1.4 Folate (µg/d) 120b 192.3 219.1 257.4 290.6 Vitamin B-12 (µg/d) 0.7b 3.5 3.9 4.3 4.4 Bone-related nutrients Calcium (mg/d) 500b 901.6 906.7 915.5 944.3 Phosphorus (mg/d) 380b 849.1 909.7 953.3 1011.0 Magnesium (mg/d) 65b 154.2 163.0 171.1 185.8 Vitamin D (µg/d) 10b 8.2 8.1 8.0 8.1 Other micronutrients Vitamin A (µg RAE/d) 210b 616.3 568.9 583.4 591.1 Vitamin K (µg/d) 30a 35.2 30.5 32.5 37.2 Iron (mg/d) 3.0b 11.3 9.8 10.6 11.3 Zinc (mg/d) 2.5b 6.5 6.7 7.2 7.7 Sodium (mg/d) 1000a 1209 1459 1702 1915 Potassium (mg/d) 3000a 1657 1751 1826 1950 Unweighted n 2,763 2,048 1,973 2,434 Weighted n 434,035 437,375 437,505 438,206
Note: See Appendix C4, Table C4-1, for more details.
a Adequate Intake (AI)
b Estimated Average Requirement (EAR)

WIC Infant and Toddler Feeding Practices Study-2: Second Year Report 5-16
Table 5-4. Estimated prevalence of inadequate intake levelsa of micronutrients among study children (months 13-24)
Micronutrients
EAR for children
1-3 years
Percentage of study children with inadequate intakes
Month 13 Month 15 Month 18 Month 24 Antioxidants Vitamin C (mg/d) 13 0.0% 0.4% 0.0% 0.0% Vitamin E (mg/d) 5 66.6 77.4 71.8 55.0 B vitamins Thiamin (mg/d) 0.4 0.2 0.2 0.2 0.1 Riboflavin (mg/d) 0.4 0.1 0.1 0.0 0.0 Niacin (mg/d) 5 0.6 1.4 0.2 0.3 Vitamin B-6 (mg/d) 0.4 0.2 0.3 0.0 0.1 Folate (µg/d) 120 2.6 3.0 0.7 0.9 Vitamin B-12 (µg/d) 0.7 0.1 .3 0.0 0.9 Bone-related nutrients Calcium (mg/d) 500 3.6 4.9 2.8 0.9 Phosphorus (mg/d) 380 1.4 0.8 0.6 0.1 Magnesium (mg/d) 65 0.4 0.3 0.3 0.0 Vitamin D (µg/d) 10 75.6 76.3 78.8 77.6 Other micronutrients Vitamin A (µg RAE/d) 210 0.2 0.3 0.5 0.5 Iron (mg/d) 3.0 1.5 2.9 0.8 0.3 Zinc (mg/d) 2.5 0.2 0.0 0.4 0.2 Unweighted n 2,763 2,048 1,973 2,434 Weighted n 434,035 437,375 437,505 438,206
a Prevalence of inadequate intakes is estimated as the percentage of the group falling below the EAR, thus only micronutrients with EARs between 13-24 months are included in the table. For iron, which is not normally distributed in the population, the full probability method for determining average risk of inadequate intake was used.
Overall, from 3 to 24 months of age, most median micronutrient intakes exceed the AIs, or have low prevalence of inadequate intakes based on the EARs. However, median vitamin D intake falls consistently below the AI during the first year of life and shows high prevalence of inadequate intakes (peaking at 79% at 18 months) based on the EAR in the second year. Additionally, median vitamin E intake shows high prevalence of inadequate intakes in the second year of life. 5.4.4 Energy and Nutrient Intake by WIC Infant Food Package
WIC food packages are designed to assist in meeting the nutritional needs of infants and young children. Starting at 6 months, infants who are fully formula fed receive infant formula, iron-fortified infant cereal, and baby food fruits and vegetables. Infants who are partially (mostly) breastfed, but also fed some formula, receive infant formula (with a smaller maximum allowance than infants who

WIC Infant and Toddler Feeding Practices Study-2: Second Year Report 5-17
are fully formula fed because they also consume breastmilk), iron-fortified infant cereal, and baby food fruits and vegetables. Infants who are fully breastfed, but not formula fed, do not receive infant formula from WIC. Starting at 6 months, they receive iron-fortified infant cereal, larger quantities of baby food fruits and vegetables than infants who are receiving formula, and baby meats. Table 5-5 summarizes the maximum monthly allowances in infant food packages during the second half of the infant year. WIC ITFPS-2 collects information on food packages prescribed to study infants who are receiving WIC at three time points: initial post-birth certification, 6-month mid-certification, and 11 months.80 The food package prescribed at 6 months is a reasonable, if not exact, timing match for infant intake at 7 months,81 and the food package prescribed at 11 months is a reasonable timing match for infant intake at 11 months.82 Consequently, analyses explore infant energy and nutrient intake at 7 months by 6-month food package, and infant energy and nutrient intake at 11 months by 11-month food package. Table 5-5. WIC food package maximum monthly allowances for infants ages 6-11 monthsa
Foods
Infant food packages (6-11 months)
Fully formula fed Partially (mostly)
breastfed Fully breastfed Infant formula (reconstituted
liquid concentrate)b Up to 630 ounces Up to 315 ounces None
Infant cereal 24 ounces 24 ounces 24 ounces Baby fruits and vegetables 128 ounces 128 ounces 256 ounces Baby food meats None None 77.5 ounces
a For more information: See https://www.gpo.gov/fdsys/pkg/FR-2014-03-04/pdf/2014-04105.pdf (page 12292), retrieved on October 18, 2017.
b This is the maximum monthly allowance (MMA) of formula that can be issued. Actual amount of formula issued to fully formula fed or partially breastfed infants is tailored to the individual infant’s needs, as determined through an assessment by WIC staff. Amount is measured in fluid ounces of reconstituted liquid concentrate.
Energy Intake
At the time of the 7-month interview, median energy intake for both male and female infants receiving the partially breastfed food package is lower in magnitude than for infants receiving other food packages (see Figure 5-3). The median energy intake of male infants receiving the partially
80 Standard food package content for children 1 year and older does not differ by feeding practice. Because it is expected
to be the same for most WIC ITFPS-2 children, food package data are not collected after 11 months. 81 7 month interviews are conducted between 6.5-7.5 months of age. 82 11 month interviews are conducted between 10.5-11.5 months of age.

WIC Infant and Toddler Feeding Practices Study-2: Second Year Report 5-18
(mostly) breastfed food package is 24 percent lower than the median energy intake of male infants receiving the fully breastfed food package (171 kcal, or the equivalent of about 8 ounces of breastmilk); and, 16 percent lower than the median energy intake of male infants receiving the fully formula fed food package (102 kcal, or the equivalent of about 5 ounces of infant formula). Median energy intake of female infants receiving the partially (mostly) breastfed food package is 15 percent lower than the median intake of female infants receiving the fully breastfed food package (98 kcal, or the equivalent of about 4.5 ounces of breastmilk), and 12 percent lower than female infants receiving the fully formula fed package (77 kcal, or the equivalent of about 4 ounces of infant formula).83 Figure 5-3. Study children’s median energy intake at 7 months, by 6-month food package and
gender
703649
532 551634 628
0100200300400500600700800900
1000
7 Months, Males 7 Months, Females
kcal
Fully breastfed package Partially (mostly) breastfed package Fully formula fed package
At 11 months, infants receiving the partially (mostly) breastfed package still have lower median energy intakes than those receiving the fully breastfed or fully formula fed packages (see Figure 5-4), but in most cases the differences are smaller in magnitude.
83 According to the USDA Food and Nutrient Database for Dietary Studies version 5.0 (Ahuja et al., 2012), breastmilk
contains 21.5 kcal/fluid ounce, and infant formula (type not specified) contains 20.13 kcal/fluid ounce.

WIC Infant and Toddler Feeding Practices Study-2: Second Year Report 5-19
Figure 5-4. Study children’s median energy intake at 11 months, by 11-month food package and gender
909854824
749
919
752
0100200300400500600700800900
1000
11 Months, Males 11 Months, Females
kcal
Fully breastfed package Partially (mostly) breastfed package Fully formula fed package
Macronutrient Intake
At 7 months, median fat intake is at or below the AI for all food package groups. Median carbohydrate intake is consistently somewhat lower than the AI, particularly for the infants receiving the partially (mostly) breastfed food package. Median protein intake, compared to the RDA, is somewhat low for the partially (mostly) breastfed group at 7 months. All median macronutrient levels that fall below the AI or RDA at 7 months rebound by 11 months, and at that time the median macronutrient intakes for all food package groups exceed recommendations (see Table 5-6).
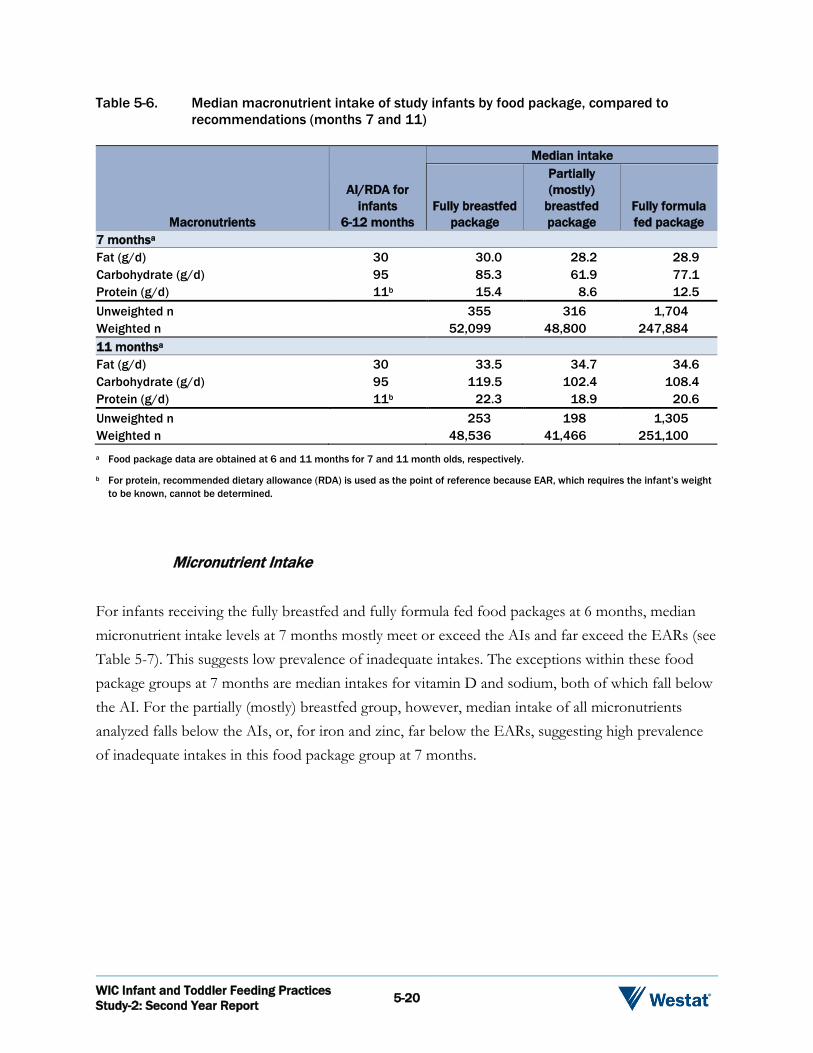
WIC Infant and Toddler Feeding Practices Study-2: Second Year Report 5-20
Table 5-6. Median macronutrient intake of study infants by food package, compared to recommendations (months 7 and 11)
Macronutrients
AI/RDA for infants
6-12 months
Median intake
Fully breastfed package
Partially (mostly)
breastfed package
Fully formula fed package
7 monthsa Fat (g/d) 30 30.0 28.2 28.9 Carbohydrate (g/d) 95 85.3 61.9 77.1 Protein (g/d) 11b 15.4 8.6 12.5 Unweighted n 355 316 1,704 Weighted n 52,099 48,800 247,884 11 monthsa Fat (g/d) 30 33.5 34.7 34.6 Carbohydrate (g/d) 95 119.5 102.4 108.4 Protein (g/d) 11b 22.3 18.9 20.6 Unweighted n 253 198 1,305 Weighted n 48,536 41,466 251,100 a Food package data are obtained at 6 and 11 months for 7 and 11 month olds, respectively.
b For protein, recommended dietary allowance (RDA) is used as the point of reference because EAR, which requires the infant’s weight to be known, cannot be determined.
Micronutrient Intake
For infants receiving the fully breastfed and fully formula fed food packages at 6 months, median micronutrient intake levels at 7 months mostly meet or exceed the AIs and far exceed the EARs (see Table 5-7). This suggests low prevalence of inadequate intakes. The exceptions within these food package groups at 7 months are median intakes for vitamin D and sodium, both of which fall below the AI. For the partially (mostly) breastfed group, however, median intake of all micronutrients analyzed falls below the AIs, or, for iron and zinc, far below the EARs, suggesting high prevalence of inadequate intakes in this food package group at 7 months.

WIC Infant and Toddler Feeding Practices Study-2: Second Year Report 5-21
Table 5-7. Median micronutrient intake of study infants at 7 months, by 6-month food package, compared to recommendations
Micronutrients
AI/EAR for infants
6-12 months
Median intake
Fully breastfed package
Partially (mostly)
breastfed package
Fully formula fed package
Antioxidants Vitamin C (mg/d) 50a 84.3 47.6 72.6 Vitamin E (mg/d) 5a 7.9 1.3 6.0 B vitamins Thiamin (mg/d) 0.3a 0.7 0.2 0.6 Riboflavin (mg/d) 0.4a 0.9 0.4 0.9 Niacin (mg/d) 4a 8.8 2.9 7.5 Vitamin B-6 (mg/d) 0.3a 0.5 0.2 0.5 Folate (µg/d) 80a 105.0 46.8 87.2 Vitamin B-12 (µg/d) 0.5a 1.4 0.3 1.2 Bone-related nutrients Calcium (mg/d) 260a 536.4 255.7 463.8 Phosphorus (mg/d) 275a 356.7 149.4 297.7 Magnesium (mg/d) 75a 84.9 40.4 68.2 Vitamin D (µg/d) 10a 7.9 0.7 6.7 Other micronutrients Vitamin A (µg RAE/d) 500a 630.5 466.3 546.2 Vitamin K (µg/d) 2.5a 53.9 6.0 39.7 Iron (mg/d) 6.9b 12.8 2.0 11.0 Zinc (mg/d) 2.5b 5.3 1.5 4.0 Sodium (mg/d) 370a 246.2 137.8 193.3 Potassium (mg/d) 700a 903.1 531.8 789.9 Unweighted n 355 316 1,704 Weighted n 52,099 48,800 247,884 a Adequate Intake (AI)
b Estimated Average Requirement (EAR)
To explore whether the low intakes of micronutrients for the partially (mostly) breastfed food package group can be explained by lower energy intake overall, analyses were repeated controlling for energy intake by calculating nutrient intakes per 100 kcal of energy intake (see Table 5-8). The partially (mostly) breastfed food package group does not have significantly lower median nutrient intake per 100 kcal of energy intake than the other two food package groups for any micronutrient. This confirms that although these infants are below the AIs or EARs for micronutrient intake, the issue seems to be explained by overall low energy intake rather than by nutrient-poor diets.

WIC Infant and Toddler Feeding Practices Study-2: Second Year Report 5-22
Table 5-8. Median micronutrient intake per 100 kcal of energy intake for study infants at 7 months, by 6-month food package
Micronutrients
Median Intake per 100 kcal Fully breastfed
package Partially (mostly)
breastfed package Fully formula fed
package Antioxidants Vitamin C (mg/d) 8.5 10.9 12.3 Vitamin E (mg/d) 0.2 0.9 1.1 B vitamins Thiamin (mg/d) 0.0 0.1 0.1 Riboflavin (mg/d) 0.1 0.1 0.2 Niacin (mg/d) 0.5 1.1 1.3 Vitamin B-6 (mg/d) 0.0 0.1 0.1 Folate (µg/d) 8.6 14.0 15.5 Vitamin B-12 (µg/d) 0.1 0.2 0.2 Bone-related nutrients Calcium (mg/d) 47.1 71.9 82.4 Phosphorus (mg/d) 27.0 45.0 53.3 Magnesium (mg/d) 7.7 10.7 12.1 Vitamin D (µg/d) 0.1 1.0 1.2 Other micronutrients Vitamin A (µg RAE/d) 87.1 84.5 85.7 Vitamin K (µg/d) 1.1 6.4 7.7 Iron (mg/d) 0.4 1.7 2.0 Zinc (mg/d) 0.3 0.6 0.8 Sodium (mg/d) 24.6 30.2 32.8 Potassium (mg/d) 98.4 119.4 130.3 Unweighted n 355 316 1,704 Weighted n 52,099 48,800 247,884
By 11 months, for all 11-month food package groups, most median intakes exceed the AIs or far exceed the EARs for the various micronutrients (see Table 5-9). This suggests low prevalence of inadequate intakes for most micronutrients at 11 months. Although the median micronutrient intakes of the partially (mostly) breastfed food package group are generally somewhat lower than those of the fully breastfed or fully formula fed package groups, they are meeting the AIs. The exception for all three food package groups is vitamin D, which continues to fall below the AI.

WIC Infant and Toddler Feeding Practices Study-2: Second Year Report 5-23
Table 5-9. Median micronutrient intake of study infants at 11 months, by 11 month food package, compared to recommendations
Macronutrients
AI/EAR for Infants
6-12 months
Median intake
Fully breastfed package
Partially (mostly)
breastfed package
Fully formula fed package
Antioxidants Vitamin C (mg/d) 50a 99.4 71.1 95.7 Vitamin E (mg/d) 5a 7.3 2.9 6.2 B vitamins Thiamin (mg/d) 0.3a 0.9 0.7 0.8 Riboflavin (mg/d) 0.4a 1.2 0.9 1.2 Niacin (mg/d) 4a 11.6 8.8 11.2 Vitamin B-6 (mg/d) 0.3a 0.8 0.6 0.7 Folate (µg/d) 80a 141.8 98.8 124.8 Vitamin B-12 (µg/d) 0.5a 1.8 0.8 1.4 Bone-related nutrients Calcium (mg/d) 260a 623.8 414.1 543.6 Phosphorus (mg/d) 275a 513.7 356.6 426.4 Magnesium (mg/d) 75a 118.7 89.6 100.3 Vitamin D (µg/d) 10a 7.3 1.6 6.6 Other micronutrients Vitamin A (µg RAE/d) 500a 638.8 599.2 581.0 Vitamin K (µg/d) 2.5a 58.0 20.1 44.5 Iron (mg/d) 6.9b 14.3 8.1 12.9 Zinc (mg/d) 2.5b 6.1 3.2 5.2 Sodium (mg/d) 370a 522.5 400.6 468.3 Potassium (mg/d) 700a 1255 980.9 1116 Unweighted n 253 198 1,305 Weighted n 48,536 41,466 251,100 a Adequate Intake (AI)
b Estimated Average Requirement (EAR)
Overall, at 7 months, infants receiving the partially (mostly) breastfed package have lower median energy intakes than infants receiving the other WIC food packages. Additionally, infants receiving the partially (mostly) breastfed package have median micronutrient levels that fall below the AIs or EARs. These deficits in nutrient intake within the partially (mostly) breastfed package group seem to be a consequence of low energy intake rather than of nutrient-poor diets. Nonetheless, regardless of origin, these low nutrient intakes should be further investigated to determine why some of these infants are not meeting their full nutritional needs. By the time of the 11-month interview, infants receiving the partially (mostly) breastfed package still have lower energy intakes than infants receiving the other food packages; however, at this time point, infants in all three food package types
WIC Infant and Toddler Feeding Practices Study-2: Second Year Report 5-24
have median intakes at or above recommended levels macro- and micronutrients. This indicates that by 11 months, most nutrient needs are being met. 5.5 Summary
The median energy intakes of WIC ITFPS-2 children vary by gender as expected, and increase appropriately as children move through the first 2 years of life. Additionally, these children have median nutrient intake levels that mostly meet or exceed the DRIs through 24 months of age. These data indicate that overall, study children are receiving sufficient amounts of nutrients to maintain health and continue to grow. Future research should explore how median energy intakes of children receiving WIC compare to EERs, as excessive energy intake could be a risk factor for overweight and obesity. WIC ITFPS-2 infants’ median nutrient intakes generally meet or exceed AIs during the infant year. Vitamin D is a notable exception, however, with median intakes falling below AIs at all ages through 24 months. During the second year of life, estimates of the prevalence of inadequate intakes are the highest for vitamin D and vitamin E, with estimated inadequate intakes in about 70 percent of the children. Defining vitamin D intake adequacy, however, is an active area of research that may continue to evolve as researchers debate how best to incorporate the contribution of non-dietary sources of vitamin D (Ross et al., 2011). These findings underscore the importance of continuing to educate WIC participants on appropriate sources of vitamins D and E, including foods available in the WIC food package such as vitamin D fortified milk, eggs, fortified cereals, and peanut butter. While infants receiving the fully breastfed or fully formula fed WIC food packages appear to be meeting most of their nutritional needs, infants receiving the partially (mostly) breastfed food package at 6 months have lower energy intakes than their counterparts, and are below recommended levels for select macronutrients and all micronutrients, at the time of the 7-month interview. The low intakes of micronutrients appear to result from low overall energy intake; however, even if this is the origin of the issue, these infants are still at risk for not meeting some of their nutrient needs. Fortunately, at the time of the 11-month interview, infants receiving the partially (mostly) breastfed food package are at or above recommended levels of nutrients. Overall these data indicate the need for continued nutrition education, specifically among caregivers of infants receiving the partially (mostly) breastfed food package, to ensure that infants are meeting their nutritional requirements. Future research should also probe reasons for the low overall energy intake, and consequent low

WIC Infant and Toddler Feeding Practices Study-2: Second Year Report 5-25
nutrient intakes, of infants receiving the partially (mostly) breastfed food package. Future research should also explore whether the algorithms used for intake of breastmilk, coded using guidelines established for coding breastmilk when fed from the breast (see Appendix B4 for details) (Butte et al., 2010; Heinig et al., 1993), are accurately representing breastmilk intake among breastfed WIC infants. Data on nutrient intake from WIC ITFPS-2 suggest that during the first 2 years of life WIC children are having most of their nutritional needs met. These patterns of nutrient intake follow the same trends, and are of comparable levels, to those reported in FITS 2002 and FITS 2008, suggesting that WIC children through 24 months have similar intakes to children from samples with lower socio-demographic risk. Additionally, nutrients of particular concern for infants, including calcium, iron, and zinc, have median intake levels among WIC ITFPS-2 children that indicate low prevalence of inadequate intake through the first two years of life, suggesting that WIC is succeeding in promoting healthy nutrition practices for these children.

Weight and Growth 6
WIC Infant and Toddler Feeding Practices Study-2: Second Year Report 6-1
6.1 Overview
This chapter focuses on weight and growth outcomes among study children. The timeframe addressed runs from 1 to 28 months.84 The main topic addressed in this chapter is:
What is the relationship between infant and child feeding practices, and infant and child growth and weight status (e.g., high weight-for-length, healthy weight-for-length)?
Analyses in this chapter expand beyond that main topic to explore the influence of maternal diet, child activities, and family eating routines on growth outcomes. The research uses weight and length measurement data in conjunction with survey data. 6.2 Background
6.2.1 Importance of Weight and Growth in Young Children
Early feeding and nutrition patterns play an important role in growth in very young children, and in later dietary habits and health outcomes, and these patterns provide an opportunity for primary prevention of adult-onset diseases (Arenz, Rückerl, Koletzko, & von Kries, 2004; Agostoni, Baselli, & Mazzoni, 2013; Campbell et al., 2016; Harder, Bergmann, Kallischnigg, & Plagemann, 2005; Owen, Martin, Whincup, Smith, & Cook, 2005). Despite some evidence that obesity prevalence in young, low-income children in the United States may be plateauing or even declining (Centers for Disease Control and Prevention (CDC), 2009; Freedman et al., 2017; Sekhobo, Edmunds, Reynolds, Dalenius, & Sharma, 2010), obesity during the first 2 years of life remains a public health concern. In 2011-2012, 7.1 percent of U.S. children 0 to 2 years old were classified as being high weight-for-length (at or above the 97.7th percentile of the World Health Organization (WHO) growth charts) (Ogden, Carroll, Kit, & Flegal, 2014); however, in a healthy population of children, one would expect less than 2.3 percent of children to have such a high weight-for-length.
84 The WIC Infant and Toddler Feeding Practices Study (WIC ITFPS-2) second-year interviews end at 24 months, but
data collection for children’s weight and length permitted an age window through 28 months.

WIC Infant and Toddler Feeding Practices Study-2: Second Year Report 6-2
A child’s growth and weight status from ages 0 to 2 years old can be an early indicator of risk for obesity later in life. High weight-for-length and rapid weight gain during the first years of life are positively correlated with obesity later in childhood and into adulthood (Baird et al., 2005; Dennison, Edmunds, Stratton, & Pruzek, 2006; Goodell, Wakefield, & Ferris, 2009; Monteiro & Victora, 2005; Moss & Yeaton, 2012; Ong & Loos, 2006; Parsons, Power, Logan, & Summerbell, 1999; Taveras et al., 2009; Winter, Langenberg, & Krugman, 2010). While catch-up growth is desired for low birthweight infants (Victora, Barros, Horta, & Martorell, 2001), children who experience rapid growth during the first 2 years of life85 have been shown to have a greater body mass index (BMI), fat mass, and central fat distribution at 5 years of age (Ong, Ahmed, Emmett, Preece, & Dunger, 2000). 6.2.2 Factors Affecting Weight and Growth
Infancy and early childhood weight gain may be influenced by myriad factors, including: growth rate, overall energy expenditure, and genetic predispositions (Ong, 2006); maternal pre-pregnancy BMI (Baker, Michaelsen, Rasmussen, & Sorensen, 2004); and racial/ethnic background (Taveras et al., 2010). Maternal obesity in early pregnancy is also strongly predictive of rapid growth in offspring from 0 to 3.5 years of age (Giles et al., 2015). Even in young populations, certain socio-demographic groups appear to be at increased risk for high weight-for-length. For example, lower-income infants and children served by WIC have been shown to have greater risk for high weight-for-length than higher income children (Aldrich & Gance-Cleveland, 2016; Boone-Heinonen et al., 2017). Studies have shown that food insecurity may jeopardize a young child’s nutritional status (Cook & Frank, 2008), and may be one factor through which low-income status increases obesity risk (Larson & Story, 2011). Additionally, regardless of income, American Indian/Alaskan Native, African American, and Hispanic infants and children have been shown to have a higher prevalence of high weight-for-length as compared to White and Asian/Pacific Islander infants and children (Boone-Heinonen et al., 2017; Freedman et al., 2017; Pan et al., 2016).
85 Most often defined as having a Z-score change greater than 0.67 in weight-for-age between two time points (Monteiro
& Victora, 2005). An example of growth greater than 0.67 Z-score would be an infant that was at the 25th percentile on a growth chart at 1 year, and moved to the 75th percentile of weight-for-age at age 2 years.

WIC Infant and Toddler Feeding Practices Study-2: Second Year Report 6-3
Multiple feeding and dietary factors also contribute to growth and weight, including duration of breastfeeding, use and quantity of infant formula, and timing of the introduction of complementary foods (Haisma et al., 2003; Victora et al., 1998). There is increasing evidence that breastfeeding serves as a protective factor against later childhood obesity, and that this may be particularly true for infants experiencing rapid early weight gain (Dewey, 2003; Carling, Demment, Kjolhede, & Olson, 2015). Among partially breastfed or formula-fed infants, as compared to fully breastfed infants, higher energy intake at 4 months is related to greater weight gain and higher subsequent BMI (Koletzko et al., 2009; Ong, Emmett, Noble, Ness, & Dunger, 2006). Moreover, formula-fed infants are more likely to grow rapidly than are breastfed infants (Mihrshahi, Battistutta, Magarey, & Daniels, 2011; Monteiro & Victora, 2005). Some studies also suggest that later introduction of complementary foods protects against childhood overweight and obesity (Weng, Redsell, Swift, Yang, & Glazebrook, 2012; Hawkins, Cole, Law, & Millennium Cohort Study Child Health Group, 2009; Seach, Dharmage, Lowe, & Dixon, 2010; Woo Baidal et al., 2016). 6.3 Sample and Analysis Approach
6.3.1 Sample
The analysis in this chapter uses data from the 1- through 24-month interviews, although the focus is on the second year of life, which begins with the 13-month interview. The core sample is offered every interview, whereas the supplemental sample completes interviews at 1 or 3 months, and 7, 13, and 24 months. Because the supplemental sample is not offered every interview, and some participants do not respond to interview requests, the responses to some interviews are less than the full sample size. The responses to specific interview questions may also be less than the totals in these tables because not all questions are relevant for all respondents. Moreover, some respondents may decline to answer questions they are asked. In analyses, the responses to each interview are weighted so that findings reflect the WIC population as described in Chapter 1. Tables 6-1a and 6-1b show the number of respondents to the 1- through 24-month interviews.
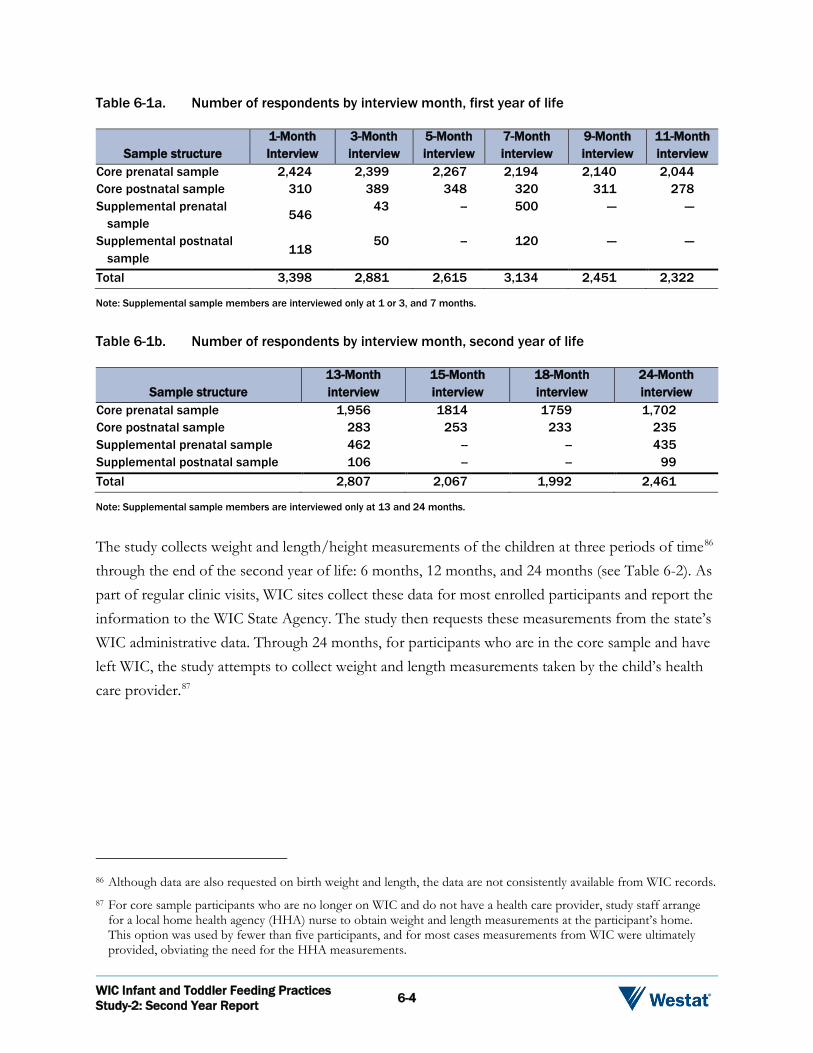
WIC Infant and Toddler Feeding Practices Study-2: Second Year Report 6-4
Table 6-1a. Number of respondents by interview month, first year of life
Sample structure 1-Month Interview
3-Month interview
5-Month interview
7-Month interview
9-Month interview
11-Month interview
Core prenatal sample 2,424 2,399 2,267 2,194 2,140 2,044 Core postnatal sample 310 389 348 320 311 278 Supplemental prenatal
sample 546
43 -- 500 --- ---
Supplemental postnatal sample
118 50 -- 120 --- ---
Total 3,398 2,881 2,615 3,134 2,451 2,322
Note: Supplemental sample members are interviewed only at 1 or 3, and 7 months.
Table 6-1b. Number of respondents by interview month, second year of life
Sample structure 13-Month interview
15-Month interview
18-Month interview
24-Month interview
Core prenatal sample 1,956 1814 1759 1,702 Core postnatal sample 283 253 233 235 Supplemental prenatal sample 462 -- -- 435 Supplemental postnatal sample 106 -- -- 99 Total 2,807 2,067 1,992 2,461
Note: Supplemental sample members are interviewed only at 13 and 24 months.
The study collects weight and length/height measurements of the children at three periods of time86 through the end of the second year of life: 6 months, 12 months, and 24 months (see Table 6-2). As part of regular clinic visits, WIC sites collect these data for most enrolled participants and report the information to the WIC State Agency. The study then requests these measurements from the state’s WIC administrative data. Through 24 months, for participants who are in the core sample and have left WIC, the study attempts to collect weight and length measurements taken by the child’s health care provider.87
86 Although data are also requested on birth weight and length, the data are not consistently available from WIC records. 87 For core sample participants who are no longer on WIC and do not have a health care provider, study staff arrange
for a local home health agency (HHA) nurse to obtain weight and length measurements at the participant’s home. This option was used by fewer than five participants, and for most cases measurements from WIC were ultimately provided, obviating the need for the HHA measurements.

WIC Infant and Toddler Feeding Practices Study-2: Second Year Report 6-5
Table 6-2. Number of analysis sample children on whom the study received weight and length data, by source of measurement
Time period Number received
Source of measurement
WIC administrative data
Health care provider records
Caregiver report of provider
measurement 6-month measurements 2,568 2,394 62 112 12-month measurements 2,577 2,347 147 83 24-month measurements 1,731 1,449 158 124
Note: Supplemental sample measurements for 6, 12, and 24 months were only sought from WIC records, and therefore not expected from participants not receiving WIC, thus numbers are smaller than the full analysis sample of 3,777.
The weight and length data vary greatly because timing of measurements at WIC and by providers varied. Data received span approximately 27 months (age 1 month to 28 months). In order to facilitate analysis, the data are broken into three age periods eligible for analysis: early infancy, late infancy, and toddlerhood. Early infancy ranges from 1 to less than 7 months; late infancy ranges from 7 through 15 months; and, toddlerhood ranges from 20 through 28 months. Table 6-3 reports on the number of observations in each age period for which weight and length data are available. Although the majority of study children have repeated measures, the time between measures is uneven. Table 6-3. The number of study children with weight and length measurement data in each
age group for analysis
Age period Unweighted n Weighted n Early infancy (1 to <7 months) 2,014 349,824 Late infancy (7 to 15 months) 2,442 420,357 Toddlerhood (20 to 28 months) 1,731 442,713
6.3.2 Growth Standards
International weight and length standards for children from birth to age 24 months put forward by the WHO in 2006, and adopted by the CDC, document optimal growth by children in six countries,

WIC Infant and Toddler Feeding Practices Study-2: Second Year Report 6-6
including the United States. Rigorous analysis underlies the CDC decision to adopt these standards the WHO standards in the United States.88,89 The WHO standards allow categorization of study children’s weight and growth outcomes into low, healthy, and high groupings. Consistent with WHO and CDC guidelines, those in the low group have weight-for-length outcomes that fall below the 2.3rd percentile; those in the healthy group have outcomes that fall between the second and 97.7th percentile; and, those in the high group have outcomes that fall above the 97.7th percentile.90 Compared to the CDC growth charts, which use the 5th and 95th percentiles of a population to define underweight and overweight, respectively, use of the WHO growth charts tends to identify fewer children as underweight and more children as gaining weight more rapidly (Mei, Ogden, Flegal, & Grummer-Strawn, 2008; Grummer-Strawn et al., 2010). The latter characteristic is advantageous given the current public health concern surrounding childhood obesity. 6.3.3 Caregiver Dietary Intake Data
The Dietary Screener Questionnaire (DSQ) is a short questionnaire that asks about the frequency of consumption of select foods and beverages in adults, developed by the National Cancer Institute for the National Health and Nutrition Examination Survey (NHANES) 2009-2010.91 Fruits and vegetables, and added sugar from sugar-sweetened beverages (SSBs), are among the select foods and beverages included in the DSQ. The WIC ITFPS-2 survey included items from the DSQ in the 24-month interview to permit analysis WIC caregivers’ fruit and vegetable intake and added sugar intake from SSBs. Fruit and vegetable intake is measured in cup equivalents per day, a unit which aligns with recommendations in the 2015-2020 Dietary Guidelines for Americans. Intake of added sugar from SSBs is measured in teaspoons per day. 88 See Grummer-Strawn, Reinold, Krebs, & Centers for Disease Control and Prevention (2010) for a summary of the
decision process. 89 Although CDC stopped short of adopting the WHO standards for children 24 months and older, WIC ITFPS-2
analyses continue to use WHO standards for the toddlerhood measurements to avoid using a different standard for evaluating weight and growth for different children in the same analysis group.
90 Hereafter the percentiles are rounded in analysis descriptions to the 2nd and 98th percentiles. 91 National Institutes of Health, National Cancer Institute. (n.d.). Epidemiology and Genomics Research Program, Dietary
Screener Questionnaire in the NHANES 2009-10. Retrieved from https://epi.grants.cancer.gov/nhanes/dietscreen/ on October 19, 2017.
WIC Infant and Toddler Feeding Practices Study-2: Second Year Report 6-7
6.3.4 Analysis
The analyses of study children’s weight and growth outcomes categorize the children in each age period into the low, healthy, and high groups specified by WHO/CDC. Analyses then explore the relation between weight-for-length and interview responses, to examine relations between behaviors measured by the interview and outcomes captured in administrative data. The focus is on feeding practices and dietary intake as they relate to child weight and growth outcomes, including breastfeeding practices, the timing of the introduction of complementary foods, and maternal dietary intake. First, weight-for-length distributions at each age period are described. Analyses also explore whether socio-demographic characteristics are associated with weight-for-length groups. Socio-demographic characteristics are typically measured at the time of the first interview. For characteristics that change over time, such as food security or income poverty, socio-demographic characteristics are updated to status from the 13-month interview if they are being analyzed in relation to outcomes after 13 months. Appendix C5 presents each variable of interest crossed by a series of socio-demographic variables. Chi-square tests of association are used to examine whether feeding behaviors are associated with weight and growth outcomes, and follow-up t-tests between pairs of subgroups to determine which subgroups are statistically significantly different from each other. This bivariate approach lays the groundwork for more nuanced multivariate analyses. Subgroup differences discussed in the chapter are limited to those that persist over time and are large in magnitude, to avoid focusing on findings that, while statistically significant, may have little practical importance. Statistical significance, when indicated, is at the level of p < 0.05. Finally, multivariate analyses are reported. Multivariate analyses isolate the unique effects of individual variables on an outcome, while holding the influence of other variables constant. As compared to bivariate analyses, multivariate analysis typically finds a more limited set of behavioral variables have a statistically significant association with the outcome. For multivariate analyses predicting weight and growth, logistic regression is used to predict the effect of feeding practices and other behavioral variables on the likelihood of falling within the high group relative to the healthy group.

WIC Infant and Toddler Feeding Practices Study-2: Second Year Report 6-8
6.4 Weight-for-Length Outcomes for Study Children
6.4.1 Weight-for-Length Distribution by Age Period
A first step in understanding issues related to growth in young children is to examine distributions of weight-for-length throughout the first 2 years of life. Figure 6-1 presents the percentage distribution of study children in each weight-for-length category by the three measurement age periods, early infancy (1 to <7 months), late infancy (7 to 15 months), and toddlerhood (20 to 28 months). In early infancy, 83 percent of study children fall within the healthy group; in late infancy, 80 percent do; and, in toddlerhood, 76 percent do. As the percentage of children with a healthy weight-for-length falls, the percentage of children in the high weight-for-length group rises, from 16 percent in early infancy to 19 percent in late infancy, and 23 percent in toddlerhood. This increasing trend in the prevalence of high weight-for-length as study children age is concerning because high weight-for-length in older children has been associated with adverse health outcomes (Agostini et al., 2013).
Key Findings: Around the time of the second birthday, 23 percent of WIC
ITFPS-2 children are in the WHO high weight-for-length group. This rate is higher than that found in earlier studies.
Breastfeeding duration seems to have a positive influence on weight-for-length. By the end of the second year of life, never having breastfed or having breastfed for less than 2 months is associated with high weight-for-length, and having breastfed at least 13 months is associated with healthy weight-for-length.
In multivariate analyses, introduction of complementary foods prior to 4 months of age, rapid weight gain into toddlerhood, time spent playing video games, and high birth weight all independently predict high weight-for-length at 24 months.

WIC Infant and Toddler Feeding Practices Study-2: Second Year Report 6-9
Figure 6-1. The percentage of study children by age and weight-for-length
1%
83%
16%
1%
80%
19%
1%
76%
23%
Low Healthy High
Weight for Length Groups
Early infancy Late Infancy Toddlerhood
Previous research suggests that high weight-for-length is more prevalent among low-income children served by WIC than among higher income children (Aldrich & Gance-Cleveland, 2016; Freedman et al., 2017), and the current study’s findings support this. Whereas the current study found that 16 to 23 percent of WIC children in the first 2 years of life have a high weight-for-length, national estimates for the entire U.S. population from the 2013-2014 NHANES Study indicate that 8 percent of 0 to 2 year olds have a high weight-for length (Fryar, Carroll, & Ogden, 2016). Taken together, these findings suggest that high weight-for-length is more prevalent among WIC participants than among the general population. WIC ITFPS-2 findings align with other recent studies of weight-for-length in WIC children. Aldrich and Gance-Cleveland (2016) conducted secondary analysis of WIC Participant Characteristic data from 2008-2012, applying WHO standards for low, healthy, and high weight-for-length, and found rates of high weight-for-length to be 10.0 percent at 6 months, 13.1 percent at 12 months, 15.6 percent at 18 months, and 17 percent at 24 months for WIC children. Similarly, Freedman et al. (2017) conducted secondary analysis of WIC Participant Characteristics data from 2000-2014, also applying WHO standards. For 2014, the closest temporal match to WIC ITFPS-2, they found rates of high weight-for-length of 8.4 percent at 3-5 months, 11.0 percent at 6-11 months, 12.5 percent at 12-17 months, and 14.8 percent at 18-23 months.
Note: See Appendix B3c, Table B3c-1, for more details.

WIC Infant and Toddler Feeding Practices Study-2: Second Year Report 6-10
Like WIC ITFPS-2, both of these studies using WIC Participant Characteristic data document a concerning upward trend in prevalence of high weight-for-length as low-income children age. Although the inclusion of older children (through 28 months) in the toddlerhood measurement age period for WIC ITFPS-2 may account in part for the discrepancy in the highest group, differences in high weight-for-length prevalence between WIC ITFPS-2 and the two other WIC studies may have several sources. WIC ITFPS-2 infants are born at a later date than infants in the other samples, and although all WIC ITFPS-2 participants are recruited at WIC sites, by 24 months approximately 21 percent of the children for whom the study obtained toddlerhood measurements are no longer receiving WIC services. The WIC ITFPS-2 sample is additionally limited to mothers who speak English or Spanish, and are age 16 or older at study enrollment. This may make the socio-demographic makeup of the WIC ITFPS-2 sample not fully comparable to WIC Participant Characteristics’ data, which uses administrative data on all currently enrolled WIC participants during a single month of the year. Nonetheless, the data from all three studies suggest an increasing trend in the prevalence of high weight-for-length as children age. Analyses exploring associations between weight-for-length and socio-demographic variables yield few statistically significant results. When examining all three age periods (i.e., early infancy, late infancy, and toddlerhood), statistically significant associations were found between weight-for-length and food security in early infancy, between weight-for-length and participation in non-WIC benefit programs in late infancy, and between weight-for-length and ethnicity in toddlerhood (see Tables B3c-2 to B3c-4, Appendix B3c for more details). Follow-up pairwise t-test indicate that in early infancy, children in households with low food security are more likely to be low weight-for-length than those with high or marginal food security, but differences between young infants in homes with very low household food security and those with high or marginal food security are not significant. In late infancy, children in households that participate in other non-WIC benefit programs, but not in the Supplemental Nutrition Assistance Program (SNAP), are more likely to be healthy weight-for-length than either children in households that participate in SNAP or SNAP plus other non-WIC benefit programs, or children in households that participate in no other non-WIC benefit programs.92 In toddlerhood, children with Hispanic caregivers, as compared to children with non-Hispanic caregivers, are more likely to be in the high weight-for-length group, and less likely to be in the healthy weight-for-length group.
92 Other non-WIC benefit programs that are not SNAP include Medicaid, Temporary Assistance for Needy Families,
National School Lunch or School Breakfast Program, or the Summer Foods Program.

WIC Infant and Toddler Feeding Practices Study-2: Second Year Report 6-11
Overall, across the first 2 years of life, the prevalence of high weight-for-length among WIC children increases with age. This finding, which is corroborated by other national studies, underscores the importance of identifying contributing factors, and developing strategies for preventing early childhood obesity. 6.4.2 Characteristics of Children in the High Weight-for-Length Group
To understand better the characteristics and experiences associated with the high weight-for-length group, associations between weight-for-length data and key feeding and nutrition practices are presented here. These characteristics include breastfeeding duration, timing of complementary food introduction, and maternal dietary intake. Breastfeeding and Weight-for-Length
Previous studies have suggested that breastfeeding may be linked to weight status in early childhood (Haisma et al., 2003; Victora et al., 1998). Consequently, analyses examine weight-for-length associations with breastfeeding practices. The bivariate approach includes four intervals for breastfeeding: never breastfed or breastfed less than 2 months; breastfed at least 2 months but less than 7 months; breastfed at least 7 months but less than 13 months; and breastfed at least 13 months. Analyses examine the percentage of study children in each weight-for-length group by breastfeeding duration; because the number of infants in the low weight-for-length group is very small, analyses focus on the percentages in the healthy and high groups. Table 6-4 shows the percentage of study children within the healthy and high weight-for-length groups at each measurement age period (early infancy, late infancy, toddlerhood), by breastfeeding duration. In early infancy, similar percentages of healthy and high weight-for-length infants are never breastfed or are breastfed less than 2 months (67% and 66%, respectively). By toddlerhood those numbers are no longer similar, with 48 percent of those in the healthy weight-for-length group never breastfed or breastfed less than 2 months, and 57 percent of those in high weight-for-length group are never breastfed or breastfed less than 2 months. There are two instances, both in the toddlerhood measurement period, where breastfeeding experience is significantly associated with weight-for-length group. Follow-up pairwise t-tests confirm that among children who were never breastfed or breastfed less than 2 months, by the

WIC Infant and Toddler Feeding Practices Study-2: Second Year Report 6-12
toddlerhood measurement there are significantly more children in the high weight-for-length group than in the healthy weight-for-length group. Additionally, among children who were breastfed at least 13 months, by the toddlerhood measurement there are significantly more children in the healthy weight-for-length group than in the high weight-for length group. Breastfeeding duration, then, is positively associated with healthy weight-for-length by the end of the second year of life. Table 6-4. Percentage of children by weight-for-length group and breastfeeding duration
Measurement period and breastfeeding duration
Percentage of study children Healthy weight-for-length
group High weight-for-length
group Early infancy (1 to <7 months) Never breastfed or breastfed less than 2 months 67.2% 66.0% Breastfed at least 2 months but less than 7 months 32.8 34.0 Unweighted n 1,295 236 Weighted n 220,736 44,456 Late infancy (7 to 15 months) Never breastfed or breastfed less than 2 months 60.0 63.3 Breastfed at least 2 months but less than 7 months 30.8 30.8 Breastfed at least 7 months but less than 13 months 9.2 5.9 Unweighted n 1,629 374 Weighted n 274,387 67,749 Toddlerhood (20 to 28 months) Never breastfed or breastfed less than 2 monthsa 47.5 57.1 Breastfed at least 2 months but less than 7 months 25.2 24.4 Breastfed at least 7 months but less than 13 months 7.6 6.9 Breastfed at least 13 monthsb 19.7 11.6 Unweighted n 1,320 384 Weighted n 335,609 101,295
Note: See Appendix C5, Tables C5-1-1a to C5-1-1w, for more details.
a Children who never breastfed or breastfed less than 2 months are significantly more likely to be in the high weight-for-length group than in the healthy weight-for length group in toddlerhood.
b Children who breastfed at least 13 months are significantly more likely to be in the healthy weight-for-length group than in the high weight-for length group in toddlerhood.
Breastfeeding and Rapid Weight Gain. To further understand the relationship between breastfeeding and weight-for-length, additional analyses explore breastfeeding duration and rapid weight gain. For the purposes of this study, rapid weight gain is defined as an increase in age-specific weight-for-age Z-score of more than 0.67 based on measurements taken at least 3 months apart (Monteiro & Victora, 2005). Table 6-5 presents the data for two groups of children within each measurement age period: those who experienced rapid weight gain during that period, and those who did not. Follow-up pairwise t-tests reveal that the only statistically significant difference in the percentages are within the toddlerhood period. Around the second birthday, a significantly higher percentage of children who never breastfed or breastfed less than 2 months experience rapid weight

WIC Infant and Toddler Feeding Practices Study-2: Second Year Report 6-13
gain than did not experience rapid weight gain. Also around the second birthday, a significantly lower percentage of children who breastfed at least 2 months but less than 7 months experience rapid weight gain than do not experience rapid weight gain. These findings suggest that a history of no or less than 2 months duration of breastfeeding is associated with rapid weight gain in the toddlerhood period, but a slightly longer duration of breastfeeding is associated with a lower likelihood of rapid weight gain. Table 6-5. The percentage of study children who did and did not experience rapid weight gain
by breastfeeding duration
Rapid weight gain experience and breastfeeding duration
Percentage of children Early infancy Late infancy Toddlerhooda,b
Experienced rapid weight gain Never breastfed or breastfed less than 2 months 64.3% 65.4% 55.7% Breastfed at least 2 months but less than 7 months 35.7 28.0 19.6 Breastfed at least 7 months but less than 13 months NA 6.6 9.5 Breastfed at least 13 months NA NA 15.2 Unweighted nc 260 315 259 Weighted n 50,071 53,858 65641 Did not experience rapid weight gain Never breastfed or breastfed less than 2 months 63.8 59.0 46.7 Breastfed at least 2 months but less than 7 months 36.2 32.1 27.4 Breastfed at least 7 months but less than 13 months NA 8.9 6.8 Breastfed at least 13 months NA NA 19.1 Unweighted nc 484 923 1175 Weighted n 88,768 158,037 294,295
Note: See Appendix C5, Tables C5-5a to C5-7w, for more details. NA indicates not applicable.
a Among children who never breastfed or breastfed less than 2 months, during toddlerhood a significantly higher percentage experienced rapid weight gain than did not experience rapid weight gain
b Among children who breastfed at least 2 months but less than 7 months, during toddlerhood a significantly lower percentage experienced rapid weight gain than did not experience rapid weight gain.
C Analyses are limited to those children with weight measures at least 3 months apart during the target measurement age period.
Because rapid weight gain during childhood may be a risk factor for future obesity (Dennison et al., 2006), further analysis examines whether there are any notable statistically significant associations between socio-demographic characteristics and breastfeeding duration for children who experience rapid weight gain (see Appendix C5 Tables C5-5a to C5-7w for more details). Chi-square testing does not reveal any large, statistically significant patterns of association.
WIC Infant and Toddler Feeding Practices Study-2: Second Year Report 6-14
Timing of Complementary Food Introduction and Weight-for-Length
Early introduction of complementary foods may be associated with high weight-for-length (Seach et al., 2010). Similar to the analysis of breastfeeding duration, this analysis focuses on the percentage of children in each weight-for-length group who have initiated the select complementary foods by each age period. The complementary foods examined included fruit juice, cow’s milk, sweet drinks, infant cereal, fruits, vegetables, meats, salty snacks, dairy foods, high protein foods, sweet foods, and salty snacks. In this bivariate approach, Chi-square testing indicates that the timing of introduction of these select complementary foods is not associated with weight-for-length (See Table B3c-5, Appendix B3c, for details). Caregiver Diet and Weight-for-Length
To explore the possibility that caregivers’ diets may influence children’s eating patterns, the WIC ITFPS-2 24-month interview asks caregivers about their intake of select foods, specifically SSBs and fruits and vegetables, using the NHANES DSQ.93 Consumption of SSBs is believed to be a contributor to the overweight and obesity epidemic in the United States (Malik, Pan, Willett, & Hu, 2013). Caregivers who regularly consume SSBs may influence their children’s intake of these beverages. Fruit and vegetable consumption is widely recognized as promoting and protecting health (Bertoia et al., 2015), and research suggests that parental intake positively influences children’s intake of fruits and vegetables (Draxten, Fulkerson, Friend, Flattum, & Schow, 2014; Fisher, Mitchell, Smiciklas-Wright, & Birch, 2002). Among WIC ITFPS-2 caregivers, median added sugar consumption from SSBs is 6.4 teaspoons per day. Compared to the consumption data from the 2009-2010 NHANES sample,94 the median amount consumed by WIC ITFPS-2 caregivers falls between the 25th and 75th percentiles, indicating their intake is on par with consumption in the general U.S. population. Median fruit and vegetable consumption for the study caregivers is 2.3 cup equivalents per day, which also falls between the 25th and 75th percentiles from the NHANES sample. It should be noted, however,
93 National Institutes of Health, National Cancer Institute. (n.d.). Epidemiology and Genomics Research Program, Dietary
Screener Questionnaire in the NHANES 2009-10. Retrieved from https://epi.grants.cancer.gov/nhanes/dietscreen/ on October 19, 2017.
94 National Institutes of Health, National Cancer Institute. (n.d.). Epidemiology and Genomics Research Program, Dietary Screener Questionnaire in the NHANES 2009-10: Computed Variables. Retrieved from https://epi.grants.cancer.gov/nhanes/dietscreen/scoring/current/variables.html on October 19, 2017.
WIC Infant and Toddler Feeding Practices Study-2: Second Year Report 6-15
that based on the 2015-2020 Dietary Guidelines for Americans, adults consuming 2,000 kcal per day should consume at least 2 cup equivalents of fruit and 2.5 cup equivalents of vegetables each day. As such, the WIC ITFPS-2 caregivers are not meeting the national recommendations for daily fruit and vegetable intake. There are no notable differences between caregivers of children in the toddlerhood healthy or high weight-for-length groups in the daily cup equivalent consumption of fruits and vegetables, or in the per-day teaspoons of added sugar from SSBs. Caregivers of children in the toddlerhood healthy weight-for-length group consume 2.4 cup equivalents of fruits and vegetables per day on average, and caregivers of children in the high weight-for-length group consume 2.5 cup equivalents per day on average. Caregivers of children in the healthy weight-for-length group consume 8.4 teaspoons of added sugar from SSBs per day on average, and caregivers of children in the high weight-for-length group consume 8.3 teaspoons on average. Analysis of the data by socio-demographic characteristics of caregivers with children in each weight-for-length group reveals that consumption of fruits and vegetables, and of SSBs, is similar across key socio-demographic characteristics. Tables in Appendix C5 (Tables C5-3a to C5-3w) contain estimates within each toddlerhood weight-for-length group. In Table 6-6, descriptive data are presented on select socio-demographic characteristics of caregivers of children in toddlerhood the healthy versus high weight-for-length groups. Child Activities and Weight-for-Length
To investigate associations between physical activity, family eating routines, and weight-for-length during toddlerhood, the WIC ITFPS-2 interview asks caregivers about child activity level and family eating routines during the second year of life. Specifically, the interview probes whether the child is physically active indoors and outdoors; the amount of time spent sleeping, in front of the television, and playing electronic games; whether the television is on during meals; and, whether the family eats together less than five times per week. These analyses examine the association between weight-for-length and patterns of behavior that do not promote health. Examples of the patterns examined include inadequate sleep, limited physical activity, excessive time in front of TV screens, and absence of regular family mealtimes.

WIC Infant and Toddler Feeding Practices Study-2: Second Year Report 6-16
Table 6-6. Caregivers’ average intake of added sugar from SSBs, by toddlerhood weight-for-length group and caregiver socio-demographic characteristics
Select socio-demographic category
Average intake of added sugar from SSBs (tsp/day)
Healthy weight-for-length toddlers
High weight-for-length toddlers
Race African American 9.8 7.4 White 8.3 8.3 Other 6.9 9.5 Ethnicity Hispanic 7.1 7.8 Non-Hispanic 9.4 8.8 Marital status Married 7.4 7.0 Not married 8.9 9.1 Participation in non-WIC benefit program(s) Does not participate in other programs 7.3 6.8 Participates in other program(s) and is on SNAP 9.2 9.4 Participates in other program(s) and is not on SNAP 7.8 7.5 Parity First born 8.1 7.9 Second born 8.8 7.9 Third or subsequent born 8.4 9.5 Mother’s pre-pregnancy weight Normal or Underweight 8.7 9.0 Overweight 8.4 7.3 Obese 7.9 8.3 Income poverty 75% of poverty guideline 9.1 9.1 Above 75% but no more than 130% of guideline 7.3 7.7 Above 130% of poverty guideline 8.0 6.7 Unweighted n 1,067 291 Weighted n 269,851 74,181
Note: See Appendix C5, Tables C5-3a-C5-3w for additional information.
The amount of time spent in indoor play is assessed using caregiver report of the number of minutes or hours the child is engaged in indoor activities such as wrestling, tumbling, playing chase, and playing ball (MacDonald & Parke, 1986). If the child does not participate in at least one of these activities several times a week, the analysis categorizes the child as not physically active indoors. The caregiver’s report of the number of minutes or hours the child typically spends playing outdoors on weekdays and weekends forms the basis for the outdoor play measure (Burdette, Whitaker, & Daniels, 2004). Reports of the numbers of hours spent playing outdoors yield some extreme values, far exceeding 6 hours per day, which appear to be outliers in the data too extreme for 24-month old children. These cases are excluded from analysis.

WIC Infant and Toddler Feeding Practices Study-2: Second Year Report 6-17
Among the entire sample of WIC ITFPS-2 2-year old children, the time spent playing outdoors on an average day is 2 hours, with a range from less than 1 hour to 6 hours. The children watch an average of 1.24 hours of television on an average day, with a range from 0 to 10 hours, and spend an additional 0.3 hours on average playing electronic games, with a range from 0 to 10 hours. To understand how these activities and family eating routines differ among weight-for-length groups, Table 6-7 presents the percentages of healthy and high weight-for-length study children by these various activities. The table also presents associations between weight groups and medical conditions that may affect dietary intake. The largest percentage point differences between the healthy and high weight-for-length children are seen in time spent playing outside, time playing electronic games, and whether the family eats together less than 5 times a week. Pairwise t-tests indicate that differences in the percentages by screen time or the family eating together are not statistically significant. Although theory suggests that lack of outside play would be associated with high weight-for-length, in this bivariate analysis this is not immediately evident. Surprisingly, follow-up pairwise t-tests indicate that children in the healthy weight-for-length group, as compared to those in the high weight-for-length group, are less likely to spend 2 hours or more per day in outdoor play. This finding is somewhat unintuitive, because in other research on older children, increased physical activity is associated with healthier weight (Rauner, Mess, & Woll, 2013). WIC ITFPS-2 relies on caregiver-report data and does not use direct observation or accelerometers to measure the intensity or duration of outdoor playtime. Thus, it is possible that some caregivers do not accurately report the time spent in actual play but rather just time spent outside, reducing the utility of the question as a measure of physical activity. Additionally, the questions about outdoor play were adapted from research on preschool-age children (Burdette et al., 2004), and may not be capturing the activity equally well for younger children. Climate may also affect the amount of playtime outdoors: those in warmer climates with longer hours of daylight may be able to play outside longer than those who live in colder ones that see nightfall come earlier. To explore whether very active children in cooler climates may be more physically active indoors rather than outdoors, the questions about indoor play are scored and aggregated to form an indoor play composite variable. Since each of the four indoor activity questions has the same response format, the scoring involves assigning values as follows: three for “every day,” two for “several times a week,” 1 for “once a week,” and zero for “not at all.” The composite thus ranges from 0 to 12. Although this is not the ideal measure of the amount of indoor activity, it does reflect children who regularly engage in a wider variety of indoor activities, which

WIC Infant and Toddler Feeding Practices Study-2: Second Year Report 6-18
may be associated with time spent on them. The correlation between this indoor play composite and outdoor playtime was positive (r = 0.23) and highly statistically significant, indicating that the two activities are not substitutes for each other, and that active children seem to be active both indoors and outdoors. Table 6-7. The percentages of study children by toddlerhood weight-for-length groups and by
select characteristics associated with health, physical activity, and family eating routines
Child’s health, physical activity, or family eating routines at the 24-Month interview
Percentage of children in toddlerhood Healthy weight-for-
length High weight-for-
length Child has a long-term medical condition that affects what or
how s/he eats 3.7% 3.0%
Child is not physically active indoorsa 4.4 3.4 Child typically plays outside less than 2 hours dailybc 62.9 53.4 Child sleeps less than 11 hours per day (including daytime
naps) 40.7 42.1
Child exceeds 1.24 hours of TV screen time dailyd 33.6 33.0 Child exceeds 0.3 hour of screen time playing electronic games
dailye 27.7 31.1
TV is on most of the time during meals 22.3 23.0 Family eats together less than 5 times per week 28.8 32.6 Unweighted n 1,067 291 Weighted n 269,851 74,181
a The child is considered physically active indoors if she or he participated regularly (every day or several times in a week) in any of the four indoor activities listed in questions CH6-a-6 in the 24-month interview.
b The average playtime outdoors was 2 hours based on weighted survey responses to questions CH7 and CH8
c Children in the healthy weight-for-length group are significantly more likely than those in the high weight-for-length group to play outside less than 2 hours daily.
d The average number of hours of television viewing was 1.24 hours based on weighted survey responses to question CH17.
e The average number of hours involved with electronic games was 0.3 hour based on weighted survey responses to question CH18.
Overall, there are few statistically significant bivariate associations between weight-for-length during the first 2 years of life and the key socio-demographic or behavioral variables used in this study. Longer breastfeeding duration, however, is associated with healthy weight-for-length and a lower chance of rapid weight gain in toddlerhood, but not in early or late infancy.

WIC Infant and Toddler Feeding Practices Study-2: Second Year Report 6-19
6.4.3 Models Predicting Weight-for-Length Outcomes
The current study uses logistic regression to elucidate which factors independently predict weight-for-length outcomes. In logistic regressions presented here, the dependent variable is weight-for-length group (i.e., healthy and high weight-for-length). Independent variables include socio-demographic characteristics, feeding practices, caregiver diet, and indoor and outdoor activity. The analysis first examines three logistic regressions, one predicting the likelihood of high weight-for-length in each measurement period: early infancy, late infancy, and toddlerhood. The current study’s models predicting the likelihood of high weight-for-length in early and late infancy do not perform well. They show only that rapid weight gain is associated with increased likelihood of being in the high weight-for-length group. The lack of correlation may be because high weight-for-length outcomes are less common in the early and late infancy measurement periods. The focus of the analysis then shifts to predicting the likelihood of high weight-for-length outcomes in the toddlerhood measurement period. The regression work explores a variety of variables for inclusion in logistic models. Variables that are explored in different versions of the model include: race; ethnicity; marital status; age; food security; mother’s pre-pregnancy weight; work status; breastfeeding duration; timing of introduction of first complementary foods; timing of introduction of cow’s milk; whether the child was overfed (as measured by energy consumption in excess of estimated requirements); duration of outdoor play; variety and frequency of indoor activity; the child’s gender; and, measures of caregiver SSB and fruit and vegetable intake. Akaike Information Criteria (AIC) statistics drive model selection. Models with less information loss (lower AIC) are preferred over models with more loss (higher AIC). Table 6-8 summarizes results from the model chosen, which uses 1044 observations and accounts for the complex survey design. The table lists all variables included in the model, and indicates whether each variable in the model independently influences the odds of being high weight-for-length. The significance level is set at p < 0.05 (95% confidence level). In this model, early introduction of solid foods (i.e., before 4 months), rapid weight gain, more than average daily time spent playing video games, and high birth weight significantly increase the odds of being in the high weight-for-length group in the toddlerhood measurement period. Surprisingly, playing outside less than the daily average (2 hours) decreases the odds of being high weight-for-length; however, this summary measure of time spent playing outdoors should be interpreted with caution, as it is not clear that all time outside was spent in physical play.

WIC Infant and Toddler Feeding Practices Study-2: Second Year Report 6-20
When interpreting the model, it is important to note variables like race and birth weight each have three possible categories. In the logistic regressions, the most common category becomes the reference group to which each of the other two groups is compared. For example, high birth-weight infants are compared with normal birth-weight infants and low birth-weight infants are separately compared with normal birth-weight infants. As Table 6-8 indicates, high birth-weight infants have higher odds of being high weight-for-length in toddlerhood, but the odds for low birth-weight infants are not significantly different from normal birth-weight infants. Table 6-8. Results of logistic regression predicting likelihood of high weight-for-length in
toddlerhood
Variable Odds ratio Effects on the odds of being
high Weight-for-Length Black or African American vs White 0.67 Not significant All Other Races vs White 0.80 Not significant Hispanic or Latino vs Not Hispanic or Latino 1.25 Not significant Married vs Not married (including divorced and widowed) 0.71 Not significant Solid foods were introduced prior to 4 months vs Not
introduced prior to 4 months 2.11 Significantly increases oddsa
Child with rapid weight gain into toddlerhood (20-28 months) vs Child did not gain weight rapidly 3.80 Significantly increases oddsa
Child was overfed at 24 Month 24-Hour Dietary Recall vs Child was not overfed 0.67 Not significant
Mother was smoking during pregnancy vs Mother not smoking during pregnancy 1.30 Not significant
Child has heath condition at 24-Month interview vs Child does not have health condition 0.42 Not significant
Child typically plays outside less than 2 hours daily vs Child typically plays outside at least 2 hours daily 0.59 Significantly decreases oddsa
Plays more than 0.3 hours of video games per day vs Plays 0.3 hours or less of video games per day 1.59 Significantly increases oddsa
Low Birth Weight vs Normal Birth Weight 0.49 Not significant High Birth Weight vs Normal Birth Weight 4.81 Significantly increases oddsa Breastfeeding duration 1.00 Not significant
a This variable is significant at the 95% confidence level.
Note: See Appendix B3c, Table B3c-6, for more details, including confidence intervals.
Overall, being high weight-for-length in toddlerhood is predicted independently by early introduction of solid foods (i.e., before 4 months), rapid weight gain, above average time spent playing electronic games, and high birth weight. Although less outdoor play independently predicts a lower likelihood of being high weight for length, the measurement of outdoor play may not be sufficiently objective.

WIC Infant and Toddler Feeding Practices Study-2: Second Year Report 6-21
6.5 Summary
One of the WIC program’s goals is to facilitate optimal growth and development. This chapter looks at weight and growth outcomes among WIC ITFPS-2 children, exploring the relationship between feeding practices and weight-for-length in three measurement periods: early infancy (1 to less than 7 months), late infancy (7 to 15 months), and toddlerhood (20 to 28 months). About 16 percent of WIC ITFPS-2 infants are high weight-for-length in early infancy. By toddlerhood, 23 percent are. This trend, a 44 percent increase between the two measurement periods, is concerning because excessive weight in older children has been associated with adverse health outcomes (Agostini et al., 2013). Further examination of these trends as the children move beyond the second year of life will be necessary to understand the full pattern that is emerging. There are few statistically significant associations between weight-for-length and the key socio-demographic variables used in this study. In early infancy, low food security is associated with low weight-for-length; in late infancy, participation in other non-WIC benefit programs, but not in SNAP, is associated with healthy weight-for-length; and in toddlerhood having an Hispanic caregiver is associated with high weight-for-length. Breastfeeding duration appears to influence weight-for-length positively in toddlerhood, but not in early or late infancy. Characteristics of caregivers’ diets, represented by added sugar from SSBs and cup equivalent intakes of fruits and vegetables, does not appear to have an effect on weight-for-length among WIC ITFPS-2 children. Furthermore, playtime outdoors at 24 months exhibits an unexpected relationship, with those playing outside longer than average sample times being more likely to be high weight-for-length. It should be noted, however, that measures of outdoor play were through caregiver report and do not capture activity objectively. The report of outdoor play was also adapted from research on preschool-age children (Burdette et al., 2004), and may not capture outdoor play as effectively for slightly younger children. In multivariate analyses, the only feeding practice that significantly increases the odds of the child being high weight-for-length for the toddlerhood period measurement is the introduction of complementary foods prior to 4 months of age. Playing more than 20 minutes of video games per day also increases the odds of being high weight-for-length in toddlerhood, as do rapid weight gain and high birth weight.

WIC Infant and Toddler Feeding Practices Study-2: Second Year Report 6-22
Taken together, these findings indicate that high weight-for-length is fairly common in the first 2 years of life among children who started out in WIC. Although it appears that some of the factors influencing weight status are non-modifiable, there are also some modifiable factors that are being addressed through WIC services (e.g., nutrition education, food instruments for healthy foods). As such, the services provided by WIC could assist caregivers of children in the first 2 years of life in developing healthier habits, and thereby reducing the risk of high weight status later in life.

Summary, Conclusions, and Interpreting the Data 7
WIC Infant and Toddler Feeding Practices Study-2: Second Year Report 7-1
7.1 Summary and Conclusions
Results through the second year show that most of today’s WIC families are engaging in a variety of health-promoting feeding practices:
Among the WIC Infant and Toddler Feeding Practices Study (WIC ITFPS-2) mothers who have returned to work full-time by 3 months, 34 percent are breastfeeding.
Most breastfeeding mothers who use regular child care (60% at 3 months) are opting to provide pumped milk to the child care site so their infants can continue to receive breastmilk while in care.
Only 53 percent of WIC ITFPS-2 children are still drinking anything from a bottle at 13 months.
At 13 months, 97 percent of WIC ITFPS-2 children are picking up food with their fingers to self-feed, and 66 percent are feeding themselves with a spoon at 18 months. These findings demonstrate that the children are making expected developmental progressions in self-feeding.
WIC ITFPS-2 study children are consuming a varied diet as they move into the second year, including fruits, vegetables, dairy, and meats and other proteins. Many of the most commonly consumed foods are those included in the WIC food packages.
Some practices and outcomes are less encouraging, and warrant monitoring as WIC ITFPS-2 continues:
By 24 months, 52 percent of study children are consuming a dessert or candy, 23 percent are consuming a sugar-sweetened beverage, and 24 percent are consuming a salty snack on a given day.
Around the time of their second birthday, 23 percent of children fall with the World Health Organization’s high weight-for-length range.

WIC Infant and Toddler Feeding Practices Study-2: Second Year Report 7-2
7.1.1 Work, School, Child Care, and Breastfeeding
There is a steady increase over time in the percentage of WIC ITFPS-2 caregivers who are working. By 24 months, nearly half (48%) of WIC ITFPS-2 caregivers are working. A small but notable percentage (between 7 and 8%) both work and attend school. Most employed, breastfeeding mothers (85%) report that they have at least one workplace accommodation for pumping breastmilk. Full-time employed mothers breastfeed at lower rates than those who work part-time or do not work; they also have about a month shorter median duration than those not employed, and about 19 days shorter median duration than those employed part-time. About 44 percent of WIC ITFPS-2 children are currently in child care at age 24-months. Although two-thirds of WIC ITFPS-2 children in regular child care continue to be cared for in private homes (either their own or someone else’s), there is a dramatic increase between 3 and 24 months in the percentage of WIC ITFPS-2 children in day care centers (9% to 23%). The majority of breastfeeding mothers who use regular child care provide pumped breastmilk for their children to consume at child care. Between 3 and 24 months there is an increase in the percentage of child care providers who provide the food for children, and a concomitant decline in the percentage of mothers who provide the food for their children in child care. This trend is evident even if breastfeeding mothers are excluded from the analysis. This schedule of introduction of baby food, table food, and cow’s milk at child care is generally consistent with trends in WIC ITFPS-2 homes. 7.1.2 Complementary Feeding Practices
Complementary feeding practices among WIC ITFPS-2 caregivers are showing expected progressions from infancy and into the second year in purchasing, food preparation, methods of feeding, and the promotion of self-feeding skills. At both 7 and 15 months, approximately 9 in 10 mothers agree that the WIC food package allows them to purchase foods they would typically feed their children. Among caregivers who prepare homemade baby foods, most are mashing (61%) or pureeing (57%) foods at 7 months. By 13 months, however, fewer caregivers are pureeing food (36%) and more are offering chopped or diced foods (87%). WIC ITFPS-2 caregivers are following expected progressions in feeding practices. By 5 months of age, 65 percent of caregivers report using a spoon to feed their infants. At 9 months, 34 percent of infants are drinking from a cup held by someone else, and 56 percent are using sippy cups, but only 5 percent are drinking from an open cup without assistance. Bottle use does continue into the

WIC Infant and Toddler Feeding Practices Study-2: Second Year Report 7-3
second year of life, although WIC recommends discontinuing bottle-feeding after the infant year. At 13 months, 53 percent of WIC ITFPS-2 infants are still drinking from a bottle at least occasionally. Expected progressions in self-feeding continue through 18 months. Ninety-seven percent of WIC ITFPS-2 infants are picking up food with their fingers to self-feed at 13 months. By 18 months, 66 percent of children are feeding themselves with a spoon, and almost half (49%) are able to drink from an open cup without assistance. 7.1.3 Food Intake, Meals, and Snacks
WIC ITFPS-2 study children are consuming a varied diet as they move into the second year of life, including fruits, vegetables, dairy, and meats and other proteins. They are also, however, increasing their consumption of desserts, candy, sugar-sweetened beverages, and salty snacks. By 24 months, 70 percent of the children are consuming any non-juice fruit, 70 percent are consuming 100 percent juice, and 62 percent are consuming any vegetable on a given day. Consumption of dairy products is low during the infant year; but by 24 months, 85 percent of children are drinking cow’s milk on a given day, 36 percent are consuming cheese, and 19 percent are consuming yogurt. Ninety-six percent of the children are consuming a meat or another protein source on a given day at 24 months. Consumption of desserts and candy, sugar-sweetened beverages, and salty snacks accelerates during the second year of life. By 24 months, 52 percent of study children are consuming a dessert or candy on a given day, driven in part by the percentage consuming cookies (20%) and candy (16%). Also at 24 months, 23 percent of the children are consuming a sugar-sweetened beverage, and 24 percent are consuming a salty snack, on a given day. Meal and snack patterns stabilize quickly during the second year of life; and by 24 months, almost all children are eating breakfast (98%), lunch (94%), and dinner (95%). By 24 months, 80 percent of children are also eating at least one snack between meals. At 13 and 24 months, the most commonly consumed foods at each eating occasion represent many of the foods contained in the WIC food package for children.

WIC Infant and Toddler Feeding Practices Study-2: Second Year Report 7-4
7.1.4 Nutrient Intake
WIC ITFPS-2 children have median nutrient intake levels that mostly meet or exceed recommended levels through 24 months of age. Between 5 and 24 months, median energy intakes increase for both male and female children. Median nutrient intakes generally meet or exceed adequate intake levels during the infant year. Vitamin D is a notable exception, falling below recommended levels at all ages. During the second year of life, estimates of the prevalence of inadequate intakes are the highest for vitamin D and vitamin E. Iron and zinc intake, which are nutrients of particular concern for infants (Baker & Greer, 2010; Butte, Lopez-Alarcon, & Garza, 2002), each have estimated prevalence of inadequate intake below 20 percent during the first year of life, and below 5 percent during the second year of life. Infants who receive the partially (mostly) breastfed food package from WIC at 6 months are below recommended levels for all nutrients at the time of the 7-month interview. At the time of the 11-month interview, however, infants receiving the partially (mostly) breastfed food package rebound to a level at or above recommended levels of nutrients. 7.1.5 Weight and Growth
About 16 percent of WIC ITFPS-2 infants are high weight-for-length in early infancy. Around the time of the second birthday, 23 percent are. This change represents a striking increase in the percent of WIC ITFPS-2 children in the high weight-for-length group. Further examination of these trends as the children move beyond the second year of life will be necessary to understand the full pattern that is emerging. In bivariate analyses, few socio-demographic or behavioral variables emerge as statistically significant predictors of high weight-for-length across the first 2 years of life. Breastfeeding duration, however, is positively related to weight-for-length status around the second birthday: children who are never breastfed, or breastfed less than 2 months, are significantly more likely to be high weight-for-length, whereas children who are breastfed at least 13 months are significantly less likely to be high weight-for-length. In multivariate analyses, the only feeding practice that significantly increases the odds of high weight-for-length around the second birthday is the introduction of complementary foods prior to 4 months of age. Time the child spends playing video games also increases the odds of being high weight-for-length, as does high birth weight.
WIC Infant and Toddler Feeding Practices Study-2: Second Year Report 7-5
7.2 Interpreting the Data: Study Limitations
As with all research studies, design decisions and study-specific goals for WIC ITFPS-2 result in limitations to the conclusions that the study team can draw, both now and in future analyses. These limitations are most evident with regard to establishing causal relations, generalizing beyond the population represented by our probability sample, comparing data to WIC IFPS-1 findings and other national studies, and disentangling caregiver perceptions of her experiences from actual experiences. 7.2.1 Establishing Causal Relations
This is an observational study, which is a design well-suited to studying the influences of ongoing public programs. Under such circumstances, randomly assigning participants to a treatment group that gets the program and a control group that does not get program is not possible. Additionally, because WIC reaches a substantial portion of its eligible population there is no naturally occurring large, well-matched, unbiased comparison group available. As such, WIC ITFPS-2 also lacks a non-WIC comparison group. Because of this observational study design, however, the study team can only infer causality between program predictors and outcomes rather than establishing it with certainty. 7.2.2 Generalizing Findings
The study team is also limited in generalization of the findings by the study eligibility rules and sample design. Eligible mothers were either pregnant, or their infants were less than 3 months old, and they were enrolling in WIC for the first time for that pregnancy or child. Mothers were at least 16 years old at the time of enrollment, and spoke either English or Spanish. The study team chose these eligibility characteristics to be inclusive of a large portion of the WIC population. Nonetheless, there may be characteristics or feeding patterns not captured that pertain to mothers who are very young, who speak a language other than English or Spanish, or who enroll in WIC for the first time after 3 months postpartum. Similarly, the weighted sample represents the infants from the population who enrolled in WIC during our 20-week enrollment period. It does not represent a full year of WIC enrollments, and if there were strong seasonal differences in WIC enrollees, the sample

WIC Infant and Toddler Feeding Practices Study-2: Second Year Report 7-6
would not capture that full variation. This issue may be particularly relevant when seeking to understand discrepancies between weight-for-length outcomes in the WIC ITFPS-2 sample and studies that comprise the entire WIC population’s administrative data. 7.2.3 Comparisons to Other Studies
One of the goals of WIC ITFPS-2 is to examine how the feeding choices and practices of WIC mothers have changed since the WIC Infant Feeding Practices Study (WIC IFPS-1), 20+ years ago, and to compare findings from WIC ITFPS-2 to other studies such as the Food and Drug Administration’s Infant Feeding Practices Study II (FDA IFPS-II) and the Gerber/Nestle Feeding Infants and Toddler Studies (FITS) 2002 and 2008. Although this report describes many comparisons to other studies’ findings, these are comparisons of the magnitude of the findings, and not tests of the statistical significance of those differences. As the standard errors of the weighted estimates from WIC IFPS-1 and the FITS studies are not consistently available for analysis, it is not possible to conduct valid statistical comparison between the studies. Additionally, the studies’ methodologies, including timing of all interviews and populations included, would need to be more clearly aligned than is possible while still meeting other important goals of WIC ITFPS-2. To ensure that comparisons between WIC ITFPS-2 and other studies are robust, the study team focuses on describing differences that are large in magnitude, and that are comparable in nature and developmental stage. 7.2.4 Influence of Caregiver Perceptions
Most of the study data about individual experiences and practices come from caregiver report during telephone interviews. Although the study team collects some data from WIC State Agencies and sites that are used in analyses, including data on food package prescriptions and child weight and length, most data rely on caregiver responses, and are therefore filtered through the perceptions and memories of those caregivers. Primary caregivers are the most knowledgeable informants about dietary intake and their feeding practices with their children, however, all reports that rely primarily on a single informant may contain some elements of bias or misreporting. Other major studies of feeding practices have also relied on caregiver report, thus WIC ITFPS-2 is not unusual in this structure. Nonetheless, busy caregivers may at times be imperfect informants.

WIC Infant and Toddler Feeding Practices Study-2: Second Year Report 7-7
7.2.5 Estimation of Breastmilk Intake
One of the largest sources of data for this study is the 24-hour dietary recalls. Because breastmilk fed from the breast cannot be measured directly, during the 24-hour recall the caregiver cannot report quantities of breastmilk the infant consumed from the breast. For such circumstances WIC ITFPS-2 follows procedures established in the literature (Butte et al., 2010; Heinig, Nommsen, Peerson, Lonnerdal, & Dewey, 1993), using the child’s age and breastfeeding exclusivity status to estimate intake quantity on a given day (see Appendix B4 for more information on quantifying breastmilk intake). Although use of these estimation procedures is unavoidable given the study design, it may introduce bias into the intake data of infants who are fed directly from the breast if the estimates are not fully accurate. 7.2.6 Scope of the Study
Finally, WIC ITFPS-2 will follow this national sample of study children until they turn 5 years old. While this is an unprecedented opportunity, and the study will yield many years of rich data, not all issues related to childhood weight and health outcomes are apparent by age 2, and may not even be apparent by age 5. Although children are no longer eligible for WIC benefits after their fifth birthdays, earlier WIC participation or continued participation by still-eligible family members, and factors beyond those explored in this study may influence, and continue to influence, eating and health as obesity risk continues into middle childhood and beyond. 7.3 Next Steps
This second year report, which follows the release of two previous WIC ITFPS-2 reports (May et al., 2015; May et al., 2017) is the third in what will be a series of reports from the ongoing WIC ITFPS-2. Subsequent reports from the study will cover the through ages 3, 4, and 5 years, examining nutrition, health outcomes, and family feeding practices of WIC children. The data from WIC ITFPS-2, which the Food and Nutrition Service will make available, will also provide scientific researchers and the public with a landmark platform of data from which to pursue further analyses on nutrition and health in children of low-income families.

WIC Infant and Toddler Feeding Practices Study-2: Second Year Report 7-8
There are many research topics from this report that will be carried forward, and further explored, in subsequent WIC ITFPS-2 reports. Two that are particularly notable are:
WIC ITFPS-2 will continue to track median energy and nutrient intake among children beyond the first 2 years of life. Given WIC’s goal of safeguarding the health of low-income children by providing nutritious supplemental foods, it will be important to continue to examine the children’s dietary intakes.
WIC ITFPS-2 will continue to follow the weight and height of WIC children through age 5 years, to understand the future trajectory of high weight-for-length children in this population. Around the time of the second birthday, 23 percent of study children are high weight-for-length. Future reports will determine how high weight-for-length by age 2 years relates to subsequent overweight or obesity status.
In addition to these research topics, there are other questions raised by the findings of this report that warrant future exploration:
WIC mothers who work full-time have a significantly shorter breastfeeding duration than women who do not work, although most employed women report having at least one accommodation at work to facilitate breastfeeding. Future research could delve more in-depth into the mechanisms through which employment influences breastfeeding among WIC mothers, exploring whether job duties, type of work, or workplace support for breastfeeding, either individually or in combination, are associated with breastfeeding choices.
Among breastfeeding mothers using regular child care at 3 months, 20 percent reported their infants did not receive breastmilk at child care. The current study did not probe the reasons for this, nor did the questions address the amount of time spent in care daily. Future research could explore in greater depth the decision not to provide breastmilk to an infant in the child care setting, and how this might affect breastfeeding practices in other settings.
Many WIC ITFPS-2 children are moving away from bottle use by the time they are 13 months old. For those children who continue to drink from a bottle, the current study does not provide information on what is being consumed from a bottle, and when. Beverages such as milk or juice pose a risk for childhood caries that water does not, and putting a child down to sleep with a bottle poses a level of risk for caries that use during waking hours may not. Future research could explore in more detail what the patterns of bottle use are in the WIC population after 13 months.
At 7 months, infants who were issued the partially (mostly) breastfed food package at 6-month mid-certification have significantly lower energy intake, and consequently significantly lower nutrient intake, than infants who were issued fully breastfeeding or fully formula feeding food packages. Although these intake deficits correct themselves by 11 months, further research is needed to understand the details of the feeding practices that are leading to this issue among the partially (mostly) breastfed package recipients, and how WIC could educate and support mothers to reduce this problem.

WIC Infant and Toddler Feeding Practices Study-2: Second Year Report R-1
References
Agostoni, C., Baselli, L., and Mazzoni, M. B. (2013). Early nutrition patterns and diseases of adulthood: a plausible link? European Journal of Internal Medicine, 24(1), 5-10.
Ahluwalia, N., Herrick, K., Rossen, L.M., Rhodes, D., Kit, B., Moshfegh, A., and Dodd, K.W. (2016). Usual nutrient intakes of US infants and toddlers generally meet or exceed Dietary Reference Intakes: findings from NHANES 2009–2012. The American Journal of Clinical Nutrition, 104(4), 1167-1174.
Ahuja, J.K., Montville, J.B., Omolewa-Tomobi, G., Heendeniya, K.Y., Martin, C. L., Steinfeldt, L. C., Anand, J., Adler, M.E., LaComb, R.P., and Moshfegh, A.J. (2012). USDA Food and Nutrient Database for Dietary Studies, 5.0–Documentation and User Guide. Beltsville, MD: U.S. Department of Agriculture, Agricultural Research Service, Food Surveys Research Group.
Aldrich, H., and Gance-Cleveland, B. (2016). Comparing weight-for-length status of young children in two infant feeding programs. Maternal and Child Health Journal, 20(12), 2518-2526.
American Academy of Pediatrics (AAP). (2012). Policy statement: Breastfeeding and the use of human milk. Pediatrics, 129(3), e827–e841. doi:10.1542/peds. 2011-3552.
American Academy of Pediatrics (AAP). (2016). Food and feeding-age specific content. Retrieved from https://www.aap.org/en-us/advocacy-and-policy/aap-health-initiatives/HALF-Implementation-Guide/Age-Specific-Content/Pages/Age-Specific-Content.aspx on May 8, 2017.
Arenz, S., Rückerl, R., Koletzko, B., and von Kries, R. (2004). Breast-feeding and childhood obesity—a systematic review. International Journal of Obesity, 28(10), 1247-1256.
Baird, J., Fisher, D., Lucas, P., Kleijnen, J., Roberts, H., and Law, C. (2005). Being big or growing fast: Systematic review of size and growth in infancy and later obesity. BMJ, 331(7522), 929.
Baker, R.D., and Greer, F.R. (2010). Diagnosis and prevention of iron deficiency and iron-deficiency anemia in infants and young children (0–3 years of age). Pediatrics, 126(5), 1040-1050.
Baker, J.L., Michaelsen, K.F., Rasmussen, K.M. and Sorensen, T.I.A. (2004). Maternal prepregnant body mass index, duration of breastfeeding, and timing of complementary food introduction are associated with infant weight gain. American Journal of Clinical Nutrition, 80(6), 1579-1588.
Baydar, N., McCann, M., Williams, R., and Vesper, E. (1997). Final report: WIC infant feeding practices study (Contract No. 53-3198-3-003). Seattle, WA: Battelle.
Bertoia, M.L., Mukamal, K.J., Cahill, L.E., Hou, T., Ludwig, D.S., Mozaffarian, D., Willett, W.C., Hu, F.B., and Rimm, E.B. (2015). Changes in intake of fruits and vegetables and weight change in United States men and women followed for up to 24 years: analysis from three prospective cohort studies. PLOS Medicine, 12(9), p.e1001878.

WIC Infant and Toddler Feeding Practices Study-2: Second Year Report R-2
Boone-Heinonen, J., Tillotson, C. J., O’Malley, J.P., Cottrell, E.K., Gaudino, J.A., Amofah, A., ... and Gold, R. (2017). Characterizing a “big data” cohort of over 200,000 low-income US infants and children for obesity research: The ADVANCE early life cohort. Maternal and Child Health Journal, 21(3), 421-431.
Briefel, R., Kalb, L., Condon, E., Deming, D., Clusen, N., Fox, M., Harnack, L., Gremmill, E., Stevens, M., and Reidy, K. (2010). The feeding infants and toddlers study 2008: Study design and methods. Journal of the American Dietetic Association, 110, S16-S26. doi: 10.1016/j.jada.2010.09.005.
Bruner, A.B., Joffe, A., Duggan, A.K., Casella, J. F., and Brandt, J. (1996). Randomised study of cognitive effects of iron supplementation in non-anaemic iron-deficient adolescent girls. The Lancet, 348(9033), 992-996.
Burdette, H.L., Whitaker, R.C., and Daniels, S.R. (2004). Parental report of outdoor playtime as a measure of physical activity in preschool-aged children. Archives of Pediatrics & Adolescent Medicine, 158(4), 353-357.
Butte, N.F. (2005). Energy requirements of infants. Public Health Nutrition, 8(7a), 953-967.
Butte, N. F., Fox, M. K., Briefel, R. R., Siega-Riz, A. M., Dwyer, J. T., Deming, D. M., and Reidy, K. C. (2010). Nutrient intakes of US infants, toddlers, and preschoolers meet or exceed dietary reference intakes. Journal of the American Dietetic Association, 110(12), S27-S37.
Butte, N.F., Lopez-Alarcon, M.G., and Garza, C. (2002). Nutrient adequacy of exclusive breastfeeding for the term infant during the first six months of life. Geneva, Switzerland: World Health Organization.
Campbell, K.J., Hesketh, K.D., McNaughton, S.A., Ball, K., McCallum, Z., Lynch, J., and Crawford, D.A. (2016). The extended infant feeding, activity and nutrition trial (InFANT Extend) program: A cluster-randomized controlled trial of an early intervention to prevent childhood obesity. BMC Public Health, 16(1), 1.
Carling, S.J., Demment, M.M., Kjolhede, C.L., and Olson, C.M. (2015). Breastfeeding duration and weight gain trajectory in infancy. Pediatrics, 135(1), 111-119.
Carruth, B. R., Ziegler, P. J., Gordon, A., and Hendricks, K. (2004). Developmental milestones and self-feeding behaviors in infants and toddlers. Journal of the American Dietetic Association, 104, 51-56.
Centers for Disease Control and Prevention (CDC). (2009). Obesity prevalence among low-income, preschool-aged children-United States, 1998-2008. Morbidity and Mortality Weekly Report, 58(28), 769.
Cook, J.T., and Frank, D.A. (2008). Food security, poverty, and human development in the United States. Annals of the New York Academy of Sciences, 1136(1), 193-209.
Dennison, B.A., Edmunds, L.S., Stratton, H.H., and Pruzek, R.M. (2006). Rapid infant weight gain predicts childhood overweight. Obesity, 14, 491-499.

WIC Infant and Toddler Feeding Practices Study-2: Second Year Report R-3
Devaney, B., Ziegler, P., Pac, S., Karwe, V., and Barr, S.I. (2004). Nutrient intakes of infants and toddlers. Journal of the American Dietetic Association, 104, 14-21.
Dewey, K.G. (2003). Is breastfeeding protective against child obesity? Journal of Human Lactation, 19(1), 9-18.
Draxten, M., Fulkerson, J.A., Friend, S., Flattum, C.F., and Schow, R. (2014). Parental role modeling of fruits and vegetables at meals and snacks is associated with children’s adequate consumption. Appetite, 78, 1-7.
Fein, S.B., Labiner-Wolfe, J., Scanlon, K.S., and Grummer-Strawn, L.M. (2008a). Selected complementary feeding practices and their association with maternal education. Pediatrics, 122(Supplement 2), S91-S97.
Fein, S.B, Labiner-Wolfe, J., Shealy, K., Li, R., Chen, J., and Grummer-Strawn, L.M. (2008b). Infant feeding intentions study II: Study methods. Pediatrics, 122, S28. doi 0.1542/peds.2008-1315c.
Fisher, J.O., Mitchell, D.C., Smiciklas-Wright, H., and Birch, L.L. (2002). Parental influences on young girls’ fruit and vegetable, micronutrient, and fat intakes. Journal of the American Dietetic Association, 102(1), 58-64.
Fox, M.K., Pac, S., Devaney, B., and Jankowski, L. (2004). Feeding infants and toddlers study: what foods are infants and toddlers eating? Journal of the American Dietetic Association, 104, 22-30.
Freedman, D.S., Sharma, A.J., Hamner, H.C., Pan, L., Panzera, A., Smith, R.B., and Blanck, H.M. (2017). Trends in weight-for-length among infants in WIC from 2000-2014. Pediatrics, 139(1), e20162034.
Fryar, C., Carroll, M., and Ogden, C. (2016). Prevalence of low weight-for-recumbent length, recumbent length-for-age, and weight-for-age among infants and toddlers from birth to 24 months of age: United States, 1999–2000 through 2013–2014. National Center for Health Statistics, July 2016. Retrieved from http://www.cdc.gov/nchs/products/hestats.htm on May 8, 2017.
Giles, L.C., Whitrow, M.J., Davies, M.J., Davies, C.E. Rumbold, A.R., and Moore, V.M. (2015). Growth trajectories in early childhood, their relationship with antenatal and postnatal factors, and the development of obesity by age 9 years: results from an Australian birth cohort study. International Journal of Obesity, 39, 1049-1056.
Goodell, L.S., Wakefield, D.B., and Ferris, A.M. (2009). Rapid weight gain during the first year of life predicts obesity in 2-3 year olds from a low-income, minority population. Journal of Community Health, 34, 370-375.
Grimes, C.A., Szymlek-Gay, E.A., Campbell, K.J., and Nicklas, T.A. (2015). Food sources of total energy and nutrients among US infants and toddlers: National health and nutrition examination survey 2005–2012. Nutrients, 7(8), 6797-6836.
Grummer-Strawn, L.M., Reinold, C.M., Krebs, N.F., and Centers for Disease Control and Prevention (CDC). (2010). Use of World Health Organization and CDC growth charts for

WIC Infant and Toddler Feeding Practices Study-2: Second Year Report R-4
children aged 0-59 months in the United States. Morbidity and Mortality Weekly Report, 59, (No. RR-9), 1-13.
Haisma, H., Coward, W., Albernaz, E., Visser, G., Wells, J. C. K., Wright, A., and Victora, C.G. (2003). Breast milk and energy intake in exclusively, predominantly, and partially breast-fed infants. European Journal of Clinical Nutrition, 57(12), 1633-1642.
Hansen-Petrik, M. (2012). Nutrition: What every parent needs to know. Journal of Nutrition Education and Behavior, 44(2), 194-e3.
Harder, T., Bergmann, R., Kallischnigg, G., and Plagemann, A. (2005). Duration of breastfeeding and risk of overweight: a meta-analysis. American Journal of Epidemiology, 162(5), 397-403.
Hawkins, S.S., Cole, T.J., Law, C., and the Millennium Cohort Study Child Health Group. (2009). An ecological systems approach to examining risk factors for early childhood overweight: findings from the UK Millennium Cohort Study. Journal of Epidemiology & Community Health, 63, 147-155.
He, F., Nowson, C., Lucas, M., and MacGregor, G. (2007). Increased consumption of fruit and vegetables is related to a reduced risk of coronary heart disease: meta-analysis of cohort studies. Journal of Human Hypertension, 21(9), 717-728.
He, F.J., Nowson, C.A., and MacGregor, G.A. (2006). Fruit and vegetable consumption and stroke: meta-analysis of cohort studies. The Lancet, 367(9507), 320-326.
Heinig, M.J., Nommsen, L.A., Peerson, J.M., Lonnerdal, B., and Dewey, K.G. (1993). Intake and growth of breast‐fed and formula‐fed infants in relation to the timing of introduction of complementary foods: the DARLING study. Acta Paediatrica, 82(s385), 999-1006.
Heyman, M.B. (2006). Lactose intolerance in infants, children, and adolescents. Pediatrics, 118(3), 1279-1286.
Heyman, M.B., and Abrams, S.A. (2017). Fruit juice in infants, children, and adolescents: Current recommendations. Pediatrics, e20170967.
IFPS II (2017). Web tables report for the infant feeding practices study II: Data tables, Chapter 7. Retrieved from https://www.cdc.gov/breastfeeding/pdf/ifps/data/ifps2_tables_ch7.pdf on May 3, 2017, last updated April 25, 2017.
Institute of Medicine (IOM). (2000). Dietary reference intakes: Applications in dietary assessment. Washington, DC: The National Academies Press.
Institute of Medicine (IOM). (2005). Dietary reference intakes for energy, carbohydrate, fiber, fat, fatty acids, cholesterol, protein, and amino acids. Washington, DC: The National Academies Press. https://doi.org/10.17226/10490 .
Jensen, R.G. (1995). Handbook of milk composition. San Diego, CA: Academic Press, Inc.

WIC Infant and Toddler Feeding Practices Study-2: Second Year Report R-5
Kant, A.K. (2004). Dietary patterns and health outcomes. Journal of the American Dietetic Association, 104(4), 615-635.
Kim, J., and Gallien, T.L. (2016). Childcare arrangements and infant feeding practices by family structure and household income among US children aged 0 to 2 years. Maternal & Child Nutrition, 12(3), 591-602.
Kim, J., and Mathai, R.A. (2015). Comparison of feeding practices in infants in the WIC Supplemental Nutrition Program who were enrolled in child care as opposed to those with parent care only. Breastfeeding Medicine, 10(7), 371-376.
Kimbro, R.T. (2006). On-the-job moms: Work and breastfeeding initiation and duration for a sample of low-income women. Maternal and Child Health Journal, 10(1), 19-26.
Kleinman, R.E., and Greer, F.R. (2013). Pediatric nutrition, 7th Edition. Elk Grove Village, IL: American Academy of Pediatrics.
Koletzko, B., von Kries, R., Closa, R., Escribano, J., Scaglioni, S., Giovannini, M., ... and Sengier, A. (2009). Lower protein in infant formula is associated with lower weight up to age 2 y: a randomized clinical trial. The American Journal of Clinical Nutrition, 89(6), 1836-1845.
Kozhimannil, K.B., Jou, J., Gjerdingen, D.K., and McGovern, P.M. (2016). Access to workplace accommodations to support breastfeeding after passage of the Affordable Care Act. Women’s Health Issues, 26(1), 6-13.
Larson, N.I., and Story, M.T. (2011). Food insecurity and weight status among US children and families: a review of the literature. American Journal of Preventive Medicine, 40(2), 166-173.
Lozoff, B., Jimenez, E., and Smith, J.B. (2006). Double burden of iron deficiency in infancy and low socioeconomic status: a longitudinal analysis of cognitive test scores to age 19 years. Archives of Pediatrics & Adolescent Medicine, 160(11), 1108-1113.
MacDonald, K., and Parke, R.D. (1986). Parent-child physical play: The effects of sex and age of children and parents. Sex Roles, 15(7), 367-378.
Malik, V.S., Pan, A., Willett, W.C., and Hu, F.B. (2013). Sugar-sweetened beverages and weight gain in children and adults: a systematic review and meta-analysis. The American Journal of Clinical Nutrition, 98(4), 1084-1102.
Mamedova, S., and Redford, J. (2015). Early childhood program participation, from the national household education surveys program of 2012 (NCES 2013-029.REV). Washington, DC: National Center for Education Statistics, Institute of Education Sciences, U.S. Department of Education. Retrieved from https://nces.ed.gov/pubs2013/2013029rev.pdf on May 8, 2017.
May, L., Borger, C., McNutt, S., Harrison, G., Weinfield, N., MacAllum, C., and Montaquila, J. (2015). WIC ITFPS-2 infant report: Breastfeeding initiation. Alexandria, VA: Food and Nutrition Service, U.S. Department of Agriculture.

WIC Infant and Toddler Feeding Practices Study-2: Second Year Report R-6
May, L., Borger, C., Weinfield, N., MacAllum, K., DeMatteis, J., McNutt, S., Whaley, S., Ritchie, L., and Sallack, L. (2017). WIC infant and toddler feeding practices study – 2: Infant year report. Alexandria, VA: Food and Nutrition Service, U.S. Department of Agriculture.
Mei, Z., Ogden, C.L., Flegal, K.M., and Grummer-Strawn, L.M. (2008). Comparison of the prevalence of shortness, underweight, and overweight among US children aged 0 to 59 months by using the CDC 2000 and the WHO 2006 growth charts. The Journal of Pediatrics, 153(5), 622-628.
Mihrshahi, S., Battistutta, D., Magarey, A., and Daniels, L.A. (2011). Determinants of rapid weight gain during infancy: baseline results from the NOURISH randomised controlled trial. BMC Pediatics, 11, 99.
Mirkovic, K.R., Perrine, C.G., Scanlon, K.S., and Grummer-Strawn, L.M. (2014a). In the United States, a mother’s plans for infant feeding are associated with her plans for employment. Journal of Human Lactation, 30(3), 292-297.
Mirkovic, K.R., Perrine, C.G., Scanlon, K.S., and Grummer-Strawn, L.M. (2014b). Maternity leave duration and full-time/part-time work status are associated with US mothers’ ability to meet breastfeeding intentions. Journal of Human Lactation, 30(4), 416-419.
Monteiro, P.O.A., and Victora, C.G. (2005). Rapid growth in infancy and early childhood and obesity in later life – a systematic review. Obesity Reviews, 6, 143-154.
Montonen, J., Knekt, P., Järvinen, R., and Reunanen, A. (2004). Dietary antioxidant intake and risk of type 2 diabetes. Diabetes Care, 27(2), 362-366.
Moshfegh, A.J., Rhodes, D.G., Baer, D.J., Murayi, T., Clemens, J.C., Rumpler, W.V., Paul, D., Sebastian, R., Kuczynski, K., Ingwersen, L., Staples, R., and Cleveland, L. (2008). The US Department of Agriculture Automated Multiple-Pass Method reduces bias in the collection of energy intakes. The American Journal of Clinical Nutrition, 88(2), 324-332.
Moss, B.G., and Yeaton, W.H. (2012). US children’s preschool weight status trajectories: patterns from 9-month, 2-year, and 4-year early childhood longitudinal study-birth cohort data. American Journal of Health Promotion, 26(3), 172-175.
Murphy, S.P., Guenther, P.M., and Kretsch, M.J. (2006). Using the dietary reference intakes to assess intakes of groups: Pitfalls to avoid. Journal of the American Dietetic Association, 106(10), 1550-1553.
Nebeling, L. (2002). Phytochemicals: The color of a healthy diet. Pediatrics Basics, Spring, 99, 1-4.
Ogbuanu, C., Glover, S., Probst, J., Liu, J., and Hussey, J. (2011). The effect of maternity leave length and time of return to work on breastfeeding. Pediatrics, 127:e1414-e1427.
Ogden, C.L., Carroll, M.D., Kit, B.K., and Flegal, K.M. (2014). Prevalence of childhood and adult obesity in the United States, 2011-2012. Journal of the American Medical Association, 311(8), 806-814.

WIC Infant and Toddler Feeding Practices Study-2: Second Year Report R-7
Ong, K.K. (2006). Size at birth, postnatal growth and risk of obesity. Hormone Research in Paediatrics, 65(Suppl. 3), 65-69.
Ong, K.K., Ahmed, M.L., Emmett, P.M., Preece, M.A., and Dunger, D.B. (2000). Association between postnatal catch-up growth and obesity in childhood: prospective cohort study. BMJ, 320(7240), 967-971.
Ong, K.K., Emmett, P.M., Noble, S., Ness, A., and Dunger, D.B. (2006). Dietary energy intake at the age of 4 months predicts postnatal weight gain and childhood body mass index. Pediatrics, 117(3), e503-508.
Ong, K., and Loos, R. (2006). Rapid infancy weight gain and subsequent obesity: Systematic reviews and hopeful suggestions. Acta Paediatrica, 95, 904-908.
Owen, C.G., Martin, R.M., Whincup, P.H., Smith, G.D., and Cook, D.G. (2005). Effect of infant feeding on the risk of obesity across the life course: a quantitative review of published evidence. Pediatrics, 115(5), 1367-1377.
Pan, L., Freedman, D.S., Sharma, A.J., Castellanos-Brown, K., Park, S., Smith, R.B., and Blanck, H.M. (2016). Trends in obesity among participants aged 2-4 years in the special supplemental nutrition program for women, infants, and children – United States, 2000-2014. Morbity and Mortality Weekly Report, , 65(45), 1256–1260. DOI: http://dx.doi.org/10.15585/mmwr.mm6545a2
Parsons, T.J., Power, C., Logan, S., and Summerbell, C.D. (1999). Childhood predictors of adult obesity: A systematic review. International Journal of Obesity, 23(Suppl 8), S1-S107.
Ponza, M., Devaney, B., Ziegler, P., Reidy, K., and Squatrito, C. (2004). Nutrient intakes and food choices of infants and toddlers participating in WIC. Journal of the American Dietetic Association, 104, S71-S79. doi: 10.1016/j.jada.2003.10.018.
Raper, N., Perloff, B., Ingwersen, L., Steinfeldt, L., and Anand, J. (2004). An overview of USDA’s dietary intake data system. Journal of Food Composition and Analysis, 17(3), 545-555.
Rauner, A., Mess, F., and Woll, A. (2013). The relationship between physical activity, physical fitness and overweight in adolescents: A systematic review of studies published in or after 2000. BMC Pediatrics, 13(1), 19.
Ross, A.C., Manson, J.E., Abrams, S.A., Aloia, J.F., Brannon, P.M., Clinton, S. K., ... and Kovacs, C. S. (2011). The 2011 report on dietary reference intakes for calcium and vitamin D from the Institute of Medicine: What clinicians need to know. The Journal of Clinical Endocrinology & Metabolism, 96(1), 53-58.
Saavedra, J.M., Deming, D., Dattilo, A., and Reidy, K. (2013). Lessons from the feeding infants and toddlers study in North America: what children eat, and implications for obesity prevention. Annals of Nutrition and Metabolism, 62(Suppl. 3), 27-36.
WIC Infant and Toddler Feeding Practices Study-2: Second Year Report R-8
Schwartz, K., D’Arcy, H.J.S., Gillespie, B., Bobo, J., Longeway, M., and Foxman B. (2002). Factors associated with weaning in the first 3 months postpartum. Journal of Family Practice, 51(5), 436-444.
Seach, K.A., Dharmage, S.C., Lowe A.J., and Dixon, J.B. (2010). Delayed introduction of solid feeding reduces child overweight and obesity at 10 years. International Journal of Obesity, 34, 1475-1479.
Sekhobo, J.P., Edmunds, L.S., Reynolds, D.K., Dalenius, K., and Sharma, A. (2010). Trends in prevalence of obesity and overweight among children enrolled in the New York State WIC program, 2002–2007. Public Health Reports, 125(2), 218-224.
Siega-Riz, A.M., Deming, D.M., Reidy, K.C., Fox, M.K., Condon, E., and Briefel, R.R. (2010). Food consumption patterns of infants and toddlers: where are we now? Journal of the American Dietetic Association, 110(12), S38-S51.
Skinner, J. D., Ziegler, P., Pac, S., and Devaney, B. (2004). Meal and snack patterns of infants and toddlers. Journal of the American Dietetic Association, 104, 65-70.
Special Supplemental Nutrition Program for Women, Infants, and Children (U.S.), Commodity Supplemental Food Program (U.S.). (2009). Infant nutrition and feeding: A guide for use in the WIC and CSF programs. Washington, DC: U.S. Department of Agriculture, Food and Nutrition Service, Special Supplemental Nutrition Program for Women, Infants, and Children (WIC).
Steinkuller, J.S., Chan, K., and Rinehouse, S.E. (1992). Prechewing of food by adults and streptococcal pharyngitis in infants. The Journal of Pediatrics, 120(4), 563-564.
Taveras, E.M., Gillman, M.W., Kleinman, K., Rich-Edwards, J.W., and Rifas-Shiman, S.L. (2010). Racial/ethnic differences in early-life risk factors for childhood obesity. Pediatrics, 125(4), 686-695.
Taveras, E.M., Rifas-Shiman, S.L., Belfort, M.B., Kleinman, K.P., Oken, E., and Gillman, M.W. (2009). Weight status in the first 6 months of life and obesity at 3 years of age. Pediatrics, 123(4), 1177-1183.
Thomas-Jackson, S.C., Bentley, G.E., Keyton, K., Reifman, A., Boylan, B., and Hart, S.L. (2016). In-hospital breastfeeding and intention to return to work influence mothers’ breastfeeding intentions. Journal of Human Lactation, 32(4), 76-83.
U.S. Department of Agriculture and U.S. Department of Health and Human Services. (2011). Dietary guidelines for Americans, 2010. Washington, DC: U.S. Government Printing Office.
Victora, C.G., Barros, F.C., Horta, B.L., and Martorell, R. (2001). Short-term benefits of catch-up growth for small-for-gestational-age infants. International Journal of Epidemiology, 30(6), 1325-1330.
Victora, C.G., Morris, S.S., Barros, F.C., Horta, B.L., Weiderpass, E., and Tomasi, E. (1998). Breast-feeding and growth in Brazilian infants. The American Journal of Clinical Nutrition, 67(3), 452-458.

WIC Infant and Toddler Feeding Practices Study-2: Second Year Report R-9
Wagner, C.L., and Greer, F.R. (2008). Prevention of rickets and vitamin D deficiency in infants, children, and adolescents. Pediatrics, 122(5), 1142-1152.
Wasser, H.M., Thompson, A.L., Siega-Riz, A.M., Adair, L.S., Hodges, E.A., and Bentley, M.E. (2013). Who’s feeding baby? Non-maternal involvement in feeding and its association with dietary intakes among infants and toddlers. Appetite, 71, 7-15.
Weng, S.F., Redsell, S.A., Swift, J.A., Yang, M., and Glazebrook, C.P. (2012). Systematic review and meta-analyses of risk factors for childhood overweight identifiable during infancy. Archives of Disease in Childhood, 97, 1019-1026.
Winter, J.D., Langenberg, P., and Krugman, S. (2010). Newborn adiposity by body mass index predicts childhood overweight. Clinical Pediatrics, 49(9), 866-870.
Woo Baidal, J.A., Locks, L.M., Cheng, E.R., Blake-Lamb, T.L., Perkins, M.E., and Taveras, E.M. (2016). Risk factors for childhood obesity in the first 1,000 days: A systematic review. American Journal of Preventive Medicine, 50(6), 761-779.
World Cancer Research Fund. (2007). Physical activity, and the prevention of cancer: A global perspective. Washington, DC: Author.
Ziegler, P., Briefel, R., Clusen, N., and Devaney, B. (2006). Feeding infants and toddlers study (FITS): Development of the FITS survey in comparison to other dietary survey methods. Journal of the American Dietetic Association, 106(1), 12-e1.