wider working paper 2014/130 · wider working paper 2014/130 ... nature of occupational...
TRANSCRIPT
World Institute for Development Economics Research wider.unu.edu
WIDER Working Paper 2014/130
Skills-biased labour demand and the pursuit of inclusive growth in South Africa
Haroon Bhorat,1 Sumayya Goga,2 and Benjamin Stanwix1
October 2014
1Development Policy Research Unit, University of Cape Town; 2Pegasys; corresponding author: [email protected]
This paper has been presented at the UNU-WIDER ‘Conference on Inclusive Growth in Africa: Measurement, Causes, and Consequences’, held 20-21 September 2013 in Helsinki, Finland.
Copyright © The Authors 2014
ISSN 1798-7237 ISBN 978-92-9230-851-3
Typescript prepared by Liisa Roponen for UNU-WIDER.
UNU-WIDER gratefully acknowledges the financial contributions to the research programme from the governments of Denmark, Finland, Sweden, and the United Kingdom.
The World Institute for Development Economics Research (WIDER) was established by the United Nations University (UNU) as its first research and training centre and started work in Helsinki, Finland in 1985. The Institute undertakes applied research and policy analysis on structural changes affecting the developing and transitional economies, provides a forum for the advocacy of policies leading to robust, equitable and environmentally sustainable growth, and promotes capacity strengthening and training in the field of economic and social policy-making. Work is carried out by staff researchers and visiting scholars in Helsinki and through networks of collaborating scholars and institutions around the world.
UNU-WIDER, Katajanokanlaituri 6 B, 00160 Helsinki, Finland, wider.unu.edu
The views expressed in this publication are those of the author(s). Publication does not imply endorsement by the Institute or the United Nations University, nor by the programme/project sponsors, of any of the views expressed.
Abstract: This paper examines the changing nature of occupational labour-market trends in South Africa and the resulting impact on wages. We observe high levels of demand for skilled labour that have intensified a trend already established before 1994. Over the period 2001-12 employment within the primary sectors collapsed, employment in the manufacturing sector did not increase, while employment in the tertiary sectors such as financial services and community services grew. High- and medium-skilled occupations such as managers, professionals, service and sales workers have seen significant growth while the number of low-skilled workers, and the proportion of medium-skilled workers in the primary and secondary sectors of the economy have declined. In addition, an analysis of occupation demand using a Katz-Murphy decomposition model further shows that within-sector shifts outweigh between-sector shifts in explaining changes in relative labour demand. Increasing demand for skilled labour has also fed into and changed the structure of wages, and therefore wage inequality. We follow the work by Firpo et al. (2011) in an attempt to explore the way in which the returns to certain tasks (rather than occupations) have changed over time. This approach emphasizes the influence of structural factors such as technology and trade, in the presence of increasingly routinized tasks and offshoring, on wages. We run quantile regressions which suggest that, when controlling for age/experience, race and education, jobs which involve automated or routine tasks and those without any face-to-face component (largely lower- to medium-skilled jobs) have seen declining wage levels over time.
Keywords: skills, employment, South Africa, wages, occupations JEL classification: E24, J21, J24, O14, O55
1
1 Introduction
Between 1970 and 1994, there was a deepening of capital in the South African economy accompanied by a shift away from primary sectors towards secondary and tertiary sectors. Employment in the primary sector (agriculture and mining) fell, while the other two created work in increasing numbers, with the financial and business activities sector showing the biggest gains in employment. A similar trend developed within sectors, where the demand for high-skilled occupations in the primary and secondary sectors increased, while the demand for unskilled workers declined. This yielded a strongly skills-biased labour demand trajectory. Factors such as technological change within firms or the relatively lower price of capital to labour in the later years of apartheid have been some of the explanations for the changing preference of firms from lower to higher-skilled workers (Bhorat and Hodge 1999; Bhorat 2000).
More broadly, employment trends since the transition from apartheid have been a function of a variety of factors, such as structural changes in the composition of output, as well as demand shifts within industries (Bhorat and Hodge 1999; Edwards 2001; Dunne and Edwards 2006). Key changes include declining primary sector employment, increasing tertiary sector employment, as well as an increasingly large public sector employment role. The losers have been the less skilled workers while the winners, invariably, have been the better-educated, skilled workers. In a context of high unemployment, orthodox economic theory would predict that the labour market would shift to absorb the less skilled workers. This, however, has not been the case and instead there has been an intensification of a skills-biased labour demand trajectory established in the pre-1994 period. The trend has been exacerbated by global economic interactions such as increased trade, global competition and technological spillovers.
Increasing demand for skilled labour has also fed into and changed the structure of wages and therefore wage inequality. Most international studies on changes in inequality and the wage structure focus on changes in the returns to education and experience (e.g., Katz and Murphy 1992) or on the role of institutions (e.g., DiNardo et al. 1996).1 Recent extensions to this work, however, explore the notion of task categories, rather than skills or occupations, to analyse the distributional outcomes from labour market activity. This work emphasizes the role played by technology and trade, in the presence of increasingly routinized tasks and offshoring, in driving wages down. More specifically, the literature suggests that new technologies have not just depressed wages for low-skilled workers but in particular for those involved in performing routine or ‘offshorable’ tasks, many of whom are often in the middle of the wage distribution. We examine the South African experience in this regard.
This paper will consider the skill-biased demand trajectory of post-apartheid South Africa over the period 2001 to 2012. Almost twenty years post-apartheid, the South African economy has grown modestly but income inequality has risen and unemployment remains high, diluting the positive impacts of growth. The East-Asian experience has produced the idea that middle-income country growth is generally led by the manufacturing sector, but in South Africa this has not been the case. In addition, while employment has grown, it has not grown fast enough to absorb new labour market entrants in an increasingly youthful population, nor has it benefitted those at the lower end of the income distribution. A key avenue for rising income inequality has been the differential returns to labour, as skilled workers continue to gain significantly more than unskilled workers.2 In this paper we develop the notion of skills-biased labour demand by examining employment and
1 Cited in Firpo et al. (2011).
2 In this paper we focus our attention on wage-earners and do not more broadly consider the major driver of income inequality––the vast number of unemployed individuals earning no income at all.
2
wage trends over a recent 10-year period in what is now a globally integrated economy relatively free of apartheid-era constraints.
The paper is structured as follows. Section 2 briefly describes our data. Section 3 provides a descriptive overview of the changing employment structure of the South African economy by looking at changes between and within sectors. In section 4 we consider, through the use of the Katz and Murphy (1992) decomposition technique, whether between or within-sector forces play a greater role in the changing labour demand. In section 5, through the use of quantile regressions, we explore wage trends in post-apartheid South Africa based on a set of task categories associated with different occupations. We note how the returns to occupational tasks have changed across the wage distribution and over time.
2 Data
South African labour market analysis is shaped by data availability and coverage, gradual improvements in survey design and implementation, and changing definitions. Our analysis uses labour market data from the Labour Force Survey (2001-07, LFS) and the Quarterly Labour Force Survey (2008-11, QLFS). We note that the QLFS differs quite significantly from the LFS in methodological and definitional terms. In particular, the definition of discouraged work-seekers between the two surveys is not the same, thus measures of total labour force and total unemployment are not directly comparable between the two surveys. Employment numbers between the two surveys are, however, comparable.3
Both the LFS and QLFS are rotating panel household surveys with a sample size of roughly 30,000 dwellings in each wave. The LFS has two waves per year while the QLFS has four. In our analysis the data are pooled and treated as repeated cross sections over time, and we use the standard weights provided by Statistics South Africa (StatsSA). Wage data are available in the LFS for the periods 2001-07 and in the QLFS for 2010 and 2011. Importantly, the QLFS wage data are aggregated across quarters and it is not possible to accurately link this information to the particular quarter in which it was collected. However, given that we are interested in annual data here, this should not bias our estimates. Additionally, as QLFS wage data have not yet been widely used, it should be treated with some caution.4 Both surveys include a combination of both point and bracket responses for the income variables, and we transform all brackets into point estimates.5
3 Descriptive overview: between- and within-sector employment shifts
Studies have shown that the South African economy became increasingly capital-intensive prior to 1994, and that this trend was accompanied by structural changes in the economy, with the tertiary sector accounting for a growing share of gross domestic product (GDP) (DPRU 2003). The post-apartheid economy has experienced a continuation of the movement away from primary production towards tertiary production, accompanied by a greater share of employment within the
3 More specifically, the QLFS takes a much more stringent approach to identifying discouraged work-seekers than the LFS. As a result of this, the number of discouraged work-seekers declines dramatically in the QLFS compared to the LFS, and the number of broadly unemployed and the broad unemployment rate are also lower in the QLFS (Yu 2013).
4 Seekings (2014) suggests that South African household survey data may, in fact, underestimate wages, although this needs to be explored in more detail.
5 Specifically, we transformed bracket responses into point responses by random allocation to a uniform distribution within the bracket to maintain variation.
3
tertiary sectors relative to the primary and secondary sectors. These between-sector shifts are discussed later. In addition, there have been within-sector shifts, evident in the increase of higher skilled occupations, as the economy experienced a marked increase in its ratio of skilled workers relative to the unskilled (DPRU 2007). In addition we consider the role of public sector employment growth.
3.1 Between-sector shifts
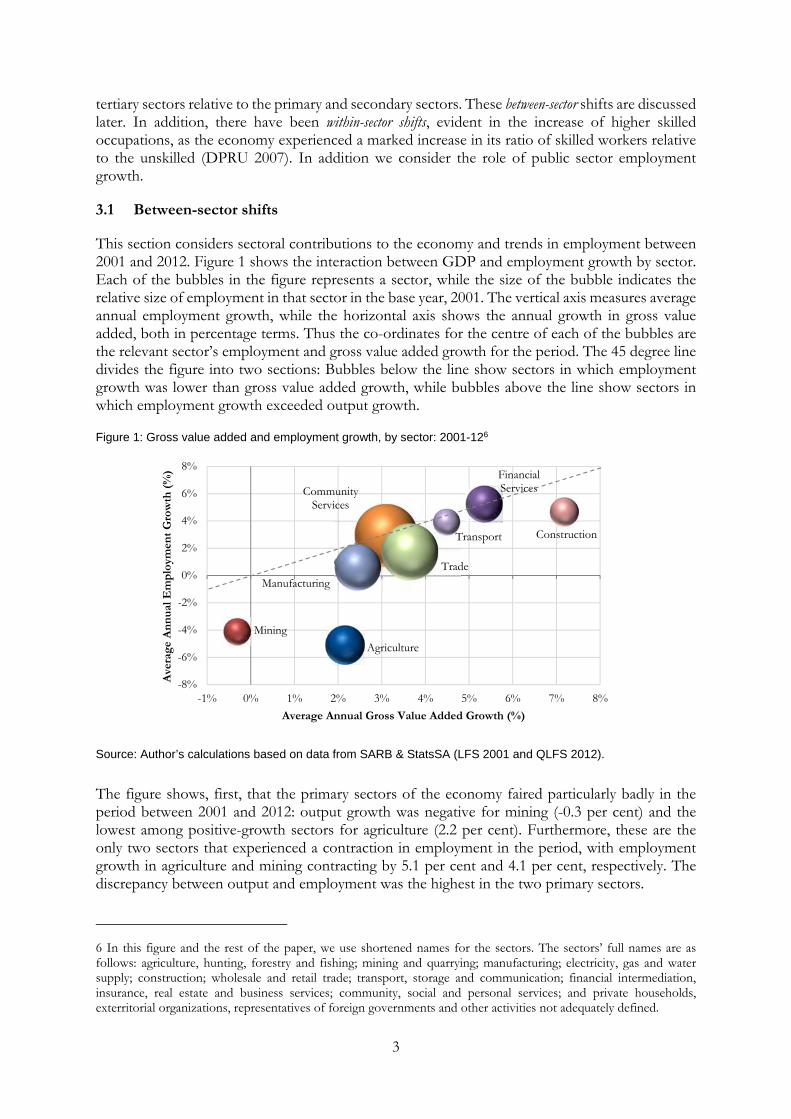
This section considers sectoral contributions to the economy and trends in employment between 2001 and 2012. Figure 1 shows the interaction between GDP and employment growth by sector. Each of the bubbles in the figure represents a sector, while the size of the bubble indicates the relative size of employment in that sector in the base year, 2001. The vertical axis measures average annual employment growth, while the horizontal axis shows the annual growth in gross value added, both in percentage terms. Thus the co-ordinates for the centre of each of the bubbles are the relevant sector’s employment and gross value added growth for the period. The 45 degree line divides the figure into two sections: Bubbles below the line show sectors in which employment growth was lower than gross value added growth, while bubbles above the line show sectors in which employment growth exceeded output growth.
Figure 1: Gross value added and employment growth, by sector: 2001-126
Source: Author’s calculations based on data from SARB & StatsSA (LFS 2001 and QLFS 2012).
The figure shows, first, that the primary sectors of the economy faired particularly badly in the period between 2001 and 2012: output growth was negative for mining (-0.3 per cent) and the lowest among positive-growth sectors for agriculture (2.2 per cent). Furthermore, these are the only two sectors that experienced a contraction in employment in the period, with employment growth in agriculture and mining contracting by 5.1 per cent and 4.1 per cent, respectively. The discrepancy between output and employment was the highest in the two primary sectors.
6 In this figure and the rest of the paper, we use shortened names for the sectors. The sectors’ full names are as follows: agriculture, hunting, forestry and fishing; mining and quarrying; manufacturing; electricity, gas and water supply; construction; wholesale and retail trade; transport, storage and communication; financial intermediation, insurance, real estate and business services; community, social and personal services; and private households, exterritorial organizations, representatives of foreign governments and other activities not adequately defined.
Agriculture
Mining
Community Services
Manufacturing
Construction
Trade
Transport
Financial Services
-8%
-6%
-4%
-2%
0%
2%
4%
6%
8%
-1% 0% 1% 2% 3% 4% 5% 6% 7% 8%
Ave
rage
Ann
ual E
mpl
oym
ent
Gro
wth
(%
)
Average Annual Gross Value Added Growth (%)
4
One factor contributing to declines in agricultural employment was the minimum wage, introduced in March 2003 (Bhorat et al. 2012). For mining, employment growth fell, as did value-added growth. Poor performance of the mining sector can be attributed to a range of factors, including a strongly appreciating rand in the mid-2000s, infrastructural constraints (such as rail transport), the energy constraints in South Africa, and the application of new mining laws (OECD 2008), while widespread strike action in the mining sector in 2010 and 2011 would have exacerbated the problems.7
The three tertiary sectors, namely, financial services, transport, and trade achieved relatively high output growth. Nonetheless, employment growth did not exceed output growth and only the finance and community services sectors experienced employment growth that was close to gross value added growth. Specifically, gross value added growth for the finance and community services sectors stood at 5.4 and 3.1 per cent for the period, while employment growth was 5.3 and 3 per cent, respectively. These two tertiary sectors thus experienced labour-neutral growth, while all other sectors saw output growth that was faster than employment growth.
Among the secondary sectors, output growth in construction was high, at 7.2 per cent, but employment growth in this sector was much lower at 4.7 per cent. The construction boom can be attributed, among other factors, to infrastructure projects related to the 2010 World Cup, the construction of the Gautrain rapid-rail system, and several other public and private sector investment initiatives including those undertaken by Eskom and Transnet (Hanival and Maia 2008). In contrast, neither the manufacturing nor utilities sectors saw a significant increase in employment over the period. The relatively poor employment results for manufacturing can, in part, be linked to the impact of the recession on the South African economy where the manufacturing sector, together with construction, experienced the largest job losses. Semi-skilled workers, in particular, were negatively affected. Furthermore, informal sector workers––mostly captured under trade––were also particularly hard hit during the recession, and accounted for a disproportionate share of jobs lost (DPRU 2010).
Most middle-income countries not in a growth trap should be experiencing manufacturing-led growth but in South Africa this has not been the case and growth seems instead to have been led by the tertiary sector. Employment growth in the period was, on the whole, better in the tertiary sectors than secondary sectors, and was negative in the primary sectors of the economy. More importantly, for a country with extremely high unemployment, two tertiary sectors––finance and community services––are the only sectors which experienced labour-neutral growth.
3.2 Within-sector shifts
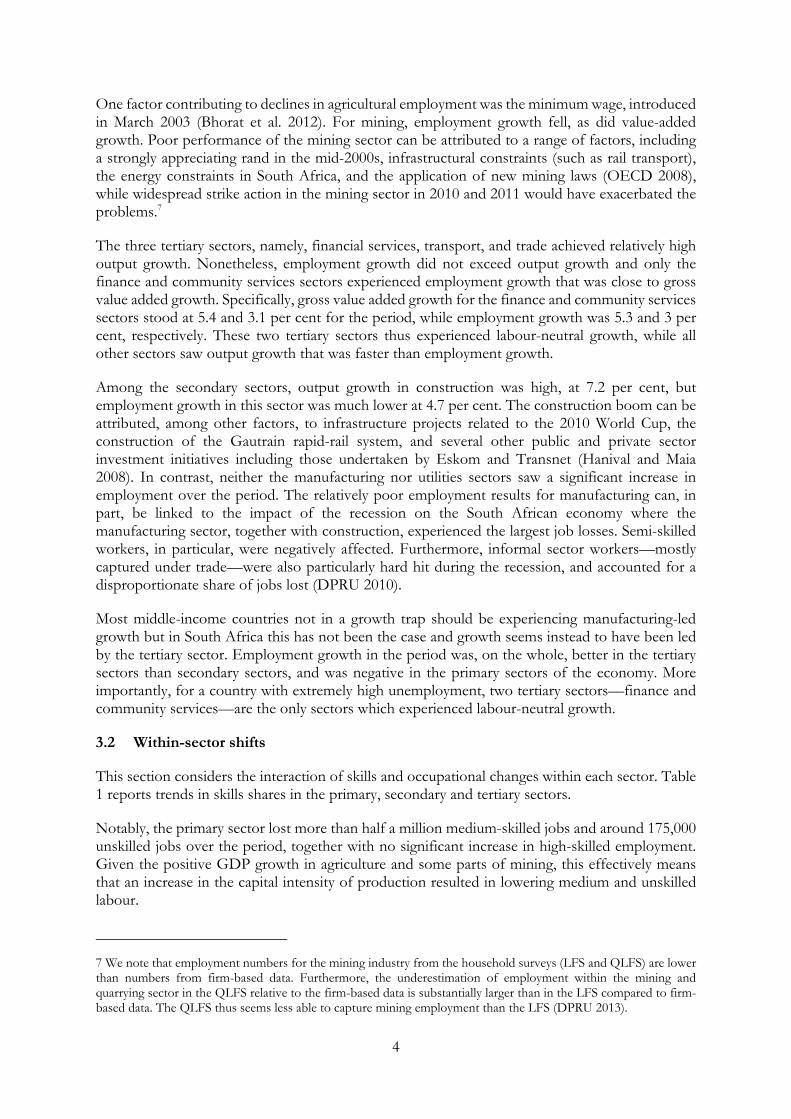
This section considers the interaction of skills and occupational changes within each sector. Table 1 reports trends in skills shares in the primary, secondary and tertiary sectors.
Notably, the primary sector lost more than half a million medium-skilled jobs and around 175,000 unskilled jobs over the period, together with no significant increase in high-skilled employment. Given the positive GDP growth in agriculture and some parts of mining, this effectively means that an increase in the capital intensity of production resulted in lowering medium and unskilled labour.
7 We note that employment numbers for the mining industry from the household surveys (LFS and QLFS) are lower than numbers from firm-based data. Furthermore, the underestimation of employment within the mining and quarrying sector in the QLFS relative to the firm-based data is substantially larger than in the LFS compared to firm-based data. The QLFS thus seems less able to capture mining employment than the LFS (DPRU 2013).
5
Table 1: Changes in skills shares, by sector: 2001-12
Proportions, % Change over 2001-12 in:
2001 2004 2007 2010 2012 Percentage points Numbers
Primary
High skilled 2.9 5.4 4.8 7.2 7.6 4.8 27,602
Medium skilled 54.5 52.5 53.1 35.2 36.8 -17.7 -571,229*
Unskilled 42.6 42.1 42.1 57.6 55.5 12.9 -175,392*
Total 100.0 100.0 100.0 100.0 100.0 -719,232*
Secondary
High skilled 14.2 15.3 16.6 19.0 18.1 3.9 188,518*
Medium skilled 69.8 64.7 63.6 64.2 61.5 -8.3 136,140
Unskilled 16.0 19.9 19.8 16.8 20.4 4.4 214,002*
Total 100.0 100.0 100.0 100.0 100.0 537,376*
Tertiary
High skilled 27.4 27.1 31.8 28.3 29.3 1.9 931,498*
Medium skilled 41.8 41.5 39.8 42.6 42.6 0.8 1,214,349*
Unskilled 30.8 31.4 28.4 29.1 28.1 -2.7 576,288*
Total 100.0 100.0 100.0 100.0 100.0 2,720,821*
Notes: The primary sectors include agriculture and mining; the secondary sectors include manufacturing, utilities and construction; and the tertiary sector includes trade, transport, financial services, community services and private households. High-skilled workers include managers and professionals; medium-skilled workers include clerks, service and sales workers, skilled agricultural and fishery workers, craft and trade workers and operators and assemblers; and unskilled workers include elementary workers and domestic workers.
* denotes a significant change at the 5 per cent level based on a simple t-test in STATA.
Source: Authors’ calculation based on data from StatsSA (LFS 2001 and QLFS 2012).
In the secondary sector, both high-skilled and unskilled employment rose significantly by around 200,000 jobs (increasing by 4 per cent) with no significant rise in the medium-skilled employment in the period (the proportion declined by 8.3). Growth in employment came from growth in the construction sector while the manufacturing sector showed lacklustre growth with no significant impact on employment.
Between 2001 and 2012, employment grew by 2.7 million workers in the tertiary sector. High-skilled and medium-skilled workers accounted for 2.1 million, or more than 70 per cent of the increase in employment, with unskilled employment accounting for the rest of the increase. As a result, both the proportions of high-skilled and medium-skilled workers in the sector rose, while the proportion of unskilled workers declined by 2.7 percentage points. By 2012, high-skilled workers accounted for just under 30 per cent of tertiary sector workers, while medium-skilled and unskilled workers accounted for 42.6 and 28.1 per cent of the tertiary sector, respectively.
Overall, both the secondary and tertiary sectors experienced a rise in the proportion of high-skilled workers while the tertiary sector also saw a declining proportion of low-skilled employment. Dunne and Edwards (2006) show that the majority of employment losses between 1994 and 2003 were likely due to skills-biased technological changes, while trade liberalization also accounts for some of the change. The same story appears to be true here. More specifically, given the growth in output, it appears that firms have found ways to cut costs and raise production by investing in capital and skills and shedding the unnecessary jobs that could be outsourced or replaced. The results show that whilst unskilled employment rose in both secondary and tertiary sectors, the proportion of unskilled workers rose only in the secondary sector. Both the primary and secondary sectors of the economy witnessed dramatically declining proportions of medium-skilled workers.
6
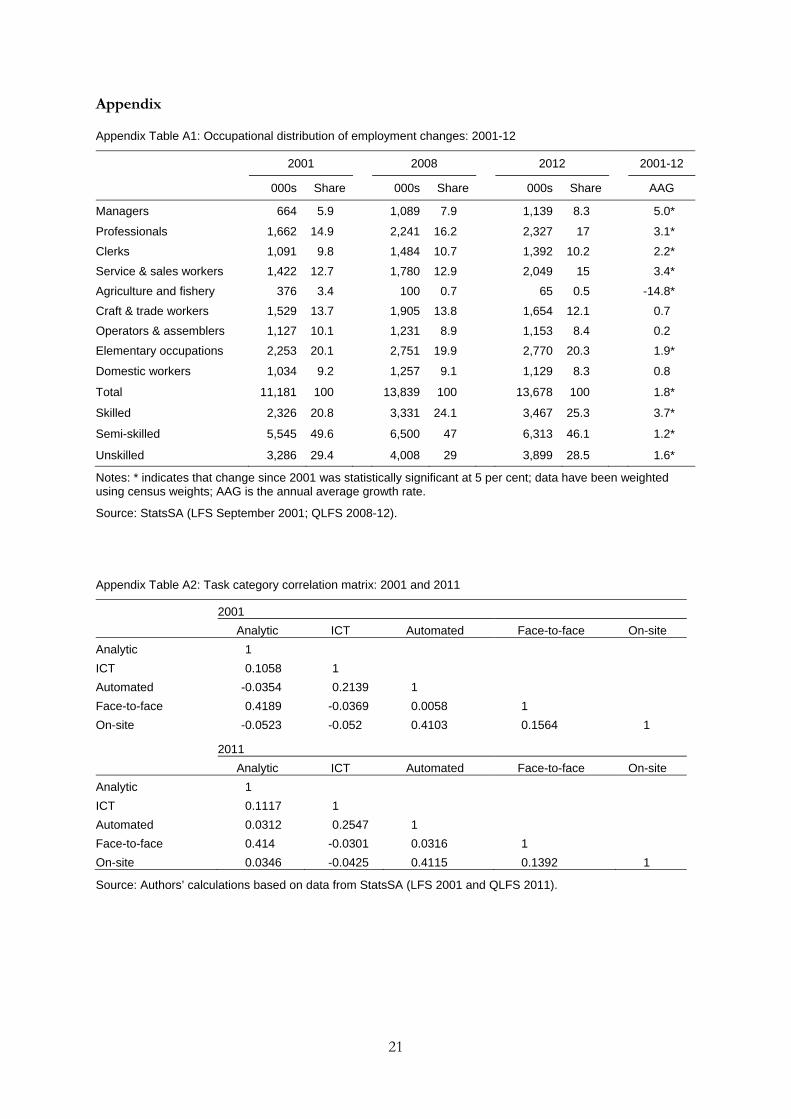
Occupational demand
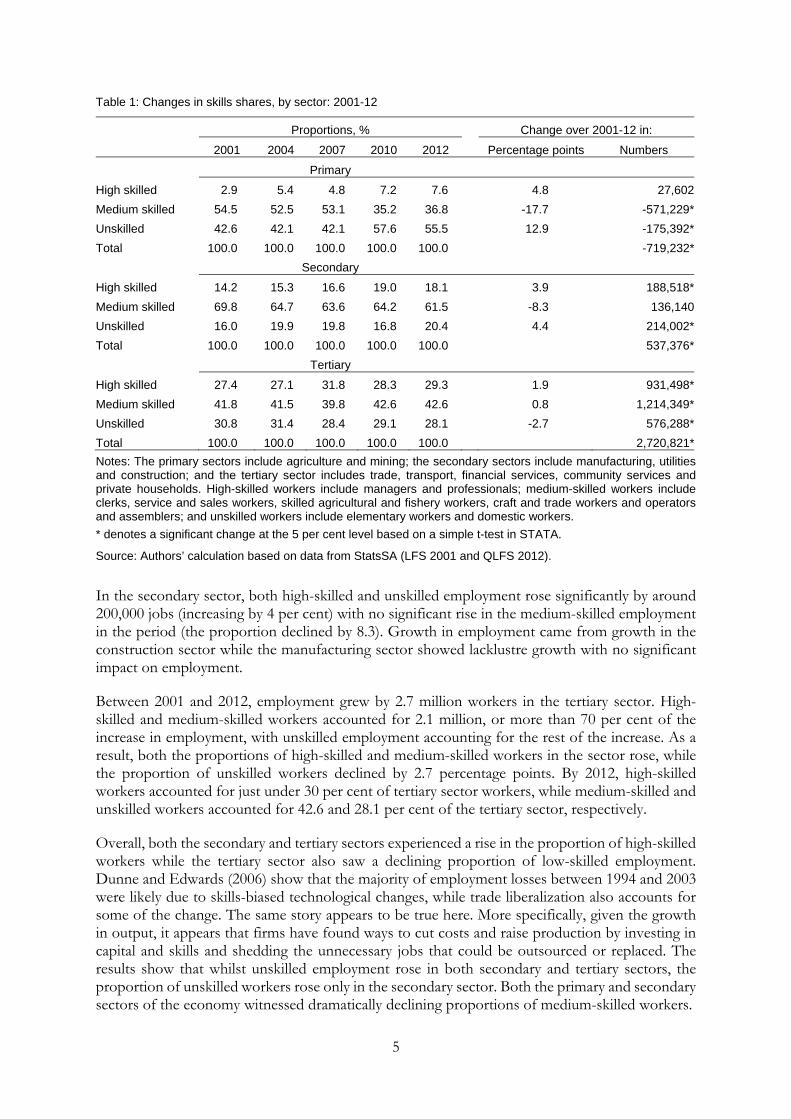
Based on these sectoral shifts, the expected occupational trend is one of increasing skilled labour (i.e., professionals and managers) and a declining share of lower-skilled occupations in total employment. In fact, the employment growth rate for high-skilled occupations was double the overall employment growth rate, while the growth rates for medium and unskilled jobs were 0.6 and 0.8 of the overall growth rate, respectively (see Appendix Table A1). The absolute numbers show that, compared to the number of medium (768,000) and unskilled jobs (613,000), a greater number of high-skilled jobs (1.1 million) was created in the economy between 2001 and 2012. In particular, managers, professionals, and service and sales workers were in high demand over the 2001 to 2012 period, while the demand, in relative terms, for craft and trade workers and operators and assemblers fell. Finally, clerks and elementary workers maintained their status in the labour market, with the growth in employment for these two occupations matching overall employment growth. Thus, although workers across the skills spectrum shared in the employment growth of the period, skilled workers benefitted most, in both absolute and relative terms. In turn, medium-skilled workers were the relative losers in the period.
In Table 2 we consider the employment changes in occupations, by sector, over the period.
Table 2: Occupation increases by sector: 2001-12 (in per cent)
Man
age
rs
Pro
fess
iona
ls
Cle
rks
Ser
vice
and
sa
les
Ski
lled
agric
ultu
re a
nd
fishi
ng
Cra
ft an
d tr
ade
Ope
rato
rs a
nd
asse
mbl
ers
Ele
men
tary
Dom
estic
Tot
al
Agriculture 2 1 -2 1 84 -1 -279 -38 0 -21
Mining -1 2 -5 -1 0 -82 -417 4 0 -8
Manufacturing 8 6 0 2 0 -32 -10 12 0 4
Electricity -1 2 0 -1 0 3 -16 1 0 0
Construction 12 6 9 0 0 109 45 28 0 17
Trade 27 9 49 7 0 56 61 9 0 21
Transport 7 5 6 1 0 -1 528 11 0 12
Financial services 19 29 -5 40 6 34 104 41 0 31
Business activities 1 6 12 37 6 6 67 36 0 20 Other 18 22 -17 3 0 28 37 6 0 11 Community services 25 41 52 52 9 14 88 32 0 42
Private 0 0 0 0 0 0 0 0 100 4
Total 100 100 100 100 100 100 100 100 100 100
Note: The increase in each of the occupation groups over the period (2001 to 2012) is apportioned to the sectors.
Source: Authors’ calculations based on data from StatsSA (LFS 2001 and QLFS 2012).
The table shows that within the primary sector the main shift in agriculture has been the decline in the share of operators and assemblers (-279 per cent) and unskilled elementary workers (-38 per cent). In contrast, there has been an increase in medium-skilled agriculture and fishery occupations (84 per cent). Ultimately a net decline in medium-skilled occupations as well as low-skilled occupations has occurred. There has also been a slight increase of 1-2 per cent in the high skilled occupation groups. In mining, there was a significant decline in medium-skilled occupations through clerks (-5 per cent), craft and trade (-82 per cent) as well as operators and assemblers (-417 per cent). There has also been an increase in low-skilled workers (4 per cent of elementary worker occupations) whilst the high-skilled occupations increased marginally (1 per cent).
7
In the secondary sector, manufacturing has seen an increase in high-skilled occupations through professionals (8 per cent) and managers (6 per cent) as well as an increase in low-skilled occupations through elementary workers (12 per cent). There is a marked decline in medium-skilled occupations through craft (-32 per cent) and trade, and operator and assemblers (-10 per cent). Overall, manufacturing shows lacklustre growth but from the little growth that was experienced, a situation of machines replacing workers on the shop-floor with professional services is reflected. The construction industry experienced high levels of growth and also showed an increase in all occupations with the largest changes in medium-skilled occupations (154 per cent) followed by low-skilled (28 per cent) as with high-skilled occupations (18 per cent). The utilities sector ultimately did not experience a net change in occupations over the period.
In the service sectors, due to the growth levels of the past decade, an increase at all occupation levels is observed, in particular for financial services (31 per cent) and community services (42 per cent). A large proportion of the growth in high-skilled occupations was due to increased community service employment during the period. The trade sector (27 per cent), financial services sector (19 per cent) and construction sector (12 per cent) also accounted for reasonably large increases in managerial employment. In turn, aside from community services, the financial services (29 per cent) sector also accounted for a large proportion of the increase in professional employment in the period. These sectors observed a large increase in service and sales workers, financial services (40 per cent), business and other services (40 per cent) and community services (52 per cent).
In all sectors we observe growing demand for highly skilled professionals and managers. This can be seen in particular in trade, the financial services sector, the business activities sector and community services. The increasing demand for high-skilled labour is replacing unskilled and low-skilled labourers, production workers and basic service workers. A latent effect of this is the increase in non-elementary and production workers.
Public sector employment
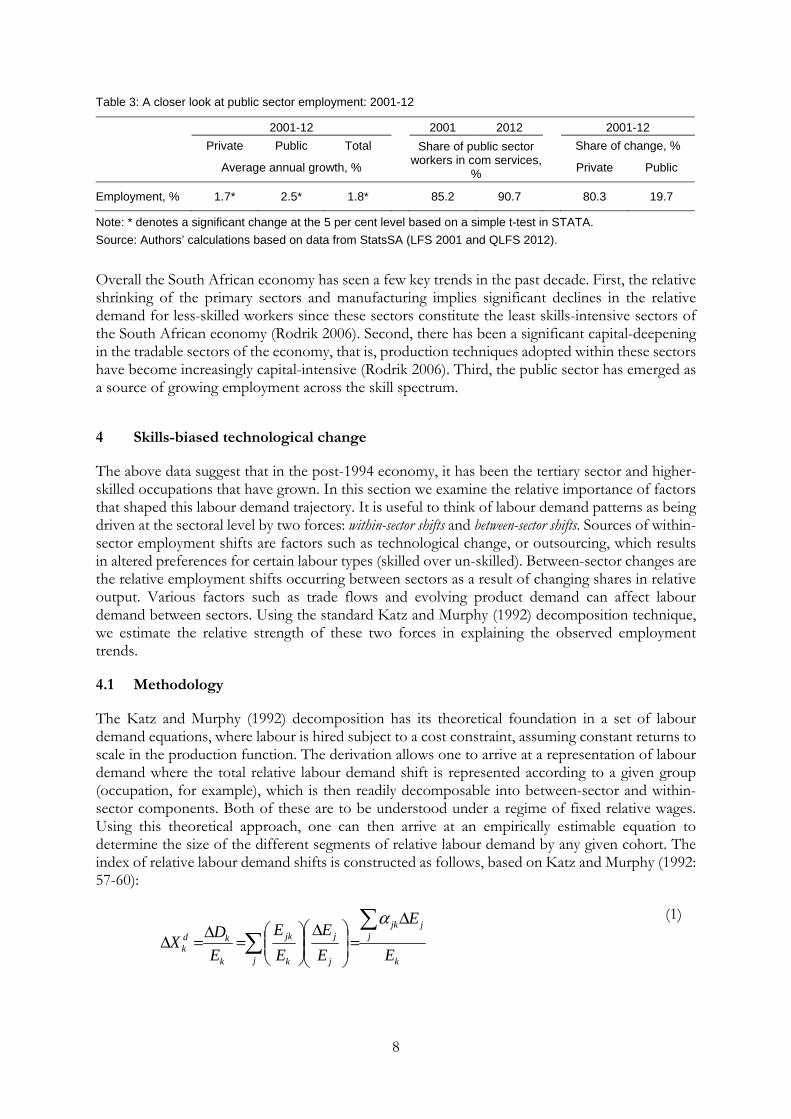
In some respects South Asia has experienced a skills mismatch similar to South Africa. It is argued that many young people leave school or university without the skills needed by employers and, as a result, many of these young people ‘queue’ for a job in the public sector (ILO 2013: 7). We find that the public sector also seems to be the driver of employment growth in South Africa. We note, first, that 85.2 per cent of public sector workers in 2001 (not shown here) were found in the community services sector, and by 2012 more than 90 per cent of all public sector workers were employed within the community services sector. Thus, the community services sector serves as a proxy for public sector employment. Second, Table 3 shows that overall growth in South Africa over the period was driven by public sector rather than private sector growth: the average annual growth rate of public sector employment in the period was 2.5 per cent, while private sector jobs grew at an average annual growth rate of 1.7 per cent. Employment thus grew substantially faster in the public sector.
Third, more disaggregated data in the last two columns of the table show that the public sector accounted for 19.7 per cent of the change in employment in the period, while the private sector accounted for 80.3 per cent of the change in employment in the period. Thus, a fifth of employment growth in the period 2001-12 was due to public sector employment growth.
8
Table 3: A closer look at public sector employment: 2001-12
2001-12 2001 2012 2001-12
Private Public Total Share of public sector workers in com services,
%
Share of change, %
Average annual growth, %
Private Public
Employment, % 1.7* 2.5* 1.8*
85.2 90.7
80.3 19.7
Note: * denotes a significant change at the 5 per cent level based on a simple t-test in STATA.
Source: Authors’ calculations based on data from StatsSA (LFS 2001 and QLFS 2012).
Overall the South African economy has seen a few key trends in the past decade. First, the relative shrinking of the primary sectors and manufacturing implies significant declines in the relative demand for less-skilled workers since these sectors constitute the least skills-intensive sectors of the South African economy (Rodrik 2006). Second, there has been a significant capital-deepening in the tradable sectors of the economy, that is, production techniques adopted within these sectors have become increasingly capital-intensive (Rodrik 2006). Third, the public sector has emerged as a source of growing employment across the skill spectrum.
4 Skills-biased technological change
The above data suggest that in the post-1994 economy, it has been the tertiary sector and higher-skilled occupations that have grown. In this section we examine the relative importance of factors that shaped this labour demand trajectory. It is useful to think of labour demand patterns as being driven at the sectoral level by two forces: within-sector shifts and between-sector shifts. Sources of within-sector employment shifts are factors such as technological change, or outsourcing, which results in altered preferences for certain labour types (skilled over un-skilled). Between-sector changes are the relative employment shifts occurring between sectors as a result of changing shares in relative output. Various factors such as trade flows and evolving product demand can affect labour demand between sectors. Using the standard Katz and Murphy (1992) decomposition technique, we estimate the relative strength of these two forces in explaining the observed employment trends.
4.1 Methodology
The Katz and Murphy (1992) decomposition has its theoretical foundation in a set of labour demand equations, where labour is hired subject to a cost constraint, assuming constant returns to scale in the production function. The derivation allows one to arrive at a representation of labour demand where the total relative labour demand shift is represented according to a given group (occupation, for example), which is then readily decomposable into between-sector and within-sector components. Both of these are to be understood under a regime of fixed relative wages. Using this theoretical approach, one can then arrive at an empirically estimable equation to determine the size of the different segments of relative labour demand by any given cohort. The index of relative labour demand shifts is constructed as follows, based on Katz and Murphy (1992: 57-60):
Δ
=
Δ
=Δ=Δ
j k
jjjk
j
j
k
jk
k
kdk E
E
EE
EE
EDX
α
(1)

9
where X is a production function, the subscript k refers to occupation (or other groups) and j refers to sectors.
The total relative demand shift for group k in the period under consideration is measured by ΔXkd
or k
jjjk
E
E Δα, whereα jk
jk
j
EE
=
is group k’s share of total employment in that sector in the base
year. jEΔ is the change in total labour input in sector j between the two years. This measure
expresses the percentage change in demand for each group as a weighted average of the percentage change in sectoral employment in which the weights are group-specific employment distributions (Katz and Murphy 1992). Note that the between-sector component explaining part of the shift in relative demand for group k is given by ΔDk , while the within-sector shift is simply the difference between the total and between-sector shifts. As with the Katz and Murphy (1992) approach, we normalize total employment in each year to sum to one, and so obtain a measure of relative demand shifts. In addition, the values for α jk and Ek are represented in the base year, which in
this case is 2001.
4.2 Results
The shifts reported are relative demand shifts, which capture more accurately the magnitude of net sectoral employment growth that absolute growth figures tend to mask. We report the within-sector share represented as a share of total relative change in employment. Given the importance of community services as a proxy for public sector employment, we show the relative demand shifts with and without community services in Table 4.
Table 4: Industry-based relative demand shift measures, by occupation: 2001-12
Including community services Excluding community services
Between Within Total % of within
in total Between Within Total % of within
in total High skilled Managers 0.92 12.63 13.32 94.9 0.79 11.10 11.71 94.8 Professionals 3.03 15.04 17.20 87.4 1.13 6.09 7.07 86.1 Medium skilled Clerks 1.59 12.88 14.07 91.6 1.08 9.13 10.01 91.2 Service & sales workers 1.92 11.75 13.23 88.9 1.21 7.69 8.71 88.3 Skilled agric & fishery -0.55 -19.60 -20.47 95.8 -0.62 -22.55 -23.59 95.6 Craft & trade workers 1.35 7.88 9.01 87.4 1.28 7.50 8.58 87.4 Operators & Assembler 0.19 1.63 1.81 90.1 0.12 1.04 1.15 90.0 Unskilled Elementary workers 0.28 1.10 1.37 80.1 -0.17 -0.69 -0.86 79.7 Domestic workers 0.37 3.49 3.83 91.1 0.37 3.49 3.83 91.1
Source: Authors’ calculations based on data from StatsSA (LFS 2001 and QLFS 2012).
Looking at the results including community services first, the table shows a relative increase in demand for all occupation groups in the period, with the high and semi-skilled worker categories faring best. The occupations displaying the highest total relative demand in the period were professionals, followed by clerks, managers and service and sales workers. These increases match the above data well, which showed strong employment growth in sectors such as financial services,
10
community services and trade, together with managers, professionals, service and sales workers and clerks.
The poorest performers in terms of relative demand were elementary workers, operators and assemblers and domestic workers. Thus, the period between 2001-12 was marked by high relative demand for high-skilled occupations, together with some medium-skilled workers (clerks and service and sales workers), while medium-skilled craft and trade workers and operators and assemblers and unskilled workers experienced relatively low demand.
There was significant growth of 517,000 elementary workers in the period between 2001-12 but as a share of employment growth, this number is misleading. The data below report weighted relative shares of employment or the relative performance of occupations given their shares in employment in 2001. The low total relative demand for elementary workers can thus be understood by noting that this occupation group accounted for the largest chunk of employment in 2001––that is, a fifth of all employment––but the growth in employment for this group was slow, as shown in Table 2. The low relative demand for craft and trade workers, and particularly operators and assemblers, is unsurprising; neither of these two occupations saw significant increases in employment in the period between 2001-12, with operators and assemblers displaying particularly poor results.
Importantly, Table 4 shows that for all the occupation groups shown, the within-sector component dominates over the between-sector shifts in explaining the profile of relative demand. This is true particularly of managers where 95 per cent of the increase in relative demand in the period can be explained by intra-sectoral forces. In fact, however, for all other high and medium-skilled workers the share of within-sector relative demand in explaining total relative demand is very high, ranging at between 87 and 96 per cent. In turn, while the within-sector component is also important for elementary workers, its dominance is less striking, reflecting that between-sector forces played a greater role in determining relative demand for this occupation group compared to other occupations. More specifically, these data probably reflect the collapse of unskilled employment in the primary sectors.
Overall, the results including community services show that intra-sectoral force dominates in our analysis of relative demand changes for different occupations over time, while inter-sectoral forces play a larger role in the relative demand of elementary workers compared to all other occupation groups.
In order to isolate the impact of public sector employment, we present the decomposition for all the employed, excluding community services, since public sector workers are found mainly within the community service sector. These results are shown on the right-hand side of Table 4, and illuminate the extent to which government employment may have influenced labour demand.
There are several interesting results. First, the overall labour demand shifts are lower for each of the occupations in the table when community services are excluded. This is unsurprising, given that the community services sector accounted for around 40 per cent of the increase in employment in the 2001-12 period, though we note that not all of this increase can be apportioned to the public sector. Relative demand shifts are lower, in particular, for professionals, and to a lesser extent, clerical and service workers. A more detailed analysis of the industry employment figures reveals that more than 40 per cent of the increase in professionals in the period was accounted for by the community services sector, while more than 50 per cent of the increase in clerks and service and sales workers was accounted for by community service workers. In this context, the lower total relative demand figures, particularly for professionals, clerks and service and sales workers make sense. Second, Table 4 shows that the shares of within- and between-
11
sector forces explaining total relative demand shifts are very similar regardless of whether we include or exclude community services.
Thus, the data in Table 4 show that for all occupations, the within-sector forces in explaining overall relative demand shifts far outweigh the between-sector forces. For all occupations, barring those of elementary workers, the within-sector influence constituted between 86 and 96 per cent of aggregate labour demand shifts. Hence, the forces of technological change, the greater preference for a specific factor mix and so on, have catalysed firms into altering their labour demand practices in a specific manner. Put simply, forces within each sector and firm have been the primary reason for the labour demand changes occurring in the 2001-12 period. It should be noted that the smaller within-sector share of elementary workers is picking up the high attrition of these jobs in the primary sectors of the economy which are in secular decline.
The results from the decomposition match well with descriptive employment shifts. More specifically, in the context of a growth path within which mining and agricultural employment have fallen, together with the creation of higher-skilled jobs in the tertiary sectors, it is unsurprising that the overall relative demand shifts presented here show strong demand for managers, professionals, service and sales workers and clerks. Furthermore, the table shows that medium-skilled craft and trade workers and operators and assemblers and unskilled workers experienced low relative demand, and these results are also unsurprising, in light of the relatively poor performance of manufacturing and the primary sectors.
Given the importance of the public sector for growth in high-skilled and some medium-skilled occupations, the lower total relative demand figures, particularly for professionals, clerks and service and sales workers, when excluding the community services sector, make sense. The importance of within-sector forces in explaining relative demand patterns for medium- and unskilled workers may be a reflection of the fact that sectors such as mining, agriculture, and manufacturing have been in decline due to various internal factors including technological change.
5 Contribution of task-based measures to wage returns
We extend our analysis here to examine the trends in wages that accompanied employment shifts over the period. Traditionally, wage inequality in South Africa and higher returns to skilled workers are explained by inequality in education and experience, and we have seen that over the period employment in higher-skilled jobs has risen (Bhorat 2000). While education and experience account for a large portion of the apparent wage inequality, there may be other (related) factors influencing the wage structure over time that are not directly related to skills. In particular, structural demand-side factors such as increased technological change that favours skilled labour, or the impact of international trade, may also be affecting wages (Kosters 1998; Edwards and Golub 2003).
Recent international literature on skills-biased technological change explores the idea that new technologies have not depressed wages just for low-skilled workers or raised wages for high-skilled workers. New work shows that wages have fallen specifically for those involved in performing routine or ‘offshorable’ tasks, a group often made up of workers in the middle of the distribution (Autor et al. 2003; Goos and Manning 2007; Acemoglu and Autor 2011). This view of technological change moves beyond the high/low skill categories and identifies occupational tasks as a key channel through which wages are affected. The contention is that in addition to skill levels, the tasks performed in different occupations are closely linked to changes in the wage structure over time, where technological change and international competition have decreased returns to certain tasks. For example, jobs requiring cognitive skill, creative problem-solving or face-to-face
12
interaction are unlikely to be automated or threatened by international competition, while routine tasks on an assembly line or information-processing jobs face higher risks in this regard. A classic example would seamstresses in the South Africa textile industry, semi-skilled workers who have been losing jobs as a result of labour-saving technology and competition from cheaper Chinese imports of similar products.
In order to explore these trends in South Africa, we examine how the returns to different occupational tasks have changed over time and also how these changes play out at different points along the income distribution. We expect to see that wages have fallen for those jobs involving tasks that face high risks of automation and international competition. In addition we expect that the changes will not be distributed uniformly across the income distribution.
5.1 Methodology
Identifying task categories
In order to analyse wage trends by tasks we identify five ‘task categories’ using the occupation codes available in the LFS and QLFS.8 Using these codes we link every identified occupation with one or more of the five task categories explained below. The choice of these five categories is based on work by Jensen and Kletzer (2010) and follows in particular Firpo et al. (2011). A brief explanation of each category is given here.
− Information and communication technology (ICT): Jobs that have high information content and are likely to be affected by technological change through the adoption of new production technologies, or face competition from countries where the same thing can be done more efficiently. These jobs generally include activities such as getting information, analysing data, recording information, and often involve interaction with computers. In the SASCO codes this consists of occupations such as software engineers, computer programmers, typists, data entry, and so on.
− Automation/routinization: Jobs that are routine in nature and have the potential to be automated, often involving repeated tasks, structured work environments, and where the pace of the job is often determined by mechanical or technical equipment. These jobs could also potentially be at risk through increased trade and import penetration. They include occupations such as textile weavers, engravers, machine operators, and assemblers.
− Face-to-face: Work that relies on face-to-face contact, such as establishing and maintaining personal relationships, working directly with the public, managing people, caring for others, teaching, and work requiring face-to-face discussions. Generally these are jobs that cannot be easily automated or replaced by a competing international firm. Such jobs range from room service attendants, food vendors, labour supervisors, travel guides, to therapists and teachers.
− On-site: Jobs that require the worker to be present at the particular place of work, and usually include tasks involving physical work, controlling machines/processes, operating vehicles or mechanical equipment, inspecting equipment, constructing physical objects. Again, these jobs are not easily offshorable and are generally made up of construction workers, machine operators, drivers, mechanics, and various kinds of manual labourers.
8 This is based on the South African Standard Classification of Occupations (SASCO).
13
− Decision-making/analytic: Work that requires non-routine decision-making abilities, usually tasks that involve creative thought, problem-solving, developing strategies, taking responsibility for outcomes and results. Such jobs cannot be automated easily and are usually at lower risk of being displaced by international competition. Occupations include artists, all types of professionals, managers, and other jobs generally considered to be high-skilled jobs.
Note that certain jobs fall into more than one category; for example, many managers would be involved in face-to-face tasks and also in decision-making/analytic tasks. Thus, there is some overlap in the categories. In addition, for some jobs, the nature of the survey LFS/QLFS coding forced us to categorize certain occupations into the same task category, even though they belonged in different categories. For instance, we had to combine certain farmers (who would be involved in decision-making) together with farm foremen (who would not necessarily be involved in decision-making) in the decision-making category. Such categorization introduces some measurement error into our estimates, but the problem was limited to less than 10 SASCO codes overall.
The relationship between tasks and wages
Examining the relationship between task categories and wages builds on earlier results which show increased labour demand for skilled sectors, and the Katz and Murphy decomposition revealing that within-sector forces explain the bulk of the changes in labour allocation. To explore the wage impacts, we run a wage regression for each of the five task categories, controlling for individual-level factors that influence earning power in South Africa (education, race, and experience). Since we are interested in the wages associated with task categories at different points along the wage distribution, we adopt a quantile regression approach. Specifically, we are interested, for example, in how the wage premium to automated jobs changed over time and how returns changed across the wage distribution.
Following Firpo et al. (2011) our conditional quantile regression has the log of monthly wages as the dependent variable and is of the form: ℎ + + +
where s the year, is a dummy for each of the five categories, and includes controls for age, race, and education. The variable of interest here is the coefficient on in each occupational category for each decile of the income distribution in any given year. This variable provides an estimate of the returns to each category across each decile of the income distribution for the year in question. We first introduce some descriptive statistics and then present the regression results for 2001 and 2011.
5.2 Descriptive statistics
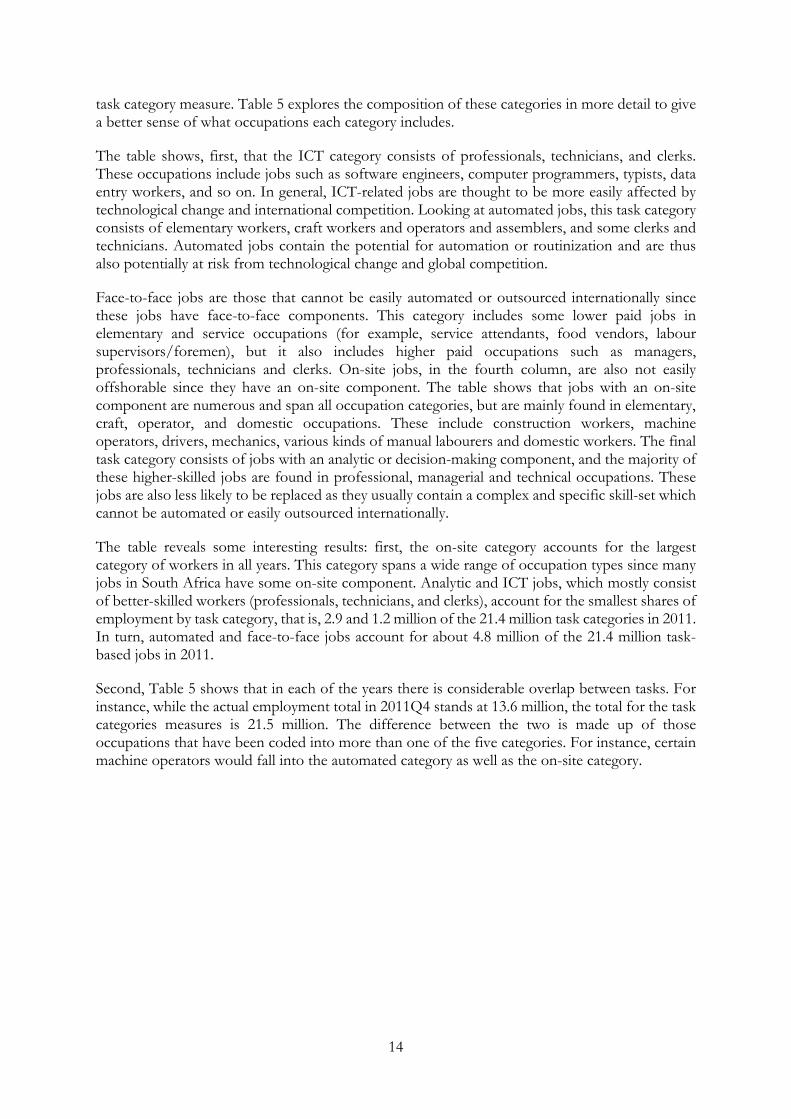
Table 5 shows the task categories and corresponding occupation categories for 2001 and 2011. We note that the far right-hand column captioned ‘LFS totals’ shows the actual employment totals for each occupation directly from the LFS/QLFS data, independent of the overlapping task categories. For example, in the 2001 LFS there were 663,945 managers in South Africa. In contrast the ‘Total’ column gives the total number of managers from our constructed task categories. It is clear that there is an overlap in the task categories, where, for example, many managers are involved in face-to-face tasks as well as analytic tasks and are thus included in both task categories. A correlation matrix (Appendix Table A2) reveals that the strongest correlations (0.41) are between automated and on-site, and analytic and face-to-face. This overlap points to the ‘bluntness’ of our
14
task category measure. Table 5 explores the composition of these categories in more detail to give a better sense of what occupations each category includes.
The table shows, first, that the ICT category consists of professionals, technicians, and clerks. These occupations include jobs such as software engineers, computer programmers, typists, data entry workers, and so on. In general, ICT-related jobs are thought to be more easily affected by technological change and international competition. Looking at automated jobs, this task category consists of elementary workers, craft workers and operators and assemblers, and some clerks and technicians. Automated jobs contain the potential for automation or routinization and are thus also potentially at risk from technological change and global competition.
Face-to-face jobs are those that cannot be easily automated or outsourced internationally since these jobs have face-to-face components. This category includes some lower paid jobs in elementary and service occupations (for example, service attendants, food vendors, labour supervisors/foremen), but it also includes higher paid occupations such as managers, professionals, technicians and clerks. On-site jobs, in the fourth column, are also not easily offshorable since they have an on-site component. The table shows that jobs with an on-site component are numerous and span all occupation categories, but are mainly found in elementary, craft, operator, and domestic occupations. These include construction workers, machine operators, drivers, mechanics, various kinds of manual labourers and domestic workers. The final task category consists of jobs with an analytic or decision-making component, and the majority of these higher-skilled jobs are found in professional, managerial and technical occupations. These jobs are also less likely to be replaced as they usually contain a complex and specific skill-set which cannot be automated or easily outsourced internationally.
The table reveals some interesting results: first, the on-site category accounts for the largest category of workers in all years. This category spans a wide range of occupation types since many jobs in South Africa have some on-site component. Analytic and ICT jobs, which mostly consist of better-skilled workers (professionals, technicians, and clerks), account for the smallest shares of employment by task category, that is, 2.9 and 1.2 million of the 21.4 million task categories in 2011. In turn, automated and face-to-face jobs account for about 4.8 million of the 21.4 million task-based jobs in 2011.
Second, Table 5 shows that in each of the years there is considerable overlap between tasks. For instance, while the actual employment total in 2011Q4 stands at 13.6 million, the total for the task categories measures is 21.5 million. The difference between the two is made up of those occupations that have been coded into more than one of the five categories. For instance, certain machine operators would fall into the automated category as well as the on-site category.
15
Table 5: Occupation categories and occupational tasks: 2001-11
LFS September 2001
ICT Automated Face-to-face On-site Analytic Total LFS totals
No. % No. % No. % No. % No. %
Managers 0 0 0 0 663,227 19 8,681 0 663,227 35 1,335,135 663,945
Professionals 77,922 12 2,986 0 249,490 7 31,776 0 381,861 20 744,036 485,829
Technicians 178,638 29 205,165 5 531,864 15 134,110 2 671,219 36 1,720,996 1,176,031
Clerks 368,923 59 1,029,770 26 356,139 10 100,998 2 51,481 3 1,907,311 1,090,772
Service 0 0 0 0 1,034,643 29 740,526 12 32,993 2 1,808,162 1,429,021
Skilled agric. workers 0 0 283,450 7 0 0 292,128 5 43,464 2 619,042 520,699
Craft workers 0 0 724,015 18 0 0 1,297,763 20 30,134 2 2,051,912 1,529,375
Operators/assemblers 0 0 475,869 12 0 0 878,239 14 0 0 1,354,108 1,127,155
Elementary workers 0 0 1,311,656 33 673,791 19 2,055,714 32 0 0 4,041,162 2,252,554
Domestic workers 0 0 0 0 0 0 881,411 14 0 0 881,411 881,411
Total 625,483 100 4,032,912 100 3,509,154 100 6,421,344 100 1,874,380 100 16,463,277 11,156,792
QLFS Q4 2011
ICT Automated Face-to-face On-site Analytic Total LFS totals
No. % No. % No. % No. % No. %
Managers 0 0 0 0 1,157,226 24 20,220 0 1,157,226 40 2,334,672 1,157,833
Professionals 177,053 15 8,436 0 415,379 9 80,129 1 716,452 25 1,397,450 769,895
Technicians 217,476 18 336,415 7 680,002 14 206,931 3 856,331 30 2,297,154 1,510,919
Clerks 787,136 67 1,451,840 30 478,675 10 122,805 2 51,449 2 2,891,906 1,529,944
Service workers 0 0 0 0 1,391,023 29 1,208,292 15 64,804 2 2,664,120 1,968,706
Skilled agric. workers 0 0 55,868 1 0 0 60,361 1 22,645 1 138,874 71,800
Craft workers 0 0 723,277 15 0 0 1,476,321 19 4,431 0 2,204,031 1,652,057
Operators/assemblers 0 0 386,750 8 0 0 1,010,162 13 0 0 1,396,912 1,133,984
Elementary workers 0 0 1,844,351 38 661,684 14 2,733,552 35 0 0 5,239,587 2,960,509
Domestic workers 0 0 0 0 0 0 886,883 11 0 0 886,883 886,883
Total 1,181,665 100 4,806,937 100 4,783,989 100 7,805,655 100 2,873,338 100 21,451,588 13,642,530
Source: Authors’ calculations based on data from StatsSA (LFS 2001-07 and QLFS 2008-11).
16
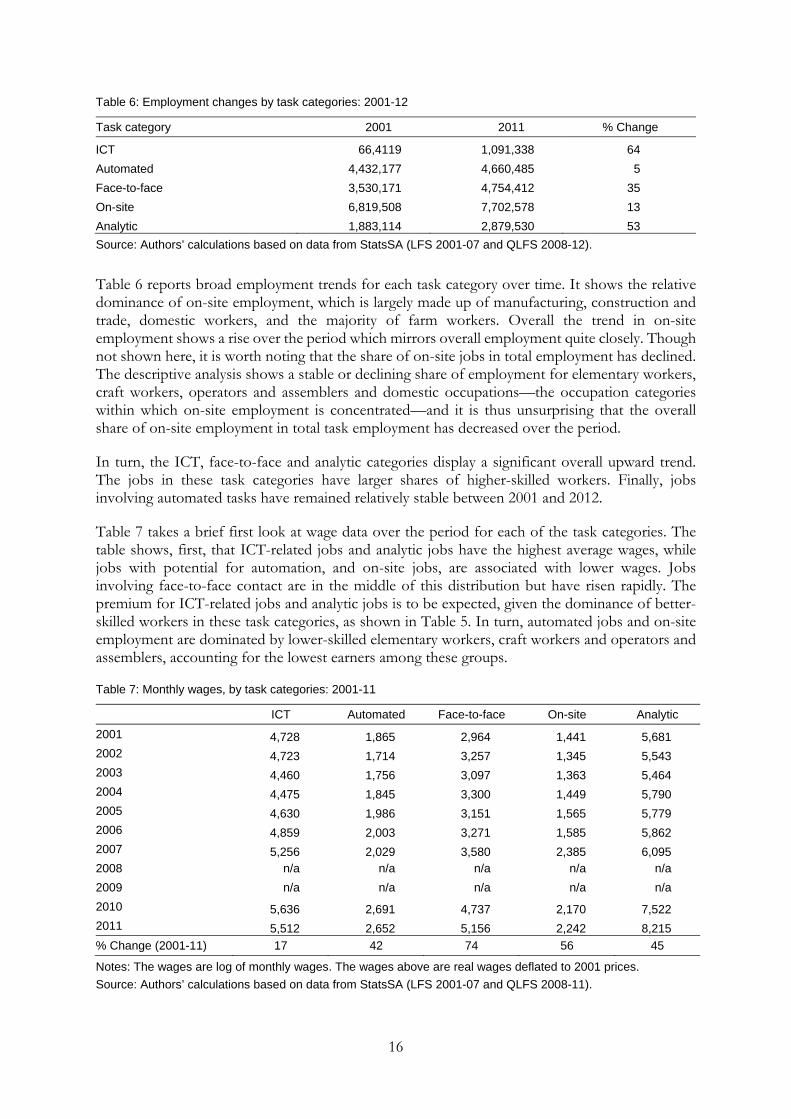
Table 6: Employment changes by task categories: 2001-12
Task category 2001 2011 % Change
ICT 66,4119 1,091,338 64
Automated 4,432,177 4,660,485 5
Face-to-face 3,530,171 4,754,412 35
On-site 6,819,508 7,702,578 13
Analytic 1,883,114 2,879,530 53
Source: Authors’ calculations based on data from StatsSA (LFS 2001-07 and QLFS 2008-12).
Table 6 reports broad employment trends for each task category over time. It shows the relative dominance of on-site employment, which is largely made up of manufacturing, construction and trade, domestic workers, and the majority of farm workers. Overall the trend in on-site employment shows a rise over the period which mirrors overall employment quite closely. Though not shown here, it is worth noting that the share of on-site jobs in total employment has declined. The descriptive analysis shows a stable or declining share of employment for elementary workers, craft workers, operators and assemblers and domestic occupations––the occupation categories within which on-site employment is concentrated––and it is thus unsurprising that the overall share of on-site employment in total task employment has decreased over the period.
In turn, the ICT, face-to-face and analytic categories display a significant overall upward trend. The jobs in these task categories have larger shares of higher-skilled workers. Finally, jobs involving automated tasks have remained relatively stable between 2001 and 2012.
Table 7 takes a brief first look at wage data over the period for each of the task categories. The table shows, first, that ICT-related jobs and analytic jobs have the highest average wages, while jobs with potential for automation, and on-site jobs, are associated with lower wages. Jobs involving face-to-face contact are in the middle of this distribution but have risen rapidly. The premium for ICT-related jobs and analytic jobs is to be expected, given the dominance of better-skilled workers in these task categories, as shown in Table 5. In turn, automated jobs and on-site employment are dominated by lower-skilled elementary workers, craft workers and operators and assemblers, accounting for the lowest earners among these groups.
Table 7: Monthly wages, by task categories: 2001-11
ICT Automated Face-to-face On-site Analytic
2001 4,728 1,865 2,964 1,441 5,681 2002 4,723 1,714 3,257 1,345 5,543 2003 4,460 1,756 3,097 1,363 5,464 2004 4,475 1,845 3,300 1,449 5,790 2005 4,630 1,986 3,151 1,565 5,779 2006 4,859 2,003 3,271 1,585 5,862 2007 5,256 2,029 3,580 2,385 6,095 2008 n/a n/a n/a n/a n/a
2009 n/a n/a n/a n/a n/a
2010 5,636 2,691 4,737 2,170 7,522 2011 5,512 2,652 5,156 2,242 8,215
% Change (2001-11) 17 42 74 56 45
Notes: The wages are log of monthly wages. The wages above are real wages deflated to 2001 prices.
Source: Authors’ calculations based on data from StatsSA (LFS 2001-07 and QLFS 2008-11).

17
Examining the wage trends over time indicates that all categories saw wage increases over the ten year period, with ICT-related jobs experiencing the lowest increases. These results indicate that the low-earning categories have seen relatively large increases in wages alongside the highest earning (analytic) jobs. At the lower end of the distribution, these increases may, in part, be due to increased protection for poorer workers through minimum wages. However, these preliminary descriptive results do not control for productivity-related characteristics of workers, including education, experience, race, etc.
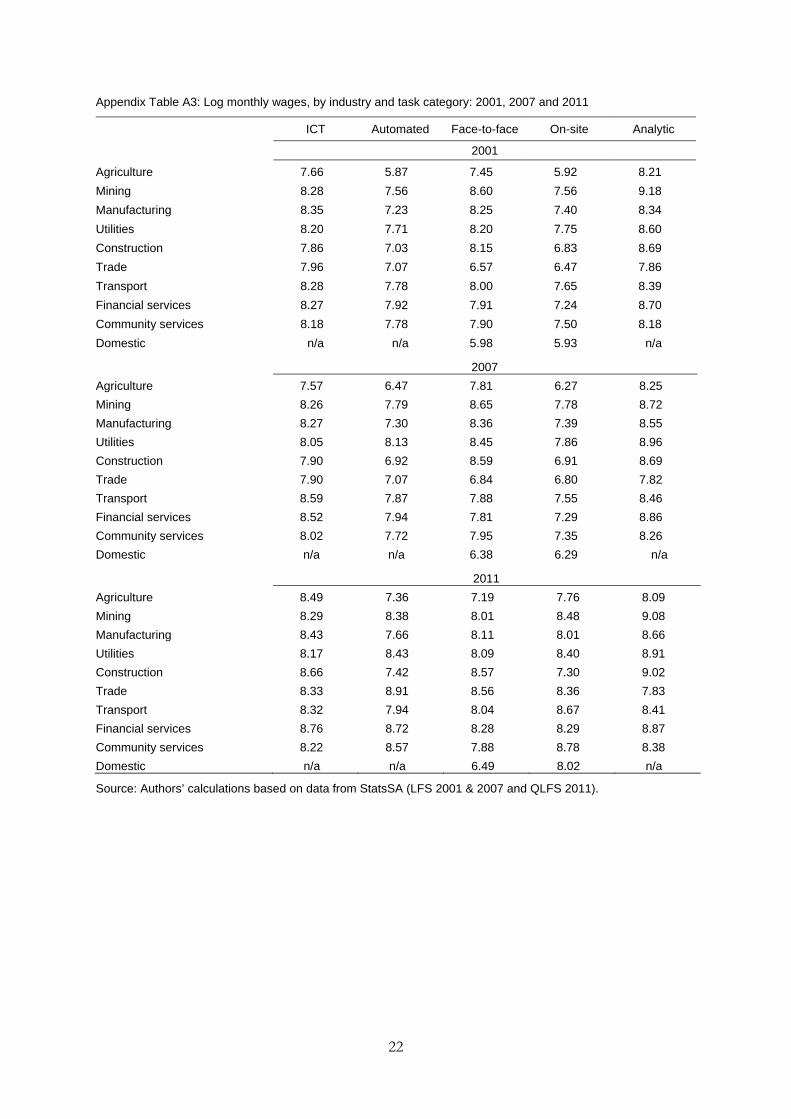
A closer look at wages is provided in Appendix Table A3, where we disaggregate wages by task category and industry for 2001, 2007 and 2011. This provides a more detailed picture of average wages, and the broad shifts which have taken place over the period under review which we do not address directly.
5.3 Returns across the wage distribution
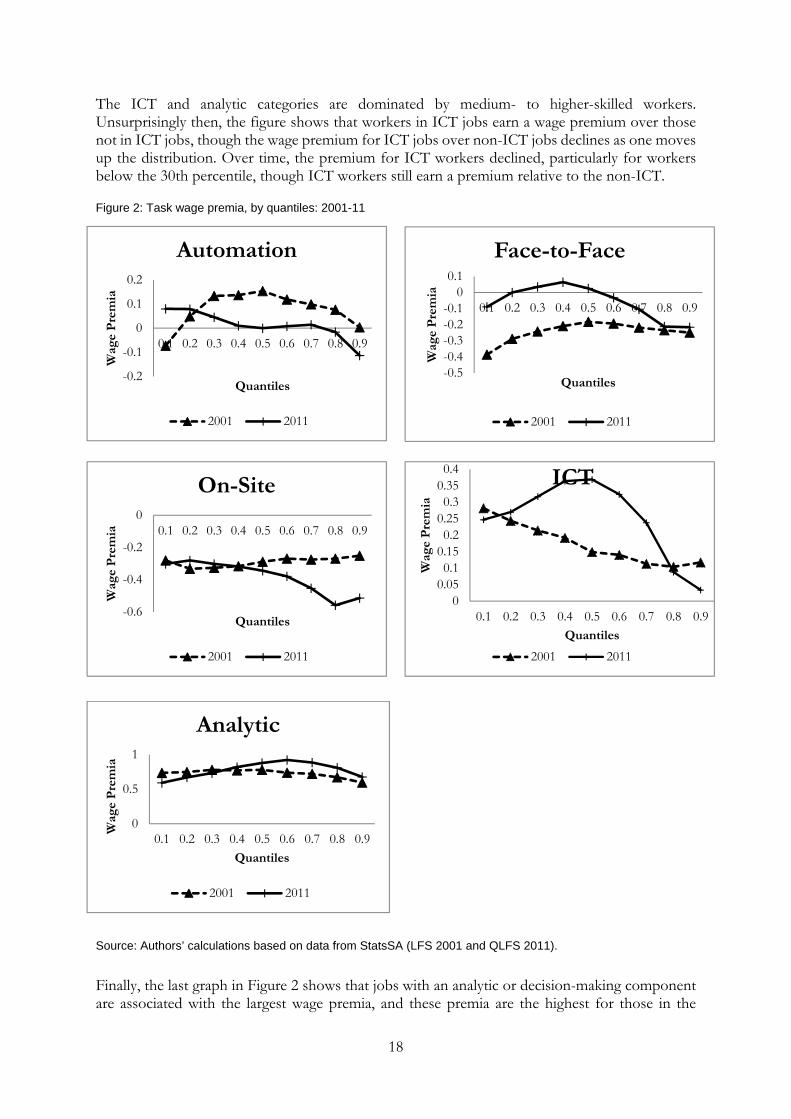
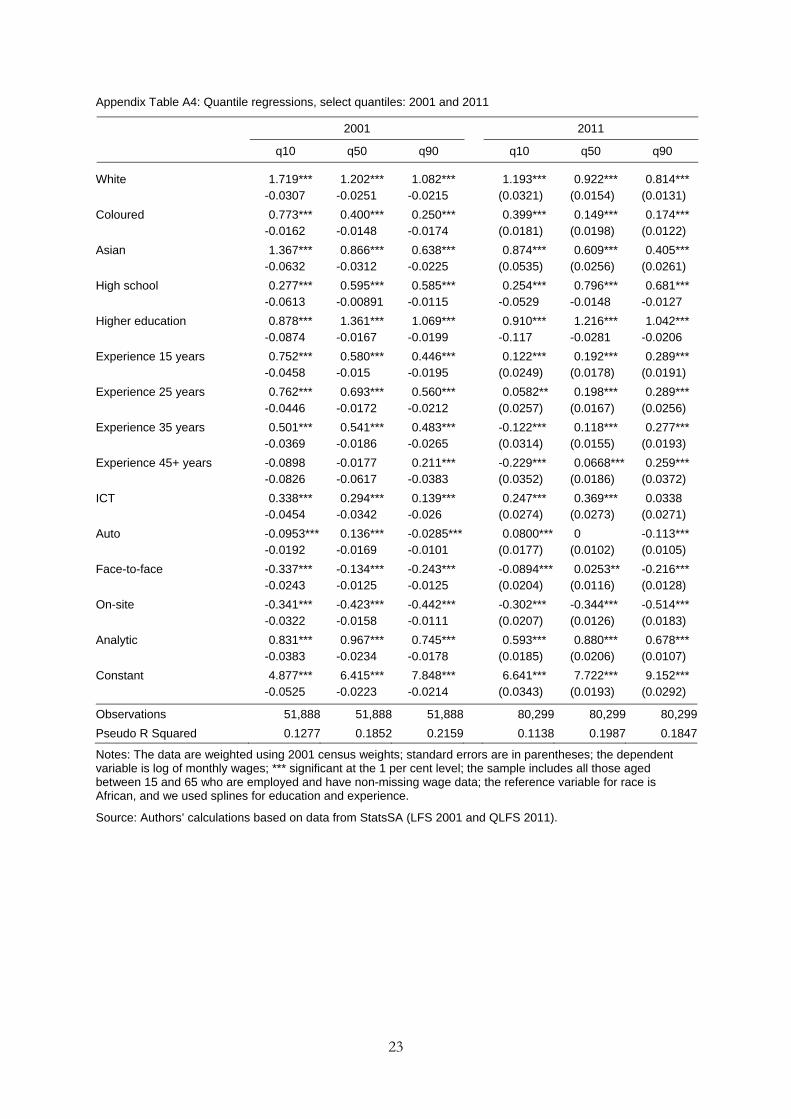
A quantile regression approach allows us to model the relationship between a set of predictor variables (the five task categories) and a dependent variable (wages) over specific quantiles (intervals) of the wage distribution. The sample for the quantile regression results presented below comprises of all working-age employed individuals for whom we have earnings information in the two surveys. In both years (2001 and 2011) we use the log of total monthly wages to measure earnings. Our model includes controls for education, age/experience, and race. We specify a set of splines for the education level of workers and a set of splines for age, which serves as a proxy for experience. Standard dummies for race, with African as the base case, are also included in our estimation. The full regression results are included in Appendix Table A4. The regression results for each task category are shown in Figure 2 where the relative coefficient of log wages (wage premia) is plotted for each decile of the wage distribution.
For those in automated or routine occupations, the results show small positive returns among workers in the middle of the distribution in 2001 but lower returns for those at the top of the distribution (60th to 90th quantiles) and negative returns for those at the bottom of the distribution (10th quantile). The hump in the middle of the distribution in 2001 would include technicians, clerks, craft workers, and operators and assemblers. Importantly, the figure shows that over time the returns to automated jobs fell, particularly in the middle of the distribution. This is the first piece of evidence to suggest that technological innovation and international competition may be impacting on the demand, and consequently wages, for those involved in routine work. These effects may have been felt in industries such as clothing and textiles, which have suffered as a result of increased international competition.
In 2001, workers with a face-to-face component to their work faced lower than average returns through most of the distribution. This changed in the period between 2001-11, with the premia to those in the face-to-face increasing for most of the distribution below the 80th percentile. Jobs requiring face-to-face contact are often insulated from the potential impact of labour-saving technology and international competition, and the evidence here appears to bear this out.
For the on-site task category, the figure shows that workers who have an on-site component to their jobs earn, on average, less than those with no on-site component. Over time the premia to jobs that require one to be ‘on-site’ have decreased for the upper half of the distribution. Interestingly the lower half of the distribution remains unchanged. This may be due in part to the introduction of minimum wages for 11 low-wage sectors, implemented by and large in the early 2000s, with steady wage increases every few years. The intervention represents an exogenous ‘policy shock’ which appears to be stabilizing wages at the bottom of the distribution for largely low-skilled occupations.
18
The ICT and analytic categories are dominated by medium- to higher-skilled workers. Unsurprisingly then, the figure shows that workers in ICT jobs earn a wage premium over those not in ICT jobs, though the wage premium for ICT jobs over non-ICT jobs declines as one moves up the distribution. Over time, the premium for ICT workers declined, particularly for workers below the 30th percentile, though ICT workers still earn a premium relative to the non-ICT.
Figure 2: Task wage premia, by quantiles: 2001-11
Source: Authors’ calculations based on data from StatsSA (LFS 2001 and QLFS 2011).
Finally, the last graph in Figure 2 shows that jobs with an analytic or decision-making component are associated with the largest wage premia, and these premia are the highest for those in the
-0.2
-0.1
0
0.1
0.2
0.1 0.2 0.3 0.4 0.5 0.6 0.7 0.8 0.9
Wag
e P
rem
ia
Quantiles
Automation
2001 2011
-0.5-0.4-0.3-0.2-0.1
00.1
0.1 0.2 0.3 0.4 0.5 0.6 0.7 0.8 0.9
Wag
e P
rem
ia
Quantiles
Face-to-Face
2001 2011
-0.6
-0.4
-0.2
00.1 0.2 0.3 0.4 0.5 0.6 0.7 0.8 0.9
Wag
e P
rem
ia
Quantiles
On-Site
2001 2011
00.050.1
0.150.2
0.250.3
0.350.4
0.1 0.2 0.3 0.4 0.5 0.6 0.7 0.8 0.9
Wag
e P
rem
ia
Quantiles
ICT
2001 2011
0
0.5
1
0.1 0.2 0.3 0.4 0.5 0.6 0.7 0.8 0.9
Wag
e P
rem
ia
Quantiles
Analytic
2001 2011
19
middle and upper-middle of the wage distribution. Workers in this category include managers, professionals, technicians, clerks and other skilled workers. Over time, the results show a slight increase at the upper end of the distribution.
Overall, the conditional quantile results present several interesting trends: first, both workers in ICT-related and analytic jobs earn better throughout the wage distribution than other workers, after controlling for individual-level characteristics. This is unsurprising, given that these two task categories are dominated by medium to higher-skilled occupations which have been in high demand over the period. Furthermore, for analytic jobs, which are dominated by managers, professionals and technicians, the premium increased between the 40th and 80th quantiles over the 2001 to 2011 period, and this is again in line with the high demand for these occupations during the period. Increasing skills intensity thus appears to be matched by rising wages for higher skilled tasks.
For both the automated and upper-half of the on-site categories, there have been declines in the wage premia over time. For those in jobs with automated components, the decline was particularly large in the middle of the wage distribution (between the 30th and 80th quantiles), with positive premia turning negative at the 90th quantiles. Similarly, for on-site jobs we show clear declines in wage premia over time across the upper half of the distribution and particularly for those above the 70th quantile. Thus, the declining wage premia for those in automated and on-site jobs appear to lend support to the hypothesis that technological change and globalization have led to a decrease in the demand for jobs consisting of job tasks that are more exposed.
6 Conclusion
This paper examined labour market trends in South Africa with a focus on employment and wages. Employment growth has tended to shift towards higher skilled labour and there are several markers of this growth trajectory over the period: first, employment within the primary sectors collapsed, with agriculture and mining together losing over 700,000 jobs, resulting in large-scale employment losses among the lower skilled.9 Second, the manufacturing sector did not witness any increase in employment in the period. In terms of production and exports then, South Africa remains a resource-based middle-income economy with no significant globally competitive light manufacturing sector which may be the missing link for a low-skill abundant country.
Third, growth has mainly been created within the tertiary sectors such as financial services and community services. The increase in financial services employment has largely been within the business activities subsector. In turn, public sector employment has grown faster than private sector employment, with the public sector accounting for 15 per cent of total employment in 2012, which raises the question of whether the private sector has become stuck. While employment growth in South Africa is needed desperately, a growing public sector has its limits, and increasing public sector employment is not seen to be an efficient, sustainable way to increase employment in the longer term (IMF 2012).
Fourth, as a result of employment growth being driven mainly by the tertiary sectors, high- and medium-skilled occupations such as managers, professionals and service and sales workers have seen significant employment gains. In turn, craft and trade workers, and operators and assemblers experienced no significant employment growth, and the economy experienced a declining
9 We note, though, that employment numbers for the mining industry using household survey data are lower than employment numbers for the industry using firm-based data (see DPRU 2013).
20
proportion of medium-skilled workers in the primary and secondary sectors. The relative demand for occupation groups from the Katz and Murphy decompositions match well with the findings above, and show that within-sector shifts dominate between-sector shifts in explaining the profile of relative demand. This supports the claim that technological changes, among other factors, have played an important role in employment trends.
Global competition, increasing capital intensity, the shrinkage of primary sector employment, as well as technological change have all contributed to increasing skills intensity in the South African labour market. We would expect these changes to be associated with increasing wage premia for higher-skilled workers, as well as declining wage premia for workers in jobs that are more vulnerable to global competition and technological change. The quantile regression results show that, when controlling for age/experience, race and education, jobs that involve automated or routine tasks (largely lower- to medium-skilled jobs) have experienced a drop in wage levels over time across most of the income distribution. Jobs involving face-to-face tasks and those with an ICT component have seen rising wages in general, while the analytic category posted high and relatively stable wages over time and across the distribution. Importantly, at the bottom of the wage distribution, wages have remained relatively stable or risen in all of our five task categories. This may be due in part to the extension of minimum wages during the period to a total of 11 low-paid sectors.
21
Appendix
Appendix Table A1: Occupational distribution of employment changes: 2001-12
2001 2008 2012 2001-12
000s Share 000s Share 000s Share AAG
Managers 664 5.9 1,089 7.9 1,139 8.3 5.0*
Professionals 1,662 14.9 2,241 16.2 2,327 17 3.1*
Clerks 1,091 9.8 1,484 10.7 1,392 10.2 2.2*
Service & sales workers 1,422 12.7 1,780 12.9 2,049 15 3.4*
Agriculture and fishery 376 3.4 100 0.7 65 0.5 -14.8*
Craft & trade workers 1,529 13.7 1,905 13.8 1,654 12.1 0.7
Operators & assemblers 1,127 10.1 1,231 8.9 1,153 8.4 0.2
Elementary occupations 2,253 20.1 2,751 19.9 2,770 20.3 1.9*
Domestic workers 1,034 9.2 1,257 9.1 1,129 8.3 0.8
Total 11,181 100 13,839 100 13,678 100 1.8*
Skilled 2,326 20.8 3,331 24.1 3,467 25.3 3.7*
Semi-skilled 5,545 49.6 6,500 47 6,313 46.1 1.2*
Unskilled 3,286 29.4 4,008 29 3,899 28.5 1.6*
Notes: * indicates that change since 2001 was statistically significant at 5 per cent; data have been weighted using census weights; AAG is the annual average growth rate.
Source: StatsSA (LFS September 2001; QLFS 2008-12).
Appendix Table A2: Task category correlation matrix: 2001 and 2011
2001
Analytic ICT Automated Face-to-face On-site
Analytic 1
ICT 0.1058 1
Automated -0.0354 0.2139 1
Face-to-face 0.4189 -0.0369 0.0058 1
On-site -0.0523 -0.052 0.4103 0.1564 1
2011
Analytic ICT Automated Face-to-face On-site
Analytic 1
ICT 0.1117 1
Automated 0.0312 0.2547 1
Face-to-face 0.414 -0.0301 0.0316 1
On-site 0.0346 -0.0425 0.4115 0.1392 1
Source: Authors’ calculations based on data from StatsSA (LFS 2001 and QLFS 2011).
22
Appendix Table A3: Log monthly wages, by industry and task category: 2001, 2007 and 2011
ICT Automated Face-to-face On-site Analytic
2001
Agriculture 7.66 5.87 7.45 5.92 8.21
Mining 8.28 7.56 8.60 7.56 9.18
Manufacturing 8.35 7.23 8.25 7.40 8.34
Utilities 8.20 7.71 8.20 7.75 8.60
Construction 7.86 7.03 8.15 6.83 8.69
Trade 7.96 7.07 6.57 6.47 7.86
Transport 8.28 7.78 8.00 7.65 8.39
Financial services 8.27 7.92 7.91 7.24 8.70
Community services 8.18 7.78 7.90 7.50 8.18
Domestic n/a n/a 5.98 5.93 n/a
2007
Agriculture 7.57 6.47 7.81 6.27 8.25
Mining 8.26 7.79 8.65 7.78 8.72
Manufacturing 8.27 7.30 8.36 7.39 8.55
Utilities 8.05 8.13 8.45 7.86 8.96
Construction 7.90 6.92 8.59 6.91 8.69
Trade 7.90 7.07 6.84 6.80 7.82
Transport 8.59 7.87 7.88 7.55 8.46
Financial services 8.52 7.94 7.81 7.29 8.86
Community services 8.02 7.72 7.95 7.35 8.26
Domestic n/a n/a 6.38 6.29 n/a
2011
Agriculture 8.49 7.36 7.19 7.76 8.09
Mining 8.29 8.38 8.01 8.48 9.08
Manufacturing 8.43 7.66 8.11 8.01 8.66
Utilities 8.17 8.43 8.09 8.40 8.91
Construction 8.66 7.42 8.57 7.30 9.02
Trade 8.33 8.91 8.56 8.36 7.83
Transport 8.32 7.94 8.04 8.67 8.41
Financial services 8.76 8.72 8.28 8.29 8.87
Community services 8.22 8.57 7.88 8.78 8.38
Domestic n/a n/a 6.49 8.02 n/a
Source: Authors’ calculations based on data from StatsSA (LFS 2001 & 2007 and QLFS 2011).
23
Appendix Table A4: Quantile regressions, select quantiles: 2001 and 2011
2001 2011
q10 q50 q90 q10 q50 q90 White 1.719*** 1.202*** 1.082*** 1.193*** 0.922*** 0.814*** -0.0307 -0.0251 -0.0215 (0.0321) (0.0154) (0.0131)
Coloured 0.773*** 0.400*** 0.250*** 0.399*** 0.149*** 0.174*** -0.0162 -0.0148 -0.0174 (0.0181) (0.0198) (0.0122)
Asian 1.367*** 0.866*** 0.638*** 0.874*** 0.609*** 0.405*** -0.0632 -0.0312 -0.0225 (0.0535) (0.0256) (0.0261)
High school 0.277*** 0.595*** 0.585*** 0.254*** 0.796*** 0.681*** -0.0613 -0.00891 -0.0115 -0.0529 -0.0148 -0.0127
Higher education 0.878*** 1.361*** 1.069*** 0.910*** 1.216*** 1.042*** -0.0874 -0.0167 -0.0199 -0.117 -0.0281 -0.0206
Experience 15 years 0.752*** 0.580*** 0.446*** 0.122*** 0.192*** 0.289*** -0.0458 -0.015 -0.0195 (0.0249) (0.0178) (0.0191)
Experience 25 years 0.762*** 0.693*** 0.560*** 0.0582** 0.198*** 0.289*** -0.0446 -0.0172 -0.0212 (0.0257) (0.0167) (0.0256)
Experience 35 years 0.501*** 0.541*** 0.483*** -0.122*** 0.118*** 0.277*** -0.0369 -0.0186 -0.0265 (0.0314) (0.0155) (0.0193)
Experience 45+ years -0.0898 -0.0177 0.211*** -0.229*** 0.0668*** 0.259*** -0.0826 -0.0617 -0.0383 (0.0352) (0.0186) (0.0372)
ICT 0.338*** 0.294*** 0.139*** 0.247*** 0.369*** 0.0338 -0.0454 -0.0342 -0.026 (0.0274) (0.0273) (0.0271)
Auto -0.0953*** 0.136*** -0.0285*** 0.0800*** 0 -0.113*** -0.0192 -0.0169 -0.0101 (0.0177) (0.0102) (0.0105)
Face-to-face -0.337*** -0.134*** -0.243*** -0.0894*** 0.0253** -0.216*** -0.0243 -0.0125 -0.0125 (0.0204) (0.0116) (0.0128)
On-site -0.341*** -0.423*** -0.442*** -0.302*** -0.344*** -0.514*** -0.0322 -0.0158 -0.0111 (0.0207) (0.0126) (0.0183)
Analytic 0.831*** 0.967*** 0.745*** 0.593*** 0.880*** 0.678*** -0.0383 -0.0234 -0.0178 (0.0185) (0.0206) (0.0107)
Constant 4.877*** 6.415*** 7.848*** 6.641*** 7.722*** 9.152*** -0.0525 -0.0223 -0.0214 (0.0343) (0.0193) (0.0292)
Observations 51,888 51,888 51,888 80,299 80,299 80,299
Pseudo R Squared 0.1277 0.1852 0.2159 0.1138 0.1987 0.1847
Notes: The data are weighted using 2001 census weights; standard errors are in parentheses; the dependent variable is log of monthly wages; *** significant at the 1 per cent level; the sample includes all those aged between 15 and 65 who are employed and have non-missing wage data; the reference variable for race is African, and we used splines for education and experience.
Source: Authors’ calculations based on data from StatsSA (LFS 2001 and QLFS 2011).
24
References
Acemoglu, D., and D.H. Autor (2011). ‘Skills, Tasks, and Technologies: Implications for Employment and Earnings’. In O. Ashenfelter and D. Card (eds), Handbook of Economics, vol. IV.B. Amsterdam: North-Holland.
Autor, D.H., F. Levy, and R.J. Murnane (2003). ‘The Skill Content of Recent Technological Change: An Empirical Exploration’. Quarterly Journal of Economics, 118(4): 1279–333.
Bhorat, H., R. Kanbur, and B. Stanwix (2012). ‘Estimating the Impact of Minimum Wages on Employment, Wages and Non-wage Benefits: The Case of Agriculture in South Africa’. DPRU Working Paper WP 12/149. Cape Town: Development Policy Research Unit, University of Cape Town.
Bhorat, H. (2000). ‘Wage Premia and Wage Differentials in the South African Labour Market’. DPRU Working Paper 00/43. Cape Town: Development Policy Research Unit, University of Cape Town.
Bhorat, H., and J. Hodge (1999). ‘Decomposing Shifts in Labour Demand in South Africa’. South African Journal of Economics, 67(3): 348–80.
Development Policy Research Unit (DPRU) (2003). ‘Employment and Household Poverty: The Effects of Trade, Investment and Technology’. DPRU Research Paper. Cape Town: University of Cape Town.
Development Policy Research Unit (DPRU) (2007). ‘The Determinants of Labour Demand Shifts in South Africa: The Role of International Trade, Technology and Structural Change’. DPRU Research Paper. Cape Town: University of Cape Town.
Development Policy Research Unit (DPRU) (2010). ‘The South African Economy Pre-and Post-Recession and Fiscal Responses to the Recession’. DPRU Research Paper. Cape Town: University of Cape Town.
Development Policy Research Unit (DPRU) (2012). ‘Towards Economic Transformation and Growth: A Review of the South African Economy’. Research Report prepared for the African Centre for Economic Transformation (ACET). Cape Town: DPRU.
Development Policy Research Unit (DPRU) (2013). ‘Employment in the Mining and Quarrying Industry in South Africa’. DPRU Fact Sheet 10. Cape Town: University of Cape Town.
DiNardo, J., N.M. Fortin, and T. Lemieux (1996). ‘Labour Market Institutions and the Distribution of Wages, 1973-1992: A Semiparametric Approach’. Econometrica, 64(5): 1001-44.
Dunne, P., and L. Edwards (2006). ‘Trade, Technology and Employment: A Case Study of South Africa’. Paper presented at the CSAE Conference on Reducing Poverty and Inequality: How can Africa be included?, 19-21 March. London.
Edwards, L. (2001). ‘Globalization and the Skill Bias of Occupation Employment in South Africa’. South African Journal of Economics, 69(1): 40–71.
Edwards, L., and S. Golub (2003). ‘South African Productivity and Capital Accumulation in Manufacturing: An International Comparative Analysis’. South African Journal of Economics, 71(4): 659–78.
Firpo, S., N.M. Fortin, and T. Lemieux (2011). ‘Occupational Tasks and Changes in the Wage Structure’. IZA Discussion Paper 5542. Bonn: IZA.
Goos, M., and A. Manning (2007). ‘Lousy and Lovely Jobs: The Rising Polarization of Work in Britain’. The Review of Economics and Statistics, 89(1): 118–33.
25
Hanival, S., and J. Maia (2008). ‘An Overview of the Performance of the South African Economy since 1994’. Available at: www.npc.gov.za/MediaLib/ Downloads/Home/Tabs/Diagnostic/Economy2/An%20economic%20performance.pdf
International Labour Organization (ILO) (2013). Global Employment Trends, 2013. Geneva: ILO.
International Monetary Fund (IMF) (2012). South Africa: 2012 Article IV Consultation. Washington, DC: IMF. Available at: www.imf.org/external/pubs/cat/longres.aspx?sk =26201.0
Jensen, J.B., and L.G. Kletzer (2010). ‘Measuring Tradable Services and the Task Content of Offshorable Services Jobs’. In K. Abraham, M. Harper and J. Spletzer (eds), Labour in the New Economy. Chicago: University of Chicago Press.
Katz, L.F., and K.M. Murphy (1992). ‘Changes in Relative Wages, 1963-1987: Supply and Demand Factors’. The Quarterly Journal of Economics, 107(1): 35–78.
Kosters, M.H. (1998). Wage Levels and Inequality: Measuring and Interpreting the Trends. Washington, DC: The AEI Press.
Organisation of Economic Co-operation and Development (OECD) (2008). African Economic Outlook – South Africa. Paris: AfDB/OECD.
Rodrik, D. (2006). ‘Understanding South Africa’s Economic Puzzles’. BREAD Working Paper 131. Durham, NC: Bureau for Research and Economic Analysis of Development, Duke University.
Seekings, J. (2014). ‘Have Workers been Winners or Losers in the post-Apartheid Labour Market?’. Southern Africa Labour and Development Research Unit (SALDRU) Seminar series, 21 May. University of Cape Town.
StatsSA (Statistics South Africa) (n.d.).Various reports: Labour Force Survey, 2001-07; Quarterly Labour Force Survey, 2008-11. Pretoria: StatsSA. Available at: www.beta2.statssa.gov.za/?s=labour+force&sitem=publications.
World Bank (2012). Light Manufacturing in Africa: Targeted Policies to Enhance Private Investment and Create Jobs. Washington, DC: The Agence Française de Développement and the World Bank.
Yu, D. (2013). ‘Youth Unemployment in South Africa since 2000 Revisited’. Stellenbosch Economic Working Papers 04/13. Stellenbosch: University of Stellenbosch.