wider working paper 2015/057
TRANSCRIPT

World Institute for Development Economics Research wider.unu.edu
WIDER Working Paper 2015/057
Do firms learn by exporting or learn to export?
Evidence from Senegalese manufacturing plant
Cissé Fatou1 and Ji Eun Choi2
June 2015

1Consortium pour la Recherche Economique et Sociale (CRES); 2TMDC Oxford University; corresponding author: [email protected]; [email protected]
This study has been prepared within the UNU-WIDER project ‘Learning to Compete: Accelerating Industrial Development in Africa’, directed by John Page.
Copyright © AfDB 2015
ISSN 1798-7237 ISBN 978-92-9230-946-6
Typescript prepared by Fiona O’Brien for UNU-WIDER.
UNU-WIDER gratefully acknowledges the financial contributions to the research programme from the governments of Denmark, Finland, Sweden, and the United Kingdom.
The World Institute for Development Economics Research (WIDER) was established by the United Nations University (UNU) as its first research and training centre and started work in Helsinki, Finland in 1985. The Institute undertakes applied research and policy analysis on structural changes affecting the developing and transitional economies, provides a forum for the advocacy of policies leading to robust, equitable and environmentally sustainable growth, and promotes capacity strengthening and training in the field of economic and social policy-making. Work is carried out by staff researchers and visiting scholars in Helsinki and through networks of collaborating scholars and institutions around the world.
UNU-WIDER, Katajanokanlaituri 6 B, 00160 Helsinki, Finland, wider.unu.edu
The views expressed in this publication are those of the author(s). Publication does not imply endorsement by the Institute or the United Nations University, nor by the programme/project sponsors, of any of the views expressed.
Abstract: The increasing quantity of literature investigating the impact of trade openness on firm efficiency has not yet provided a definite prediction of the direction of causality. This paper investigates how the relationship between exporting and productivity impacts on manufacturing sectors in Senegal. Using unique firm-level panel data for the period 1998–2011, we estimate productivity and exporting dynamics, controlling for other unobserved effects, and using General
Method of Moments. Our results indicate evidence both that the most efficient firms self-select for entry into the export market and that learning has an impact on the export market. From a policy perspective, this evidence of learning by exporting suggests Senegal has much to gain from encouraging exports by helping domestic firms overcome barriers to entering foreign markets, particularly by investing in skilled workers and promoting access to patents and licenses.
Keywords: exporting, total factor productivity, learning by exporting, general method of moments JEL classification: C33, D24, F14, L25
Acknowledgements: This paper is one of a series of studies on industrial development in Africa produced in collaboration between the Africa Growth Initiative at Brookings, the African Development Bank (AfDB), and UNU-WIDER under their joint project ‘Learning to Compete’ (L2C).

1
1 Introduction
International trade benefits the parties trading by exposing countries to the knowledge stocks of their trading partners (Grossman and Helpman 1991). This ‘learning-by-exporting’ effect may be important at both country level and firm level (Love and Ganotakis 2013). However, detecting learning-by-exporting effects at firm level is not straightforward. Firm performance is heterogeneous, even within narrowly defined sectors (Bartelsman and Doms 2000; Goddard et al. 2006). In addition, firms learn from many external as well as internal sources, and thus it is not always easy to separate out the learning-by-exporting effect.
Despite numerous empirical case studies supporting the association between exporting activities and efficiency (Albornoz and Ercolani 2007; Crespi et al. 2006), there is still little systematic evidence that efficient firms may self-select for entry into the export market, or that exporting causes efficiency gains. In the self-selection (SS) mechanism, only the more productive firms can afford the higher cost of exporting. This implies that future exporters have significantly higher productivity than non-exporters before they start exporting (Clerides et al. 1998; Melitz 2003). In the learning-by-exporting (LBE) mechanism, firms improve their productivity after entering a foreign market (Clerides et al. 1998). Therefore, exporting results in productivity gains because exporters are exposed to knowledge flows from international buyers and competitors, and also to more intense competition in international markets. This leads to larger opportunities and incentives to improve productivity, than those experienced by firms which sell only on the domestic market.
There is a large literature in developing countries that examines the relationship between productivity and exporting, but overall evidence is inconclusive. For example, Clerides et al. (1998) find that efficient firms self-select to become exporters but do not experience any efficiency gains as a result of being exporters in Columbia, Mexico and Morocco. In contrast, in four African countries, Bigsten et al. (2004) find significant efficiency gains from exporting, which they interpret as the effect of learning by exporting. Similarly, Bigsten and Gebreeyesus (2008) find productivity improvements for exporting firms in Ethiopia post-participation in foreign markets.
Senegal, like many developing countries, abandoned its inward-looking protectionist development strategies during the 1980s for more open trade programmes, as a reaction to the failure of previous import-substitution industrialization policies. However, there is still no evidence of the effect of trade openness on firm efficiency. Does export experience improve a firm’s efficiency? Are the most efficient firms most likely to become exporters? In this paper, we investigate these questions by looking at the causal links between exporting and productivity, using unique firm-level panel data from Senegalese manufacturing sectors for the period 1998–2011.
Numerous methodological issues arise when testing the effect of exporting on productivity. One of the most common problems is endogeneity and sample selection bias. The nature of the bias suggests that exporting firms might possess some unobservable characteristics that make them more productive than their domestic counterparts, thus allowing them to overcome sunk cost to enter into export markets. Hence, estimating the learning-by-exporting effect using conventional econometric methods would lead to biased and spurious results. Our approach, which is similar to that of Bigsten et al. (2003), involves simultaneous estimation of a dynamic output function and a dynamic discrete choice model for the decision to export, where we allow for causality running both from efficiency to exporting and from exporting to efficiency. This strategy enables us to control for unobserved heterogeneity in the form of firm-specific effects that are correlated across the two equations. However, while Bigsten et al. (2004) use the output-as-outcome variable of interest to measure the firms’ performance, we compute the total factor productivity (TFP) from
2
the production function and then use it as the outcome variable in the econometric test for learning effects.
Our preliminary results indicate evidence of both mechanisms: the more efficient firms become exporters (self-selection) and firm productivity increases by exporting (learning by exporting). Results are consistent with the inclusion of several firm characteristics such as firm age, firm size, skilled labour, labour productivity, ownership type, intangible assets, and industry classification. Our findings suggest that larger firms and those with more qualified workers are generally much more likely to export. Another interesting finding is that firms which invest in accessing intangible assets such as patents and licenses have higher efficiency gains in exporting. Finally, small firms seem in particular to learn from exporting.
From a policy perspective, the learning-by-exporting finding suggests that Senegal has much to gain from encouraging its manufacturing sector to export. One way to do this is to increase the ability of domestic firms to overcome foreign market barriers, as well as disseminating further benefits arising from exporting to non-exporters.
The rest of the paper is organized as follows. Section 2 is devoted to the background of Senegalese industrial policies. Section 3 summarizes the related literature, while Section 4 presents our empirical framework and the econometric methods to test the relationship between firm-level efficiency and export experience. Section 5 provides an overview of the data and presents some relevant descriptive statistics. In Section 6, we discuss the main results from our analysis. Finally, Section 7 draws conclusions and discusses policy implications.
2 Background: trade policy reforms and manufacturing performance in Senegal
Senegalese industrial policy has first of all been marked by the state’s strong desire to counter divestment pressures associated with the shrinking domestic market following accession to national sovereignty. In fact, ex-French colonies were engaged in processes to industrialize their economy. Typical import-substitution industrialization policy instruments (tariff and non-tariff barriers) were established, along with complementary measures (the creation of free trade zones and investment codes) for the nascent private sector.
Starting in the mid-1980s, the arrival of structural adjustment programmes led to economic liberalization processes, which resulted in the closure of many firms which faced competitiveness pressures in the context of an overvalued Franc des Communautés financières d’Afrique (FCFA or CFA franc). By 1989, the liberalization process was stalled, and it did not pick up significantly until 1994, following a 50 per cent devaluation of the FCFA foreign exchange rate. However, this massive devaluation occurred after a long period of currency overvaluation and thus cannot be explicitly interpreted as part of a programme to implement an export promotion policy.
The second half of the 1990s saw the establishment of a new economic and monetary union with the goal of accelerating the convergence and integration of West African countries with the FCFA, which worked towards the rationalization of the tariff barrier and elimination of non-tariff barriers. Greater awareness of the social dimensions of adjustment developed through the 1990s, leading to a second generation of reforms based on the development of human capital and infrastructure.
The January 2005 introduction of work on the Accelerated Growth Strategy (AGS) would ultimately integrate industrial policy through a cross-cutting state intervention initiative to promote

3
private sector development. This implies the establishment of a business environment with international standards.
In summary, Senegal conducted import-substitution policy during the period 1960–86, largely by default, followed by a policy of support for the private sector based on liberalization of the economy.
2.1 The evolution of Senegalese industry
After independence, West African countries began with import-substitution policies which protected domestic industrial sectors. Senegal primarily used these policy instruments during the 1960s to preserve the industrial base inherited from the colonial period.
From import substitution to economic liberalization
Between 1961–9, during the first two economic and social development plans, import-substitution industrialization was prioritized. Tariff and non-tariff barriers protected large enterprises which were created by mobilizing large amounts of (often public) capital. By 1970, an alternative policy emphasized the development of small and medium businesses through the creation of the National Company for Industrial Research and Development (SONEPI) in 1969, followed by the Dakar Industrial Free Trade Zone (ZFID) in 1974.
Adjustment policies and liberalization of the economy
The 1970s world economic crisis arrived in Senegal with the 1980–1 collapse of macro-financial stability, exacerbated by the return of the drought cycle. Faced with a growing deficit of resources, the state appealed to Bretton Woods institutions at the cost of more orthodox policy based on fiscal consolidation and the use of market forces to govern access to resources and their use. The adjustment policies were based on four pillars: (i) management of aggregate demand with the dual goal of controlling inflation and reducing the balance of payments deficit; (ii) restoration of market forces in determining allocations and prices of resources; (iii) opening of the economy to the outside; and (iv) withdrawal of the state and consolidation of public finances.
In 1979, the year of the first stabilization programme, the state was to simplify and reduce import tariffs and taxes, while export taxes were eliminated except on peanuts and phosphates. By 1984, after progress to stabilize the economy was deemed satisfactory, a New Agricultural Policy (NPA) was launched to organize the withdrawal of the state from the agricultural sector. By 1986, it was the transformation sector’s turn, with a New Industrial Policy (NPI) aiming to dismantle tariff barriers. Another major decision was taken in 1986, to abandon administrative pricing (used to address undervaluation of declared imports) to calculate tariffs on imports.
The NPI comprised four major axes: revised protections for domestic industrial sectors, export promotion, revival of investments, and improvement of the business environment. A series of measures have been taken. For the protection of local industry, the tariff code was revised, with rates cut from 65 per cent to 30–40 per cent over two years, and the number and range of applicable rates reduced. The resulting reduction in the anti-export bias was supplemented by introducing an export subsidy which totalled 10 per cent of the free on board (FOB) value of exports in the period 1980–3. This rose to 15 per cent of the FOB value in 1984–6 and 25 per cent of value added in export activities after 1986. Peanut products and phosphate exports, which did not benefit from the subsidy, saw tax levies eliminated in 1980. Reform of the export subsidy system was supplemented by establishing an integrated credit insurance and financing system for the export of
4
manufactured goods. The investment code was also revised, an industrial restructuring fund was created, and assistance and advice provided to investors was expanded. To improve the business environment, measures were taken to liberalize prices and marketing channels, reduce production factor prices and simplify administrative formalities.
However, these measures were adopted in a context of persistent domestic currency appreciation and declining competitiveness of Senegalese firms. In 1989, being pressured by firms and faced with declining tax receipts, the state had to postpone implementation of the NPI. This last remains a painful failure in the history of economic reform in Senegal, with the closure of under-or uncompetitive firms causing significant job losses (7 per cent of permanent staff between mid-1987 and mid-1988).
Implementation of a Common External Tariff (CET)
The period preceding the 1994 devaluation saw a rich debate on the future of the West African Economic and Monetary Union (WAEMU). The perspective which prevailed was preservation of the union, which ultimately provided the inspiration to transform it into an economic union with the goal of accelerating integration and convergence among economies in the CFA franc zone. This having been done, the goal of not creating a WAEMU ‘fortress’ was upheld, and the union proceeded with tariff reductions and established a common external tariff (CET). The 50 per cent reduction in the FCFA exchange rate had already made possible the substantial 1994 reduction in tariff rates and simplification of import taxes which remained up to the initiative of each state.
Two exceptional taxes, which were temporary and degressive, were the degressive protection tax (TDP) and a special import tax (TCI) introduced to compensate for major declines in tariff protections associated with the CET (in the case of the TDP), or with erratic variations in world prices (in the case of the TCI).
Implementation of the CET is considered as a productivity shock comparable to the NPI, except that it came in the wake of the major productivity gains associated with devaluation of the CFA franc. In the period 1995–2005, industrial activities grew by an annual average of 3.8 per cent (IMF 2012).
Deepening economic liberalization and other measures to promote the private sector
In the first two post-independence decades, price administration, the predominance of public and mixed enterprises and the prevalence of a restrictive regulatory environment all severely hindered the development of private enterprise, with the exception of a certain number of entrepreneurs privileged in terms of regulations and other advantages. Given the benefits from devaluation, special conventions and protocols were renegotiated, in that many benefits were eliminated or reduced. Similarly, price control regimes were made more flexible and the privatization programme initiated during the 1980s was extended to sectors previously considered strategic, such as infrastructure services and the financial sector, with the disappearance of the first public banks and a 25 per cent limit on the state’s share of bank capital (Ministère de l’Economie et des Finances du Sénégal 1988).
Concerning the labour market, the reforms carried out from 1994–7 allowed firms to resort to economic layoffs and also reduced restrictions on fixed-term labour contracts. The dynamics of reform and consultation with employer organizations which accelerated following devaluation of the FCFA in 1994 led to the joint development of a private sector development strategy, adopted

5
upon agreement between parties in April 1999, regarding rationalization of the private sector support plan and improvement of the efficacy of state intervention.
Implementation of this strategy following the March 2000 transfer of power began with the creation in that year of the Investment Promotion and Major Projects Agency (APIX), and in 2001 of the Agency for the Development and Supervision of SMEs (ADEPME). This was followed by the 2002 transformation of the Senegalese Standards Institute into an association intended to encourage professionals to be more accountable in product quality certification, the 2003 creation of the Modernization Office and, in2005, the creation of the Senegalese Export Creation Agency (ASEPEX). Previously, the interest of the state in improving the quality of its intervention in the economy and services provided to firms had led to the January 2005 launch of a process to prepare the Accelerated Growth Strategy (SCA), by building upon the benefits linked to and orientations of the private sector development strategy (SDSP) adopted in 1999.
The SCA offers a common framework to establish a business environment with international standards which benefits all sectors, including: transformation activities, the promotion of promising sectors such as horticulture, agro-industry, aquaculture, telecommunications and tourism, or the improvement of sectors such as fisheries and textiles through a competitiveness cluster approach.
However, real gross domestic product (GDP) growth slowed considerably between 2006–11; the economy has proven rather vulnerable to the exogenous shocks of the energy, food and financial crises of 2007 to 2009. The industrial activity growth rate fell to 3.2 per cent during this period (International Monetary Fund 2012).
2.2 The industrial policy framework and emerging questions
The industrial sector is entrusted to the administration department which is also responsible for trade, SMEs and the informal sector. Redeployment and the industrial zones are the key features of the industrial sector policy validated in 2005. The objectives are: a rebalancing of industrial facilities (which continue to be concentrated in the Dakar region) across the country; a reorientation of the productive base towards promising new sectors; and a strengthening of managerial capacities required to promote highly productive competitive industries.
The industrial redeployment policy (PRI) is thus part of the orientation and objectives of the AGS which, in turn, is part of the action plan to reach the productivity and growth objectives of the National Social and Economic Development Strategy (NSEDS). Thus, the PRI rests on the stability of the macroeconomic environment, the policy of external openness and regional integration, the option to establish a business environment. The competitiveness cluster approach is emblematic of opportunities for innovation within the AGS as well as for collaboration between actors along the value chain. With a focus on the competitiveness of Senegalese firms, it goes beyond import substitution and export promotion policies, to provide the 1995–2005 growth trend with greater sectoral and social bases. The aim is to diversify the sources of growth and to sustain this growth.
The observed advantages of an effective industrial redeployment policy are: (i) the presence of important measures to increase value added in industrial sectors; (ii) increased accountability in the private sector; (iii) the ongoing process to develop infrastructure; and (iv) access to foreign markets. Complicating factors include: (i) the strong concentration of industrial activity and population in Dakar, sources of aggregation effects and economies of scale which may render the redeployment less beneficial; (ii) the lack of synergies between the industrial sector and small-scale producers; (iii)
6
backwardness in entrepreneurial spirit and technological innovation; and (iv) the cost of developing industrial sites.
With respect to these directions of industrial policy in Senegal, emerging issues involve: (i) the necessary restructuring of the productive apparatus and the basket of exported products in order to accelerate growth; (ii) the quality and maintenance of structural competitiveness factors such as infrastructure, notably including energy and human resources, including entrepreneurial spirit; (iii) the role of the undervaluation of the real exchange rate in the success of industrial redeployment and acceleration of growth.
3 Related literature on the LBE
As firm-level data becomes available, numerous studies have documented that there is heterogeneity across firms. It is found that exporting is a rare activity, for instance in the United States in 2000, only 4 per cent of firms engaged in exporting, and export market participation varies across industries within manufacturing (Bernard and Jensen, 1995). Also, exporters tend to be larger, more productive, skill- and capital-intensive, and to pay higher wages than non-exporting firms. This is the case not only for developed countries such as the US but also developing countries, which are plausibly abundant in unskilled labour. Both traditional and new trade theories cannot explain why some firms export and others produce only for the domestic market, or how the firm-level decision to export interacts with comparative advantage.
The finding that exporters are systematically more productive than non-exporters raises the question of whether more highly productive firms self-select into export markets, or whether exporting causes productivity growth through some form of learning by exporting.
3.1 Self-selection or learning by exporting?
There are numerous studies supporting self-selection in various developing countries. One possible explanation of self-selection is that there are sunk costs involved in entering export markets, which only the most productive firms find it profitable to incur (Roberts and Tybout 1997). Empirical findings from various countries are also supportive of self-selection. There is no evidence of increased productivity as a result of beginning to export for US firms (Bernard and Jensen, 1999) and no differential growth in firm productivity among exporters versus non-exporters among firms in Colombia, Mexico and Morocco (Clerides et al. 1998). Motivated by these empirical findings, Melitz (2003) developed a framework with firm heterogeneity in a general equilibrium model of trade. His model shows that exposure to trade will induce only the more productive firms to enter the export market (self-selection) and will simultaneously force the least productive firms to exit. In this self-selection mechanism, only the more productive firms make higher revenues and can afford the fixed costs incurred on entering the export market.
Meanwhile, there are different observations of past exporting experience leading to learning effects, and their results show strong productivity growth resulting from exporting (LBE). In this mechanism, firms improve their productivity after entering a foreign market. Therefore, exporting results in productivity gains, because exporters are exposed to knowledge flows from international buyers and competitors and to more intense competition in international markets, which leads to larger opportunities and incentives to improve productivity than those available to firms who sell only on the domestic market. Moreover, exports improve the economies of scale in production, and also improve capacity utilization, which results in better productivity performance in new export entrants than in non-exporters.

7
While the hypothesis of self-selection into export markets is strongly supported by widespread empirical evidence, the evidence on LBE is mixed and far from conclusive. Some works do not find any evidence of post-entry productivity changes (Wagner 2002; Arnold and Hussinger 2005; Hansson and Lundin 2004), and others do find evidence (Greenaway and Kneller 2004, 2007, 2008; Girma et al. 2004; Van Biesebroeck 2005; Damijan and Kostevc 2006; De Loecker 2007, 2010; Serti and Tomasi 2008; Máñez-Castillejo et al. 2010; and Dai and Yu 2013. In contrast to the scarcity of studies finding improved firm productivity following entry into export markets, an abundance of evidence indicates that firms entering export markets grow substantially faster in employment and output than non-exporters, especially for countries like Columbia, several sub-Saharan African countries, Slovenia and Canada (Pavcnik 2002; Van Biesebroeck 2005; De Loecker 2007; Lileeva and Trefler 2010).
3.2 Different applications of the learning-by-exporting model
While the question about the causal relations between export and productivity growth is still debatable, recent literature goes beyond the ongoing discussion and investigates specifically through which channels exporting impacts on productivity.
Innovation and technological upgrading are widely studied mechanisms related to trade and productivity increases. In industrial organizations, the standard approach is that firms invest in intangible assets, such as research and development (R&D) and advertising, to overcome existing barriers to entry into new markets (Carlton 2005). However, recent empirical studies in trade demonstrate that exporting leads to productivity improvements by influencing process and product innovations, increasing labour productivity and inducing the most productive firms to upgrade technology (Damijan et al. 2008, Lileeva and Trefler 2010; Bustos 2011).Changes in technology not only affect productivity but can also have implications for factor markets. For instance, technology investment requires skilled labour, and relative demand for skill increased in developing countries during the trade liberalization period (Goldberg and Pavcnik 2007).
Market size may be another channel which motivates firms to innovate and hence be more productive. Market size and trade affect competition across markets, in terms of the number and average productivity of competing firms, which then feeds back into the selection of producers and exporters in that market. Also, productivity and markups respond to both the size of a market and to the extent of its integration through trade. For instance, larger and more integrated markets exhibit higher productivity and lower markups (Melitz and Ottaviano 2008; Eatonet al. 2011). A similar finding occurs when firms have improved access to foreign markets, something which encourages firms to simultaneously export and invest in raising productivity (Lileeva and Trefler 2010).
While previous discussions have been focused on heterogeneity across firms, the latest studies also shows that many economic dynamics happen within firms, such as decisions on market entry and exit, product and market. Firms make endogenous entry and exit decisions. Once they have entered the export market, the survival rates of new exporters are low and heterogeneous, and even lower in developing countries. The low survival rates might be explained by the fact that ex ante exporters do not know their own ability, and that firms learn their per-period fixed costs only after they have entered export markets. Multinational ownership or tariffs have a direct effect on the probability of survival (Bernard et al. 2007). Also, credit constraints might be bigger in the initial stage of exporting.
Whichever factors are at play, exporters’ survival is a significant factor in explaining differences in export performance in the long run, particularly in developing countries (Bernard, Redding and
8
Schott 2007 Besedes and Prusa 2011). Moreover, each surviving firm chooses the optimal range of products to supply to each market, and often switches its products. If firms survive in the export market, growth is higher in the first year and first market than in others (Albornoz et al. 2012). In Africa, it is observed that the success rate rises with the number of same-country competitors exporting the same product to the same destination, suggesting the existence of some cross-firm externalities by information spillover, such as information about demand and the role of banks (Cadot et al. 2013).
Other literature has made a sectoral analysis to compare an export’s impact on productivity across sectors. There is evidence that service sector firms are able to reap the benefits of exposure to export markets at an earlier (entry) stage of the internationalization process than are manufacturing firms (Contractor et al. 2003; Love and Ganotakis 2013). From UK firm data, Harris and Li (2005 found that productivity benefits from entering and exiting export markets, but also that such productivity effects are larger in the services sector, in particular financial and business services, than in productive sectors including agriculture, manufacturing and construction.
4 Model specification and estimation procedure
4.1 Model specification
We assess the link between exporting and efficiency using a production function approach. We followed the approach in Bigsten et al. (2004) which is based on the Clerides and Tybout (1998) model. The approach involves both estimation of a dynamic productivity function and a dynamic discrete choice model for the decision to export. We allow for causality running both from efficiency to exporting and from exporting to efficiency. This strategy enables us to control for unobserved heterogeneity in the form of firm-specific effects that are correlated across the two equations. While Bigsten et al. (2004) use the output-as-outcome variable of interest to measure the firms’ performance, we consider the total factor productivity (TFP) and compute it in an initial step from the production function, and then use it as the outcome variable in the econometric test for learning effects.
Most studies on productivity at firm-level assume the production function (measured as deflated gross output or value added) to be a function of inputs, such as labour and capital, and productivity of the firm. Following Beveren (2010), we use an augmented Cobb-Douglas production function to estimate the total factor productivity. Considering its linear form in logs, the empirical specification can be written as follows:
𝑦𝑖𝑡 = 𝛼0 + 𝛼𝑘𝑘𝑖𝑡 + 𝛼𝑙𝑙𝑖𝑡 + 𝜔𝑖𝑡 + 𝜀𝑖𝑡 (1)
where 𝑦𝑖𝑡, 𝑘𝑖𝑡 and 𝑙𝑖𝑡 refer to the logarithms of added value, capital stock and employment
respectively; i and t are firm and time indices respectively; the parameter 𝛼0 is a mean efficiency
level across firm and over time, 𝛼𝑘and𝛼𝑙 are estimated elasticities of value added with respect to
inputs. Furthermore, 𝜔𝑖𝑡 and 𝜀𝑖𝑡 are error terms representing shocks to production or productivity.
𝜀𝑖𝑡i is unobservable or unpredictable by the firm, while 𝜔𝑖𝑡 is supposed to be observable or predictable and can be considered as productivity shock. The firm-level productivity (TFP) or
efficiency is represented by 𝐴𝑖𝑡 = 𝛼0 + 𝜔𝑖𝑡 + 𝜀𝑖𝑡 . The estimated form of this productivity is:
��𝑖𝑡 = 𝜀𝑖𝑡. +��𝑖𝑡.
Following the standard approach to measure TFP, we derive from equation (1) the TFP as a Solow residual term:

9
��𝑖𝑡 = 𝑦𝑖𝑡 − ��𝑘𝑘𝑖𝑡 − ��𝑙𝑙𝑖𝑡. (2)
Note that �� is the TFP in log. The TFP in levels is the exponential of ��.
We use the firm-level TFP estimation as the outcome variable to study the effect of exporting on productivity. As learning is unlikely to be instantaneous, we assume, as many studies on learning by exporting do (see for example Bigsten, and al 2004); Ito and Lechevalier 2010; and Greenaway and Kneller 2004) that this effect operates with a one-period lag. This specification suggests that
firm i’s past experience (A𝑖𝑡−1) may be an important driving factor of its current performance
(A𝑖𝑡). Building on Bigsten et al. (2004)’s learning-by-exporting idea, we assume that
𝐴𝑖𝑡alsodepends on firm i’s exporting experience, 𝐸xport𝑖𝑡−1. This approach is analogous to those of De Loecker (2007 2010), Facundo and Ercolani (2007) and Fernandes and Isgut (2015), which allow the law of motion of productivity to depend on past export status. We allow for heterogeneity
in 𝐴𝑖𝑡, by controlling the firm’s characteristics (𝑋𝑖𝑡) and a dummy variable for industry denoted
Sssector𝑖𝑡. We hence write the efficiency equation Ait in logarithmic form as:
Ait = 𝛽1A𝑖𝑡−1 + 𝛽2Export𝑖𝑡−1 + 𝛽3𝑋𝑖𝑡 + 𝛽4Sector𝑖𝑡 + µi + 𝜖𝑖𝑡 (3)
where Export is a dummy variable equal to one if there is some exporting and zero if there is not ;
𝛽1, 𝛽2, 𝛽3, 𝛽4 denote parameters to be estimated; µi. is an unobserved heterogeneity in the form of
firm specific effects; and 𝜖𝑖𝑡 is a homoskedastic, serially uncorrelated and normally distributed residual.
We rely on the existing literature for selecting the variables which are relevant for firm
characteristics 𝑋𝑖𝑡. The literature recognizes that learning by exporting is conditional on firm characteristics such as firm age (Fernandes and Isgut 2015), firm size, skilled workers, capital (Bigsten et al. 2003 and Facundo and Ercolani 2007), export intensity (Kraay 1999; Castellani and Zanfei 2007; Damijan et al. 2008; Girma et al. 2004), the existence of foreign capital (Greenaway and Kneller 2007). Another strand of the literature argues that learning by exporting is conditional on the existence of intangibles assets1 (Harris and Li 2005). We also take account of the capital-labour ratio and the specificity of the sectors by including a dummy variable that indicates industry sub-group: we have classified the firms within manufacturing into three sub-sectors: the textile sector, the agro-food industry, and others, which includes construction, equipment, paper, wood, etc.
In equation (3), the coefficient 𝛽1captures the effect of the past productivity level on the firm’s productivity decision today. This past experience effect is usually called the state dependence effect.
𝛽2 indicates the effect of a lagged export status on firm productivity. However, the positive association between export status and productivity can be due to the self-selection of the relatively more efficient plants into a foreign market rather than learning. Clerides et al. (1998) deal with this problem by formulating a probit model to identify the probability of becoming an exporter, in which they control for unobserved firm effects that are potentially correlated with the unobserved firm effects in the productivity equation. We use a similar approach in this paper.
Then, we assume that export participation depends on previous export participation, Exportit−1,
and productivity, Ait−1, firm characteristics in the current period Xit (age, size, skilled workers, foreign investment, capital-labour ratio, intangible assets, which is coded one if the firm have more
1 Assets refer to corporate intellectual property (e.g. patents, copyrights, trademarks, etc.)

10
than zero intangibles assets and zero otherwise, and a dummy variable for industry,Sectorit. Because our exports variable is a binary we employ a latent variable formulation and write the exports decision probability equation as below:
Prob(Exportit = 1) = ϕ(α1Ait−1+ α2Exportit−1 + α3Xt+ α4Sectort+di + Ψit) (4)
Where ϕ is a probit function, Export is a dummy variable equal to one if there is some exporting
and zero if there is not. α1, α2, α3 and α4 denote parameters to be estimated, diis an unobserved
firm specific time invariant effect affecting the decision to export and Ψitis a homoskedastic, serially uncorrelated and normally distributed residual.
The equations (3) and (4) form the basis for our econometric test for learning effects.
Ait = 𝛽1A𝑖𝑡−1 + 𝛽2Export𝑖𝑡−1 + 𝛽3𝑋𝑖𝑡 + 𝛽4Sector𝑖𝑡 + µi + 𝜖𝑖𝑡 (5)
Prob(Exportit = 1) = ϕ(α1Ait−1+ α2Exportit−1 + α3Xt+ α4Sectort+di + Ψit) (6)
The equation (3) is a linear regression of productivity to test learning by exporting (LBE). The
coefficient 𝛽2 captures the learning-by-exporting effect. If 𝛽2> 0, then this is evidence of learning, i.e. exporting results in higher productivity. The equation (4) is a probit model of the decision to export. If there is support for self-selection-into-exporting, i.e. that efficient firms become
exporters, 𝛼1 would be positive. If there are fixed costs associated with exporting, so that firms
tend to continue exporting once they have entered the international market,𝛼2 would be positive (Roberts and Tybout 1997).
Although results from standard estimation techniques like ordinary least squares (OLS) or panel regressions to test the relation between exporting and efficiency will tell us a lot about the main patterns in the data in terms of the existence of LBE and self-selection, the disadvantage is that these approaches cannot control for unobserved heterogeneity such as the firm’s management capacities, or endogeneity between export status and productivity. Then exporting firms might possess some unobservable characteristics that make them more productive than their domestic counterparts, thus allowing them to overcome sunk cost and enter export markets. Thus, the essential problem at the core of evaluating the effect of exporting is to obtain an estimate of the unobserved counterfactual that is not biased because of any simultaneous relationship between the decision to export and the gains from exporting. Hence, failing to allow for these factors may lead to spurious results in testing the existence of learning by exporting or self-selection.
As discussed in Harris and Li (2005), there are several standard approaches that attempt to eliminate the bias that arises from self-selection. The first approach is instrumental variable (IV) estimation. This method requires finding appropriate instrument variables that affect the treatment decision (decision to export) but do not directly influence the outcome variable (TFP). A second approach to dealing with self-selection bias is matching. Essentially, this involves matching every exporting firm with another firm that has very similar characteristics but does not export, under the matching assumption exporters and non-exporters have the same observable attributes that impact on productivity (and the probability of exporting). Thus the non-exporting, matched sub-group constitutes the counterfactual for the missing information on the outcomes that exporters would have experienced, on average, if they had not exported. Thirdly, the standard Heckman two-stage (or control function) approach is a widely used approach to dealing with self-selection bias, which is closely linked to the IV approach. This approach begins with a first-stage use of a probit (or logit) estimator to generate first-stage predicted values of the probability of exporting, with the

11
second stage estimation of the equation of efficiency including the sample selectivity correction terms from the first-stage model. One other popular method to handle simultaneity bias is the one step estimation of both the exporting decision and the efficiency equations using a dynamic-panel data estimation in a General Method of Moments (GMM) (difference-GMM (Arellano and Bond 1991) or system GMM (Blundell and Bond 1999). We use this approach in our estimation.
4.2 Estimation procedures
Our estimation follows two steps: the TFP calculation and the self-selection and learning-by-exporting test controlling for unobserved effects. In the first step, we estimate equation (2) following the Beveren (2010) approach to estimate the TFP. Measuring TFP is one of the most discussed topics in the areas of trade and industrial organization since the seminal work by Solow (1957). More recently, the increasing availability of firm-level data has allowed for the TFP estimation. However, several methodological issues emerge when TFP is estimated using traditional methods.
To summarize, the productivity estimates using OLS could lead to multiple biases, including simultaneity (endogeneity of input choice), selection bias (not allowing firms to enter into and exit from the market, by using panel data), endogeneity of attrition, omitted prices (typical practice of proxying for firm-level prices using industry-level deflators), and the relevant level of analysis for the estimation of production (pervasiveness of multi-product firms).
The idea is that using OLS to estimate equation (2) assumes that the input variables are exogenous and then are independent from the firm’s efficiency. However, it has been proved in the literature that these assumptions are not realistic, given evidence of correlation between productivity shocks and level of inputs (De Loecker 2007; Marschak 1944). Fixed Effects and Instrumental Variables are some of the popular methods used to deal with this bias issue. There are some improvements in recent work including Olley and Pakes (1996), Blundell and Bond (1999), Levinsohn and Petrin (2003), or Ackerberg et al. (2006). The Endogeneity of Attrition is related to the use of a balanced panel in estimating the Total Factor Productivity (TFP). The entry or exit status/decision of the firm is correlated to the firm productivity (Jovanovic 1982; Hopenhayn 1992; Dunne et al. 1988). Moreover, there is a need to include the exit decision in the model as there is room for correlation
between εit and the capital stock (kit). Given a same level of ψit for two firms, the firm with smaller fixed capital will have less capacity to avoid exit.
The omitted price is another source of bias on estimating TFP. Firm-level prices are not always available to deflate input and output. Using industry-level prices to deflate the input and output of the firm leads to bias in input coefficients, particularly when input choice is correlated with firm-level price variations (De Loecker 2007).
There is a source of biases relevant to firms producing multiple products with different production technologies or different demand systems. If detailed data on the multiple products are not available, firms can be grouped by single product and then the specific TFP for each group is estimated. However, this approach underestimates the TFP as it does not include the relativity in the production process of the multiple products.
Then, the estimation of the TFP requires some specific methods to take into account the bias issues described above: Fixed Effects, Instrumental Variables, GMM, Semi-parametric estimation (Olley and Pakes 1996; Levinsohn and Petrin 2003), collinearity correction. However, recent literature which has applied some of the different methods to firm-level data has reported that the differences

12
between the estimators are relatively small when comparing estimated TFP (Söderbom and Teal 2003; Beveren 2010).
Due to the movements of entry and exit of firms on the export market, we use unbalanced fourteen-year panel data to account for attrition effect on the estimation of TFP and the learning effect.
To estimate the TFP, we deflate the value of the output and input. Due to the limitations of data, we use the index to deflate firm input and output. We construct an index for capital using the data on the gross fixed capital formation panel data and a national consumer price index (CPI). Then we deflate physical capital using this capital index. The value added and employment are deflated using the consumer price index. The estimated form of the total productivity factor is:
Ait = yit − αkkit − αllit. (7)
In the second step, we estimate equation (3) of the learning by exporting and equation (4) of the self-selection using the TFP estimations as the outcome variable of the firm performance. Following Bigsten et al. (2004)’s methods of testing the learning-by-exporting hypothesis, we estimated both equation of productivity (3) and probability to export (4) by GMM in a one-step procedure using the xtabond2 command in stata. The general model is a Cobb-Douglas production function.
5 Data and summary statistics
5.1 Data
We explore a unique panel of firm-level data comprising a representative set of Senegalese manufacturing firms that allows us to identify the link between firm efficiency and exporting.
The data are collected annually by the CUCI (Centre Unique de Collecte de l’Information), a department of the National Agency for Statistics and Demography (NASD) of the Senegalese Ministry of Economy and Finances, for the period 1998–2011.
The data set covers all firms in the Senegalese manufacturing, agriculture, mining, commerce sectors and several other service sectors. We use observations for the manufacturing sector which is our focus. The data was collected through two tables. The first one, which had to be filled by firms that have a turnover of at least 30 million CFA francs, gives detailed information on firm-level business activities in which the firm operates, sales, capital stock, intermediate materials, purchases, exports, assets such as research and development and patents and licenses, various other financial data such as costs, profits, debts, subsidies and investment. The second table concerns all the firms currently operating and gives information on the number of employees, the number of employees by qualification and the salaries.
After merging the two sub-data sets, the initial panel data consists of about 1,789manufacturing firms (15,035 observations). In order to construct an appropriate data set for the purpose of our research, we restrict the data to firms that provided information for at least three consecutive years over the period 1998 to 2011 (because this is the minimum time period necessary to control for unobserved firm effects in the econometric analysis) and without missing information on critical variables for the analysis, such as firm output, value added, capital, labour, employment, age, among
13
others. The resulting unbalanced panel has 1,177 manufacturing firms (11,063 observations) including exporters and non-exporters.
5.2 Descriptive statistics
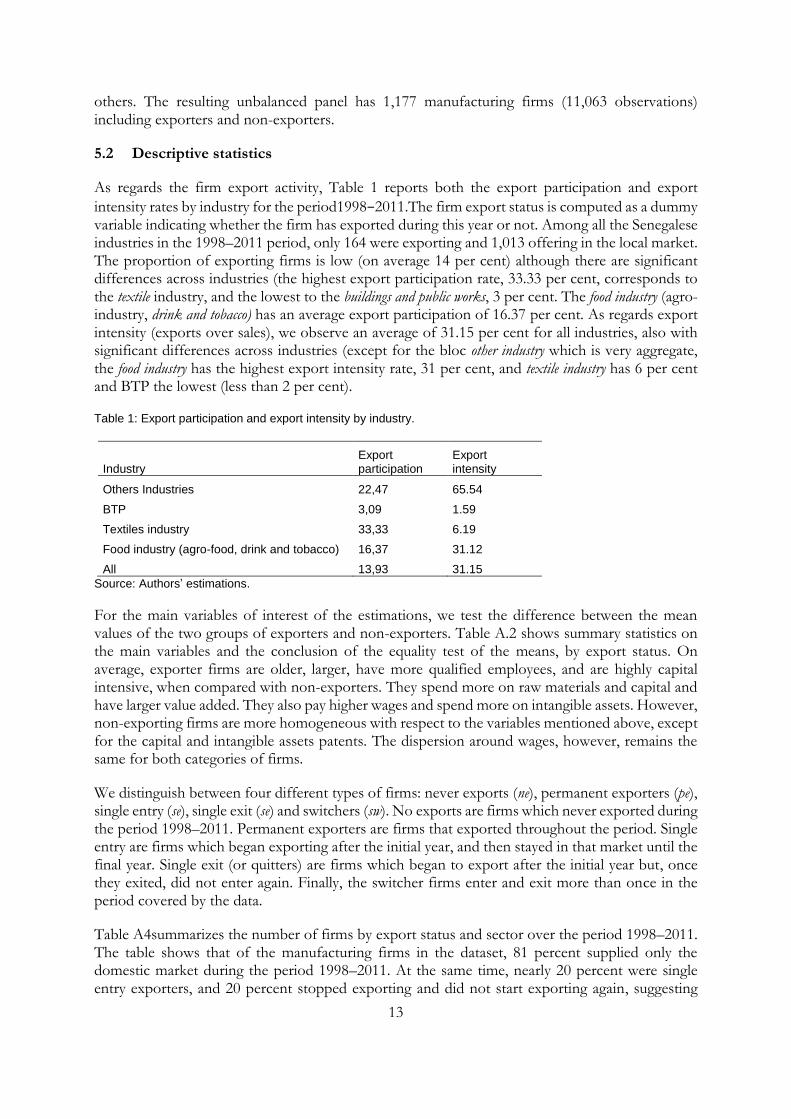
As regards the firm export activity, Table 1 reports both the export participation and export
intensity rates by industry for the period1998–2011.The firm export status is computed as a dummy variable indicating whether the firm has exported during this year or not. Among all the Senegalese industries in the 1998–2011 period, only 164 were exporting and 1,013 offering in the local market. The proportion of exporting firms is low (on average 14 per cent) although there are significant differences across industries (the highest export participation rate, 33.33 per cent, corresponds to the textile industry, and the lowest to the buildings and public works, 3 per cent. The food industry (agro-industry, drink and tobacco) has an average export participation of 16.37 per cent. As regards export intensity (exports over sales), we observe an average of 31.15 per cent for all industries, also with significant differences across industries (except for the bloc other industry which is very aggregate, the food industry has the highest export intensity rate, 31 per cent, and textile industry has 6 per cent and BTP the lowest (less than 2 per cent).
Table 1: Export participation and export intensity by industry.
Industry Export participation
Export intensity
Others Industries 22,47 65.54
BTP 3,09 1.59
Textiles industry 33,33 6.19
Food industry (agro-food, drink and tobacco) 16,37 31.12
All 13,93 31.15
Source: Authors’ estimations.
For the main variables of interest of the estimations, we test the difference between the mean values of the two groups of exporters and non-exporters. Table A.2 shows summary statistics on the main variables and the conclusion of the equality test of the means, by export status. On average, exporter firms are older, larger, have more qualified employees, and are highly capital intensive, when compared with non-exporters. They spend more on raw materials and capital and have larger value added. They also pay higher wages and spend more on intangible assets. However, non-exporting firms are more homogeneous with respect to the variables mentioned above, except for the capital and intangible assets patents. The dispersion around wages, however, remains the same for both categories of firms.
We distinguish between four different types of firms: never exports (ne), permanent exporters (pe), single entry (se), single exit (se) and switchers (sw). No exports are firms which never exported during the period 1998–2011. Permanent exporters are firms that exported throughout the period. Single entry are firms which began exporting after the initial year, and then stayed in that market until the final year. Single exit (or quitters) are firms which began to export after the initial year but, once they exited, did not enter again. Finally, the switcher firms enter and exit more than once in the period covered by the data.
Table A4summarizes the number of firms by export status and sector over the period 1998–2011. The table shows that of the manufacturing firms in the dataset, 81 percent supplied only the domestic market during the period 1998–2011. At the same time, nearly 20 percent were single entry exporters, and 20 percent stopped exporting and did not start exporting again, suggesting

14
that a significant number of exporters quit exporting later. Almost, 14 percent of the firms are switchers. The minority of the firms, 0.12 percent, were persistent exporters over the fourteen-year period.
6 Results
We use the panel on Senegalese manufacturing observed over the period 1998–2011. Our results for the specification of self-selection (equation 4) and learning by exporting (equation 3) using the estimation strategy outlined in the previous section are reported in Table 2. As exporters’ survival is a significant factor in explaining differences in long-term export performance, particularly in developing countries (Bernard et al. 2007; Besedes and Prusa 2011), we take into account the movements of entry and exit of the firms using an unbalanced panel data 1998–2011.
Table 2: Self-selection and learning-by-exporting effects, Senegal 1998–201
Variables Self-Selection
Learning by Exporting
0.0792868** 0.1362903***
0.0339634 0.0121778
1.840304*** 0.1572953***
0.0741146 0.0339953
Lnage -0.0265948 0.0009513
0.0407716 0.012817
lnsize 0.2074637*** -0.5207598***
0.0315404 0.0149113
Skillworkers 0.4176225*** 0.2791582***
0.104516 0.0345007
Lncapital-labour 0.1893683*** -0.755737***
0.0373625 0.0146822
Foreignownership 0.0618314 0.4325706***
0.0858136 -0.048
Research & developmemt -0.0144678
0.0718185
0.1598724 0.0667902
Brevets and Licenses 0.1277417***
0.113433***
0.075107 0.0318201
Constant -5.103966*** 9.568494***
0.5156551 0.1985762
Observations 3,481 3,309
Note: Standard errors in parentheses; *** p<0.01, ** p<0.05, * p<0.1
Source: Authors’ estimations
The first column of Table 1 reports the results for the export probit equation. The coefficient on lagged TFP, which is used in the literature to account for the self-selection of the most efficient firm in the foreign market (Roberts and Tybout 1997; Bernard and Jensen 1999; Greenaway and Kneller 2007; Wagner 2007), is positive and highly significant, providing fairly strong evidence for

15
a self-selection process of the more efficient firms into exporting. This suggests that an increase in the firm’s efficiency at time t increases the probability of exporting at times t+1, as predicted by the self-selection hypothesis.
The estimated coefficient on the lagged export status variable is positive and highly significant (at the 1 per cent level) indicating a strong persistence of the previous exporters’ firms in the export decision. This suggests that a firm’s current involvement in exporting activity may well lower the fixed costs of engaging in exporting in the next period. (Bigsten et al. 2003; Roberts and Tybout 1997). The log of a firm’s age has no effect on the likelihood of the decision to export. By contrast, the coefficient of a firm’s size measured by the number of employees is positive as expected and highly significant, suggesting that larger firms are more likely to engage in exporting activity. The positive size effect on the probability of exporting is not surprising. In line with other studies, our results suggest that larger firms are more likely to export. The variable skill workers which indicate the quality of labour, measured by the ratio number of employers with high-level qualifications and total employees, has an impact on the decision to export. In line with the findings of previous studies (Facundo and Ercolani 2007, we find that firms with a higher proportion of skilled workers are much more likely to enter export markets. Though it is easy to argue that skilled workers allow for better appropriation of knowledge involved in the exporting experience.
Another interesting finding of the export decision results is that firms with non-zero intangible assets are much more likely to export, and this again points to a need to invest in highly productive resources that lead to a greater ability to internalize external knowledge in order to overcome barriers to exporting. The coefficient of the intangible assets (patents, licenses, software) is positive and significant at the 5 per cent level, providing evidence for a strong effect of intangible assets in the export decision.
The decision on whether to export is driven by other firm characteristics. Among these characteristics, we explore the driving role played by ownership on the decision to export. The coefficient on foreign capital is positive as expected, but it is not statistically significant, suggesting that the presence of foreign capital does not affect the decision to export.
The second column of Table 6.1 shows strong confirmation of the learning-by-exporting effects, with a positive and highly significant coefficient on lagged exports. This suggests that firms who had exported one year previously report more learning from their partners.
Exporting is associated with some firm characteristics: capital-labour level, existence of foreign ownership and intangible assets, firm age, firm size and quality of employment, (Facundo and Ercolani 2007). The coefficient on capital-labour is positive and significant at 5 per cent. This suggests that richer exporters increase productivity more rapidly as they have more financial resources to hire highly qualified workers and modern equipment, which is very likely to be translated into higher productivity. The finding that exporters with foreign ownership increase productivity more rapidly is interesting, for it suggests that experience in international markets has an important influence on the extent of learning by exporting. Innovation and technological upgrading are widely studied mechanisms related to trade and productivity increases: firms invest in intangible assets, such as R&D, advertising, or new technology, to overcome existing barriers to entry into new markets (Carlton 2005). As expected, the estimated coefficient on intangible assets shows a positive and strong effect on exporters’ productivity. This suggests that firms who have access to patents, licenses and software report more learning from buyers, and this again points to a need to invest in highly productive resources that lead to a greater ability to internalize external knowledge in order to overcome barriers to exporting. The firm age, which indicates the firm’s survival as one component of the firm’s performance, may well indicate the benefits of the

16
knowledge involved in exporting experience. As with the equation of exporting, our findings indicate a positive but not significant coefficient of firm age on the learning process.
As to the rest of firm characteristics, observe that small-employer exporters and exporters with high skilled-labour learn more from their exporting activities as indicated by the large statistical significance of size and skilled worker variables. Taken together these results highlight the fact that learning requires fluid dissemination of knowledge. Though it is easy to argue that skilled workers
allow for better appropriation of knowledge involved in the exporting experience, the size effect is surprising. On one hand, large firms are generally more structured and this would facilitate a better absorption and use of new knowledge. On the other hand, in a small firm, knowledge might be easier to disseminate. Our result suggests that the latter offsets the former.
7 Conclusion
Learning by exporting has been advanced as one theoretical explanation for the empirically verified export premium. The rationales for such an effect focus on knowledge and information flows from foreign customers and competitors, incentives for innovation and reduction of inefficiency (Andersson and Lööf 2009). The empirical literature, however, did not show systematic evidence that efficient firms may self-select into the export market (export by learning) or that exporting causes efficiency gains (learning by exporting).
Our paper aims to provide evidence of learning by exporting and self-selection. Using unique firm-level panel data from Senegalese manufacturing sectors in the 1998–2011 period, we investigate
these questions using a two‐step strategy. In the first step we use a dynamic Cobb‐Douglas production function to estimate firm productivity. In a second step, following Bigsten et al. (2003) approach, we jointly estimated both the equation of productivity and probability to export by GMM, controlling for other unobserved effects.
Our preliminary results indicate evidence of both mechanisms: the more efficient firms became exporters (self-selection) and firm productivity increased by exporting (learning by exporting). Results are consistent with the inclusion of several firm characteristics such as firm size, skilled labour, physical capital, capital structure, ownership structure, assets, and industry classification. Our finding suggest that larger firms and those with more qualified workers are generally much more likely to export, and this again points to a need to invest in highly productive resources that lead to a greater ability to internalize external knowledge in order to overcome barriers to exporting. Exporting firms acquire external knowledge through various channels. Foreign-owned firms learn more from clients. Our results suggest also that firms with skilled workers are more able to reap the benefits of exposure to export markets than are other manufacturing firms. Another interesting finding is that firms which invest to access to intangible assets such as patents and licenses have higher gains of efficiency in exporting. Finally small firms seem to particularly learn more from exporting.
From a policy perspective, the learning-by-exporting finding suggests that Senegal has much to gain from encouraging its manufacturing sector to export by increasing the ability of domestic firms to overcome foreign market barriers as well as assimilate further benefits arising from exporting. Given the importance of the skills of workers in the process of acquiring productivity gains on the external market, special attention should be accorded to the training of the workforce. Hence, the state could help developing curricula in colleges or other training programmes to enable companies to have the skills they need. Special public strategies to promote firms’ access to patents and licenses and innovation must be implemented. Finally, support directed towards small and medium

17
enterprises programmes could strengthen their productivity gains on the external market. The initiatives already undertaken, which favour the small firms, might be continued and reinforced.
18
References
Ackerberg D., Caves K., and Frazer, G. (2006). ‘Structural Identification of Production Functions’. Munichal Personal RePEc Archive, Paper 38349. Munich: RePEc.
Albornoz, F., Calvo H. F., Pardo Corcos, G., and Ornelas, E. (2012). ‘Sequential Exporting’. Journal of International Economics, 88(1): 17-31.
Albornoz, F., and Ercolani, M.G. (2007). ‘Learning by Exporting: Do Firm Characteristics Matter? Evidence from Argentinian Panel Data’. Working Paper 4. Birmingham: University of Birmingham.
Andersson, M. and Lööf, H. (2009). ‘Learning-by-exporting Revisited: The Role of Intensity and Persistence’. The Scandinavian Journal of Economics, 111(4): 893-916.
Arellano, M., and Bond, S. (1991). ‘Some Tests of Specification for Panel Data: Monte Carlo. Evidence and an Application to Employment Equations’. Review of Economic Studies, 58(2): 277-97.
Arnold, J., and Hussinger, K. (2005). ‘Export Behavior and Firm Productivity in German
Manufacturing: A Firm‐level Analysis’. Review of World Economics, 141(2): 219-43.
Bartelsman, E.J., and Doms, M. (2000). ‘Understanding Productivity: Lessons from Longitudinal Microdata’. Journal of Economic Literature, 38: 569-95.
Bernard, A.B., Jensen, J.B., Redding, S.J., and Schott, P.K. (2007). ‘Firms in International Trade’. Working Paper 13054. Cambridge, MA: National Bureau of Economic Research.
Bernard, A., Redding, S.and Schott, P. K. (2007). ‘Comparative Advantage and Heterogeneous Firms’. Review of Economics Studies,74(1): 31-66 .
Bernard, A.B., and Jensen, J.B. (1995). ‘Exporters, Jobs and Wages in US Manufacturing 1976-87’. Brookings Papers on Economic Activity Microeconomics, 67-119.
Bernard, A.B. and Jensen, J.B. (1999). ‘Exceptional Exporter Performance: Cause, Effect, or Both?’. Journal of International Economics, 47(1): 1-25.
Besedes, T., and Prusa, T. J. (2011). ‘The Role of Extensive and Intensive Margins and Export Growth’. Journal of Development Economics, 96(2): 371-79.
Beveren, V. (2010). ‘Product and Process Innovation and Firms’ Decision to Export: Firm-level Evidence for Belgium’. LICOS Discussion Paper 247. Leuven: LICOS.
Bigsten, A., Collier, P., Derson, S., Fafchamps, M., Gauthier, B., Gunning, J.W., Oduro, A., Oostendorp, R., Patillo, C., Söderbom, M., Teal, F. and Zeufack, A. (2003). ‘Do African Manufacturing Firms Learn from Exporting?’. CSAE Working Paper.
Bigsten, A., Collier, P., Dercon, S., Fafchamps, M., Gauthier, B., Gunning, J., Oduro,A., Oostendorp, R., Pattillo, C., Söderbom, M., Teal, F., and Zeufack, A. (2004). ‘Do African Manufacturing Firms Learn from Exporting?’. Journal of Development Studies, 40(3): 115-41.
Bigsten, A., and Gebreeyesus, M. (2008). ‘Firm Productivity and Exports: Evidence from Ethiopian Manufacturing’. Working Paper 303. Gothenburg: School of Business, Economics and Law, University of Gothenburg.
Blundell, R. and Bond, S. (1998). ‘Initial Conditions and Moment Restrictions in Dynamic Panel Data Models’. Journal of Econometrics, 87: 115-43.
Bustos, P. (2011). ‘Trade Liberalization, Exports, and Technology Upgrading: Evidence on the Impactof MERCOSUR on Argentinian Firms’. American Economic Review, 1011: 304-40.

19
Cadot, O., Iacovone, L., Pierola, M.D. and Rauch, F. (2013). ‘Success and Failure of African Exporters’. Journal of Development Economics, 284-96.
Carlton, D.W. (2005). ‘Barriers to Entry’. Working Paper 1645. Cambridge, MA: National Bureau of Economic Research.
Castellani, D., and Zanfei, A. (2007). ‘Internationalisation, Innovation and Productivity: How do Firms Differ in Italy?’. The World Economy; doi: 10.1111/j.1467-9701.2007.00875.x.
Clerides S., Lach, S., and Tybout, J. (1998). ‘Is Learning by Exporting Important? Micro-Dynamic Evidence from Colombia, Mexico and Morocco’. Quarterly Journal of Economics, 113: 903-48.
Contractor F.J., Sumit K.K., and Chin-Chun H. (2003). ‘A Three-stage Theory of International Expansion: The Link between Multinationality and Performance in the Service Sector’. Journal of International Business Studies, 34: 5–18.
Crespi, G., Criscuolo, C., and Haskel, J. (2009). ‘Productivity, Exporting and the Learning by Doing Hypothesis: Direct Evidence from UK Firms’. Canadian Journal of Economics, 41(2): 619-38.
Dai, M., and Yu, M. (2013). ‘Firm R&D, Absorptive Capacity and Learning by Exporting: Firm-level Evidence from China’. The World Economy, doi: 10.1111/twec.12014.
Damijan, J.P., and Kostevc, C. (2006). ‘Learning‐by‐exporting: Continuous Productivity Improvements or Capacity Utilization Effects?’. Review of World Economics, 142: 599–614.
Damijan, J., P., Kostevc, C., and Polanec, S. (2008). ‘From Innovation to Exporting or Vice Versa? Causal Link between Innovation Activity and Exporting in Slovenian Micro Data’. Discussion Paper 204. Leuven: LICOS.
De Loecker, J. (2007). ‘Do Exports Generate Higher Productivity? Evidence from Slovenia’. Discussion Paper 151. Leuven: LICOS.
De Loecker, J. (2010). ‘A Note on Detecting Learning by Exporting’. NBER Working Papers 16548. Cambridge, MA: National Bureau of Economic Research.
Dunne T. et al. (1988). ‘Patterns of Firm Entry and Exit in U.S. Manufacturing Industries’. Journal of Economics, 19(4): 495-515.
Eaton, J., Kortum, S., and Kramarz, F. (2011). ‘An Anatomy of International Trade: Evidence from French Firms’. Econometrica, 79(5): 1453-98.
Facundo A., and. Ercolani, M. (2007). ‘Learning by Exporting. Do Firm Characteristics Matter: Evidence from Argentinian Panel Data’. Working Paper. Birmingham: Department of Economics University of Birmingham.
Fernandes A., and Isgut A.E. (2015). ‘Learning-by-Exporting Effects: Are They for Real?’. Emerging Markets Finance and Trade, 51(1): 65-89.
Girma, S., Greenawayn, D., and Kneller, R. (2004). ‘Does Exporting Increase Productivity? A Microeconometric Analysis of Matched Firms’. Review of International Economics, 12(5): 855–66.
Goddard J., Tavakoli, M., and Wilson J.O.S. (2006). ‘Determinants of Profitability in European Manufacturing and Services: Evidence from a Dynamic Panel Model’. Applied Financial Economics, 15: 1269-82.
Goldberg, P., and Pavcnik, N. (2007). ‘Distributional Effects of Globalization in Developing Countries’. Journal of Economic Literature, 45(1): 39-82.
Greenaway, D., and Kneller, R. (2004). ‘Exporting and Productivity in the UK’. Oxford Review of Economic Policy, 20(3): 358–71.

20
Greenaway, D., and Yu, Z. (2004). ‘Firm Level Interactions between Exporting and Productivity: Industry Specific Evidence’. Research Paper. Leverhulme Centre for Research on Globalization and Economic Policy.
Greenaway, D., and Kneller, R. (2007). ‘Firm Heterogeneity, Exporting and Foreign Direct Investment’. Economic Journal, 117(517): 134–61.
Greenaway, D., and Kneller, R. (2008). ‘Exporting, Productivity and Agglomeration’. European Economic Review, 52: 919-39.
Grossman, G., and Helpman, E. (1991). Innovation and Growth in the Global Economy. Cambridge, MA: The MIT Press.
Hansson, P., and Lundin, N. (2004). ‘Exports as Indicator on or a Promoter of Successful Swedish Manufacturing Firms in the 1990s’. Review of World Economics, 140(3): 415–45.
Harris R., and Li, Q.C. (2005). ‘Learning-by-Exporting? Firm-Level Evidence for UK Manufacturing and Services Sectors’. Available at: http://ecomod.net/sites/default/files/document-conference/ecomod2008/576.pdf .
Hopenhayn, H.A. (1992). ‘Entry, Exit, and Firm Dynamics in Long Run Equilibrium’. Econometrica, 60(5): 1127-50.
International Monetary Fund (IMF) (2012). Report on Senegal 12/337. Washington, DC: IMF:
Ito, K., and Lechevalier, S. (2010). ‘Why Do Some Firms Persistently Outperform Others? An Investigation of the Interactions between Innovation and Export Strategies’. RIETI Discussion Paper 10-E-037.
Jovanovic, B. (1982). ‘Selection and the Evolution of Industry’. Econometrica, 50(3): 649-70.
Kraay, A. (1999). ‘Exportations et Performances Économiques: Étude d’un Panel d’Entreprises Chinoise’. Revue d’Économie du Développement, 1(2): 183–207.
Levinsohn, J., and Petrin, A. (2003). ‘Estimating Production Functions using Inputs to Control for Unobservables’. Working Paper 7819. Cambridge, MA: NBER.
Lileeva, A., and Trefler, D. (2010). ‘Improved Access to Foreign Markets Raises Plant-Level Productivity…for Some Plants’. The Quarterly Journal of Economics, 125(3): 1051-99.
Love, J., and Ganotakis, P. (2013). ‘Learning by Exporting: Lessons from High-technology SMES’. International Business Review, 1-17.
Marschak, A. (1944). ‘Random Simultaneous Equations and the Theory of Production’. Econometrica, 12(3): 143-205.
Mánez‐Castillejo, J.A., Rochina‐Barrachina, M.E., and Sanchis‐Llopis, J.A. (2010). ‘Does firm Size
Affect Self‐selection and Learning‐by‐exporting?’. The World Economy, 33(3): 315‐46.
Melitz, M. (2003). ‘The Impact of Trade on Intra-Industry Reallocations and Aggregate Industry Productivity’. Econometrica, 71(6): 1695-725.
Melitz, M.J., and Ottaviano, G.I.P. (2008). ‘Market Size, Trade, and Productivity’. The Review of Economic Studies, 75(1): 295-316.
Ministère de l’Economie et des Finances du Sénégal, 1988, Programme d’ajustement du secteur financier, 1989–1991. Unpublished.
Olley, G.S., and Pakes, A. (1996). ‘The Dynamics of Productivity in the Telecommunications Equipment Industry’. Econometrica, 64(6): 1263–97.

21
Pavcnik, N. (2002). ‘Trade Liberalization, Exit, and Productivity Improvement: Evidence from Chilean Plants’. Review of Economic Studies, 69(1): 245–76.
Roberts, M.J., and Tybout, J.R. (1997). ‘The Decision to Export in Colombia: An Empirical Model of Entry with Sunk Costs’. American Economic Review, 87(4): 545-64.
Rodrik, D. (1988). ‘Imperfect Competition, Scale Economies and Trade Policy in Developing Countries’. In R.E. Baldwin (ed.). Trade Policy Issues and Empirical Analysis. Chicago: University of Chicago Press.
Serti, F., and Tomasi, C. (2008). ‘Self‐Selection and Post‐Entry Effects of Exports: Evidence from Italian Manufacturing Firms’. Review of World Economics, 144(4): 660-94.
Söderbom, M., and Teal, F. (2003). ‘Are Manufacturing Exports the Key to Economic Success in Africa?’. Journal of African Economies, 12(1): 1-29.
Solow, R.M. (1957). ‘Technical Change and the Aggregate Production Function’. The Review of Economics and Statistics, 39(3): 312-20.
Tybout, J.R. (1998). ‘Manufacturing Firms in Developing Countries: How Well Do They Do, and Why?’. Journal of Economic Literature, Vol. XXXVIII: 11–44.
Van Biesebroeck, J. (2005). ‘Exporting Raises Productivity in Sub‐Saharan Manufacturing Plants’. Journal of International Economics, 67(2): 373–91.
Wagner, J. (2002). ‘The Causal Effects of Export on Firm Size and Labour Productivity: First Evidence from a Matching Approach’. Economics Letters, 77(2): 287-92.
Wagner, J. (2007). ‘Exports and Productivity: A Survey of the Evidence from Firm-level Data’. The World Economy, 30: 60-82.

22
Appendix
Table A1: Senegal, Distribution of the firm by sector, 1998-2011
Year Textiles Agro- industries
Others industries Total firms
1998 18 91 314 423
1999 20 102 346 468
2000 21 114 374 509
2001 22 125 428 575
2002 23 145 465 633
2003 22 154 503 679
2004 26 191 600 817
2005 27 205 641 873
2006 27 225 698 950
2007 27 239 732 998
2008 27 259 764 1050
2009 30 253 766 1049
2010 36 254 769 1059
2011 21 242 717 980
Source: Authors’ estimations.

23
Table A.2. Senegal, Summary statistics by export status
Test of equality of means Test for equalityof variances
Non exporters (NE)_
Exporters (E)
Ecart (NE-E)
p-value Null hypothesis
Non exporters (NE)
Exporters (E)
Ecart (NE-E) p-value Null hypothesis
Turnover 1,75E+09 1,11E+10 -9,35E+09 0 Rejected 1,20E+20 1,03E+21 -9,10E+20 0 Rejected
Raw material and other supplies
4,03E+08 1,92E+09 -1,52E+09 0 Rejected 3,58E+18 2,17E+19 -1,81E+19 0 Rejected
Capital 3,97E+08 1,09E+09 -6,93E+08 0,0001 Rejected 2,88E+19 2,66E+19 2,20E+18 0,0868 Rejected (à 5%)
Staffcost 1,90E+08 8,67E+08 -6,77E+08 0 Rejected 1,17E+18 2,27E+18 -1,10E+18 0 Rejected
Salaries 239793,8 671172 -4,31E+05 0 Rejected 1,4095E+12 1,3623E+12 4,73E+10 0,2654 Accepted
Values added 2,64E+08 2,02E+09 -1,76E+09 0 Rejected 5,74E+18 2,61E+19 -2,04E+19 0 Rejected
Skill labor 3,972272 8,410292 -4,44E+00 0 Rejected 55,32711 196,3259 -1,41E+02 0 Rejected
Firm size 97,98043 262,058 -1,64E+02 0 Rejected 151628 255646 -1,04E+05 0 Rejected
Value added per capita
6701479 1,03E+07 -3,60E+06 0,0228 Rejected 2,007E+15 5,4289E+14 1,46E+15 0 Rejected
Capital per capita 5661545 5093933 5,68E+05 0,5891 Accepted 8,8209E+14 7,322E+13 8,09E+14 0 Rejected
Firm age 12,92267 20,25803 -7,34E+00 0 Rejected 156,723608 248,482257 -9,18E+01 1 Accepted
Costs of research and development
1,26E+09 3,14E+07 1,23E+09 0,0195 Rejected 1,4288E+19 7,1234E+15 1,43E+19 0 Rejected
Patents, licenses, software
1,59E+07 1,61E+07 -2,00E+05 0,9491 Accepted 1,0201E+16 4,356E+15 5,85E+15 0 Rejected
Source: Authors’ estimations.

24
Table A3: Senegal, Distribution of the firm by status and by sector, 1998–2011
Export status Proportion
Never export 0,8143361
Permanentexporters 0,0012655
Single entry 0,0199765
Single exit 0,0195245
Switchers 0,1448974
Source: Authors’ estimations.

25
Table A4: Senegal, Distribution of the firm by status and by sector, 1998-2011
Industry Number of firms % in the total firms Observations
Entry single Single exit switcher Permanent Never
Energy 41 3.48 315 1 3 37
Other mineral products 14 1.19 162 1 3 10
Chemical industries 58 4.93 642 2 3 19 1 33
Bakery,pastry and pasta 163 13.85 1342 2 4 157
Beverage industries 14 1.19 119 1 2 11
Industries of oilseeds 5 0.42 54 2 3
Milk industries 14 1.19 148 1 2 11
Miscellaneous industries 29 2.46 273 7 22
Wood 18 1.53 185 1 17
Rubber and plastics 38 3.23 420 3 1 10 24
Leather and shoes 13 1.10 157 2 2 9
Paper and cardboard 90 7.65 887 4 1 9 76
Textile and clothing 29 2.46 333 1 9 19
Metalworking 63 5.35 636 8 55
Preparation of sites 337 28.63 2878 8 329
Production of meat and fish 38 3.23 391 2 4 10 22
Transportation fruit and vegetables 47 3.99 468 3 10 34
Working of grain 6 0.51 77 4 2
Installation and finishing 115 9.77 1082 1 5 109
Other mechanical industry 45 3.82 480 2 4 6 33
Total 1177 100.00 11049 21 18 124 1 1013
Source: Authors’ estimations.

26
Source: Authors’ construction from official documents.
Table A5: Senegal, industrial policy matrix
Time period Policy objectives Sectors / activities targeted
Instruments Results
1960s and 1970s
protection of local industry
Promotion of private sector Activities of processing of local and imported products Promotion of investment Senegalese businessmen Large companies Foreign investors Small and medium enterprises Exporting companies
High port duties, quotas, licensing, Prohibition Investment Code Investment Code to lower investments 20 millions Raising capital, including public capital Special agreements and memoranda of understanding between business companies and government Industrial areas EPZ Dakar
An industrial fabric composed of large enterprises without trade between them and weakly competitive during the 1960s and 1970s
1980s and 1990s
Improvement of the overall business environment, under the New Industrial Policy (NIP) during the years 1979-1993
All sectors Exporting companies
Macroeconomic stabilization Reducing the level of protection Liberalization of prices and marketing channels Simplification of administrative procedures Improving the efficiency of public services Subsidies / export financing Status of free points established in 1991 Business closures and job losses, particularly in the textile sector between 1988 and 1993
Fermetures d’entreprises et pertes d’emplois, notamment dans le secteur textile entre 1988 et 1993
Improving competitiveness Facilitating access to counseling industrial activities
Industrial activities Devaluation in 1994 and reforms Creation of Private Sector Foundation Industrial Restructuring Fund Abandonment of quantitative restrictions Simplification of the system of tariffs and reduced rates in the Common External Tariff (CET) of WAEMU
Renewed dynamism and growth of the industrial sector during the years 1995-2005 after the forced restructuring driven by the NIP and in the effect of devaluation and possibly CET
Since 2000 Rationalization of the support system to the private sector.
SMEs Creation of APIX (2000), ADEPME (2001),ASN (2002), the CPI (2002)
Slow growth during the years 2006 - 2011 under the effect of exogenous shocks, and insufficient competitiveness Recovery / promotion of
industries, industrial redeployment
Sectors and SMEs Business environment of international standard, Economic centers Special Economic Zones