wihlborgs fastigheter ab interim report · 3 wihlborgs interim report january-september 2010...
TRANSCRIPT

Wihlborgs Fastigheter AB
Interim report January – September 2010
■ The profit of the period increased by SEK 214 million to SEK 574 million (360), and earnings per share SEK 15.03 (9.94)
■ Continued positive net rentals by SEK 20 million, of which SEK 7 million during the third quarter.
■ Rental income increased by 3 per cent to SEK 957 million (928)
■ Net operating income increased by SEK 689 million (673)
■ Earnings from property management increased by 14 per cent to SEK 460 million (404)
■ The pre-tax profit from property manage-ment for the whole of 2010 is expected to exceed SEK 600 million
Key figures for the Group, SEKm2010
Jul-Sep2009
Jul-Sep 2010
Jan-Sep 2009 Jan-Sep
Rental income 318 307 957 928
Net operating income 237 230 689 673
Earnings from property management 158 150 460 404
Change in value 206 -21 258 61
Tax -59 -30 -144 -105
Profit after taxes 305 99 574 360
Earnings per share, SEK 7.94 2.73 15.03 9.94
Surplus ratio, % 75 75 72 73
Equity/assets ratio, % - - 30.4 28.3
Economic occupancy, % - - 94.0 94.0
W i h l b o r g s F a s t i g h e t e r a b • i n t e r i m r e p o r t • j a n u a r y – s e p t e m b e r

■2
Wihlborgs interim report january-september 2010
Wihlborgs interim reportJanuary-September 2010
Opening ceremony of Skåne Regional Council House at Dockan September 10, 2010. Photo Wihlborgs.
■ 3
Wihlborgs interim report january-september 2010
Comment of the market The Öresund RegionThe economic recovery has gained full momentum, and one distinct sign that the market is now pointing upwards is that the Swedish Central Bank, Riksban-ken, has started to raise interest rates. We saw two increases of 0.25 percentage points in the third quarter. An additional increase in October means that the repo rate is now 1.00 percent.
The crisis appears to be over also for the Öresund Region, although the recovery is moving significantly faster on the Swedish side of Öresund than on the Danish side. Själland was also badly hit by a property crisis in addition to the finance crisis in general. In its latest forecast (October 2010), the Øresund Insti-tute believes that the gross regional product (GRP) will increase by 2.5 percent in the Öresund Region in 2010 in total, spread between 2.2 percent growth in Själland and 4.3 percent in Skåne. The rate of growth will then increase slightly in Denmark in 2011, while Sweden will probably be less strong. Growth in Själ-land is expected to be 2.7 percent, and 3.0 percent in Skåne.
Due to the lower proportion of manufacturing industry, Skåne has managed relatively well during the recession. Employment declined by 1.6 percent in Skåne in 2009, simultaneously as employment fell by as much as 2.1 percent in Sweden. With an employment growth rate of 1.5 percent, Skåne is also stronger than Sweden as a whole in 2010, where employment growth is forecasted to be 1.0 percent. In 2011, employment is anticipated to rise by 1.4 percent in Skåne.
The labour market in Denmark has experienced significantly tougher times, and employment fell by as much as 3.2 percent in 2009. But like in Sweden, the decline in employment was lower in the Öresund Region (Själland) with 2.9 percent, compared with Denmark as a whole. The problems that followed the finance and property crises have resulted in considerably poorer public finances, and rationalisation measures are being taken in the public sector. Employment growth is therefore forecasted to first turn upwards in 2011, with a rate of 0.7 percent.
Optimism is also now quite manifest in Skåne within the property market, which is traditionally late in the business cycle. We can perceive increased demand, and tenants are more self-assured in their decisions. The crisis had a greater impact on industry than the service sector, and the rise in demand pertains essentially to office premises. The rental markets in the region are rela-tively stable, and have been throughout the crisis. We have seen modest rises in vacancies and stable rent levels. We believe that rental markets within the near future will remain stable, apart from in Lund where the market will be tempora-rily tougher in view of the phasing out of AstraZeneca in 2011.
Optimism is also growing in the transactions market, where volumes have increased strongly compared with last year. According to Newsec, the transac-tion volume for the first three quarters of 2010 amounted to SEK 59.7 billion for items in excess of SEK 100 million, which is basically double that seen for the full-year 2009.
Rent levels for office premises in the Västra Hamnen district are currently around SEK 2,100 per m2, while rent levels for modern office premises in central Malmö are slightly lower at approximately SEK 2,000 per m2.
■ 3
Opening ceremony of Skåne Regional Council House at Dockan September 10, 2010. Photo Wihlborgs.
Skånes Dansteaters’ performance Dockplats 2010. Photografer Klas Andersson.

■4
Wihlborgs interim report january-september 2010
Income, expenses and resultComparision figures for income statement items relate to values for Jan-Sep 2009 and balance sheet items as at 2009-12-31.
Rental incomeRental income amounted to SEK 957 million (928). The sum includes SEK 5 million that relates to the final settlement for 2009 for supplemen-tary debiting. An additional SEK 4 million has been received further to the one-off termination of a lease. Other increases of rental income are attributable to indexation, renegotiation, new leases, rental income from properties acquired in 2009 and 2010, as well as projects that have been completed.
The total growth in lease income amounted to 3 per cent compared with 2009 this is in spite of the consumer price index in October 2009 which is the reconciliation month for leases’ index calculation for 2010 showing a negative figure of 1.5 percentage units. Furthermore the rental income has been adversely affected by a change in exchange rates against Denmark. This effect amounts to SEK 6 million.
The leasing level is unchanged at 94 per cent, which is the same as at the end of 2009.
During the period, the signing of new lease agreements on a full-year basis amounted to SEK 107 million (95).
Notices of termination during the period were SEK 87 million (75).
Property costsTotal property costs were SEK 268 million (255). Despite the consequenc-es of a winter that was more severe than normal there were increased costs for road maintenance and energy for the period. The deviation by compa-rison with a normal winter is estimated at approximately SEK 5 million.
Net operating incomeThe net operating income amounts to SEK 689 million (673), which is a surplus ratio of 72 per cent (73).
Central administrationCosts for central administration was SEK 24 million (23).
Property sales and changes in valuesWihlborgs disposed five properties during the period, a total purchase price of SEK 249 million. The valuation of the properties as of 30 Septem-ber 2010 has been carried out internally and has resulted in the property value an increase by SEK 319 million (-7).
As of 30 September 2010 the properties’ book value amounts to SEK 15,147 million. The yield is 6.6 per cent for office properties, excluding property administration and 8.6 per cent for industrial/warehouses.
■4
ChaNGES IN PRoPERTIES’ booK valuE
Changed Item Group total, SEKm
Book value 1 January 2010 14,418
Acquisitions 146
Investments 661
Properties sold -249
Value regulation 319
Foreign currency translations -148
Book value 30 September 2010 15,147
Marie Fredriksson runs Ingelsta Kalkon at Dockan.Photographer Klas Andersson.
David Johnson one of the owners of the dance school Crazy Feet who rents their premises in Lund from Wihlborgs Photographer Klas Andersson.

■ 5
Wihlborgs interim report january-september 2010
■ 5
Net financial itemsThe period’s net financial items amounted to SEK -205m (-246), of which rental income is SEK 1m (4).
Interest costs for the period, SEK -206m (-250), corresponding to a borrowing rate of interest of 3.04 per cent. At the end of the period, the average interest was 3.37 per cent.
Income from property managementThe income from property management, i.e. the result before value chan-ges and tax amounted to SEK 460m (404).
Profit before taxPre-tax profit amounted to SEK 718m (465).
Profit for the periodProfit after taxes amounted to SEK 574m (360).
Property acquisitions A total of eight properties were acquired during the period for a total price of SEK 146m. The acquisition of the property Landsdomaren 6, the Regional Council Building in Lund, SEK 160m, will be shown on the date of possession 18 October 2010, like the acquisition of the property Gjute-riet 18 in Malmö, SEK 43m, 1 November 2010. Terminalen 1/Knutpunk-ten in Helsingborg was acquired for SEK 490m and the date of possession was 15 October 2010.
Investments and projects in progress Investments in the stock of properties have amounted SEK 661m.
Investments agreed on in projects in progress amounts to SEK 671m of which SEK 422m was invested by the end of the period.
The major project is Slagthuset in Malmö, the rebuilding and addition for Comfort Hotel.
PRoJECTS IN PRoGRESS >50 SEKm, 2010-09-30
Property Category Area CompletedLettable
area, sq.m.Occupancy
rate, %Estimated
investmentDeveloped
100930Slagthuset 1 Hotel Malmö Q1, 2011 7,500 100 190 129
Total 7,500 100 190 129
SEKm 2010 Jan-Sep9 months
2009 Jan-Sep9 months
Income from property management for the period 460 404
Profit for the period before taxes 718 465
Profit for the period 574 360
PER ShaRE, SEK
Income from property management for the period 12.05 11.16
Profit for the period before taxes 18.80 12.84
Profit for the period 15.03 9.94
2010-09-30 2009-12-31
Shareholders’ equity I (26.3% deferred tax) 126.47 117.90
Shareholders’ equity II (0% deferred tax) 157.67 146.30
Magnus Lindqvist opened Tropikariet in Helsingborg 1994. Photographer Klas Andersson.
Sabina Hansson is manager of Xtravaganza, one ofWihlborgs’ tenants on Mäster Nilsgatan in Malmö.Photographer Klas Andersson.

■6
Wihlborgs interim report january-september 2010
Financial positionsShareholders’ equityAs of 30 September shareholders’ equity amounted to SEK 4,860m (4,417) and the equity/assets ratio was 30.4 per cent (29.6). The long-term objec-tive is that the equity/assets ratio will not be less than 25 and not more than 35 per cent.
Interest-bearing liabilities The group’s interest-bearing liabilities as of 30 September amounted to SEK 9,262m (8,844) with an average interest rate including costs for credit agreements of 3.38 per cent (3.02).
With consideration to the company’s net debt of SEK 8.7 billion, defined as the total amount of borrowings less cash and cash equivalents, the net debt ratio is 57.5 per cent.
The loans’ average fixed interest period including effects of deri- vatives on 30 September 2010 amounted to 30 months (30). The average period during which the capital is tied up, including credit promises, amounted to 4.5 years (5.1).
Wihlborgs holds eight interest derivative instruments and four closeable swaps of 2.5 billion. The terms vary between 1.0 years to 7.7 years.
A threshold swap of SEK 1 billion with a term of 6.2 years and three yield curve swaps with a term of 2.8 years.
The undervalue of the derivative portfolio has during the period in-creased from SEK 137m to 198, a negative value change of SEK 61m.
STRuCTuRE oF INTEREST aNd loaN maTuRITIES aS oF 30 SEPTEmbER 2010
SEKm Interest maturity Loan maturity
Matures, year Loan amount, SEKm Av. interest rate, % Credit agreements, SEKm Utilised, SEKm
2010 4,636 2.19
2011 1,841 3.80 2,016 2,016
2012 47 5.47 1,628 1,628
2013 2,250 2,100
2014 2,800 2,718
>2014 2,738 5.04 800 800
Total 9,262 3.37 9,494 9,262
liquid assetsThe Groups’ liquid assets amounted to SEK 634m (358) including unutilised overdraft facilities.
EmployeesAt the end of the period the number of employees was 84 (80), of whom 25 was caretakers. The distribution of employees by region was as follows: Malmö 58, Helsingborg 17, Lund 5 and Copenhagen 4. The average age was 48 years, and the proportion of women was 36 per cent.
Parent companyThe parent company has no properties, it handles questions about the stock market and group functions for administration, management and borrowing transactions.The parent company has made investments during the period amounting to SEK 40m (342), primarily in shares in subsidiaries. For income and ba-lance statements for the parent company see page 14 in this report.

■ 7
Wihlborgs interim report january-september 2010
Significant risks and and uncertainty factors Wihlborgs’ activities, financial position and profit are affected by a number of risk factors. The risks that represent a decisive impact on the company’s profit growth are variations in lease income, changes in rates of interest, growth in costs, property valuation and taxes. To this is added the liquidity and borrowing risk. Refer to pages 52-53 and 67-68 of Wihlborgs 2009 annual report for a detailed desciption of the company’s risks.
accounting principlesWihlborgs applies the IFRS (International Financial Reporting Stan-dards) from IASB (International Accounting Standards Board) and the interpretation of these (IFRIC), adopted by the European Union.
The interim report was prepared in accordance with IAS 34 Interim Financial Reporting. The accounting principles and methods of calcula-tions are the same as were applied in the last annual report unless stated otherwise below.
A reworked IFRS3 enterprise acquisition applies from the 2010 accoun-ting year. The definition of what is an enterprise acquisition has been changed. For Wihlborgs, this does not imply any change compared with previously, in view of that in principle all of the Company’s property acqui-sitions via companies will be deemed, even in the future, as being able to be treated as asset acquisitions.
Other new or revised IFRS and interpretation statements were not con-sidered to have had any great effect on Wihlborgs’ financial reports. The latest annual report, page 65-67, gives further descriptions of new and amended accounting principles.
Property portfolio as of 30 September 2010The summaries are based on Wihlborgs’ property portfolio as of 30 Sep-tember 2010. Rental income pertains to contracted rental income on an annual basis as of 1 October 2010.
The net operating income is based on the properties’ earnings capacity on an annual basis as of October 2010, based on contracted rental income, actual costs, property taxes and leaseholders’ rent on a rolling 12-months basis. Net operating income also includes administrative costs related to property management in the amount of SEK 53 million.
Wihlborgs property portfolio consists of commercial properties’ in the Öresund region, located in Malmö, Helsingborg, Lund and Copenhagen. As of 30 September 2010 the property portfolio consisted of 244 proper-ties with a letteble area of 1,299,000 m2.
Fifteen of the properties have a site leasehold right. The properties’ market value was SEK 15,147m, equivalent to the properties’ real value. The total rental value was SEK 1,412m and the contracted rental income on an annual basis was SEK 1,304m. The financial occupancy rate inclu-ding projects was 92 per cent.
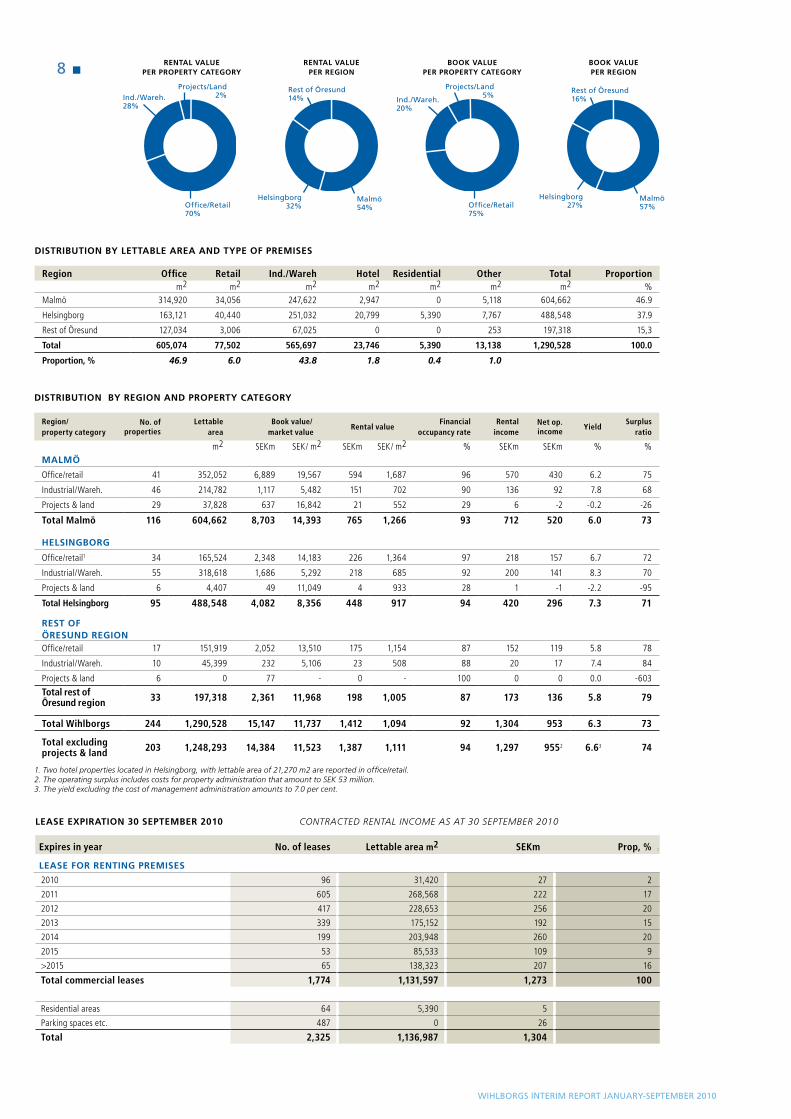
The properties in Malmö and Helsingborg represented 86 per cent of the total rental value and 84 per cent of the properties’ book value. The rental value for office and retail properties and industrial/warehouse properties totalled 70 and 28 per cent of the total rental value respectively. The operating surplus from properties held for investment is SEK 955m. This item also includes the costs of property administration amounting to SEK 53m.
This cost therefore excludes the current operating surplus amounting to SEK 1,008m which, with a value of SEK 14,384m means a current yield of 7.0 per cent. When broken down according to property category this is 6.6 per cent for offices/retail and 8.6 per cent for industrial/warehouses.
■8
Wihlborgs interim report january-september 2010
dISTRIbuTIoN by REGIoN aNd PRoPERTy CaTEGoRy
Region/ property category
No. ofproperties
Lettable area
Book value/ market value
Rental valueFinancial
occupancy rateRental
incomeNet op.
incomeYield
Surplus ratio
m2 SEKm SEK/ m2 SEKm SEK/ m2 % SEKm SEKm % %malmÖ
Office/retail 41 352,052 6,889 19,567 594 1,687 96 570 430 6.2 75
Industrial/Wareh. 46 214,782 1,117 5,482 151 702 90 136 92 7.8 68
Projects & land 29 37,828 637 16,842 21 552 29 6 -2 -0.2 -26
Total Malmö 116 604,662 8,703 14,393 765 1,266 93 712 520 6.0 73
hElSINGboRG
Office/retail1 34 165,524 2,348 14,183 226 1,364 97 218 157 6.7 72
Industrial/Wareh. 55 318,618 1,686 5,292 218 685 92 200 141 8.3 70
Projects & land 6 4,407 49 11,049 4 933 28 1 -1 -2.2 -95
Total Helsingborg 95 488,548 4,082 8,356 448 917 94 420 296 7.3 71
REST oF ÖRESuNd REGIoNOffice/retail 17 151,919 2,052 13,510 175 1,154 87 152 119 5.8 78
Industrial/Wareh. 10 45,399 232 5,106 23 508 88 20 17 7.4 84
Projects & land 6 0 77 - 0 - 100 0 0 0.0 -603
Total rest ofÖresund region 33 197,318 2,361 11,968 198 1,005 87 173 136 5.8 79
Total Wihlborgs 244 1,290,528 15,147 11,737 1,412 1,094 92 1,304 953 6.3 73
Total excluding projects & land 203 1,248,293 14,384 11,523 1,387 1,111 94 1,297 9552 6.63 74
1. Two hotel properties located in Helsingborg, with lettable area of 21,270 m2 are reported in office/retail. 2. The operating surplus includes costs for property administration that amount to SEK 53 million.3. The yield excluding the cost of management administration amounts to 7.0 per cent.
lEaSE ExPIRaTIoN 30 SEPTEmbER 2010 CONTRACTED RENTAL INCOME AS AT 30 SEPTEMBER 2010
Expires in year No. of leases Lettable area m2 SEKm Prop, % .
lEaSE FoR RENTING PREmISES
2010 96 31,420 27 2
2011 605 268,568 222 17
2012 417 228,653 256 20
2013 339 175,152 192 15
2014 199 203,948 260 20
2015 53 85,533 109 9
>2015 65 138,323 207 16
Total commercial leases 1,774 1,131,597 1,273 100
Residential areas 64 5,390 5
Parking spaces etc. 487 0 26
Total 2,325 1,136,987 1,304
dISTRIbuTIoN by lETTablE aREa aNd TyPE oF PREmISES
Region Office Retail Ind./Wareh Hotel Residential Other Total Proportionm2 m2 m2 m2 m2 m2 m2 %
Malmö 314,920 34,056 247,622 2,947 0 5,118 604,662 46.9
Helsingborg 163,121 40,440 251,032 20,799 5,390 7,767 488,548 37.9
Rest of Öresund 127,034 3,006 67,025 0 0 253 197,318 15,3
Total 605,074 77,502 565,697 23,746 5,390 13,138 1,290,528 100.0
Proportion, % 46.9 6.0 43.8 1.8 0.4 1.0
RENTal valuE PER PRoPERTy CaTEGoRy
RENTal valuE PER REGIoN
booK valuE PER PRoPERTy CaTEGoRy
booK valuE PER REGIoN
Office/Retail70%
Ind./Wareh.28%
projects/land2%
Office/Retail75%
Ind./Wareh.20%
projects/land5%
malmö54%
rest of Öresund14%
helsingborg32%
malmö57%
rest of Öresund16%
helsingborg27%

■ 9
Wihlborgs interim report january-september 2010
largest shareholders in Wihlborgs as of 30 September 2010The three largest shareholder in Wihlborgs are Brinova Fastigheter AB, Tibia Konsult AB with Sten K Johnson, and the American Funds BlackRock Inc.
As of 30 September 2010, the ten largest shareholders owned 34 per cent and the number of shareholders totalled 26,341, a decrease by 373 shareholders since the year end. The percentage of shares abroad has increased by 7.8 percentage units to 38.9 per cent.
largest shareholders in Wihlborgs30 September 2010
No. of shares thousands
Percentage of shares and capital, %
Brinova Fastigheter AB 3,867 10.1Sten K Johnson via company and family 2,000 5.2BlackRock Inc 1,954 5.1Handelsbanken Funds 1,306 3.4Länsförsäkringar Funds 960 2.5Robur Funds 731 1.9Qviberg Family 696 1.8Skandia Funds 592 1.5SEB Funds 517 1.4Andra AP-fonden 298 0.8Other shareholders reg. in Sweden 12,521 32.5Shareholders reg. abroad 12,986 33.8Total registrered shares 38,428 100,0
Election committee prior to the 2011 annual general meeting It was decided at the AGM of 21 April 2010 that Wihlborgs’ election committee, whose tasks include submitting proposals for board mem-bers, shall comprise representatives from the three largest shareholders as well as one representative of the small shareholders.
The following election committee based on ownership on 30 Sep-tember comprises: Anders Silverbåge (Brinova Fastigheter AB), Sten K Johnson (Tibia Konsult AB) and Karolina Qvarnström (Länsförsäk-ringar Fondförvaltning AB).
The Election Committee will be completed with a representative from the small shareholders.
The annual general meeting will be held in Malmö on Thursday, 28 April 2011. Shareholders who wish to contact the election committee should do this by email to [email protected] or by post to Wihlborgs Fastigheter AB, Valberedningen, Box 97, 201 20 Malmö.
Prospects for 2010The pre-tax profit from property management, i.e. the result before value changes and tax, for the whole of 2010 is expected to exceed SEK 600 million.
■ 9 ■ 9
Vätet 1 in Lund, known as theBeta-house at Ideon. Photo Wihlborgs.

■10
Wihlborgs interim report january-september 2010
Forthcoming reports
■ Year end report 7 February 2011
■ Interim report Jan-Mar 28 April 2011
■ Annual General Meeting 28 April 2011
Malmö 28 October 2010Wihlborgs Fastigheter AB (publ)Anders Jarl, CEO
For further information, please contact:Anders Jarl, CEO.Telephone +46 (0)40-690 57 10, +46 (0)733-71 17 10Christer Johansson, CFO. Telephone +46 (0)40-690 57 06, +46 (0)733-71 17 06
auditors’ review reportIntroductionWe have conducted a review of the interim report for Wihlborgs Fast-igheter AB (publ) as of September 30, 2010 and for the nine-month period then ended. The Board of Directors and the CEO are respon-sible for the preparation and presentation of this interim report in ac-cordance with IAS 34 and the Annual Accounts Act. Our responsibility is to express a conclusion on this interim report based on our review.
Focus and scope of the review We conducted our review in accordance with the Standard on Review Engagements SÖG 2410, Review of Interim Financial Information per-formed by the Independent Auditor of the Entity issued by FAR SRS. A review consists of making inquiries, primarily of persons responsible for financial and accounting matters, and applying analytical and other review procedures. A review has a different focus and significant-ly less scope than an audit in accordance with Auditing Standards in Sweden, RS, and other generally accepted auditing practices. The pro-cedures performed in a review do not enable us to obtain a level of as-surance that would make us aware of all significant matters that would have been identified if an audit had been conducted. Accordingly, the conclusion expressed based on a review does not give the same level of assurance as a conclusion expressed based on an audit.
ConclusionBased on our review, nothing has come to our attention that causes us to believe that the interim report report has not, in all material respects, been prepared in accordance with IAS 34 and the Annual Accounts Act.
Malmö, 28 October 2010Deloitte AB Torbjörn SvenssonAuthorized Public Accountant
■10
The entrance to Knutpunkten in Helsingborg.Photographer Martin Palvén.

■ 11
Wihlborgs interim report january-september 2010
lIST oF PRoPERTy aCquISITIoNS aNd SalES JaNuaRy–SEPTEmbER 2010
PROPERTY Municipality Area Category Area, Price, Net op. m2 SEKm income 2010, SEKm1
PRoPERTy aCquISITIoN quaRTER 1
Afrika 18 Helsingborg Helsingborg Industrial/wareh. 1,439
Ametisten 5 Helsingborg Helsingborg Industrial/wareh. 7,669
Påfågeln 9 Helsingborg Helsingborg Projects & land 795
Ruuth 23 Helsingborg Helsingborg Projects & land 3,645
Spanien 5 Helsingborg Helsingborg Industrial/wareh. 868
Spanien 11 Helsingborg Helsingborg Industrial/wareh. 7,229
Tyfonen 1 Helsingborg Helsingborg Industrial/wareh. 4,500
Total acquisition Jan-Mar 2010 26,145 128 4.6PRoPERTy aCquISITIoNS quaRTER 3
Bunkalund Östra 8 Helsingborg Helsingborg Industrial/wareh. 6,300
Total acquisition Jul-Sep 2010 6,300 18 -
aCquISITIoNS JaN-SEP 2010 32,445 146 4.6
PRoPERTy SalES quaRTER 1
Hälsingland 1 Malmö Malmö Industrial/wareh. 1,213
Total sales Jan-Mar 2010 1,213 9 0.0PRoPERTy SalES quaRTER 2
Värjan 9 Helsingborg Helsingborg Industrial/wareh. 2,007
Total sales Apr-Jun 2010 2,007 9 0.0PRoPERTy SalES quaRTER 3
Postterminalen 3 Lund Lund Projects & land -
Sqvalperup 12 Malmö Malmö Offices 6,000
Korreboda 5:1 Simrishamn Rest of Öresund Industrial/wareh. 8,870
Total sales Jul-Sep 14,870 231 4.0
PRoPERTy SalES JaN-SEP 2010 18,090 249 4.0
1. Operating income from properties acquired and sold are included in the net profit for the period.
Wihlborgs acquired Knutpunkten (Terminalen 1) in Helsingborg during September 2010. Photografer Martin Palvén.
■12
Wihlborgs interim report january-september 2010
■12
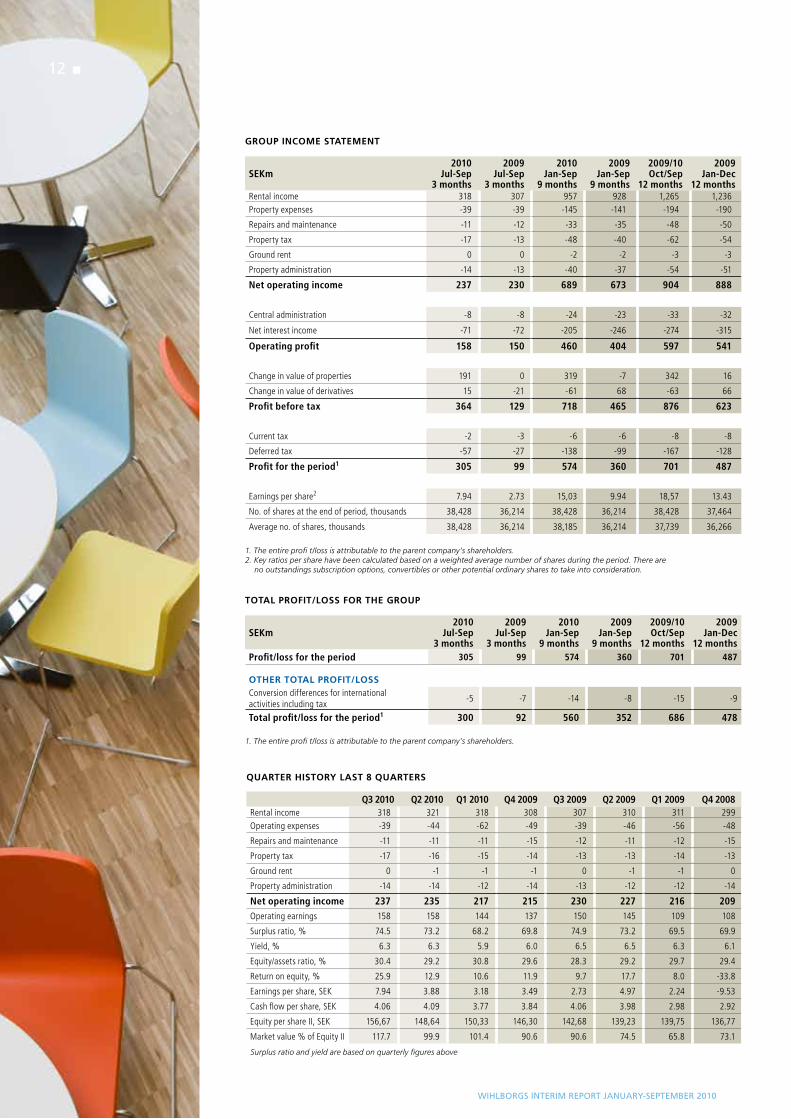
GRouP INComE STaTEmENT
SEKm2010
Jul-Sep3 months
2009Jul-Sep
3 months
2010 Jan-Sep
9 months
2009 Jan-Sep
9 months
2009/10 Oct/Sep
12 months
2009 Jan-Dec
12 monthsRental income 318 307 957 928 1,265 1,236Property expenses -39 -39 -145 -141 -194 -190
Repairs and maintenance -11 -12 -33 -35 -48 -50
Property tax -17 -13 -48 -40 -62 -54
Ground rent 0 0 -2 -2 -3 -3
Property administration -14 -13 -40 -37 -54 -51
Net operating income 237 230 689 673 904 888
Central administration -8 -8 -24 -23 -33 -32
Net interest income -71 -72 -205 -246 -274 -315
Operating profit 158 150 460 404 597 541
Change in value of properties 191 0 319 -7 342 16
Change in value of derivatives 15 -21 -61 68 -63 66
Profit before tax 364 129 718 465 876 623
Current tax -2 -3 -6 -6 -8 -8
Deferred tax -57 -27 -138 -99 -167 -128
Profit for the period1 305 99 574 360 701 487
Earnings per share2 7.94 2.73 15,03 9.94 18,57 13.43
No. of shares at the end of period, thousands 38,428 36,214 38,428 36,214 38,428 37,464
Average no. of shares, thousands 38,428 36,214 38,185 36,214 37,739 36,266
1. The entire profi t/loss is attributable to the parent company’s shareholders.2. Key ratios per share have been calculated based on a weighted average number of shares during the period. There are
no outstandings subscription options, convertibles or other potential ordinary shares to take into consideration.
quaRTER hISToRy laST 8 quaRTERS
Q3 2010 Q2 2010 Q1 2010 Q4 2009 Q3 2009 Q2 2009 Q1 2009 Q4 2008Rental income 318 321 318 308 307 310 311 299Operating expenses -39 -44 -62 -49 -39 -46 -56 -48
Repairs and maintenance -11 -11 -11 -15 -12 -11 -12 -15
Property tax -17 -16 -15 -14 -13 -13 -14 -13
Ground rent 0 -1 -1 -1 0 -1 -1 0
Property administration -14 -14 -12 -14 -13 -12 -12 -14
Net operating income 237 235 217 215 230 227 216 209Operating earnings 158 158 144 137 150 145 109 108
Surplus ratio, % 74.5 73.2 68.2 69.8 74.9 73.2 69.5 69.9
Yield, % 6.3 6.3 5.9 6.0 6.5 6.5 6.3 6.1
Equity/assets ratio, % 30.4 29.2 30.8 29.6 28.3 29.2 29.7 29.4
Return on equity, % 25.9 12.9 10.6 11.9 9.7 17.7 8.0 -33.8
Earnings per share, SEK 7.94 3.88 3.18 3.49 2.73 4.97 2.24 -9.53
Cash flow per share, SEK 4.06 4.09 3.77 3.84 4.06 3.98 2.98 2.92
Equity per share II, SEK 156,67 148,64 150,33 146,30 142,68 139,23 139,75 136,77
Market value % of Equity II 117.7 99.9 101.4 90.6 90.6 74.5 65.8 73.1
ToTal PRoFIT/loSS FoR ThE GRouP
SEKm2010
Jul-Sep3 months
2009Jul-Sep
3 months
2010Jan-Sep
9 months
2009 Jan-Sep
9 months
2009/10 Oct/Sep
12 months
2009 Jan-Dec
12 monthsProfit/loss for the period 305 99 574 360 701 487
oThER ToTal PRoFIT/loSSConversion differences for international activities including tax
-5 -7 -14 -8 -15 -9
Total profit/loss for the period1 300 92 560 352 686 478
1. The entire profi t/loss is attributable to the parent company’s shareholders.
■12
Surplus ratio and yield are based on quarterly figures above

■ 13
Wihlborgs interim report january-september 2010
GRouP balaNCE ShEET
SEKm 2010-09-30 2009-09-30 2009-12-31aSSETS
Properties 15,147 14,102 14,418
Other fixed assets 167 182 164
Current receivables 107 78 69
Liquid assets 559 244 281
Total assets 15,980 14,606 14,932EquITy aNd lIabIlITIES
Shareholders’ equity 4,860 4,131 4,417
Deferred tax liability 1,199 1,036 1,064
Other long-term liabilities 7,697 8,794 8,363
Current liabilities 2,224 645 1,088
Total shareholders’ equity & liabilities 15,980 14,606 14,932
GRouP STaTEmENT oF CaSh FloW
SEKm Jan-Sep 2010 Jan-Sep 2009 Jan-Dec 2009
Current activities
Net operating income 689 673 888
Central administration -24 -23 -32
Add-back depreciation 1 1 2
Net financial items paid -214 -228 -303
Income tax paid 0 -3 -3
Change in other working capital -15 -27 11
Cashflow from operations 437 393 563
Investments activities
Acquisitions of Group companies -126 -230 -230
Sales of Group companies 237 172 283
Investments in and acquisitions of properties -679 -522 -923
Sales of properties 10 - 2
Change in other fixed assets -4 -3 11
Cashflow from investing activities -562 -583 -857
Financial activities
Dividends paid -259 -235 -235
Acquisitions of minority interest - -120 -120
Disposal of own shares 142 - 160
Derivatives turnover - - 12
Changes in loan and long-term liabilities 520 649 618
Cashflow from financing activities 403 294 435
Cashflow during the period 278 104 141
Liquid assets at beginning of period 281 140 140
Liquid assets at end of period 559 244 281
ChaNGES IN GRouP ShaREholdERS’ EquITy
SEKm Jan-Sep 2010 Jan-Sep 2009 Jan-Dec 2009Total equity at beginnig of the period 4,417 4,134 4,134Shareholders’ equity attributable to parent company’s shareholdersAmount at beginning of period 4,417 4,014 4,014
Dividends paid -259 -235 -235
Sale of own shares 142 - 160
Total profit/lloss for the period 560 352 478
Amount at end of period 4,860 4,131 4,417Shareholders’ equity attributable to minority sharesAmount at beginning of period 0 120 120
Acquisition of minority shares 0 -120 -120
Amount at end of period 0 0 0
Total shareholders’ equity end of period 4,860 4,131 4,417
■ 13 ■ 13 ■ 13
SVTs’ premises in Western Harbour, Malmö. Photografer Klas Andersson.

■14
Wihlborgs interim report january-september 2010
INComE ShEETS PaRENT ComPaNy
SEKm Jan-Sep 2010 Jan-Sep 2009 Jan-Dec 2009 Income 58 58 77
Costs -73 -66 -91
Operating profit -15 -8 -14Financial income 374 353 462
Financial costs -259 -242 -309
Income pre-tax 100 103 139Tax 20 3 9
Profit for the period 120 106 148
Other total profit 0 0 0
Total profit for the period 120 106 148
balaNCE ShEETS PaRENT ComPaNy
SEKm 2010-09-30 2009-09-30 2009-12-31 Participations in group companies 3,461 3,357 3,433
Receivables from group companies 8,475 7,200 7,299
Other assets 182 151 262
Cash and bank balances 528 241 246
Total assets 12,646 10,949 11,240
Equity 1,970 1,693 1,967
Liabilities to credit institutions 8,118 7,464 6,917
Liabilities to group companies 2,326 1,608 1,610
Other liabilities 232 184 746
Total equity and liabilities 12,646 10,949 11,240
SEGmENT REPoRTING JaN-dEC
Malmö Helsingborg Rest of Öresund TotalSEKm 2010 2009 2010 2009 2010 2009 2010 2009
Rental income 518 483 305 291 134 154 957 928
Property expenses -145 -139 -89 -82 -34 -34 -268 -255
Net operating income
373 344 216 209 100 120 689 673
In the Group’s internal reporting activities are divided into the above segments, these are the same as shownin the latest annual report. The total operating surplus shown above agrees with the net operating surplus in the income statement. The difference between net operating surplus of SEK 689m (673) and the profit before tax SEK 718m (465) comprises central administration SEK -24m (-23), net financial income SEK -205m (-246) and changes in value of properties and derivatives SEK 258m (61).
Forskaren 1 (Medeon) in Malmö. Photo Wihlborgs.

■ 15
Wihlborgs interim report january-september 2010
KEy FIGuRES
Jan-Sep 2010 Jan-Sep 2009 Oct/Sep 2009/10 Jan-Dec 2009
FINaNCIal
Return on equity, % 16.5 11.8 15.6 11.8
Return on total capital, % 8.5 6.0 7.9 6.1
Equity/assets ratio, % 30.4 28.3 30.4 29.6
Interest coverage ratio, times 3.2 2.6 3.2 2.7
Leverage properties, % 61.1 62.7 61.1 61.3
Dept/equity ratio, times 1.9 2.1 1.9 2.0
ShaRE-RElaTEd
Earnings per share, SEK 15.03 9.94 18.57 13.43
Earnings per share before tax, SEK 18.80 12.84 23.21 17.18
Operating earnings per share, SEK 12.05 11.16 15.82 14.92Cashflow from operations before changein working capital per share, SEK
11.92 11.02 15.79 14.86
Equity per share I, SEK 126.47 114.07 126.47 117.90
Equity per share II, SEK 157.67 142.68 157.67 146.30
Market value per share, SEK 185.50 129.25 185.50 132.50
Proposed dividend per share, SEK - - - 6.75
Yield from shares, % 1) - - - 5.1
The share´s total yield, % 1) - - - 39.0
P/E-tal I, times 9.3 9.8 10.0 9.9
P/E-tal II, times 15.7 11.8 15.9 12.1
No. of shares at period end, thousands 38,428 36,214 38,428 37,464
Average no. of shares, thousands 38,185 36,214 37,739 36,266
PRoPERTy RElaTEd
Number of properties 244 243 244 241
Book value of properties, SEKm 15,147 14,102 15,147 14,418
Yield, % – all properties 6.3 6.4 6.3 6.3
Yield, % – excluding project properties 6.6 7.0 6.6 6.9
Lettable area, sq.m. 1,290,528 1,268,808 1,290,528 1,269,193
Rental income, SEK per sq.m. 1,011 977 1,011 985
Net operating income, SEK per sq.m. 738 709 738 719
Financial occupancy rate, % - all properties 92 93 92 91
Financial occupancy rate, % - excl. project prop. 94 94 94 94
Surplus ratio, % 73 73 73 73
EmPloyEES
No. of employees at end of period 84 81 84 80
Average no. of employees 82 81 82 81
1) Can only be calculated in a full year.
FINaNCIalReturn on equityProfit as a percentage of average shareholders’ equity excluding minority shares.
Return on total capitalProfit before tax plus interest expenses as a percentage of average balance sheet total.
Equity/assets ratioShareholders’ equity as a percentage ofbalance sheet total.
Interest coverage ratioProperty management increased by interest costs divided by interest costs.
leverage propertiesInterest-bearing liabilities as a percenta-ge of book value of the properties.
debt/equity ratioInterest-bearing liabilities divided by shareholders’ equity.
ShaRE-RElaTEdEarnings per shareProfit divided by average number of outstanding shares.
Earnings per share before tax Profit before tax divided by average number of outstanding shares.
operating earnings per shareThis is management result divided by the average number of outstanding shares.
Cash flow from operations beforechange in working capital per share Cash flow from operations less current tax before change in working capital in relation to the average no. of shares.
Equity per share IThe parent company’s shareholders’ share of the equity at the end of year in relation to the number of shares at period end.
Equity per share II Calculated as the equity per share I but with the tax rate for deferred tax of 0 per cent instead of 26.3 per cent.
P/E-ratio I, times The market value per share divided by the profit per share.
P/E-ratio II, times The market value divided by the incomefrom property management loaded with 26.3 per cent tax, per share.
DEFINITIONS
PRoPERTy RElaTEdNo. of propertiesTotal number of properties owned by Wihlborgs at the end of the period.
Carrying amount of propertiesCarrying amount of the Group’s pro-perty portfolio at the end of the period.
lease valueLease income plus estimated market rent on unrented areas.
yieldNet operating income as a percentage of the book value of the properties at period end.
lettable areaTotal area that is available to let.
Rental income per m2 Annualised rental income divided by lettable area.
Net operating income per m2Net operating income divided by lettable area.
Financial occupancy rate Rental income as a percentage of rental value.
Surplus ratioNet operating income as a percentageof rental income.
addresses
malmö - head officeBox 97201 20 MalmöVisitors: Dockplatsen 16Tel: +46 40-690 57 00Fax: +46 40-690 57 01
helsingborg
Garnisonsgatan 25 A254 66 HelsingborgTel: +46 42-490 46 00Fax: +46 42-490 46 01
lundIdeon Science ParkScheelevägen 17223 70 LundTel: +46 46-286 85 00Fax: +46 46-18 40 96
CopenhagenWihlborgs A/SEllekær 6, opgang CDK-2730 HerlevTel: +45-396 161 57Fax: +45-396 161 58
[email protected] reg. office: MalmöCorporate identity no: 556367-0230
A banner with Wihlborgs’ message covers the facade on Flundran 1 in Malmö. Photo Wihlborgs.