wikileaks document release - massachusetts institute … · ... in u.s. energy policy:...
TRANSCRIPT

WikiLeaks Document Releasehttp://wikileaks.org/wiki/CRS-RL32386
February 2, 2009
Congressional Research Service
Report RL32386
Liquefied Natural Gas (LNG) in U.S. Energy Policy:
Infrastructure and Market IssuesPaul W. Parfomak, Resources, Science, and Industry Division
January 31, 2006
Abstract. This report reviews the status of U.S. LNG imports, including projections of future U.S. LNG demandwithin the growing international LNG market. The report summarizes recent policy activities related to LNGamong U.S. federal agencies, as well as private sector plans for LNG infrastructure development. The report alsointroduces key policy considerations in LNG infrastructure and market structure, highlighting current marketinformation and key uncertainties. Finally, the report identifies key questions in LNG import policy development.

http
://w
ikile
aks.
org/
wik
i/C
RS-
RL32
386
Congressional Research Service ˜ The Library of Congress
CRS Report for CongressReceived through the CRS Web
Order Code RL32386
Liquefied Natural Gas (LNG)in U.S. Energy Policy:
Infrastructure and Market Issues
Updated January 31, 2006
Paul W. ParfomakSpecialist in Science and Technology
Resources, Science, and Industry Division

http
://w
ikile
aks.
org/
wik
i/C
RS-
RL32
386
Liquefied Natural Gas (LNG) in U.S. Energy Policy:Infrastructure and Market Issues
Summary
Liquefied natural gas (LNG) imports to the United States are increasing tosupplement domestic gas production. Recent actions by Congress and federalagencies have promoted greater LNG supplies by changing regulations, clarifyingsiting authorities, and streamlining the approval process for LNG import terminals.Were these policies to continue and gas demand to grow, LNG might account for asmuch as 21% of U.S. gas supply by 2025, up from 3% in 2005. Congress isexamining the infrastructure and market implications of greater U.S. LNG demand.
There are concerns about how LNG capacity additions would be integrated intothe nation’s gas infrastructure. Meeting projected U.S. LNG demand would requiresix to ten new import terminals in addition to expanding existing terminals. Twelvenew terminals, most in the Gulf of Mexico, are approved, but public opposition hasblocked many near-to-market terminals which might save billions of dollars in gastransportation costs. New LNG terminals can also require more regional pipelinecapacity to transport their supply, although this capacity may not be available in keymarkets. Securing LNG infrastructure against accidents and terrorist attacks mayalso be a challenge to public agencies. Since import terminals process large volumesof LNG, a breakdown at any facility has the potential to bottleneck supply.
LNG’s effectiveness in moderating U.S. gas prices will be determined by globalLNG supply, the development of a “spot” market, potential market concentration, andevolving trading relationships. There appears to be sufficient interest among LNGexporters to meet global demand projections, although some new export projects maynot be built. An LNG spot market, which may help U.S. companies import LNGcost-effectively, is also growing. Although some analysts believe a cartel mayinfluence the future LNG market, the potential effectiveness of a such a cartel isunclear. Whether exporters cooperate or not, an integrated global LNG market maychange trading and political relationships. Individual country energy polices mayaffect LNG price and supply worldwide. Trade with LNG exporters perceived asunstable or inhospitable to U.S. interests may raise concerns about supply reliability.
Recent measures before Congress seek to encourage both domestic gas supplyand new LNG terminal construction. The Energy Policy Act of 2005 (P.L. 109-58)includes incentives for domestic gas producers and grants the Federal EnergyRegulatory Commission “exclusive” authority to approve onshore LNG terminalsiting applications, among other provisions. Other proposals in the 109th Congress,including H.R. 4318, H.R. 3918, and H.R. 3811 would lift federal restrictions onnatural gas development on the Outer Continental Shelf. As Congress debates U.S.natural gas policy, three questions emerge: (1) Is expanding LNG imports the bestoption for meeting natural gas demand in the United States? (2) What future role, ifany, should the federal government play in facilitating the development of LNGinfrastructure domestically and abroad? (3) How might Congress mitigate the risksof the global LNG trade within the context of national energy policy?
This report will be updated as events warrant.

http
://w
ikile
aks.
org/
wik
i/C
RS-
RL32
386
Contents
Introduction . . . . . . . . . . . . . . . . . . . . . . . . . . . . . . . . . . . . . . . . . . . . . . . . . . . . . . 1
Background . . . . . . . . . . . . . . . . . . . . . . . . . . . . . . . . . . . . . . . . . . . . . . . . . . . . . . 2What Is LNG? . . . . . . . . . . . . . . . . . . . . . . . . . . . . . . . . . . . . . . . . . . . . . . . . 3U.S. LNG Import Experience and Projections . . . . . . . . . . . . . . . . . . . . . . . . 4Global LNG Market Development . . . . . . . . . . . . . . . . . . . . . . . . . . . . . . . . 5LNG Safety and Security . . . . . . . . . . . . . . . . . . . . . . . . . . . . . . . . . . . . . . . . 6LNG Policy Activities of the Federal Government . . . . . . . . . . . . . . . . . . . . 7
FERC Regulations . . . . . . . . . . . . . . . . . . . . . . . . . . . . . . . . . . . . . . . . . 7Offshore Terminal Regulations . . . . . . . . . . . . . . . . . . . . . . . . . . . . . . . 8Congressional Activities . . . . . . . . . . . . . . . . . . . . . . . . . . . . . . . . . . . . 8
Key Issues in U.S. LNG Import Policy . . . . . . . . . . . . . . . . . . . . . . . . . . . . . . . . . 9Physical Infrastructure Requirements . . . . . . . . . . . . . . . . . . . . . . . . . . . . . . 9
Terminal Siting . . . . . . . . . . . . . . . . . . . . . . . . . . . . . . . . . . . . . . . . . . 11Pipeline Infrastructure . . . . . . . . . . . . . . . . . . . . . . . . . . . . . . . . . . . . . 12Interchangeability . . . . . . . . . . . . . . . . . . . . . . . . . . . . . . . . . . . . . . . . . 13Safety and Physical Security . . . . . . . . . . . . . . . . . . . . . . . . . . . . . . . . 14Supply Bottlenecks . . . . . . . . . . . . . . . . . . . . . . . . . . . . . . . . . . . . . . . 15
Global LNG Market Structure . . . . . . . . . . . . . . . . . . . . . . . . . . . . . . . . . . . 16Global LNG Supply . . . . . . . . . . . . . . . . . . . . . . . . . . . . . . . . . . . . . . . 16Spot Market Growth . . . . . . . . . . . . . . . . . . . . . . . . . . . . . . . . . . . . . . 17Market Concentration . . . . . . . . . . . . . . . . . . . . . . . . . . . . . . . . . . . . . 19Global Trade and Politics . . . . . . . . . . . . . . . . . . . . . . . . . . . . . . . . . . . 20
Conclusions . . . . . . . . . . . . . . . . . . . . . . . . . . . . . . . . . . . . . . . . . . . . . . . . . . . . . 22
List of Figures
Figure 1: LNG Supply Chain . . . . . . . . . . . . . . . . . . . . . . . . . . . . . . . . . . . . . . . . . 3Figure 2: U.S. Natural Gas Wellhead Price ($/Mcf) . . . . . . . . . . . . . . . . . . . . . . . 4Figure 3: Projected U.S. Natural Gas Production and Imports (Tcf) . . . . . . . . . . . 5Figure 4: Existing and Proposed LNG Import Terminals in North America . . . . 10Figure 5: Global LNG Import Market Shares Projected for 2015 . . . . . . . . . . . . 20
List of Tables
Table 1: Global Natural Gas Reserves and LNG Production Capacity . . . . . . . . 17

http
://w
ikile
aks.
org/
wik
i/C
RS-
RL32
386
1 President George W. Bush. Press conference. April 29, 2005.2 Samuel Bodman, U.S. Energy Secretary. Remarks to the USEA/Center for LNGConference. National Press Club. Washington, DC. June 16, 2005.
Liquefied Natural Gas (LNG) in U.S. EnergyPolicy: Infrastructure and Market Issues
Introduction
The United States is considering fundamental changes in its natural gas supplypolicy. Faced with rising natural gas demand and perceived limitations in NorthAmerican gas production, many in government and industry are encouraging greaterU.S. imports of liquefied natural gas (LNG). Recent activities by Congress, theFederal Energy Regulatory Commission, the Department of Energy, and other federalagencies to promote greater LNG supplies have included changing regulations,clarifying regulatory authorities, and streamlining the approval process for new LNGimport terminals. While forecasts vary, many analysts expect LNG to account for12% to 21% of total U.S. gas supply by 2025, up from approximately 3% in 2005.If these forecasts are correct, U.S. natural gas consumers will become increasinglydependent upon LNG imports to supplement North American pipeline gas supplies.
Recent measures before Congress seek to encourage both domestic gas supplyand new LNG terminal construction. The Alaska Natural Gas Pipeline Act of 2004(15 U.S.C. § 720, et seq.) provides loan guarantees (Sec. 116) and other incentivesfor an Alaska gas pipeline. The Energy Policy Act of 2005 (P.L. 109-58) includesvarious incentives for domestic natural gas producers (Title III, Subtitle E). The actalso amends Section 3 of the Natural Gas Act of 1938, granting the Federal EnergyRegulatory Commission (FERC) explicit and “exclusive” authority to approveonshore LNG terminal siting applications (Sec. 311c) among other provisions. Otherproposals in the 109th Congress, including H.R. 4318, H.R. 3918, and H.R. 3811would lift federal restrictions on natural gas exploration and production on federalsubmerged lands of the Outer Continental Shelf. S. 1310 would authorize theexpansion of a natural gas transmission pipeline on federal lands in the Northeast.
While an increase in LNG imports is already underway, federal officials andMembers of Congress have been debating the merits and risks of U.S. LNGdependency. In April, 2005, for example, President Bush stated that “One of thegreat sources of energy for the future is liquefied natural gas.... We need moreterminals to receive liquefied natural gas....”1 In June, 2005 Department of EnergySecretary Samuel Bodman remarked that “LNG seems to offer a solution to ... thegrowing demand for natural gas that we will see all around the globe.”2 InNovember, 2005 Federal Reserve Chairman Alan Greenspan testified before

http
://w
ikile
aks.
org/
wik
i/C
RS-
RL32
386
CRS-2
3 Greenspan, A., Chairman, U.S. Federal Reserve Board. “Economic Outlook.” Testimonybefore the Joint Economic Committee, U.S. Congress. Nov. 3, 2005.4 Hon. Peter Domenici. “U.S. Must Build LNG Ports to Avoid Spiraling Natural Gas Prices,Sen. Domenici Says.” Press release. Feb. 15, 2005; Hon. John E. Peterson. Remarks at theHearing of the House Resources Committee, Energy and Mineral Resources Subcommitteeon “ U.S. Energy and Mineral Needs, Security and Policy.” March 16, 2005.5 Hon. Edward Markey. “Democratic Reaction to the 9/11 Commission's Final Report andits Security Recommendations for Preventing Further Attacks.” Press conference. Dec. 5,2005.6 Energy Information Administration (EIA). Annual Energy Outlook 2006. (Early release).Dec. 2005. Table 1. p11.
Congress that “severe reaction of natural gas prices to the production setbacks thathave occurred in the Gulf highlights again the need to ... import large quantities offar cheaper, liquefied natural gas (LNG) from other parts of the world.”3 Some inCongress have questioned the implications of such a policy, however, drawinganalogies to the consequences of U.S. dependency on foreign oil and citing potentialinstability among foreign LNG suppliers.4 Others have expressed concern aboutLNG safety and vulnerability to terrorism.5
Specific questions are emerging about the implications of greater LNG importsto the United States. LNG has substantial physical infrastructure requirements andthere are uncertainties about how this infrastructure would be integrated into NorthAmerica’s existing gas network. The potential effects of larger LNG imports on U.S.natural gas prices will be driven by the global LNG market structure, although thatmarket structure is still evolving. Political relationships among countries in the LNGtrade may also change as LNG becomes increasingly important to their economies.
This report will review the status of U.S. LNG imports, including projectionsof future U.S. LNG demand within the growing international LNG market. Thereport will summarize recent policy activities related to LNG among U.S. federalagencies, as well as private sector plans for LNG infrastructure development. Thereport also will introduce key policy considerations in LNG infrastructure and marketstructure, highlighting current market information and key uncertainties. Finally, thereport will identify key questions in LNG import policy development.
Background
Natural gas is widely used in the United States for heating, electricitygeneration, industrial processes, and other applications. In 2005, U.S. natural gasconsumption was 22 trillion cubic feet (Tcf), accounting for 23% of total U.S. energyconsumption.6 Until recently, nearly all U.S. natural gas was supplied from NorthAmerican wells and transported through the continent’s vast pipeline network toregional markets. In 2003, however, due to constraints in North American naturalgas production, the United States sharply increased imports of natural gas fromoverseas in the form of liquefied natural gas (LNG). While absolute levels remainlimited today, growth in LNG imports to the United States is expected by many
http
://w
ikile
aks.
org/
wik
i/C
RS-
RL32
386
CRS-3
7 Energy Information Administration (EIA). The Global Liquefied Natural Gas Market:Status & Outlook. DOE/EIA-0637. Dec. 2003. p30.8 Clark, Judy. “CERA: Natural Gas Poised to Overtake Oil Use by 2025.” Oil & GasJournal. Mar. 1, 2004. p22.9 Suzuki, T. “The Changing World LNG Market and its Impact on Japan” The Institute ofEnergy Economics, Japan. Summary of the 392nd Regular Research Session. June 21, 2005;“LNG Contracts.” LNG OneWorld website. [http://www.lngoneworld.com] Drewry
(continued...)
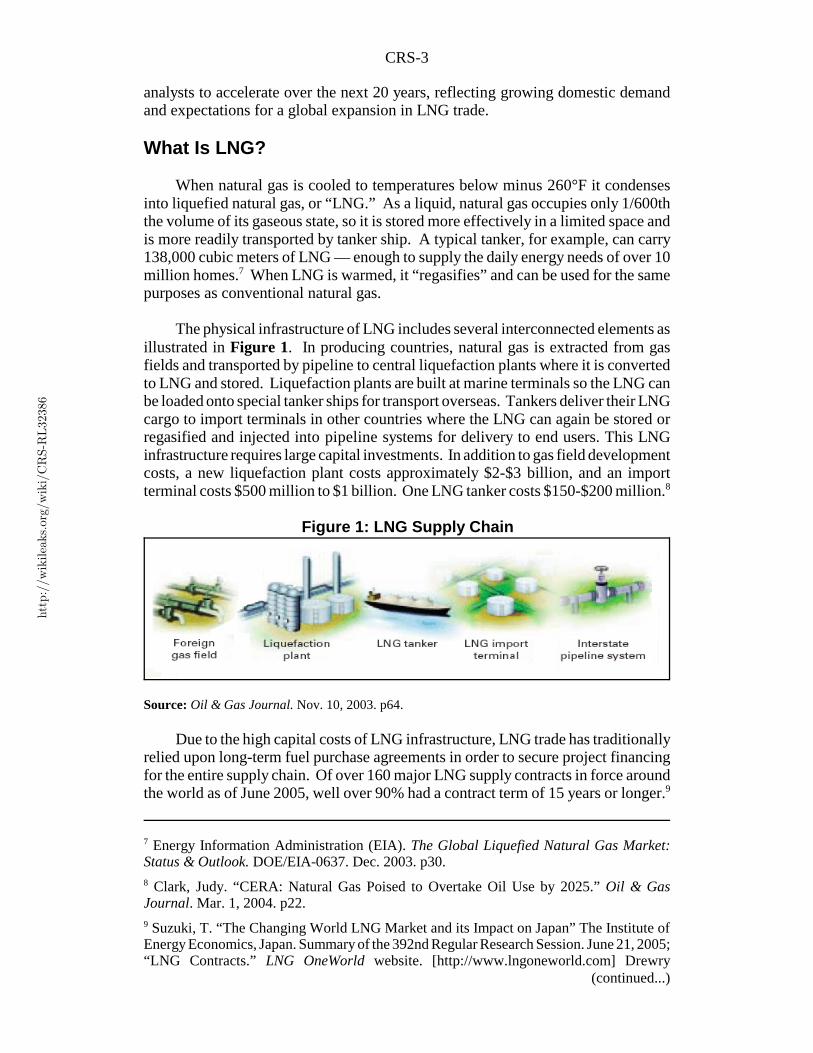
Figure 1: LNG Supply Chain
analysts to accelerate over the next 20 years, reflecting growing domestic demandand expectations for a global expansion in LNG trade.
What Is LNG?
When natural gas is cooled to temperatures below minus 260°F it condensesinto liquefied natural gas, or “LNG.” As a liquid, natural gas occupies only 1/600ththe volume of its gaseous state, so it is stored more effectively in a limited space andis more readily transported by tanker ship. A typical tanker, for example, can carry138,000 cubic meters of LNG — enough to supply the daily energy needs of over 10million homes.7 When LNG is warmed, it “regasifies” and can be used for the samepurposes as conventional natural gas.
The physical infrastructure of LNG includes several interconnected elements asillustrated in Figure 1. In producing countries, natural gas is extracted from gasfields and transported by pipeline to central liquefaction plants where it is convertedto LNG and stored. Liquefaction plants are built at marine terminals so the LNG canbe loaded onto special tanker ships for transport overseas. Tankers deliver their LNGcargo to import terminals in other countries where the LNG can again be stored orregasified and injected into pipeline systems for delivery to end users. This LNGinfrastructure requires large capital investments. In addition to gas field developmentcosts, a new liquefaction plant costs approximately $2-$3 billion, and an importterminal costs $500 million to $1 billion. One LNG tanker costs $150-$200 million.8
Source: Oil & Gas Journal. Nov. 10, 2003. p64.
Due to the high capital costs of LNG infrastructure, LNG trade has traditionallyrelied upon long-term fuel purchase agreements in order to secure project financingfor the entire supply chain. Of over 160 major LNG supply contracts in force aroundthe world as of June 2005, well over 90% had a contract term of 15 years or longer.9

http
://w
ikile
aks.
org/
wik
i/C
RS-
RL32
386
CRS-4
9 (...continued)Shipping Consultants. London, England. Mar. 9, 2004.10 An LNG terminal was also built at Kenai, Alaska in 1969 for exports to Japan. 11 EIA. DOE/EIA-0383(2005). Feb. 2005. Table A13. p159. Tcf = trillion cubic feet.12 Mcf = thousand cubic feet
While these contracts have increasingly incorporated some flexibility byaccommodating extra LNG deliveries, for example, or allowing shipments to bediverted, they have only allowed for a limited supply-demand response compared toother global commodities markets.
U.S. LNG Import Experience and Projections
The United States has used LNG commercially since the1940s. Initially, LNGfacilities stored domestically produced natural gas to supplement pipeline suppliesduring times of high gas demand. In the 1970’s LNG imports began to supplementdomestic gas production. Between 1971 and 1981, developers built four U.S. importterminals: in Massachusetts, Maryland, Georgia, and Louisiana.10 Due primarily toa drop in domestic gas prices, however, two of these terminals quickly closed.Imports to the other two terminals remained small for the next 30 years. In 2002,U.S. LNG imports were only 0.17 Tcf, less than 1% of U.S. natural gas supply.11
Source: Energy Information Administration. Natural Gas Weekly Update. Jan. 19, 2006.
United States demand for LNG has been increasing dramatically since 2003.This growth in LNG demand has been occurring in part because North Americannatural gas production appears to have plateaued, so it has not been able to keep pacewith growth in demand. As a result, U.S. natural gas prices have become higher andmore volatile. As Figure 2 shows, gas prices at the wellhead have risen from around$2.00/Mcf through most of the 1990s to an average above $6.00/Mcf and a peakabove $10.00/Mcf in 2005.12 At the same time, international prices for LNG havefallen because of increased supplies and lower production and transportation costs,
$0.00
$2.00
$4.00
$6.00
$8.00
$10.00
$12.00
1992 1993 1994 1995 1996 1997 1998 1999 2000 2001 2002 2003 2004 2005 2006
Figure 2: U.S. Natural Gas Wellhead Price ($/Mcf)

http
://w
ikile
aks.
org/
wik
i/C
RS-
RL32
386
CRS-5
13 Sen. Colleen Taylor. “LNG Poised to Consolidate its Place in Global Trade.” Oil & GasJournal. Jun. 23, 2003. p73.14 Hughes, Peter. “Outlook for Global Gas Natural Markets.” BP, Gas Power & RenewablesDivision. Presentation to the World Bank Energy Week 2004 Conference. Mar. 8, 2004.15 For a comparison of major forecasts see EIA. Annual Energy Outlook 2005.DOE/EIA-0383(2005). Feb. 2005. Table 36. p118.16 Energy Information Administration (EIA). Annual Energy Outlook 2006. (Early release).Dec. 2005. Table 13.17 Energy Information Administration (EIA). International Energy Outlook 2005.DOE/EIA-0484(2005). Jul. 2005. p37.
making LNG more competitive with domestic natural gas.13 While cost estimationis speculative, some industry analysts believe that LNG can be economicallydelivered to U.S. pipelines for approximately $2.50 to $3.50/Mcf.14
Forecasts by the Energy Information Administration (EIA), National PetroleumCouncil, and other groups project expansion in U.S. LNG imports over the next 20years. Specific LNG forecasts vary based on methodology and market assumptions,but most expect LNG to account for 12% to 21% of U.S. natural gas supplies by2025.15 EIA’s reference forecast projects U.S. LNG imports to reach 4.13 Tcf in2025, which equates to approximately 16% of total U.S. gas supply for that year, upsubstantially from the 2005 market share of about 3%.16 Figure 3 details projectedU.S. LNG imports relative to other natural gas supplies in EIA’s forecast.
Source: Energy Information Administration. Annual Energy Outlook 2006. Dec. 2005. Table A13.
Global LNG Market Development
Projections of accelerated growth in U.S. LNG demand reflect a generalexpansion in the global natural gas market. According to the EIA’s most recentinternational forecast “natural gas is expected to be the fastest growing componentof world primary energy consumption.”17 EIA projects global natural gas demand torise by an average 2.3 percent annually for the next 20 years, with “the largestincreases ... projected for the transitional economies of Eastern Europe and the
0
5
10
15
20
25
30
2005 2010 2015 2020 2025
U.S. Gas Production
Pipeline Imports
LNG Imports
Figure 3: Projected U.S. Natural Gas Production and Imports (Tcf)

http
://w
ikile
aks.
org/
wik
i/C
RS-
RL32
386
CRS-6
18 DOE/EIA-0484(2005). Jul. 2005. p37.19 See, for example: Cambridge Energy Research Associates (CERA). “LNG DvelopmentQuestion Becomes ‘How’ Rather than ‘Whether.’” Press release. Nov. 17, 2005; Cook, L.,Royal Dutch Shell. “The Role of LNG in a Global Gas Market.” Presentation to the Oil &Money Conference. London. Sept. 21, 2005; Nauman, S.A. ExxonMobil. “The Outlook ForEnergy: A 2030 View.” Irving, TX. Slide presentation. Jan. 25, 2005.20 DOE/EIA-0484(2005). Jul. 2005. p37.21 Bureau of Mines (BOM). Report on the Investigation of the Fire at the Liquefaction,Storage, and Regasification Plant of the East Ohio Gas Co., Cleveland, Ohio, October 20,1944. February, 1946.22 CH-IV International. Safety History of International LNG Operations, Revision 2. TD-02109. Millersville, MD. November, 2002. p6-12; Hazmat Transportation News.“Commission Weighs Safety, Security Issues In Rulings on LNG Terminals in UrbanAreas.” Vol. 02, No. 336. Sept.16, 2005.23 Center for LNG. “LNG Security and Safety: Ships.” Fact sheet. Jan. 23, 2006.[http://www.lngfacts.org/issues/lng_updates/CLNG_FLYER_SHIPS.pdf]24 Junnola, Jill et al. “Fatal Explosion Rocks Algeria’s Skikda LNG Complex.” Oil Daily.Jan. 21, 2004. p6.
former Soviet Union ... and for emerging Asia,” much of it to fuel electricitygeneration.18 A significant part of this global gas demand growth is expected to bemet by new supplies of LNG. Long-term projections of global LNG growth vary, butmost major energy companies and industry analysts expect global LNG demand toroughly triple by 2020, from 6 Tcf in 2003, to 18 Tcf or more in 2020.19 Accordingto EIA projections, 18 Tcf would account for approximately 13% of global naturalgas consumption in 2020.20
LNG Safety and Security
Natural gas is combustible, so an uncontrolled release of LNG poses a hazardof fire or, in confined spaces, explosion. LNG also poses hazards because it is socold. Because LNG tankers and terminals are highly visible and easily identified,they may also be vulnerable to terrorist attack. Assessing the potential risk fromLNG releases is controversial. A 1944 accident at one of the nation’s first LNGfacilities, for example, killed 128 people and initiated public fears about LNGhazards which persist today.21 But technology improvements and standards since the1940’s appear to have made LNG facilities safer. Between 1944 and 2006, LNGterminals experienced approximately 13 serious accidents, with two fatalities,directly caused by LNG.22 Since international LNG shipping began in 1959, tankershave carried 40,000 LNG cargoes without a serious accident at sea or in port.23 InJanuary 2004, however, a fire at an LNG processing facility in Algeria killed anestimated 27 workers and injured 74 others.24 The Algeria accident raised newquestions about LNG facility safety and security.
A number of technical studies since the terror attacks of September 11, 2001,have been commissioned to reevaluate the safety hazards of LNG terminals andassociated shipping. These studies have caused controversy because, due todifferences in analytic assumptions, some have reached inconsistent conclusions
http
://w
ikile
aks.
org/
wik
i/C
RS-
RL32
386
CRS-7
25 Sandia National Laboratories (SNL). Guidance on Risk Analysis and Safety Implicationsof a Large Liquefied Natural Gas (LNG) Spill Over Water. SAND2004-6258. Albuquerque,NM. Dec. 2004. p51.26 SNL. Dec. 2004. p14.27 Natural Gas Act of 1938 (NGA), June 21, 1938, ch. 556, 52 Stat. 812, (codified asamended at 15 U.S.C. §§ 717 et seq).28 Open access required terminal owners to offer services on a first come, first served basis,and could not discriminate against service requests to protect their own market activities.29 Vallee, James E. “FERC Hackberry Decision Will Spur More U.S. LNG TerminalDevelopment.” Oil & Gas Journal. Nov. 10, 2003. p64.30 Federal Energy Regulatory Commission (FERC). Press release. R-04-3. Feb.11, 2004.31 Lorenzetti, M. “LNG Rules.” Oil & Gas Journal. Apr.5, 2004. p32.
about the potential public hazard of LNG terminal accidents or terror attacks. In aneffort to resolve these inconsistencies, the Department of Energy commissioned acomprehensive LNG hazard study from Sandia National Laboratories. The Sandiareport, released in December 2004, determined that a worst-case, “credible” LNGtanker fire could emit harmful thermal radiation up 2,118 meters (1.3 miles) away.25
Although, the report concluded that “risks from accidental LNG spills ... are smalland manageable,” it also concluded that “the consequences from an intentional[tanker] breach can be more severe than those from accidental breaches.”26 Bothproponents and opponents of new LNG terminals have cited the Sandia findings tosupport their positions. The controversy continues.
LNG Policy Activities of the Federal Government
The federal government has been actively promoting increased LNG imports.Through new regulation, administrative actions, and legislation, federal agencies andCongress have tried to foster LNG capital investment, streamline the LNG terminalapproval process, and promote global LNG trade.
FERC Regulations. The Federal Energy Regulatory Commission (FERC)grants federal approval for the siting of new onshore LNG facilities and interstate gaspipelines, and also regulates prices for interstate gas transmission.27 In December,2002, the FERC exempted LNG import terminals from rate regulation and openaccess requirements. This regulatory action, commonly called the “Hackberrydecision” allowed import terminal owners to set market-based rates for terminalservices, and allowed terminal developers to secure proprietary terminal access forcorporate affiliates with investments in LNG supply.28 These regulatory changesgreatly reduced investment uncertainty for potential LNG developers, and assuredaccess to their own terminals.29 In February 2004, FERC streamlined the LNG sitingapproval process through an agreement with the U.S. Coast Guard and theDepartment of Transportation to coordinate review of LNG terminal safety andsecurity. The agreement “stipulates that the agencies identify issues early and quicklyresolve them.”30 FERC also announced a new branch devoted to LNG within itsOffice of Energy Projects.31

http
://w
ikile
aks.
org/
wik
i/C
RS-
RL32
386
CRS-8
32 Eckert, Toby. “Sempra Gets Final OK for Louisiana Gas Import Facility.” Copley NewsService. Sep. 10, 2003.33 Federal Energy Regulatory Commission (FERC). “Existing and Proposed North AmericanLNG Terminals.” Office of Energy Projects. Washington, DC. Jan. 4, 2006.[http://www.ferc.gov/industries/lng/indus-act/exist-prop-lng.pdf].34 “Cheyenne Plains, Tractebel’s Calypso Pipelines Get Green Light.” Natural GasIntelligence. Mar. 24, 2004.35 EIA. DOE/EIA-0383(2004). Jan. 2004. p15.
Between 1999 and 2005, FERC approved the reactivation of the two idled U.S.LNG terminals, and subsequently approved the expansion of the four existing importterminals in the continental United States. In September, 2003, FERC approved theCameron LNG project in Hackberry, LA, the first new LNG import terminal to besited in the continental United States in over 25 years.32 The commission has sinceapproved eight additional terminals (in Texas, Louisiana, and Massachusetts), andas of January, 2006 has received 12 additional terminal siting applications.33 In 2004,FERC also approved the construction of two new gas pipelines connecting Floridato proposed LNG import terminals in the Bahamas.34 The terminals and pipelinesapproved to date by FERC could increase total U.S. LNG import capacity toapproximately 7.0 Tcf per year.
Offshore Terminal Regulations. In November, 2002, Congress passed theMaritime Transportation Security Act of 2002 (P.L. 107-295), which transferredjurisdiction for offshore LNG terminal siting approval from the FERC to theMaritime Administration (MARAD) and the U.S. Coast Guard (USCG). Accordingto the Department of Energy, the act
... streamlined the permitting process and relaxed regulatory requirements.Owners of offshore LNG terminals are allowed proprietary access to their ownterminal capacity, removing what had once been a major stumbling block forpotential developers of new LNG facilities.... The streamlined applicationprocess ... promises a decision within 365 days....35
The proprietary access provisions for offshore terminals are similar to those set byFERC for onshore terminals to ensure equal treatment for both kinds of facilities. InNovember, 2003, the MARAD and USCG approved the Port Pelican project, the firstoffshore LNG terminal ever to be sited in U.S. waters. The agencies havesubsequently approved Energy Bridge (January, 2004) and Gulf Landing (February,2005), two additional offshore LNG projects. All three terminals would be locatedin the Gulf of Mexico. Their combined annual capacity would be approximately 1.2Tcf. As of January, 2006, the agencies were reviewing seven additional offshoreterminal applications, two off the California coast, four in the Gulf of Mexico, andtwo off the coast of Massachusetts.
Congressional Activities. In 2005, Congress passed and President Bushsigned the Energy Policy Act of 2005 (P.L. 109-58). The Energy Policy Act isgenerally seen as promoting new LNG terminal development in several ways. Asnoted earlier in this report, the act resolved certain state-federal jurisdictionaldisputes by granting the FERC explicit and “exclusive” authority to approve onshore

http
://w
ikile
aks.
org/
wik
i/C
RS-
RL32
386
CRS-9
36 These proposals include several proposed terminals in Canada, Mexico and the Bahamas.
LNG terminal siting applications (Sec. 311c). The act also codifies the “Hackberrydecision”discussed above (Sec. 311c). The act designates the FERC as the "leadagency for the purposes of coordinating all applicable Federal authorizations" and forcomplying with federal environmental requirements (Sec. 313a). It also establishesthe FERC's authority to set schedules for federal authorizations and establishesprovisions for judicial review of FERC's siting decisions in the U.S. Court ofAppeals, among other administrative provisions (Sec. 313b). The act also requiresFERC to promulgate regulations for pre-filing of LNG import terminal sitingapplications and directs FERC to consult with designated state agencies regardingsafety considerations in considering such applications. It permits states to conductsafety inspections of LNG terminals in conformance with federal regulations,although it retains enforcement authority at the federal level. The act also requiresLNG terminal operators to develop emergency response plans including cost-sharingto reimburse state and local governments for safety and security costs (Sec. 311d).
Key Issues in U.S. LNG Import Policy
Federal actions are facilitating greater U.S. LNG imports, and the private sectoris responding with plans for new LNG facilities. Nonetheless, concerns are emergingabout the infrastructure needs of LNG, the future structure of global LNG trade, andthe relationship between the United States and other LNG market participants.
Physical Infrastructure Requirements
To meet U.S. LNG imports of 4.13 Tcf in 2025 as projected by the EIA wouldrequire significant additions to North American import terminal capacity. Alongwith expansions at four existing terminals, six to ten new import terminals would beneeded. LNG developers have proposed over 30 new terminals with a combinedimport capacity far exceeding what would likely be needed the meet the projections(Figure 4).36 These developers include multi-national corporations with the financialresources and project experience to develop such facilities. At issue is where theseterminals would be built, how they would be integrated into the nation’s existing gasinfrastructure, and how they might be secured against accident or terrorist attack.

http
://w
ikile
aks.
org/
wik
i/C
RS-
RL32
386
CRS-10
Source: Federal Energy Regulatory Commission (FERC). “Existing and Proposed North American LNG Terminals.”Office of Energy Projects. Washington, DC. Jan. 23, 2006. [http://www.ferc.gov/industries/lng/indus-act/exist-prop-lng.pdf]
Figure 4: Existing and Proposed LNG Import Terminals in North America

http
://w
ikile
aks.
org/
wik
i/C
RS-
RL32
386
CRS-11
37 Jowdy, M. and Haywood, T. “LNG Imports Undermine Premiums Near US Terminals.”World Gas Intelligence. Nov. 25, 2003. 38 Editorial. “Move ExxonMobil’s LNG Plant Offshore.” Mobile Register. Nov. 30, 2003.39 Fifield, A. “Del. Hands BP a Setback on Pier.” Philadelphia Enquirer. Feb. 4, 2005.40 U.S. Supreme Court. Order list:546 U.S. New Jersey v. Delaware. Jan. 23, 2006. 41 “Rhode Island, Massachusetts Officials Ask Court to Block Weaver's Cove LNG Project.”Natural Gas Intelligence. Jan. 30, 2006.
Terminal Siting. Choosing acceptable sites for new LNG terminals hasproven controversial. As noted earlier in this report, federal agencies have approvedthe siting of ten new terminals in the Gulf of Mexico as well as two new Floridapipelines for proposed terminals in the Bahamas. But many developers have soughtto build terminals nearer to major consuming markets in California and theNortheast, as Figure 4 shows. Developers have proposed terminals near consumingmarkets to avoid pipeline bottlenecks and to minimize transportation costs. In 2003,soon after LNG deliveries to the Cove Point resumed, natural gas for the localMaryland market was priced well below conventional gas supplies transported bypipeline from the Gulf of Mexico.37 If new terminals are built far from key consumermarkets, delivered gas might cost more than if LNG terminals were built locally.
As of January, 2006, federal agencies have approved only one new LNG importterminal outside the Gulf of Mexico, in Massachusetts. Such near-to-market terminalproposals have struggled for approval due to community concerns about LNG safety,effects on local commerce, and other potential negative impacts. LNG terminalopposition is not unlike that experienced by some other types of industrial and utilityfacilities. Due to local community opposition, LNG developers have alreadywithdrawn terminal projects recently proposed in California, Maine, North Carolina,Florida, and Mexico. Other terminal proposals in Rhode Island, New York, NewJersey and Canada are facing stiff community opposition. In Alabama, a stateassumed by many to be friendly to LNG development, community groups haveeffectively blocked two onshore terminal proposals and have called for LNG importterminals to be built only offshore.38
In some cases state and local agencies are at odds with federal agencies overLNG terminal siting approval. For example, Delaware’s environmental secretary hasblocked the development of an LNG terminal on the Delaware-New Jersey borderruling that part of the terminal would extend into Delaware’s waters and violateDelaware’s Coastal Zone Act.39 The United States Supreme Court has appointed aspecial master to resolve the dispute.40 In January, 2005, Massachusetts and RhodeIsland filed petitions in federal court to reverse FERC’s approval of an LNG importterminal to be sited in Fall River, Massachusetts.41 In 2004, the California PublicUtilities Commission (CPUC) sued FERC in federal court over FERC’s assertionof sole jurisdiction over the siting of an LNG terminal in Long Beach. The CPUCdropped its suit, however, after the passage of P.L. 109-58 mooted its arguments.
Local opposition for LNG terminals has been strong in the Northeast, which hasa constrained gas transmission infrastructure. Northeast gas prices are higher thanin other parts of the country. In Maine, for example, the monthly average wholesale

http
://w
ikile
aks.
org/
wik
i/C
RS-
RL32
386
CRS-12
42 Energy Information Administration (EIA). “Natural Gas City Gate Price.” website dataseries. [http://tonto.eia.doe.gov/dnav/ng/ng_pri_sum_dcu_nus_m.htm]. Jan. 25, 2005.43 El Paso Corp. “El Paso Corporation Announces Elba Island Expansion and RelatedPipeline Project.” Press release. Houston, TX. Dec. 21, 2005.44 “LNG Importers Face Supply, Pipeline Constraints.” Gas Daily. April 8, 2005. p1.; “LNGExpansion Requires Adequate Takeaway Capacity and Market Integration.” Foster NaturalGas Report. Feb. 5, 2004. p15.45 Foster Natural Gas Report. Feb. 5, 2004. p15
price of gas delivered between October, 2004 and October, 2005 was $12.09/Mcf,compared to $8.27/Mcf in Louisiana.42 Were the same price differential to hold inthe future, Maine consumers would have to pay $3.81/Mcf, or 46 percent, more forLNG delivered to Louisiana rather than the Maine coast. Many factors like weather,pipeline tariffs, and new natural gas supplies from Canada could significantly changerelative prices. Nonetheless, if recent regional pricing patterns persist, displacing ahandful of proposed LNG terminals from consumer markets to the Gulf of Mexicocould cost regional gas consumers billions of dollars in extra pipeline transportationcharges. On the other hand, siting new terminals in more receptive locations couldhelp bring them into service more quickly, and could still exert downward pressureon gas prices while alleviating community safety concerns.
Pipeline Infrastructure. LNG supplies to the United States have been sucha small share of the total market that they have had little discernible influence on thedevelopment of North America’s gas pipeline network. If projections of U.S. LNGgrowth prove correct, however, LNG terminals may have more impact on pipelineinfrastructure in the future. As additional LNG import capacity is approved, hownew terminals will be physically integrated into the existing pipeline networkbecomes a consideration.
LNG terminals may affect pipeline infrastructure in two ways. First, newterminals and terminal expansions must be connected to the interstate pipelinenetwork through sufficient “takeaway” pipeline capacity to handle the large volumesof imported natural gas. Depending upon the size, location and proximity of a newterminal to existing pipelines, ensuring adequate takeaway capacity may require newpipeline construction. For example, the owner of the Elba Island, GA terminalintends to build a 191-mile pipeline to transport additional gas volume from theterminal’s planned expansion.43 Energy experts have expressed concern, however,that interstate pipeline capacity may not be sufficient to handle future LNG supplieswithout substantial new pipeline additions.44 The availability of pipeline capacitydirectly affects pipeline transportation costs, so it is an important consideration inevaluating the economics of LNG versus traditional pipeline supplies in specificmarkets.
Second, if gas imported as LNG cannot move freely through interstate pipelinesystems, consumers may not realize the lower prices that result from additional gasavailability. One industry observer remarked, “without more infrastructure, gas mayface the kind of glut plaguing the electric utility industry, with too much generatingcapacity and too few connections.”45 For this reason, some LNG developers advocatebuilding LNG terminals in traditional gas producing regions, where pipeline nodes

http
://w
ikile
aks.
org/
wik
i/C
RS-
RL32
386
CRS-13
46 “For Sponsors, Stake in Supply is Key to Getting LNG Terminals Built, says ExxonMobilHead.” Inside F.E.R.C. Feb. 16, 2004. p20.47 S. L. Paulson. “Promoting the Promise of LNG.” American Gas. American Gas Assoc.June, 2005.48 “Consultant: LNG Will Cut Transportation Values, Put Downward Pressure on Prices.”Natural Gas Intelligence. Dec. 29, 2003. 49 Rogers, D. “Gas ‘Interchangeability’ and Its Effects On U.S. Import Plans.” Pipeline &Gas Journal. Aug. 2003. pp21-24.
are located. According to one industry executive, “it doesn’t make a lot of sense tobuild a terminal and then have to build a huge pipeline.”46 Others argue that the mostcostly constraints in the gas pipeline network are at the ends of the pipelines, not thebeginnings. Gas is expensive in Boston, for example, because there are few pipelinessupplying the region — a transportation constraint that would not be alleviated bypumping more gas into pipelines in the Gulf of Mexico. As one senior FERC officialhas reportedly remarked, “putting more and more LNG plants in the Gulf, while itmay be good for the overall gas supply situation in this country, won't do a whole lotfor the regional gas needs of New England.”47 It is not clear, therefore, whetheradding LNG supplies to traditional producing regions would be less costly forconsumers than building in-market terminals and adding to regional pipelinecapacity.
In addition to requiring sufficient takeaway capacity, LNG terminals likely willinfluence pipeline network flows. Major U.S. pipeline systems were designedprimarily to move gas from traditional producing regions (e.g., Gulf Coast,Appalachia, Western Canada) to consuming regions (e.g, Northeast, Midwest). Ifmost new LNG capacity is built in the Gulf of Mexico, then traditional gas flowswould be maintained. If a number of new terminals are built in consuming regions,however, they may change historical gas transportation patterns, potentiallydisplacing traditional production and changing infrastructure constraints. Amongother potential impacts, some analysts have suggested that new LNG terminals willresult in “less market leverage and probably lower cash flows” for some existingpipelines because new LNG supplies may be able to reach consumer markets byalternate routes.48 Predicting the overall effects of long term changes in gas flows isa complex problem, although such changes may have important implications forcurrent pipeline utilization and for future pipeline investments.
Interchangeability. LNG consists primarily of methane, but it may alsocontain significant quantities of other hydrocarbon fuels, such as ethane, propane andbutane. The quantity of these other fuels in LNG affects the overall heat content inthe LNG and varies depending upon its source. In markets outside the United States,LNG contains more non-methane fuels and, therefore, has a higher heat content thantraditional U.S. natural gas supplies. LNG with a high heat content can causeproblems when imported into the United States because it may damage pipelines andnatural gas-fired equipment (e.g., electric power turbines) which are designed for alower heat content. There are a number of potential technical solutions to LNGinterchangeability problems, such as stripping out the non-methane fuels, blendingthe LNG with domestic natural gas, and “diluting” the LNG with nitrogen.49 Thesesolutions may involve significant added expense to LNG processing, however, which

http
://w
ikile
aks.
org/
wik
i/C
RS-
RL32
386
CRS-14
50 Federal Energy Regulatory Commission (FERC). “LNG - Issues - Gas Quality.” Webpage. Jan. 25, 2005. [http://www.ferc.gov/industries/lng/indus-act/issues/gas-qual.asp]51 For further discussion see CRS Report RL32205: Liquefied Natural Gas (LNG) ImportTerminals: Siting, Safety, and Regulation by Paul W. Parfomak and Aaron Flynn.52 CRS Report RL32073. Liquefied Natural Gas (LNG) Infrastructure Security: Backgroundand Issues for Congress by Paul W. Parfomak.53 Increasing tanker size may reduce the actual number of future shipments, but are assumednot to reduce associated security costs since the hazard associated with each ship and timein port would increase proportionately.54 Note that security costs associated with LNG terminals in Canada, Mexico and theBahamas (built primarily to serve U.S. markets) would not be a direct U.S. responsibility,although such costs might still priced into LNG supplied from those terminals.
could be reflected in higher natural gas prices. The FERC has been working withnatural gas trade associations to establish appropriate national policies for natural gasinterchangeability and quality. The FERC has addressed some interchangeabilityissues on a case by case basis, and has proposed more general regulations on naturalgas quality and interchangeability, but the commission’s expressed preference is thatthe gas industry and gas quality stakeholders reach their own consensus oninterchangeability.50
Safety and Physical Security. To protect the public from an LNG accidentor terrorist attack, the federal government imposes numerous safety and securityrequirements on LNG infrastructure. The nature and level of risk associated withLNG is the subject of ongoing debate among industry, government agencies,researchers and local communities.51 Whatever the specific risk levels aredetermined to be, they could multiply as the number of LNG terminals and associatedtanker shipments grows. Likewise, the costs associated with mitigating these risksare also likely to increase. To the extent these costs are not borne by the LNGindustry, they may represent an ongoing burden to public agencies such as the CoastGuard, law enforcement, and emergency response agencies.
Securing tanker shipments against terrorist attacks may be the most significantpublic expense associated with LNG. CRS has estimated the public cost of securityfor an LNG delivery to the Everett terminal to be on the order of $80,000, excludingcosts incurred by the terminal owner.52 Marine security costs at other LNG terminalscould be lower than for Everett because they are farther from dense populations andmay face fewer vulnerabilities, but could still be on the order of $20,000 to $40,000per shipment. If LNG imports increase as projected, the number of vessels callingat LNG terminals serving the United States would increase from 99 (0.17 Tcf) in2002 to over 2300 (4.13 Tcf) in 2025.53 At current levels of protection, marinesecurity costs would then be in the range of $46 million to $92 million annually.54 Recognizing the added security needs associated with the LNG trade, the CoastGuard’s FY2006 budget includes an additional $11 million in general maritimesecurity funding over FY2005 levels. These resources are for new small responseboats and associated crew to increase the Coast Guard’s operational presence and

http
://w
ikile
aks.
org/
wik
i/C
RS-
RL32
386
CRS-15
55 Dept. of Homeland Security (DHS). Budget-in-Brief, Fiscal Year 2006.56 O’Driscoll, M. “LNG: Hurricane Raises Questions on Gulf Terminal Clusters. Greenwire.Sept. 6, 2005.57 Reuters News Service. “U.S. Gas Traders Shrug Off Trinidad LNG Strike.” Mar. 9, 2004.58 “LNG Ban Could Spell Higher Power Prices.” Gas Daily. Oct. 5, 2001. p5.59 “Trinidad Strike Settled in Two Days, But Raises Red Flags.” Natural Gas Intelligence.Mar. 15, 2004. p1.
response posture, enforce security zones, and escort LNG tankers and other highinterest vessels.55
Congress included provisions in P.L. 109-58 requiring new LNG terminalapplicants to include plans for security cost-sharing with state and local governmentagencies (Sec. 311d). The public costs of LNG security also may decline as federallymandated security systems and plans are implemented. Nonetheless, because theaccounting of security costs is ambiguous and may be tied to uncertain sources offederal funding, such as Department of Homeland Security grants, some policymakers remain concerned about LNG security costs and the potential diversion ofCoast Guard and safety agency resources from other activities.
Supply Bottlenecks. Because U.S. LNG terminals process large volumesof LNG, the potential for one facility to bottleneck supply might not be recognized.A disruption at a U.S. import terminal (or at an associated supplier’s export terminal)could effect regional gas availability.
Hurricanes Katrina and Rita, which struck the Gulf of Mexico in 2005, forcedthe temporary closure of the Lake Charles LNG terminal and raised questions aboutthe vulnerability to future hurricanes of multiple new LNG import terminals in thesame region.56 In March, 2004, striking workers at an export terminal in Trinidadstopped all LNG operations — interrupting shipments from the largest U.S. supplierand the sole supplier to the Everett terminal. Although the strike ended quickly andU.S. gas demand at the time was moderate, one gas trader stated that if the strike hadoccurred during the heart of winter it might have exacerbated already high Northeastgas prices.57 Similarly, when LNG shipments to the Everett LNG terminal weresuspended after the terror attacks of September 11, 2001, markets analysts fearedshortages of gas for heating and curtailments of gas deliveries to regional powerplants in New England.58
Some industry analysts view the Gulf hurricanes, Trinidad strike, and September11, 2001 events as new supply risks the United States could face as LNG becomesa larger share of gas supply. Others view these kinds of events as ordinary supplyuncertainties readily managed in other fuel markets. As one consultant stated,
they are not problems that should make the industry shy away from developingLNG trade ... they are just problems that should make you consider how you aregoing to structure long-term LNG contracts and estimate what kind of premiumsyou are going to pay over indigenous pipeline supply.59

http
://w
ikile
aks.
org/
wik
i/C
RS-
RL32
386
CRS-16
60 Greenspan, A., Chairman, U.S. Federal Reserve Board. “Natural Gas Supply and DemandIssues.” Testimony before the House Energy and Commerce Committee. Jun. 10, 2003.61 “LNG Fleet.” LNG OneWorld website. [http://www.lngoneworld.com] Drewry ShippingConsultants. London, England. Jan. 30, 2006.
The future sensitivity of U.S. natural gas markets to LNG terminal disruptions isdifficult to forecast and will be driven by factors such as supply diversity and pipelinedevelopment. Nonetheless, the concentration of incremental gas supplies amongperhaps a dozen major import facilities may raise new concerns about the security ofU.S. natural gas supply.
Global LNG Market Structure
In his 2003 congressional testimony, Federal Reserve Chairman Alan Greenspanasserted that increasing LNG import capacity would create “a price-pressure safetyvalve” for North American natural gas markets which would be “likely to notablydamp the levels and volatility of American natural gas prices.”60 Basic marketeconomics suggest that increasing marginal gas supplies from any source would tendto lower gas prices. But the long-term effectiveness of LNG in moderating gas priceswill be significantly influenced by global LNG supply, the development of an LNGspot market, and potential market concentration.
Global LNG Supply. The belief that LNG can serve as a “price-pressuresafety valve” by setting a price ceiling on natural gas assumes that sufficient LNGwould be available at that price to satisfy all incremental gas demand. Otherwise,gas prices would be capped by potentially more costly North American productionalternatives. The question, then, is whether there will be sufficient LNG productionabroad to supply incremental U.S. demand and sufficient global infrastructure todistribute it.
Table 1 summarizes basic characteristics of existing or potential LNGexporters. As the table shows, 2005 global LNG production capacity currentlyoperating totaled approximately 9.1 Tcf per year. Table 1 also shows an additional15.8 Tcf of global capacity proposed for service by 2015, with more proposals likelyin the future. If all these proposed facilities were constructed, total global productioncapacity could exceed 24 Tcf annually, exceeding EIA’s projected global LNGdemand of 18 Tcf in 2020.
Global tanker capacity also appears to be keeping up with LNG demand growth.Current tanker orders will add 130 ships to the current operating fleet of 191,increasing the overall number of LNG vessels 250% from the fleet size of 127tankers in 2001.61 Based on these figures, there appears to be sufficient interestamong existing and potential exporters to meet both short-term and long-term globalLNG demand projections. It remains to be seen which of these export projects willbe constructed and how they will be integrated into the global LNG trade.

http
://w
ikile
aks.
org/
wik
i/C
RS-
RL32
386
CRS-17
Table 1: Global Natural Gas Reserves and LNG Production Capacity
Country2005 GasReserves
(Tcf)
Share ofWorld GasReserves
(%)
LNG ProductionCapacity (Bcf/yr) OPEC
Member?Estimated2005
Projected2015
Russia 1,680 27.5 0 3,145 No
Iran 971 15.9 0 1,743 Yes
Qatar 911 14.9 1,470 3,812 Yes
Saudi Arabia 242 4.0 0 0 Yes
U.A.E. 214 3.5 292 292 Yes
United States 193 3.1 73 19 No
Nigeria 185 3.0 1,020 3,406 Yes
Algeria 161 2.6 1,069 1,264 Yes
Venezuela 151 2.5 0 229 Yes
Iraq 112 1.8 0 0 Yes
Indonesia 98 1.6 1,431 2,030 Yes
Norway 84 1.4 0 204 No
Malaysia 75 1.2 1,105 1,436 No
Egypt 59 1.0 609 1,027 No
Libya 53 0.9 34 156 Yes
Oman 29 0.5 321 502 No
Australia 28 0.5 570 2,566 No
Trinidad 26 0.4 735 1,003 No
Bolivia 24 0.4 0 341 No
Yemen 17 0.3 0 302 No
Brunei 14 0.2 351 516 No
Peru 9 0.1 0 214 No
Angola 2 <0.1 0 487 No
Eq. Guinea 1 <0.1 0 166 No
Others 776 12.7 0 0 No
OPEC Total 3,098 50.7 5,316 12,932
World Total 6,205 100.0 9,080 24,861
Sources: “World LNG Map: 2005 Edition." Petroleum Economist. 2005; "Major LNG Gas Projectsto 2015." Reuter's News. Jan. 5, 2006; Oil & Gas Journal, Vol. 103, No. 47. Dec. 19, 2005. EnergyInformation Administration; Trade press.
Spot Market Growth. Some gas market analysts believe that a robust short-term or “spot” market for LNG is essential for U.S. importers to manage price andsupply risk, and to do business cost-effectively. An LNG spot market could allowfor short-term balancing of physical supply and demand. It could also offer greaterLNG price discovery and transparency, benefitting companies negotiating long-termLNG contracts and potentially serving as a more relevant index for LNG contract

http
://w
ikile
aks.
org/
wik
i/C
RS-
RL32
386
CRS-18
62 For an alternative view see J.T. Jensen, “The LNG Revolution,” The Energy Journal, Vol.24. No. 2. 2003. p14.63 J. Roeber, “The Development of the UK Natural Gas Spot Market,” The Energy Journal,Vol. 17. No. 2. 1996. p2.64 Kirkland, J. “LNG Spot Market Burgeoning but Chaotic as U.S. Importers Gird forBattle.” Inside F.E.R.C. Jan. 9 2006.65 “Asia Lures Natural Gas Cargoes From Trinidad, Nigeria, Boosts Prices,” Africa News,Oct. 19, 2004.66 Mike Hurle, “Indonesia Seeks LNG Cargoes to Cover Bontang Shortfall,” World MarketsAnalysis, Dec. 23, 2003.67 Hand, Marcus. “Petronas Head Says 30% of LNG Trade Will be Spot Deals.” Lloyd’s ListFeb. 5, 2004. p2.
price escalators than traditional petroleum indexes.62 A spot market might alsosupport financial trading and derivatives, important tools for managing price risk,especially during periods of volatile prices.63
In recent years, the global LNG market has seen limited, but increasing short-term trade. Short-term contracts accounted for 11% of global LNG transactions in2005, up from less than 2% in 1998, and have already enabled physical marketbalancing. In 2005, for example, just after Hurricanes Katrina and Rita struck theGulf of Mexico, Suez Energy (owner of the Everett LNG terminal) purchased a spotLNG cargo to meet its obligations to its New England customers.64 In 2003-2004,South Korea purchased 36 spot cargoes of LNG to meet extra residential heatingdemand during winter.65 In December, 2003, Indonesia sought four LNG cargoesfrom rival producers to meet delivery contracts following production problems at itsBontang plant.66
Unlike petroleum markets where all prices are essentially short-term, analystsbelieve LNG trade will stabilize with some mix of long and short-term contractssince infrastructure costs are so high. No new LNG liquefaction project yet has beenlaunched without a long term contract. The likely size of an LNG spot market isdifficult to predict, however at least one major exporter expects 30% of global LNGcapacity will ultimately trade on the spot market.67 Coupled with projections ofoverall LNG demand growth, a 30% spot market share implies a tripling in spotmarket volumes by 2020. It is an open question, however, whether this volume ofspot trade in LNG will materialize and if it will offer the full range of benefitsrealized in comparable commodity markets.
A concern related to LNG spot market development is the potential role ofmarket intermediaries. In the late 1990’s, independent marketers like Enron andDynegy emerged to participate in trading of natural gas, electricity, and other energycommodities. These market participants increased market liquidity, selling riskmanagement services to both producers and consumers. Many marketers fell intobankruptcy, however, following the California electricity crisis in 2001 andsubsequent scandals. A handful of major banks are beginning to pursue newpartnerships with LNG terminal companies (e.g., Morgan Stanley - Cheniere Energy)to facilitate LNG trading and marketing, but such partnerships have yet to fully

http
://w
ikile
aks.
org/
wik
i/C
RS-
RL32
386
CRS-19
68 Jura, M. “Banks Developing Taste For LNG Trade -- Physical And Financial.” NaturalGas Week. Jan. 2, 2006.69 J.T. Jensen, 2003, p. 25. For example, the natural unit of trade, an LNG tanker cargo, isseveral hundred times the size of a commodity contract for pipeline natural gas.70 Daniel Yergin and Stoppard Michael, “The Next Prize,” Foreign Affairs, Nov./Dec. 2003.71 M. Schmidt, “Former DOE Policy Chief: U.S. Focusing on Importing LNG from NearestLocales,” Inside Energy, Apr. 5, 2004, p. 10.72 “Gazprom’s Iran Strategy,” World Gas Intelligence, Feb. 2, 2005.73 Haines, L. “A Gas OPEC.” Oil & Gas Investor. Oct. 1, 2005. 74 Organization of Petroleum Exporting Countries (OPEC), “About OPEC,” at[http://www.opec.org], visited Feb. 10, 2005.
develop.68 It is unclear, therefore, which entities may ultimately succeed in providingthe LNG industry with the capabilities needed for a fully functioning market.
Market Concentration. Some industry analysts believe the future LNGmarket may be susceptible to concentration-related inefficiencies. They note thatonly a limited number of buyers and sellers can effectively participate in LNG tradebecause the capital requirements are so great.69 Many analysts also believe that arelatively small number of exporting countries are likely to account for the majorityof LNG trade in the foreseeable future.
Based on LNG’s similarity to the world oil trade, some observers are concernedabout the possible emergence of a natural gas export cartel analogous to theOrganization of Petroleum Exporting Countries (OPEC). One analyst remarked:
Might a few countries come to dominate the supply of LNG and adopt policiesharking back to the confrontational OPEC of the 1970’s? An association of somekind among LNG exporters is likely. Many of them are also oil exporters, andthe desire to compare fiscal terms will be irresistible.70
In March, 2004, at the Fourth Annual Gas Exporting Countries Forum, 15 majornatural gas exporters established an “executive bureau” to develop common policiesand joint initiatives regarding natural gas exports. According to press accounts, someforum members viewed the bureau as “a major step toward creating an OPEC-likeorganization to regulate gas production.”71 Some analysts have also pointed toapparent efforts by Russian gas company, Gazprom, “to sketch out the basic termsfor broad cooperation in the gas sector between Russia and Iran” the two countriescontrolling the largest natural gas reserves in the world.72 Other analysts are moreskeptical of a potential natural gas cartel, citing the predominance of long-termcontracts for LNG trade, divergent national interests, and other factors as barriers tocollaboration.73
The ability of a cartel to play a similar role in gas as OPEC does in oil isdebatable. OPEC member countries currently control over 75% of the world’sproven oil reserves and approximately 40% of global oil supply.74 By comparison,OPEC members control approximately 50% of proven world gas reserves andapproximately 59% of global LNG production capacity projected for 2015 (Table 1).

http
://w
ikile
aks.
org/
wik
i/C
RS-
RL32
386
CRS-20
75 Energy Information Administration (EIA), International Energy Outlook 2004,DOE/EIA-0484(2004), Apr. 2004, p. 53.
USA (22%)
Japan (20%)
S. Korea (13%)
Spain (9%)
UK (7%)
India (4%)
Mexico (4%)
France (4%)
Taiwan (4%)
China (3%)Others (8%)
Figure 5: Global LNG Import Market Shares Projected for 2015
When non-LNG sources are accounted for, however, OPEC countries’ share ofglobal gas supply would be approximately 5% in 2015. Based on these figures alone,it is difficult to draw conclusions about the potential market power of an associationof LNG exporters. It is possible, however, that the diversity of LNG suppliers, andthe competitive relationship between LNG and traditional pipeline gas could makethe world LNG market somewhat different than that of oil.
Global Trade and Politics. Continued growth of United States demand inan integrated global LNG market may affect trading and political relationships withkey market participants. According to one estimate, by 2015 the United States maybe the world’s largest LNG importer, accounting for 22% of global volumes (Figure5). South Korea, Spain, and the UK will also be importing large quantities of LNG,and may be joined by developing nations including India and China, seeking greaterimports for rapidly growing economies.
Source: Deutsche Bank Securities, Inc. “Global LNG: Exploding the Myths.” July 22. 2004. p2.
In an integrated global LNG market, individual country energy polices maysignificantly affect LNG price and availability worldwide. In 2001 and 2002, forexample, after the Japanese government forced Tokyo Electric Power to shut downover a dozen nuclear plants for safety reasons, Japanese utilities relied more heavilyon fossil fuels for electricity generation. According to the EIA:
the result was a significant increase in Japan’s demand for LNG, so that themajority of world spot cargoes were delivered to the Japanese market. Japan’sincreased reliance on LNG probably contributed to the reduction in short-termdeliveries of LNG to the United States... 75

http
://w
ikile
aks.
org/
wik
i/C
RS-
RL32
386
CRS-21
76 “LNG Supply Shock Would Hit Asia Hard,” Petroleum Intelligence Weekly, Mar.12,2003.77 M. Jura, “Spiking Spanish Demand Diverts LNG Cargoes Away from US,” The Oil Daily,Feb. 3, 2005.78 Kirkland, J. Jan. 9 2006.79 Frank A. Verrastro, LNG the Growing Alternative, Center for Strategic and InternationalStudies, Qatar Embassy Policy Series, Washington, DC, Mar. 16, 2004.80 M. Schmidt, “Former DOE Policy Chief: U.S. Focusing on Importing LNG from NearestLocales,” Inside Energy, Apr. 5, 2004, p. 10.81 I. Bremmer, “Are the U.S. and China on a Collision Course?,” Fortune, Jan. 25, 2005.82 Lucy Hornby, “Trinidad to Expand Role as Top Supplier of US LNG.” Oil Daily, Apr.21, 2004, p. 4.83 Champion, M. and Chazan, G. “Russia's Tough Gas Tactics Force Neighbors to DiversifyWall Street Journal Europe. Jan. 30 2006.
Japan’s nuclear energy policies also affected South Korea, which depends on flexiblespot LNG supplies to meet winter heating demand. With LNG supplies in Asiasuddenly scarce, South Korea had to pay a substantial premium to attract spot cargoesoriginally destined for Spain.76 In 2004-2005, Spain attracted numerous LNG spotcargoes “at the expense of the US” in response to record cold weather and inadequatehydroelectric power supplies.77 Despite record cold temperatures and record highnatural gas prices after the Gulf hurricanes, U.S. LNG terminals were operating atless than 50% capacity in December, 2005.78
Trade with LNG exporters such as Iran, Nigeria, and Venezuela may also raisegeopolitical concerns. According to one analyst, “question remains on the merits ofincreasing reliance on imported energy ... if supply sources are from a regionperceived as politically unstable or inhospitable to U.S. interests.”79 In part tomitigate such risks, the DOE has been encouraging the development of LNG suppliesin South America and West Africa rather than the Middle East. According to theformer DOE Assistant Secretary for Policy and International Affairs, “DOE is tryingto make countries like Equatorial Guinea as attractive as possible to investors whileaiming to limit the countries’ potential political instability through contract andregulatory reform.”80
LNG trade may also be linked to broader trading and political relationshipsamong key LNG partners. For example, in the fall of 2004, China’s interest insecuring LNG supplies from Iran “put it in direct conflict with U.S. efforts to forceIran to renounce its ambitions to become a nuclear weapons state.”81 In a 2004meeting with U.S. Energy Secretary Spencer Abraham, the Prime Minister ofTrinidad reportedly used his country’s status as the largest U.S. LNG supplier to seekmost favored nation status for Trinidad’s energy exports, duty free U.S. access for allTrinidadian-packaged products, and U.S. aid to offset gas exploration costs.82
Russia’s brief withholding of natural gas supplies to Ukraine and parts of theEuropean Union in January, 2006 in what was widely perceived as both an economicand political dispute have raised additional concerns about political linkages amongfuture natural gas market participants.83 It is interesting to note that several Europeancountries, including Italy, Ukraine, Poland, Hungary, Croatia, have since proposed

http
://w
ikile
aks.
org/
wik
i/C
RS-
RL32
386
CRS-22
the construction of new LNG imports terminals to reduce their dependence onRussian pipeline natural gas supplies. Russia’s plans to become a major LNGexporter may further complicate the global natural gas trade.
It is difficult to predict the nature of trading and political relationships eitheramong LNG importers, or between specific LNG importing and exporting countriesover a 20-year time frame. Nonetheless, experience suggests that global LNG trademay introduce new risks and opportunities among trading countries that warrantconsideration in LNG policy debate.
Conclusions
As long as domestic demand outpaces North American natural gas production,the option of developing LNG import capacity appears economically attractive.Currently, LNG supplies 3% of U.S. natural gas, but both industry and governmentproject this figure to rise to as much as 21% by 2025. Such an increase would posea number of practical, immediate challenges, such as ensuring adequate productionand import capacity, integrating LNG efficiently into the existing natural gas supplynetwork, and securing LNG infrastructure against accident or terrorist attack. Publicopposition to LNG-related facilities and new trading relationships in an increasinglyintegrated global gas market will also bear upon the expansion of the industry.
As the practical challenges to LNG import expansion are addressed, the policydiscussion turns to the long-term implications of increased LNG imports in thenation’s energy supply. Intentionally or not, the United States may be starting downa path of dependency on LNG imports similar to its current dependency on foreignoil. Such a dependency would represent a major shift in the nation’s energy policy,and may have far-reaching economic impact. Because U.S. natural gas markets areregional, major consuming areas such as California and the Northeast might beparticularly affected.
Some energy analysts believe that U.S. dependency on imported LNG isinevitable; the only uncertainty is how quickly it will occur. Others disagree,promoting instead familiar alternatives such as greater domestic gas production,switching to oil or other energy sources, and conservation. Recent measures beforeCongress affect LNG imports by providing incentives for domestic gas productionand for new LNG terminal construction. If Congress considers the relative merits ofLNG and other energy supply alternatives, three overarching policy questions mayemerge.
! Is expanding LNG imports the best option for meeting long-termnatural gas demand in the United States?
! What future role, if any, should the federal government play infacilitating the ongoing development of LNG infrastructure in theUnited States and abroad?
! How might Congress mitigate the risks of the global LNG tradewithin the context of national energy policy?

http
://w
ikile
aks.
org/
wik
i/C
RS-
RL32
386
CRS-23
The answers to these questions may flow from enhanced understanding of theinfrastructure and market structure issues discussed in this report. With incompleteinformation and limited policy analysis, LNG imports may look unrealisticallyattractive to some, but unreasonably risky to others. The reality probably liessomewhere in between. It may not be possible to predict the LNG future 20 yearsfrom now, but choices made now can substantially affect that future.