wildcat wind farm i revenue benefits for madison county farms/wwf_madison_sep... · 2011-08-09 ·...
TRANSCRIPT
1
WILDCAT WIND FARM I REVENUE BENEFITS FOR MADISON COUNTY
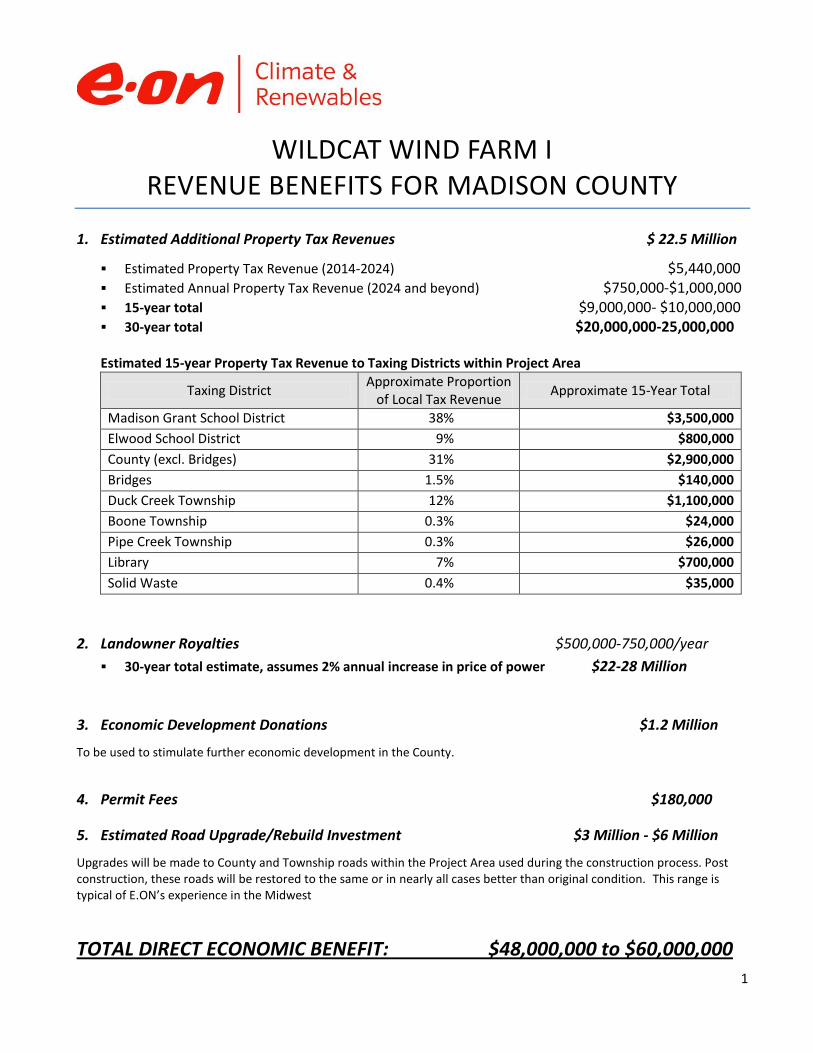
1. Estimated Additional Property Tax Revenues $ 22.5 Million
Estimated Property Tax Revenue (2014-2024) $5,440,000 Estimated Annual Property Tax Revenue (2024 and beyond) $750,000-$1,000,000
15-year total $9,000,000- $10,000,000
30-year total $20,000,000-25,000,000
Estimated 15-year Property Tax Revenue to Taxing Districts within Project Area
Taxing District Approximate Proportion
of Local Tax Revenue Approximate 15-Year Total
Madison Grant School District 38% $3,500,000
Elwood School District 9% $800,000
County (excl. Bridges) 31% $2,900,000
Bridges 1.5% $140,000
Duck Creek Township 12% $1,100,000
Boone Township 0.3% $24,000
Pipe Creek Township 0.3% $26,000
Library 7% $700,000
Solid Waste 0.4% $35,000
2. Landowner Royalties $500,000-750,000/year
30-year total estimate, assumes 2% annual increase in price of power $22-28 Million
3. Economic Development Donations $1.2 Million
To be used to stimulate further economic development in the County.
4. Permit Fees $180,000
5. Estimated Road Upgrade/Rebuild Investment $3 Million - $6 Million
Upgrades will be made to County and Township roads within the Project Area used during the construction process. Post construction, these roads will be restored to the same or in nearly all cases better than original condition. This range is typical of E.ON’s experience in the Midwest
TOTAL DIRECT ECONOMIC BENEFIT: $48,000,000 to $60,000,000

1
To: Madison County Commissioners and Planning Commission From: E.ON Climate & Renewables Subject: Wildcat Wind Farm I - Summary of Potential Economic Impacts on Madison County Date: May 2, 2011 E.ON Climate & Renewables (EC&R) evaluated the economic impacts of constructing and operating the proposed Wildcat Wind Farm I project in Madison and Tipton Counties. Total investment in the wind farm will be approximately $350-400 million, half of which will be in the Madison County portion of the project. The project is expected to be constructed over an 8-12 month period beginning in early 2012. This analysis concludes that the project will result in a positive economic impact to the County, including the creation of jobs as well as an increase in local spending. The project will also confer land lease payments to participating landowners.
The analysis is based on reasonable assumptions of future expenditure patterns for constructing and operating the proposed wind farm. Findings should not be taken as precise projections of future performance, but rather provide insight into the likely economic impact of the project. Economic impacts were estimated using an input-output model designed by the U.S. Department of Energy, National Renewable Energy Laboratory (NREL) called the Jobs and Economic Impact (JEDI) model, which estimates the economic impacts of constructing and operating power generation facilities. Demographic and project specific data for Madison County was used to further refine results. A detailed description of the JEDI model can be found at http://www.nrel.gov/analysis/jedi/about_jedi.html.
Summary of Economic Impact
Wind farms and other economic investments that bring new dollars and jobs to a locale and are measured using three components of economic impact: direct, indirect and induced impacts, which are described below:
Direct impacts are immediate, project development and onsite labor impacts created by expenditures that are directly applied to the project and include expenditures on engineers, project developers, construction crews, road builders, turbine erection crews, crane operators, etc.
Indirect impacts, or secondary supply chain impacts, are generated by expenditures on equipment, materials and services for the construction or subsequent operation of the wind farm though spending on those supportive businesses. Examples include concrete manufacturers, equipment, spare parts, transportation, and also professional services.
Induced impacts reflect overall increases in household spending, as income increases due to additional economic activity created by the project. Induced impacts result when people spend money for their personal needs, not project needs, such as food, clothing, housing, day care, medical care and insurance.
For the purpose of this analysis, the term “job” is classified as one full-time equivalent (FTE) job. One FTE is equal to one person working full-time for one year, or 2,080 working hours (52 weeks, 40 hours per week). Local Economic Impact: Construction Phase
Jobs, wages, and salaries. As shown in Table 1, the project is projected to create approximately 30-60 jobs through the direct impacts associated with the project, generating approximately $3 million in earnings. This estimate represents the estimated number of local jobs directly involved in the project construction. The indirect impacts of the project are projected to create another 150-200 jobs, generating approximately $12 million in earnings. Induced impacts are projected to generate another 30-100 jobs and approximately $3.5 million in earnings.
Local expenditures. The direct impacts of the project are limited to on-site project costs, and are projected to generate approximately $200,000 in local spending in Madison County during the construction phase of the project. The majority of local spending that is projected to occur during the construction phase will occur as a result of the indirect impacts of the project. It is projected that the proposed wind farm will generate approximately $29 million in

2
local expenditures as a result of the indirect impacts of the project. The induced impacts associated with the project are projected to generate approximately $7 million in local expenditures.
In all, the total estimated economic impact of jobs, earnings and local expenditures is anticipated to have a combined total local benefit to Madison County of approximately $54.7 million during the 8-12 month construction phase of the project and create approximately 200-360 jobs. Figure 1: Estimated Benefits to Madison County during Construction Phase
Impact Type Approximate Jobs (FTE) Wages and Salaries Local Expenditures Total Local Benefit
Direct Impacts ~ 30-60 ~ $3,000,000 ~ $200,000 ~ $3,200,000
Indirect Impacts ~ 150-200 ~ $12,000,000 ~ $29,000,000 ~ $41,000,000
Induced Impacts ~ 30-100 ~ $3,500,000 ~ $7,000,000 ~ $10,500,000
Total Impacts ~ 200-360 ~ $18,500,000 ~ $36,200,000 ~ $54,700,000
Source: JEDI Wind. Note: Amounts rounded to the nearest hundred thousand dollars.
Local Economic Impact: Operations and Management Phase
Jobs, wages, and salaries. The direct impacts associated with the project are projected to create approximately 4-6 jobs in Madison County, generating approximately $250,000 annually in earnings. This includes jobs that are directly involved with the ongoing operations of the project. Another 8-10 jobs are projected to be generated by the indirect impacts of the project, generating a total of approximately $400,000 in wages and salaries annually. Induced impacts associated with the project are projected to create an additional 8-10 jobs in Madison County, generating approximately $400,000 in earnings.
Local expenditures. The direct impacts of the project are limited to on-site project costs, and are projected to generate approximately $50,000 annually in local spending. The majority of spending projected to occur within Madison County during the operations phase of the project will occur as a result of the indirect impacts of the project. It is projected that each year the proposed wind farm is in operation, approximately $2.6 million on local expenditures will be generated as a result of the indirect impacts associated with the project. Induced impacts are projected to generate another $800,000 each year in local spending.
As summarized in Figure 2, the total estimated economic impact of jobs, earnings and local expenditures is anticipated to have a combined total local benefit to Madison County of approximately $4.6 million annually during the ongoing operations of the project, and is expected to create approximately 20-26 jobs. Figure 2: Estimated Annual Benefits to Madison County during Operations Phase
Impact Type Approximate Jobs (FTE) Wages and Salaries Local Expenditures Total Local Benefit
Direct Impacts ~ 4-6 ~ $250,000 ~ $50,000 ~$300,000
Indirect Impacts ~ 8-10 ~ $400,000 ~ $2,600,000 ~$3,100,000
Induced Impacts ~ 8- 10 ~ $400,000 ~ $800,000 ~$1,200,000
Total Impacts ~20- 26 ~ $1,050,000 ~ $3,450,000 ~ $4,600,000
Source: JEDI Wind. Note: Amounts rounded to the nearest hundred thousand dollars.
Land Lease Payments
Landowners who lease their property for the project will benefit from the guaranteed income stream the project provides. In addition, land owners who elect to have meteorological towers will receive additional payments. Payments made to participating land owners within the Madison County are projected to total approximately $500,000 to $750,000 each year over the life of the project. These landowner payments are measured as part of the indirect impacts associated with the project, and contribute toward the total local benefit as summarized above.
Property Tax Revenue
The construction of the proposed wind farm will result in an increase to Madison County’s tax base by approximately $40-60 million. However, the anticipated property tax revenue is not presented as part of this summary.

Published May 2011 | Calculations based on national and state averages
Indiana’s impressive wind capacity additions have created economic development throughout the state
In 2009 and 2010, Indiana increased its installed wind capacity ten-fold, becoming one of the fastest growing states for wind power. New wind projects have supported new jobs and provided numerous economic benefits.
Currently online: 1,339 megawatts (MW)Added in 2010: 303 MWAdded in 2009: 905 MWWind projects in queue: 8,426 MW
Indiana added the second most new wind power capacity of any state in 2009 and was the third fastest-growing state for wind power. Indiana is now ranked 12th for most installed wind power capacity in the country. Meadow Lake Wind Project in Indiana is the 6th largest project in the U.S.
Blue counties have wind projects.Green dots are online wind energy manufacturing facilities.
Yellow dots are announced wind energy manufacturing facilities.
Wind Projects
Generation and PotentialPercentage of Indiana power provided by wind in 2010: 2.4%
Equivalent number of homes Indiana wind farms now power: 325,000
State wind resource: 148,228 MW (at 80 meters)
Indiana’s wind resource is ranked 15th in the US and according to resource assessment from the National Renewable Energy Lab, Indiana’s wind resource could provide over 400 percent of the state’s current electricity needs.
FOR MORE INFORMATION, PLEASE CONTACT: [email protected]
AMERICAN WIND ENERGY ASSOCIATIONWWW.AWEA.ORG | 202.383.2500 | 1501 M ST. NW, SuITE 1000, WASHINGTON, D.C.
WIND ENERGY FACTS: INDIANA

Investment in wind power is an investment in jobs, including jobs in operations and maintenance, construction, manufacturing and many support sectors. In addition, wind power projects produce lease payments for landowners and increase the tax base of communities.
• Total direct and indirect jobs supported in 2010: 1,000-2,000
• Annual property tax payments by wind project owners: $21 million
• Annual land lease payments: $4 million
Generating wind power creates no emissions and uses no water. The wind power installed in Indiana will avoid 2.3 million metric tons of carbon dioxide annually.
Indiana has already attracted major investment from the wind sector. Brevini, a major gearbox manufacturer, is constructing its first American facility in Muncie, Indiana. The company is investing over $60 million in the state and will employ over 450 workers. In addition, many smaller Indiana companies have found a role in the wind energy supply chain, creating new green-collar jobs for Indiana workers. At least 14 Indiana facilities currently manufacture components for the wind energy industry and 4 new facilities are announced.
Companies from Indiana exhibiting at the WINDPOWER 2010 Exhibition: 23
economic and environmental Benefits
Wind manufacturinG sector
events
A wind turbine blade on a specialized rail car, on its way to an installation near Remington, INphoto courtesy of CSX Transportation
FOR MORE INFORMATION, PLEASE CONTACT: [email protected]
AMERICAN WIND ENERGY ASSOCIATIONWWW.AWEA.ORG | 202.383.2500 | 1501 M ST. NW, SuITE 1000, WASHINGTON, D.C.
WIND ENERGY FACTS: INDIANA

Growing the Midwest’s Green EconomyThe boom in clean energy development, especially wind power,
presents a tremendous opportunity for economic growth in the Midwest. This boom would create additional construction jobs, long-term operations and maintenance positions, and a positive indirect economic impact due to payroll spending, property tax revenue and land leases. Some of the best long-term economic opportunities will come directly from the manufacturing of wind turbine components.
As the wind industry continues to grow in the U.S., more wind turbine suppliers are creating jobs here. There are positive economic benefits to the region, and manufacturers also benefit through simplified construction logistics.
Modern wind turbines are enormous high-technology machines with towers close to 300 feet high, blades more than 200 feet long and rotors weighing as much as 100 tons. Manufacturing turbines in proximity to wind farms will be an important consideration because their size makes shipping them very expensive. With the help of more stable and supportive state and federal policies, more wind turbine suppliers are creating jobs in the places where wind energy development is taking place, especially the Midwest. This not only lowers costs but taps into the Midwest’s tremendous manufacturing capabilities and skilled labor pool.
More importantly, existing Midwestern manufacturers that have supplied the automotive, machinery and electrical industries are generating new revenue and creating or retaining thousands more jobs by supplying the wind industry. Below is a sampling of companies across the Midwest that are participating in the wind industry supply chain:
Gears:• Brad Foote Gear Works, Cicero, Illinois, 400 employees• Winergy, Elgin, Illinois, 350 employees• Merit Gear Corporation, Antigo,
Wisconsin, 150 employees
Bearings:• Timken, Cleveland, Ohio, 25,000 employees
Structural Towers:• Tower Tech, Manitowoc, Wisconsin, 250 employees• Trinity Industries, Clinton, Illinois,
150 employees• DMI Industries, West Fargo, North Dakota
Turbine Assembly:• Acciona, West Branch, Iowa 140 employees• Clipper Windpower, Cedar Rapids, Iowa 100 employees
Blade Production:• LM Glasfiber, Grand Forks, North Dakota,
800 employees• Suzlon, Pipestone, Minnesota• Siemens, Fort Madison, Iowa, 250 employees• TPI Composites, Newton, Iowa, 500 employees• MFS Composites, Aberdeen, South Dakota, 750 employees (anticipated by 2009)

Bringing More Wind Jobs to the Midwest
The United States’ rapidly growing wind industry is poised for an even greater expansion in coming years. Renewable energy standards in more than 20 states ensure that utilities will purchase wind power for their customers. Wind turbines will continue to become bigger and more complex, making manufacturing in the Midwest even more important.
Attracting these manufacturers to states in the Midwest will take more than the right tax and economic development incentives. It will also take a political and business culture that is supportive of renewable energy development within the region, one that demonstrates that growing the green economy is a priority. Finally, Midwest states need to play a matchmaking role to link wind turbine suppliers with local businesses that can supply them.
How Can The Midwest Grow Its Wind Energy Supply Chain Activity?
Economic development organizations in several Midwest states (Michigan, Ohio, Iowa) have worked hard to both attract manufacturers and to bring turbine assembly companies and component suppliers together. The opportunities will only continue to grow.
While many companies are building their own relationships, state chambers of commerce and business organizations can play more active roles in opening doors to turbine manufacturers and educating component suppliers on opportunities in the wind energy industry.
www.elpc.org

Wind power is one of the fastest-growing forms of new power generation in the United States. Industry growth in 2007 was an astounding 45%. New wind
power installations constituted 35% of all new electric power installations. This growth is the result of many drivers, includ-ing increased economic competitiveness and favorable state policies such as Renewable Portfolio Standards. However, new wind power installations provide more than cost-competitive electricity. Wind power brings economic development to rural regions, reduces greenhouse gas production by displacing fossil fuels, and reduces water consumption in the electric power sector.
The U.S. Department of Energy’s Wind Powering America Program is committed to educating state-level policymakers and other stakeholders about the economic, CO2 emissions, and water conservation impacts of wind power. This analysis highlights the expected impacts of 1000 MW of wind power in Indiana. Although construction and operation of 1000 MW of wind power is a significant effort, six states have already reached the 1000-MW mark. We forecast the cumulative
economic benefits from 1000 MW of development in Indiana to be $1.3 billion, annual CO2 reductions are estimated at 3.1 million tons, and annual water savings are 1,684 million gallons.
Economic BenefitsBuilding and operating 1000 MW of wind power requires a significant investment. But this investment will generate substantial direct, indirect, and induced economic benefits for Indiana. Direct benefits include jobs, land lease payments, and increased tax revenues. Indirect benefits include benefits to businesses that support the wind farm. Induced benefits result from additional spending on goods and services in the area surrounding the development.
Direct impacts result from investment in the planning, devel-opment, and operation of new wind facilities. Beneficiaries include landowners, construction workers, O&M staff, turbine manufacturers, and project managers. Indirect impacts reflect payments made to businesses that support the wind facility
and include banks financing the project, component suppliers, and manufacturers of equipment used to install and maintain the facility. Induced benefits result from increased spending by direct and indirect beneficiaries. Examples include increased business to restaurants, retail establishments, and child care providers.
Drivers of economic benefits include the use of local construc-tion companies, the presence of in-state component suppliers, local wage structures, local prop-erty tax structures, and operation and maintenance (O&M) expendi-tures. The projected benefits for Indiana could be greatly increased by developing a local wind sup-ply, installation, and maintenance industry within the state.
Economic Benefits, Carbon Dioxide (CO2) Emissions Reductions, and Water Conservation Benefits from 1,000 Megawatts (MW) of New Wind Power in Indiana
Wind Energy’s Economic “Ripple Effect”
Indiana Economic Impacts from 1,000 MW of New WInd Development
Totals(construction + 20 years)
Total Economic Benefit: $1.3 billionNew Local Jobs During Construction: 3,030New Local Long-term Jobs: 525
Indirect and Induced Impacts
Construction Phase:
Operational Phase:
Direct Impacts
Payments to Landowners:
Local Property Tax Revenue:
Construction Phase:
Operational Phase:
Construction Phase = 1-2 yearsOperational Phase = 20+ years
Indiana

A Strong Energy Portfolio for a Strong America Energy efficiency and clean, renewable energy will mean a stronger economy, a cleaner environment, and greater energy independence for America. Working with a wide array of state, community, industry, and university partners, the U.S. Department of Energy’s Office of Energy Efficiency and Renewable Energy invests in a diverse portfolio of energy technologies.
For more information contact: EERE Information Center 1-877-EERE-INF (1-877-337-3463) www.eere.energy.gov
Produced for the U.S. Department of Energy by the National Renewable Energy Laboratory, a DOE national laboratory
Printed with a renewable-source ink on paper containing at least 50% wastepaper, including 20% postconsumer waste
MethodologyThe data for economic analysis are primarily from interviews with state-specific contacts, including developers, power plant operators, contractors, mining and gas associations, and state property tax assessors or administrators. When interviews were not possible, information was obtained from public Web resources, state tax reports, and federal databases for current power plants. Cumulative impacts are estimated for
construction and 20 years of operations. Economic impacts are 2007 constant dollars and estimated by application of the National Renewable Energy Laboratory’s (NREL’s) Jobs and Economic Development Impacts (JEDI) model. Carbon esti-mates apply 2004 non-baseload CO2 emissions rates (EPA eGRID2006 Version 2.1, April 2007). Water savings are calcu-lated based on consumption rates for various generating technologies. Consumption rates were compiled by Western Resource Advocates and calculated from EIA form 767 data and EPRI publications. Consumption rates are applied to the NERC region generation mix as determined from EIA form 960/920 (2006).
CO2 Emissions Reduction and Water Conservation Benefits
In 2004, the average Indiana resident emitted approximately 21.5 tons of CO2 as a result of electricity consumption. As a state, Indiana ranked 6th in electricity sector per capita CO2 emissions. CO2 emissions are increasingly important factors as state and federal governments consider policies regarding climate change while drought in the Southeast has under-scored the relevance of freshwater supply issues outside of the arid and semi-arid regions of the United States.
Developing wind power in Indiana will result in CO2 emis-sions reduction and water savings. Choosing to build wind projects results in CO2 reductions from fewer new coal plants built and less natural gas consumption. In addition, both fossil- and nuclear-based electricity generation consume large amounts of water. Wind power reduces our reliance on increasingly vital freshwater resources.
For more information, contact:Eric Lantz, [email protected] Suzanne Tegen, [email protected] Wind Powering America National Renewable Energy Laboratory 1617 Cole Blvd. MS3811 Golden, CO 80401
May 2008 • DOE/GO-102008-2562
Distribution of Wind Resources in Indiana
Assumptions
Construction Cost $1,650/kW
Operations and Maintenance $24.70/kW
Property Tax $15,790/MW
Landowner Lease Payments $2,667/MW/year
Annual Impacts in Indiana from 1000 MW of New Wind Power
Water Savings CO2 Savings
1,684 million gallons 3.1 million tons

Who Builds Those Windmills?The windmill has become a symbol of Indiana’s move into the clean energy future. Many Hoosiers have gazed in awe at the
expansive wind farms off of I-65 just north of Lafayette. But how much do we really know about wind energy in Indiana?
In the last several decades, wind energy has come a long way from the heavily subsidized Carter-era energy projects that
eventually fizzled. Recently, thanks to technological developments making turbines more efficient, wind energy has taken off in
the United States. Installed capacity for wind energy in the U.S. has increased at an average rate of 22 percent over the past five
years.
The Midwest has experienced similar growth in wind energy capacity. Iowa and Minnesota have led the expansion in the Midwest
over the last five years, complemented more recently by Indiana (see Figure 1). As Figure 2 shows, Iowa and Minnesota are two
of the top five wind-producing states across the nation as a whole due largely to their favorable wind conditions.
Figure 1: Installed Capacity for Select Midwest States, 2004-2009
Source: U.S. Department of Energy
Figure 2: Wind Energy Production: Five Largest States and Indiana, 2004-2009

Source: U.S. Department of Energy
The U.S. has put up some impressive growth numbers, but it has a long way to go to equal the wind energy produced in the
European Union (EU). As Figure 3 shows, U.S. installed capacity is about half that of the EU. The EU derives about 3.5 percent of
its energy from wind, compared to the U.S. at less than 1.5 percent. Considering that wind power is such a small share of
electricity generation, the U.S. Department of Energy’s goal to produce 20 percent of all America’s electricity from renewable
sources by 2030 is a daunting target. With that said, the U.S. wind energy sector is expanding rapidly, and Indiana and the greater
Midwest not only stand to gain from wind as a source of energy, but also from windmill manufacturing as a source of economic
growth.
Figure 3: Power Generation from Wind, 2001-2010
Source: Global Wind Energy Council
Indiana Wind FarmsIndiana is currently home to four industrial wind farms in Benton and White counties. Three are entirely European owned, while
the Fowler Ridge wind farm is a joint venture between a West Virginian company and BP (see Table 1).
Table 1: Indiana's Wind Farms, November 2010
Wind FarmPower Generating
Capacity (Megawatts)Number of Wind
Turbines Owner
Fowler Ridge 600 355 BP Alternative Energy (U.K.) and Dominion (West Virginia)
Hoosier Wind Project 106 53 Électricité de France
Meadow Lake Wind I,II & III 501.2 303 Energías de Portugal
Goodland Wind Plant I 131 87 BP Alternative Energy (U.K.)
Source: Indiana Office of Energy Development
The Department of Energy estimates that the construction of Indiana’s wind farms employed around 2,000 people. Once
operational, however, the employment figure declines to about 85 maintenance and repair workers.1 Wind power generation is
not going to create many jobs in the long term. However, wind turbine manufacturing does offer great potential for employment
growth.
Turbine ManufacturingWind turbines consist of five components: the blades, the tower, the gearbox, the generator and the nacelle (which is the housing
that surrounds the generator, gearbox and other electronic systems).
The blades and the towers do not travel well due to their size, and bridge clearances limit transportation options. As a result, blade
and tower manufacturers prioritize the proximity of intended wind farms on the availability of transportation links when locating
a plant.2 However, occasionally the larger components will be imported. For example, 75 wind turbine blades (at lengths of nearly
54 yards a piece) were recently imported from Denmark via the Port of Indiana at Burns Harbor for Horizon Wind’s new Timber

Road wind farm in Payne, Ohio.3
Manufacturing other windmill components also offers potential for economic growth and job creation in the Midwest if the
predominantly European manufacturers shift production from Europe and Asia. There is already evidence that this is occurring:
the past six years have seen European wind energy firms announce a total of $1.7 billion of foreign direct investment in the United
States. The largest investor is Vestas Wind Systems, committing to spend over $1.3 billion, or more than 80 percent of total wind
investment from European firms. Investments have primarily been in manufacturing (see Table 2).
Table 2: Manufacturing Investments over $50 Million by European Wind Energy Firms in the United States,2004-2010
Company Total Investment Total JobsOrigin
Country Destination Year Announced
Vestas Wind Systems $498,600,000 1,600 Denmark Colorado 2010
Vestas Wind Systems $240,000,000 550 Denmark Colorado 2008
Siemens $200,000,000 300 Germany North Carolina 2004
Vestas Wind Systems $180,000,000 650 Denmark Colorado 2008
Vestas Wind Systems $111,700,000 255 Denmark Colorado 2008
Nordex $100,000,000 700 Germany Arkansas 2008
Vestas Wind Systems $72,700,000 240 Denmark Colorado 2010
Vestas Wind Systems $61,500,000 400 Denmark Colorado 2007
Source: FDI Markets
Many smaller windmill components are manufactured within the European Union and then exported to the United States.
Brevini—one the largest manufacturers of speed changers, drivers and gears, all of which are regularly used in the construction of
windmills—is bucking this trend with their investment in Indiana. In 2008, Brevini, an Italian company with U.S. operations
headquartered in Indiana, announced that it intended to invest $86 million at its existing site just outside of Muncie. The
construction funded by this investment is still ongoing and is expected to produce over 400 jobs when complete.
Researchers at Illinois State University have identified a variety of industries that contribute to wind turbine manufacturing,
including machine shops, rolled steel manufacturers and electronics manufacturers. The Midwest, and Indiana in particular, has a
particularly high concentration of iron and steel mills and other engine manufacturing firms, both of which are vital to the
production of wind turbines. Figure 4 demonstrates that there are high concentrations of employment in ductile iron castings
and gearing and bearing manufacturing compared to the national average. (In this figure, a score of one represents an equal
concentration to the national average.) As Figure 4 indicates, the concentration of employment in iron and steel mills, as well as
other engine manufacturers, in Indiana is more than 10 times the U.S. concentration. If recent trends continue and the U.S. makes
progress toward the goal of deriving 20 percent of its power from renewable energy by 2030, the demand for wind turbines and
the workers who build them is sure to increase in the next two decades.
Figure 4: Location Quotients for Select Indiana Manufacturing Industries, 2010

Source: Bureau of Labor Statistics
There is also an opportunity for homegrown wind energy start-ups to enter this market. Firms like Vela Gear Systems, located in
Carmel, Ind., or Renewegy in Oshkosh, Wis., have both successfully established themselves as manufacturers of components
specific to the wind power industry. Vela is expecting rapid expansion over the next three years and, thanks in large part to tax
credits from the Department of Energy, may grow from one full-time and six part-time employees to more than 160 by 2014.
These new firms are not in direct competition with the European manufacturers and instead tend to focus on installations for
individual firms or smaller scale wind generation. Nevertheless, start-ups in the Midwest are emerging and finding their niche in
this expanding sector.
Wind Turbine OccupationsThe wind turbine industries that are relatively concentrated in Indiana employ a variety of production occupations. The iron and
steel milling industry, for example, employs many assemblers and fabricators as well as installation, maintenance and repair
workers. The turbine and power transmission and other engine manufacturing industries hire assemblers, fabricators, metal and
plastic workers in addition to mechanical and electrical engineers, engineering technicians, and drafters. Based on just the top
three industries that both supply windmill components and in which Indiana (and the Midwest) have relative strengths, it appears
that the industries supplying windmill components hire across a wide range of educational and skill requirements.
ConclusionWind generates just a sliver of the power consumed by Americans, but it is expected to grow rapidly over the next 20 years. The
EU is the world leader in wind energy, boasting some of the world’s largest wind power companies, including Siemens, Nordex
and Vestas. Midwestern firms entering the windmill or component market will face stiff competition from these companies.
Nevertheless, as these EU firms seek to improve the proximity of their operations to the point of installation, Midwestern firms
will likely see growing opportunities to carve out their slice of America’s wind power industry.
Notes
National Renewable Energy Laboratory, NREL's Wind Powering America Team Helps Indiana Develop Wind Resources(Golde, CO: NREL, 2010).
1.
Andrew S. David, Wind Turbines Industry and Trade Summary (Washington D.C.: United States International TradeCommission, 2009).
2.
Diane Krieger Spivak, "First Ship en Route to Burns Harbor Port with 75 Wind Turbine Blades, "Post-Tribune,www.indianaeconomicdigest.net/main.asp?SectionID=31&SubSectionID=306&ArticleID=59106.
3.
By Indiana Business Research Center Analysts
Indiana University Kelley School of Business