wildlife surveys chapter 5: pitfall results with specific
TRANSCRIPT

1
RSPB/NE Countdown 2010: Bringing Reedbeds to Life Project
Wildlife surveys
CHAPTER 5: Pitfall results with specific reference to the Coleoptera
C J Hardman, D B Harris
With helpful comments on draft by Alan Stubbs (Buglife)
Contents
SUMMARY ............................................................................................................................................... 1
METHODS ................................................................................................................................................ 2
Pitfall survey field methods .................................................................................................................... 2
Analysis methods .................................................................................................................................... 4
RESULTS .................................................................................................................................................. 6
Composition of species caught ............................................................................................................... 6
Habitat associations with overall species diversity................................................................................. 7
Habitat associations with wetland specialists in pitfall traps ............................................................... 12
Habitat associations with pitfall conservation scores ........................................................................... 15
Habitat associations with Coleoptera species diversity in pitfall traps ................................................ 18
Habitat associations with wetland specialist Coleoptera species in pitfall traps ................................. 23
Habitat associations with Coleoptera conservation scores in pitfall traps ........................................... 26
Composite habitat variables ................................................................................................................. 29
References ............................................................................................................................................ 31
Appendix to invertebrate results .......................................................................................................... 31
SUMMARY
Species diversity
• 24 pitfall were set at Stodmarsh, 22 at Hickling Broad and 12 at Ham Wall, all points were dry during surveys (August).
• At least 7 421 individual invertebrates were trapped in total: 41 % Coleoptera (beetles), 37% Araneae (spiders), 12% Hymenoptera (bees, ants, sawflies and wasps), 5% Stylommatophora (snails and slugs) and more.
• 288 species were identified including 26 Rare or Nationally Scarce.
• One Endangered rove beetle: Quedius balticus, a Vulnerable spider: Clubiona juvenis and a Data Deficient rove beetle Philhygra terminalis were trapped.
• 132 wetland specialists and 4 reedbed specialists were trapped. There was not enough variation in number of reedbed specialists per trap for analysis.

2
Relationship to habitat variables
Overall diversity in pitfall traps (measured by bootstrapped species richness) tended to be higher in traps that were surrounded by a greater diversity of plants.
Greater numbers of wetland specialists (both across all species and for Coleoptera alone) were trapped at points surrounded by taller, thicker and denser reed.
Relationships between conservation score across all species and habitat variables did not produce clear results. When conservation scores were calculated just for Coleoptera, trends became evident at Stodmarsh but not at the other sites. Traps with higher conservation scores at Stodmarsh tended to be surrounded by thicker and taller reed stems, and were closer to scrub.
Number of Coleoptera species per trap was higher at Stodmarsh than the other two sites. Site dominated the analysis and trends. However at Stodmarsh alone, points with taller, thicker reed stems, lower plant species richness and shallower litter tended to trap more Coleoptera species. Only three traps had litter that had been fully saturated in the months before surveys, but these points trapped a similar average number of Coleoptera species to dry points.
Since pitfall traps had to be placed in dry areas during the survey month of August, 29 of the points had a dry seasonal litter saturation category (May to August) and only 3 had litter that was totally flooded in this period. 11 had partially flooded litter in the months before surveys, but these were all at Hickling Broad. Seasonal water level information for this time period was not available for 9 of the points. Therefore overall conclusions about the relationship between ground-dwelling invertebrates and reedbed hydrology are limited.
Trends derived from algorithmic modelling were compared to trends from principle components analysis and similar trends were seen. Sampling points that caught reedbed specialist invertebrates did not cluster together based on their environmental attributes.
Pitfall results were more limited in their interpretation than water trap/moth results. Pitfall traps caught a more varied assemblage of invertebrates in terms of the number of orders of invertebrates within samples. There were fewer reedbed specialists than in water traps or moth traps so the analysis is very coarse scale, looking at a wide variety of generalist species. Attempts to narrow the analysis to wetland specialists, Coleoptera or species with a conservation status created clearer trends. Future work should focus on what representation of reed ecologies are needed to embrace all the scarce and special species in viable populations may not be possible for species with too few specimens to give a sound answer. The results were limited by only a few sites being surveyed, the sites having large differences in habitat variables and geography, and the range of habitat variables within each site being a narrow section of the entire spectrum within reedbeds (dry points sampled predominantly). However the result about wetland Coleoptera being associated with taller, thicker denser reed seems one of the firmest conclusions.
METHODS
Pitfall survey field methods
Pitfall traps were set at 24 locations at Stodmarsh, 22 locations at Hickling Broad and 12 locations at Ham Wall. At Hickling Broad, pitfalls were set between 13-14th August 2009 and 29-30 August 2009. At Ham Wall, pitfalls were put out on 11th August 2009 and collected on 27th August 2009. At

3
Stodmarsh, pitfalls were put out on 8-9th August 2009 and collected on 24-25 August 2009. Each trap was left out for 16 days.
The trap points were randomly located within reedbed, at a minimum of 50m separation for sample independence, so as not to interfere with each others' catches (Telfer, M pers. comm.). Sample sizes were constrained by the availability of dry reedbed, which explains the lower sample size at Ham Wall where less dry reedbed was available. However, where possible we tried to distribute the pitfall trapping points between reedbed that was dry all year or periodically dry (and obviously dry at the time of trapping). The aim, as with the water trap survey plan, was to obtain a representative sample for analysis of seasonal water levels rather than a comparison between hydrological categories per se. Again, the points that were perceived as dry all year or periodically dry were based on available information at the time, from our water trapping work and from annual hydrology information from site managers, but more detailed water level information was collected during the survey.
The original stratification was:
Stodmarsh: 12 pitfalls in seasonally dry reedbed and 12 in permanently dry reedbed
Hickling Broad: 10 fringing broad and 10 on reserve reedbed (all seasonally dry reedbed)
Ham Wall: 6 traps in seasonally dry reedbed, 6 in adjacent dry, recently cut reed stubble
Pitfall trap locations were not randomly assigned but positioned according to our knowledge of water level fluctuations and accessibility. Disturbance to nesting birds was always a concern and we worked closely with site managers to avoid sensitive areas. If the mapped point fell close to a habitat feature which may bias the sample, the point was relocated by at least 6m to the south side of any tree/scrub or away from a pond/ditch. All pitfall trap points were placed at least 10m from edge habitat, paths, or open water. These measures should have limited the bias from specialist communities or edge effects. All pitfall trap points were also placed a minimum distance of 15m from previous access routes and survey locations to eliminate any bias caused by open, disturbed micro-habitat.
The traps were 400ml plastic flip top containers (Alana Ecology) that were dug in to the ground ensuring that the soil is compact and flush to the rim. The containers were 1/3 full with propylene glycol solution (50%), an antifreeze solution that is non-toxic to vertebrates and acts as a preservative until the traps were collected. A couple of drops of washing up liquid were added to reduce surface tension so that invertebrates didn’t float or escape. We added a plastic garden mesh cover and pinned it down with wire pegs to prevent larger creatures falling in and drowning. Unfortunately this still happened on several occasions (frogs, shrews and a harvest mouse were found).
Figure 5.1: Pitfall trap in situ (Anna Doeser)
On approaching the trap to collect the contents, the surveyor noted the presence of any vegetation protruding into the pitfall trap that may have aided escape of trapped invertebrates. The liquid level was also checked and non-target species capture was recorded. Samples were washed through filter mesh and stored in 60% Industrial Methylated Spirits. Surveys were designed by Donna Harris and carried out by Donna Harris and Anna Doeser.

4
Sorting specimens to Order level was done by Donna Harris and John Baxter in autumn 2009. Any non-invertebrate material was removed. The remainder of the sample consisted mainly of Coleoptera (beetles) but also Hemiptera (true bugs). Coleoptera were stored in 60% IMS solution and others were stored in 70% IMS solution. Coleoptera were identified by Mark Telfer, who discarded larvae. Ian Dawson identified spiders. Aculeate hymenoptera (bees, wasps and ants) were identified by Mike Edwards and Symphata (sawflies) by David Sheppard. Parasitic Hymenoptera were identified where possible by Gavin Broad. Diptera were not identified as the water trap survey was thought sufficient for this group.
Habitat surveys
During pitfall trap set-up two 50 x 50 cm reed quadrats 2m north and 2m south from the pitfall were surveyed. In each quadrat, dead and live reed stems and stems with panicles were counted, four reed stem base diameters and reed height (dead and live) were measured using the same method as in water trap habitat surveys. 16 days later during trap collection, plant surveys were carried out. Eight 50 x 50cm quadrats at N, NE, E, SE, S, SW, W, NW, directions at 2m from the pitfall trap were surveyed and all plants within the quadrat recorded. Litter depth (surface to silt/root layer) was measured at 1m from the pitfall en route to every other plant quadrat (N, E, S, W).
Analysis methods
Invertebrate species data
Analysis methods were as described in water trap samples. The response variables available were number of species, bootstrapped number of species, wetland specialists, conservation scores, number of Coleoptera species, number of wetland Coleoptera species, Coleoptera conservation scores. Number of species was bootstrapped to 26 individuals, based on minimum sample sizes for pitfall traps. When Coleoptera and wetland specialists were analysed alone, these subsets were not bootstrapped due to sample sizes being too small. There were not enough reedbed specialists caught per trap to analyse as a response variable. Only 9 traps contained reedbed specialists and the number of reedbed specialists per trap varied between 0 and 2.
For wetland specialists, lists created from experts were used for consistency of methodology but it should be noted that unlike Diptera and Lepidoptera, the lists created from ISIS matched expert lists well for pitfall samples. 129 species trapped in pitfall samples were listed on ISIS under BAT categories W2 and W3. The lists provided by experts had 132 wetland specialists, 114 of which were also on the ISIS list. The habitat association results not changing depending on which list was used. The wetland specialist list from experts was composed of 81 % Coleoptera 11 % Araneae plus small numbers of Basommatophora, Hemiptera, Stylommatophora, Isopoda and Orthoptera species.
As for water trap analysis, a conservation score for each trap was calculated using:
Score of 10 for: Vulnerable, RDB2 (similar to vulnerable), RDB3 (similar to near threatened), RDB1 (similar to endangered), Rare
Score of 5 for: UK BAP, Scarce, Notable, Data deficient
Each species score was only counted once per trap. For pitfall traps, species contributing to conservation scores were predominantly Coleoptera (24 species) and Araneae (5 species).

5
Habitat data
From the habitat variables recorded in the field, the following set of explanatory variables was derived. Averages were calculated for habitat variables that were measured at more than one point around the sampling location.
Table 5.1: Explanatory variables used in models relating habitat variables to invertebrate species diversity in pitfall traps
Water level data
Pitfall traps had to be placed in dry areas, so information on the wetness of sampling points is limited. A litter saturation variable was created using water levels measured between May and August 2009 as these had the maximum amount of data available. Litter levels measured in October 2009 (as these correspond to zero AOD) were compared to the water level predictions.
Variable Type Description
Litter saturation Explanatory categorical 3 categories; dry, partial and wet
Dry if predicted water level (May to Aug 2009) never exceeds zero. Partial if predicted water level greater than zero but less than litter depth. Wet if predicted water level above litter depth.
Litter depth Explanatory continuous Average of 4 litter depth measurements in 1 m radius of trap point.
Total stem density Explanatory continuous Average of 4 counts of number of stems in 50 x 50 cm quadrat, 1 m away from trap point.
Dead stems percentage Explanatory continuous percentage
Percentage of total stems that were dead
Mean reed height Explanatory continuous Mean height of live and dead reed, average of 4 measures in 1m radius of trap point.
Stem diameter Explanatory continuous Stem diameter at base, average of 4 measures in 1m radius of trap point.
Distance to scrub Explanatory continuous Distance to nearest patch of scrub/trees calculated from aerial photos by CDMU using an add-on tool in MapInfo 6.5
Plant species richness Explanatory continuous Total number of plants (excluding Phragmites australis) found over four 50 x50 cm quadrats in 1 m radius of trap point.

6
Since dry points were chosen for sampling, there was little variation in litter saturation in this seasonal period. Hickling Broad had 1 wet, 10 dry and 11 partially saturated and points, Ham Wall points were all dry, and Stodmarsh had 2 wet points and the remainder dry. At Stodmarsh, lack of gauge board reading between May and August 2009 meant no litter saturation category was available for 9 points. Therefore when interpreting the results we must note that the sampling points were biased towards dry areas. Therefore the habitat surveyed around pitfall traps represents a narrow spectrum within the overall environmental gradients in reedbeds (diameters were thinner and heights shorter than average reedbed points in audit data). Six of the points at Ham Wall were in reed stubble so were not considered comparable enough to others for analysis.
RESULTS
Notable records from pitfall traps
Some notable Coleoptera records were obtained. In the pitfall traps at Hickling Broad, Boreophila eremite was a new record for Norfolk and the finding of Baeocrara variolosa made the fourth modern record of (the previous three of which were from Hickling).
Further information on some of the invertebrates with conservation statuses in pitfall traps
Quedius balticus (Staphylinidae) Order: Coleoptera
This rove beetle is endangered, classed as a reedbed specialist on the ISIS database and included on the Buglife list of notable species associated with fen habitats. In the analysis of the Broads Fen Invertebrate Survey 2007-09, Quedius balticus was noted as a species of conservation interest that could be affected by changes in site management. It was recorded once at each of ten pitfall points at Hickling Broad, both in the reed fringing the broad and in Hundred Acre reedbed (for grid references and coordinates see appendix).
Eight out of ten points where Quedius balticus was trapped had litter that was predicted to be dry in the four months before trapping (HBPDD6 was partially saturated and HPPDD8 was wet). Points where Quedius balticus was found had slightly higher density of live stems, slightly deeper litter and were slightly closer to scrub than the average of all sampling points at Hickling Broad. This was not tested statistically due to the uneven sample size between points with and without Quedius balticus.
Paradromius longiceps (Carabidae) Order: Coleoptera
This nationally scarce Carabid ground beetle is a reedbed specialist. One individual was recorded from dry reedbed at Hickling Broad where it was trapped at pitfall trap HBPDD3.
Composition of species caught
There were 7 421 individuals caught in pitfall traps, 41% of which were Coleoptera (beetles), 37% of which were Araneae (spiders and harvestmen), 12% of which were Hymenoptera (wasps and bees), 5 % of which were Stylommatophora (air-breathing snails and slugs) and the remaining 5 % of which were Basommatophora (air-breathing snails and slugs), Diptera (true flies), Hemiptera (true bugs), Isopoda ( e.g woodlice) and Orthoptera (grasshoppers, crickets and locusts). Note there were more Diptera than this but pitfall Diptera samples were not identified. A total of 289 species were caught in pitfall traps over the three sites. At least 7 421 individual invertebrates trapped in total: 41 % Coleoptera (beetles), 37% Araneae (spiders), 12% Hymenoptera (bees, ants, sawflies, wasps), 5% Stylommatophora (snails and slugs) and more. 26 Rare or Nationally Scarce species were recorded and several red listed species (one Endangered rove beetle: Quedius balticus, a Vulnerable spider:
7
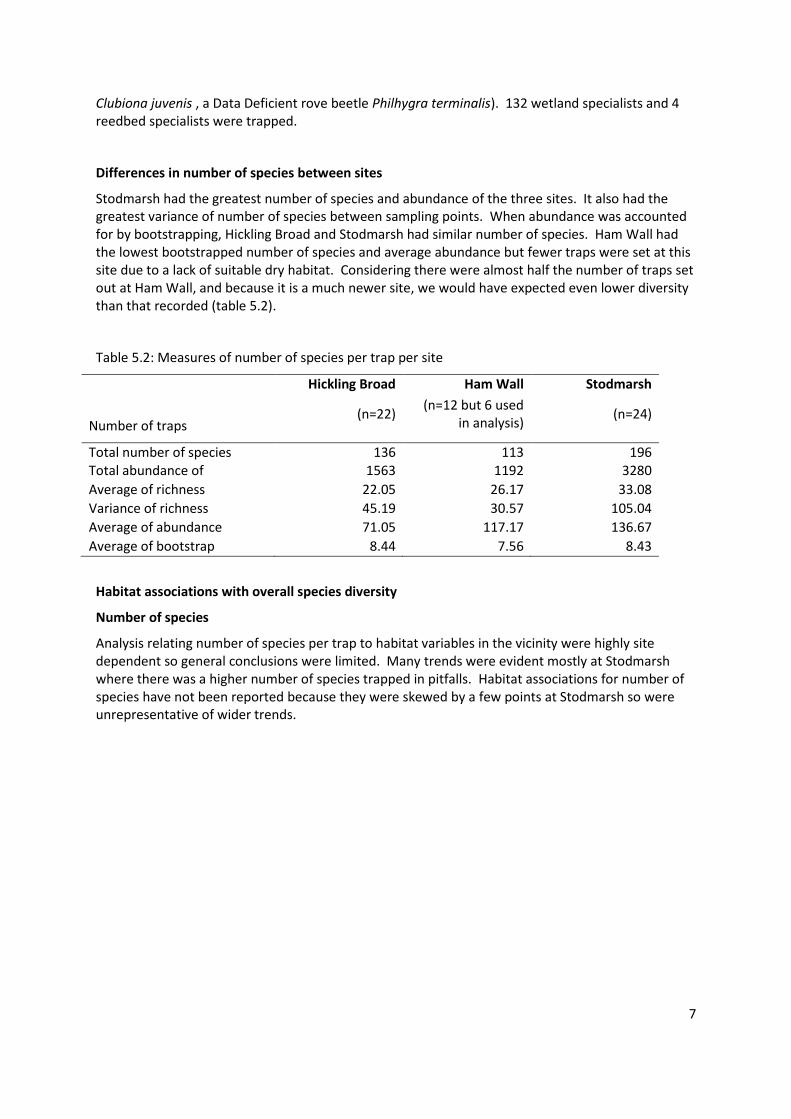
Clubiona juvenis , a Data Deficient rove beetle Philhygra terminalis). 132 wetland specialists and 4 reedbed specialists were trapped.
Differences in number of species between sites
Stodmarsh had the greatest number of species and abundance of the three sites. It also had the greatest variance of number of species between sampling points. When abundance was accounted for by bootstrapping, Hickling Broad and Stodmarsh had similar number of species. Ham Wall had the lowest bootstrapped number of species and average abundance but fewer traps were set at this site due to a lack of suitable dry habitat. Considering there were almost half the number of traps set out at Ham Wall, and because it is a much newer site, we would have expected even lower diversity than that recorded (table 5.2).
Table 5.2: Measures of number of species per trap per site
Hickling Broad Ham Wall Stodmarsh
Number of traps (n=22)
(n=12 but 6 used in analysis)
(n=24)
Total number of species 136 113 196 Total abundance of individuals
1563 1192 3280
Average of richness 22.05 26.17 33.08
Variance of richness 45.19 30.57 105.04
Average of abundance 71.05 117.17 136.67
Average of bootstrap 8.44 7.56 8.43
Habitat associations with overall species diversity
Number of species
Analysis relating number of species per trap to habitat variables in the vicinity were highly site dependent so general conclusions were limited. Many trends were evident mostly at Stodmarsh where there was a higher number of species trapped in pitfalls. Habitat associations for number of species have not been reported because they were skewed by a few points at Stodmarsh so were unrepresentative of wider trends.

8
Figure 5.2: Relative importance of habitat variables in explaining variation in number of species in pitfall traps. These models explained 90 % of the variance.
Site
Stodmarsh trapped a higher number of species per trap on average than the other two sites.
Figure 5.3: Relationship between number of species per pitfall trap and site
Bootstrapped number of species
When number of species was bootstrapped to a set number of individuals per trap, the following relationships with habitat variables emerged.
-2
0
2
4
6
8
10
12
14
Var
iab
le im
po
rtan
ce (
%In
cMSE
)
Habitat variables
Pitfall trap number of species

9
Figure 5.4: Variable importance for bootstrapped number of species in pitfall traps. These models explained 90 % of the variance.
Plant species richness
Points with a greater number of plants were associated with greater bootstrapped number of species. Plant species richness was important at Hickling Broad but not at Stodmarsh, where many points did not have any other plant species present except reed. There were not enough traps set at Ham Wall to test if it was important at this site alone.
Figure 5.5: Relationship between plant richness and bootstrapped number of species
-3
-2
-1
0
1
2
3
4
5
6
Var
iab
le im
po
rtan
ce (
%In
cMSE
)
Habitat variables
Pitfall bootstrapped number of species
0 2 4 6 8 10 12
7.9
8.0
8.1
8.2
8.3
8.4
8.5
Partial Plot
Plant richness
0 2 4 6 8 10 12
56
78
91
01
1
Actual data
Plant richness
Bo
ots
tra
pp
ed
no
. o
f sp
p
0 10 20 30 40
45
67
89
10
11
standing.water.summer.2010
Ere
ed
be
d
HW
HB
SM

10
Stem density
The model showed stem densities below 250 stems per m2 to be associated with higher species diversity in pitfall traps. However general conclusions should not be drawn because the relationship was not clear cut and will be a result of many different relationships with different taxonomic groups.
Figure 5.6: Relationship between stem density and bootstrapped number of species in pitfall traps.
Mean reed height
The model showed a mid-range of reed heights to be associated with high diversity in pitfall traps.
The trend is not clear, and this is probably due to both the coarse scale of the species data (including many taxonomic groups) and the variation in reed height between sites.
Figure 5.7: Relationship between mean reed height and bootstrapped number of species
100 200 300 400 500
7.9
8.0
8.1
8.2
8.3
8.4
8.5
Partial Plot
Stems per square metre
100 200 300 400 500
56
78
91
01
1
Actual data
Stems per square metre
Bo
ots
tra
pp
ed
no
. o
f sp
ecie
s
1.0 1.5 2.0 2.5
7.9
8.0
8.1
8.2
8.3
Partial Plot
Mean reed height
1.0 1.5 2.0 2.5
56
78
91
01
1
Actual data
Mean reed height
Bo
ots
tra
pp
ed
no
. sp
p.
0 10 20 30 40
45
67
89
10
11
standing.water.summer.2010
Ere
ed
be
d
HW
HB
SM
0 10 20 30 40
45
67
89
10
11
standing.water.summer.2010
Ere
ed
be
d
HW
HB
SM

11
Dead stems percent
The model showed points with a lower proportion of dead stems were related to a higher bootstrapped number of species. However, this includes trends with a whole range of species ecologies, both phytophagous on live reed and saprophagous. Perhaps this trend reflects a greater number of invertebrates being trapped that are dependent on live reed. Further work into the ecologies of the individual species would be needed to investigate this trend in more detail.
Figure 5.8: Relationship between dead stems (%) and bootstrapped number of species in pitfall traps
Site
The model showed there were not large differences between bootstrapped number of species per pitfall traps at the different sites. The raw data showed Ham Wall had lower species diversity per trap than the other two sites; this is likely to be affected by the smaller sample size at Ham Wall.
5.9: Relationship between site and bootstrapped number of species in pitfall traps.
0.0 0.1 0.2 0.3 0.4 0.5 0.6 0.7
7.8
8.0
8.2
8.4
8.6
Partial Plot
Dead stems %
0.0 0.1 0.2 0.3 0.4 0.5 0.6 0.7
56
78
91
01
1
Actual data
Dead stems %
Bo
ots
tra
pp
ed
no
. o
f sp
p
0 10 20 30 40
45
67
89
10
11
standing.water.summer.2010
Ere
ed
be
d
HW
HB
SM

12
Litter depth
The very shallowest litter depths were associated with lower diversity of invertebrates in pitfall traps. This may be because litter above a certain depth provides an advantage of shelter (from weather, poor light resting places or perhaps avian predation). At Hickling Broad, points with deeper litter were associated with a greater diversity of species in pitfall traps.
Figure 5.10: Relationship between bootstrapped number of species and litter depth in pitfall traps
Habitat associations with wetland specialists in pitfall traps
Figure 5.11: Importance of habitat variables in describing variation in number of wetland specialist species. These models explained 89% of the variance.
5 10 15 20
7.7
7.8
7.9
8.0
8.1
8.2
8.3
Partial Plot
Litter depth
5 10 15 20
56
78
91
01
1
Actual data
Litter Depth
Bo
ots
tra
pp
ed
no
. o
f sp
p
-6
-4
-2
0
2
4
6
8
10
12
14
Var
iab
le im
po
rtan
ce (
%In
cMSE
)
Habitat variables
Pitfall wetland specialists
0 10 20 30 40
45
67
89
10
11
standing.water.summer.2010
Ere
ed
be
d
HW
HB
SM
13
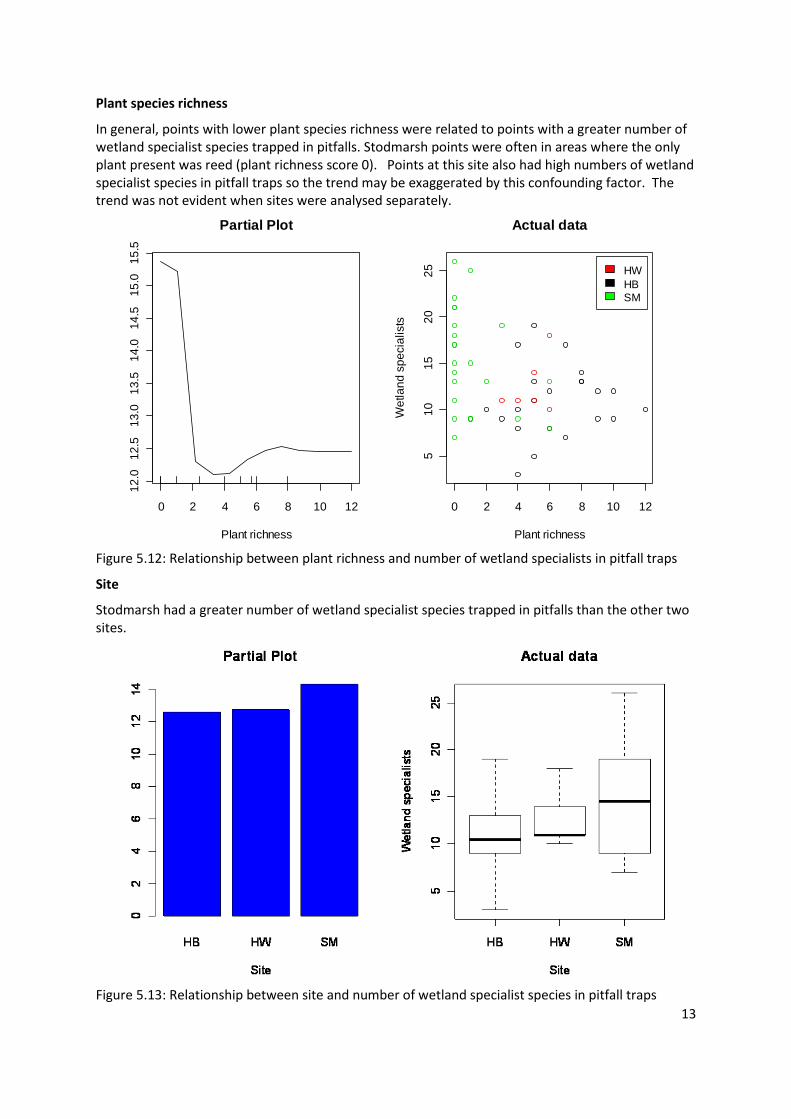
Plant species richness
In general, points with lower plant species richness were related to points with a greater number of wetland specialist species trapped in pitfalls. Stodmarsh points were often in areas where the only plant present was reed (plant richness score 0). Points at this site also had high numbers of wetland specialist species in pitfall traps so the trend may be exaggerated by this confounding factor. The trend was not evident when sites were analysed separately.
Figure 5.12: Relationship between plant richness and number of wetland specialists in pitfall traps
Site
Stodmarsh had a greater number of wetland specialist species trapped in pitfalls than the other two sites.
Figure 5.13: Relationship between site and number of wetland specialist species in pitfall traps
0 2 4 6 8 10 12
12
.01
2.5
13
.01
3.5
14
.01
4.5
15
.01
5.5
Partial Plot
Plant richness
0 2 4 6 8 10 12
51
01
52
02
5
Actual data
Plant richness
We
tla
nd
sp
ecia
lists
0 10 20 30 40
45
67
89
10
11
standing.water.summer.2010E
ree
db
ed
HW
HB
SM
14
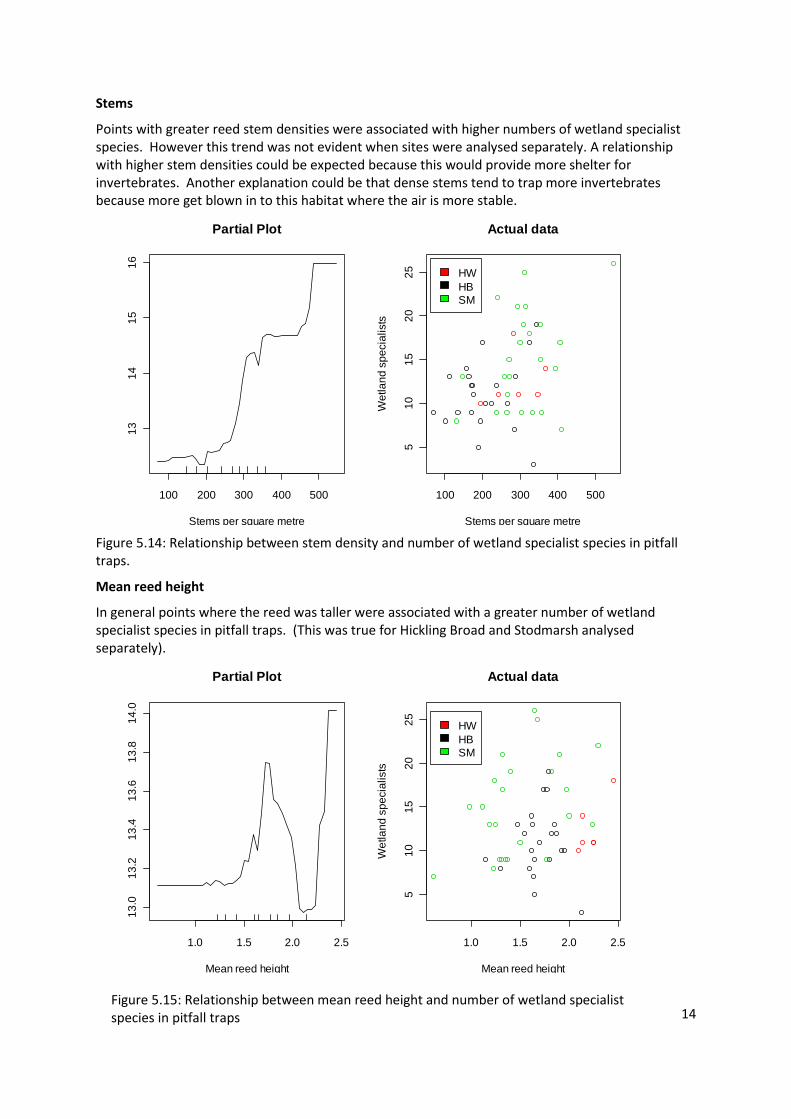
Stems
Points with greater reed stem densities were associated with higher numbers of wetland specialist species. However this trend was not evident when sites were analysed separately. A relationship with higher stem densities could be expected because this would provide more shelter for invertebrates. Another explanation could be that dense stems tend to trap more invertebrates because more get blown in to this habitat where the air is more stable.
Figure 5.14: Relationship between stem density and number of wetland specialist species in pitfall traps.
Mean reed height
In general points where the reed was taller were associated with a greater number of wetland specialist species in pitfall traps. (This was true for Hickling Broad and Stodmarsh analysed separately).
100 200 300 400 500
13
14
15
16
Partial Plot
Stems per square metre
100 200 300 400 500
51
01
52
02
5
Actual data
Stems per square metre
We
tla
nd
sp
ecia
lists
1.0 1.5 2.0 2.5
13
.01
3.2
13
.41
3.6
13
.81
4.0
Partial Plot
Mean reed height
1.0 1.5 2.0 2.5
51
01
52
02
5
Actual data
Mean reed height
We
tla
nd
sp
ecia
lists
Figure 5.15: Relationship between mean reed height and number of wetland specialist species in pitfall traps
0 10 20 30 40
45
67
89
10
11
standing.water.summer.2010
Ere
ed
be
d
HW
HB
SM
0 10 20 30 40
45
67
89
10
11
standing.water.summer.2010
Ere
ed
be
d
HW
HB
SM
15
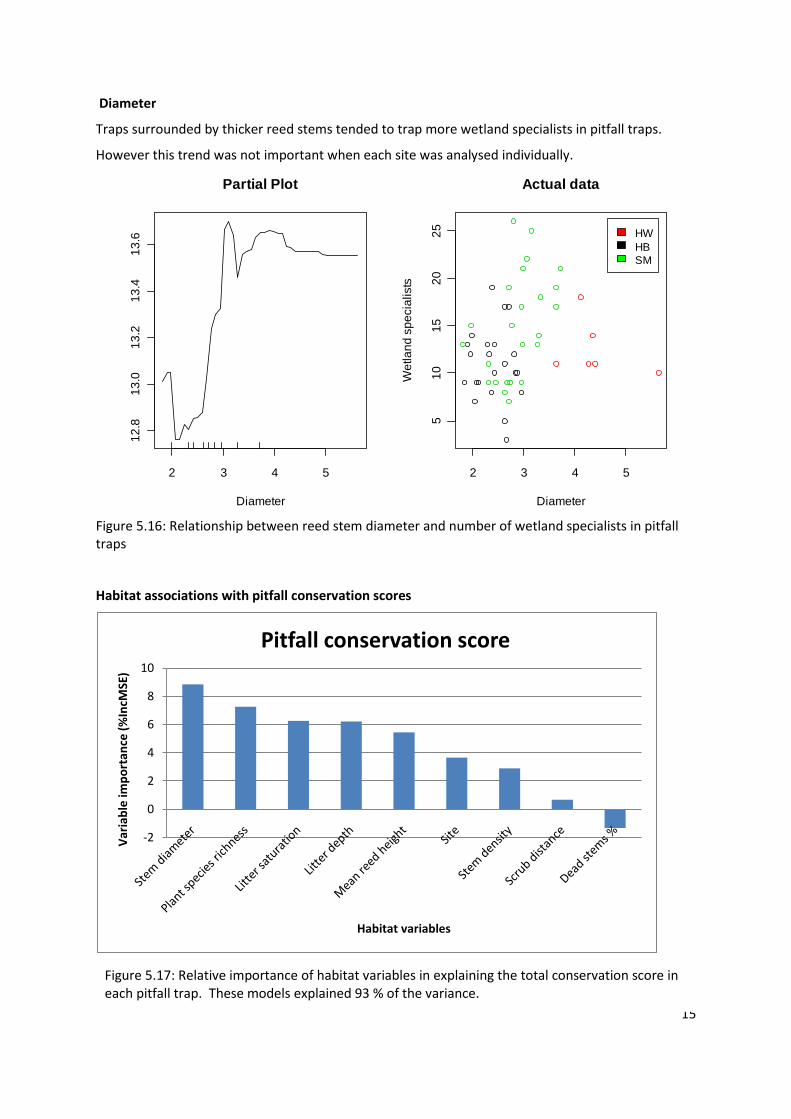
Diameter
Traps surrounded by thicker reed stems tended to trap more wetland specialists in pitfall traps.
However this trend was not important when each site was analysed individually.
Figure 5.16: Relationship between reed stem diameter and number of wetland specialists in pitfall traps
Habitat associations with pitfall conservation scores
2 3 4 5
12
.81
3.0
13
.21
3.4
13
.6
Partial Plot
Diameter
2 3 4 5
51
01
52
02
5
Actual data
Diameter
We
tla
nd
sp
ecia
lists
-2
0
2
4
6
8
10
Var
iab
le im
po
rtan
ce (
%In
cMSE
)
Habitat variables
Pitfall conservation score
Figure 5.17: Relative importance of habitat variables in explaining the total conservation score in each pitfall trap. These models explained 93 % of the variance.
0 10 20 30 40
45
67
89
10
11
standing.water.summer.2010
Ere
ed
be
d
HW
HB
SM
16
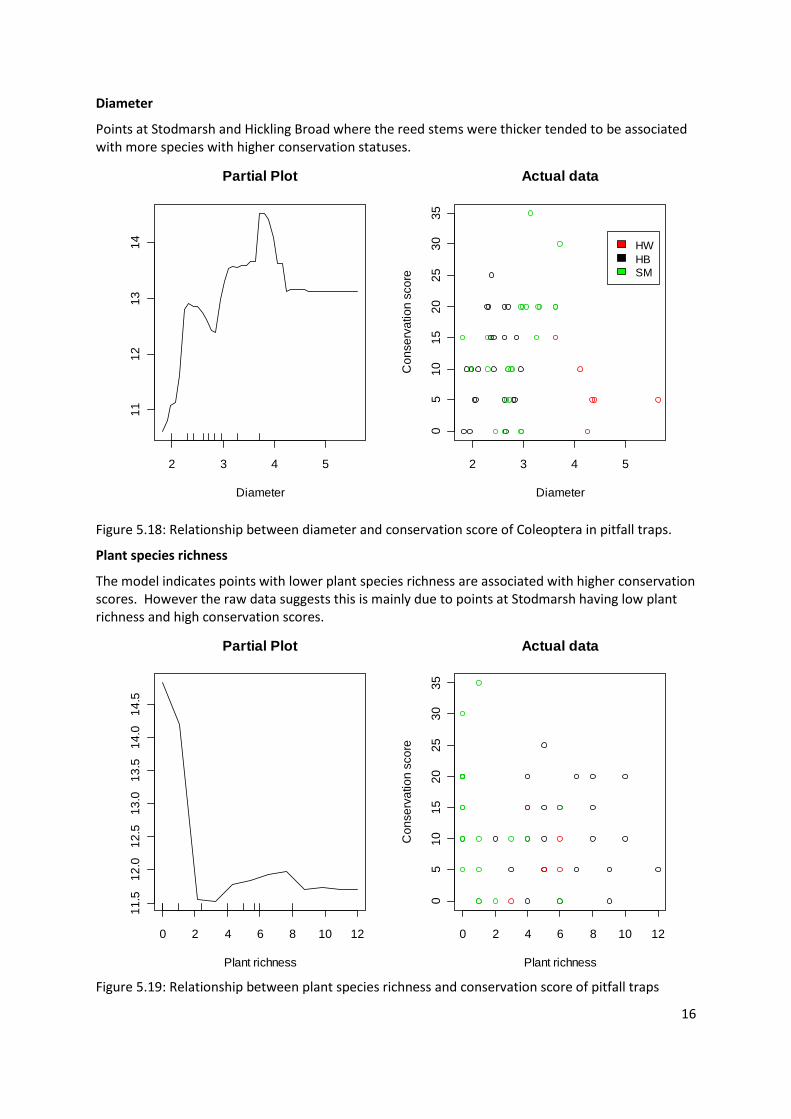
Diameter
Points at Stodmarsh and Hickling Broad where the reed stems were thicker tended to be associated with more species with higher conservation statuses.
Figure 5.18: Relationship between diameter and conservation score of Coleoptera in pitfall traps.
Plant species richness
The model indicates points with lower plant species richness are associated with higher conservation scores. However the raw data suggests this is mainly due to points at Stodmarsh having low plant richness and high conservation scores.
Figure 5.19: Relationship between plant species richness and conservation score of pitfall traps
2 3 4 5
11
12
13
14
Partial Plot
Diameter
2 3 4 5
05
10
15
20
25
30
35
Actual data
Diameter
Co
nse
rva
tio
n s
co
re
0 2 4 6 8 10 12
11
.51
2.0
12
.51
3.0
13
.51
4.0
14
.5
Partial Plot
Plant richness
0 2 4 6 8 10 12
05
10
15
20
25
30
35
Actual data
Plant richness
Co
nse
rva
tio
n s
co
re0 10 20 30 40
45
67
89
10
11
standing.water.summer.2010
Ere
ed
be
d
HW
HB
SM

17
Litter saturation
Points that were dry between May and August 2009 tended to be associated with high conservation scores in pitfall traps. However this is biased by the tendency for pitfall traps to be placed in areas that were dry in August.
Figure 5.20: Relationship between litter saturation category and conservation score in pitfall traps
Litter depth
The model suggests points with deeper litter tended to be associated with more species with higher conservation statuses in pitfall traps. But the scatter plot shows a wide range of conservation scores were found throughout the different litter depths so further work is recommended.
Figure 5.21: Relationship between litter depth and conservation score in pitfall traps
5 10 15 20
11
.01
1.5
12
.01
2.5
13
.01
3.5
Partial Plot
Litter depth
5 10 15 20
05
10
15
20
25
30
35
Actual data
Litter depth
Co
nse
rva
tio
n s
co
re
0 10 20 30 40
45
67
89
10
11
standing.water.summer.2010
Ere
ed
be
d
HW
HB
SM

18
Mean reed height
The model suggests that up to a point, taller reed was associated with greater conservation scores. This was most evident at Stodmarsh. However the trends relating to mean reed heights were very site specific, therefore general conclusions cannot be drawn.
Figure 5.22: Relationship between mean reed height and conservation score in pitfall traps
Habitat associations with Coleoptera species diversity in pitfall traps
Since Coleoptera made up 52% of the species caught and identified in pitfall traps, there was scope to analyse Coleoptera alone to make deductions about the habitats associated with greatest Coleoptera diversity and abundance at the sites. The number of species was not bootstrapped as the minimum number of species in any one trap was three, which was too small to make meaningful bootstrapped numbers.
Differences between sites
Stodmarsh had the highest number of species, abundance and variance of number of species. This was followed by Hickling Broad in total number of species and abundances, but Ham Wall was second in terms of average number of species and abundance.
Table 5.3: Coleoptera number of species and abundances at each site
Hickling Broad Ham Wall Stodmarsh
(n=22) (n=12 but 6 used in random forest models)
(n=24)
Total number of Coleoptera species 78 69 116
Total abundance of Coleoptera individuals 552 667 1802
1.0 1.5 2.0 2.5
12
.01
2.5
13
.01
3.5
Partial Plot
Mean reed height
1.0 1.5 2.0 2.5
05
10
15
20
25
30
35
Actual data
Mean reed height
Co
nse
rva
tio
n s
co
re
0 10 20 30 40
45
67
89
10
11
standing.water.summer.2010
Ere
ed
be
d
HW
HB
SM
19
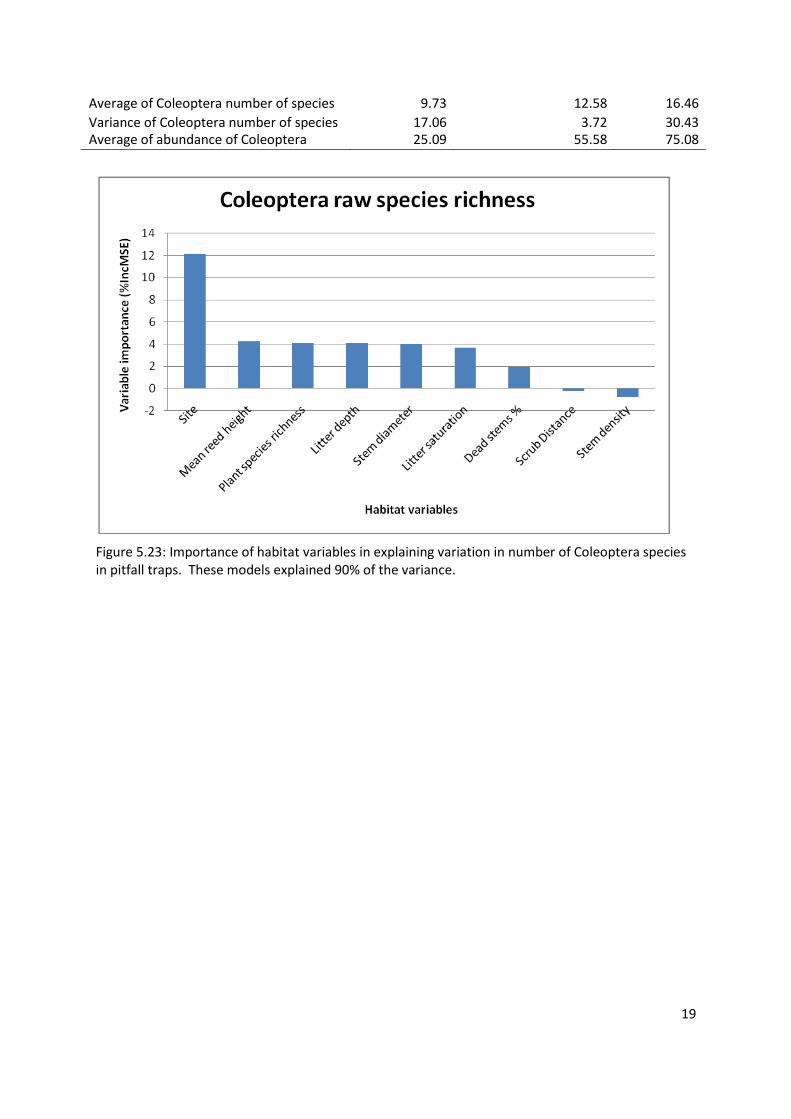
Average of Coleoptera number of species 9.73 12.58 16.46
Variance of Coleoptera number of species 17.06 3.72 30.43 Average of abundance of Coleoptera individuals
25.09 55.58 75.08
Figure 5.23: Importance of habitat variables in explaining variation in number of Coleoptera species in pitfall traps. These models explained 90% of the variance.
20
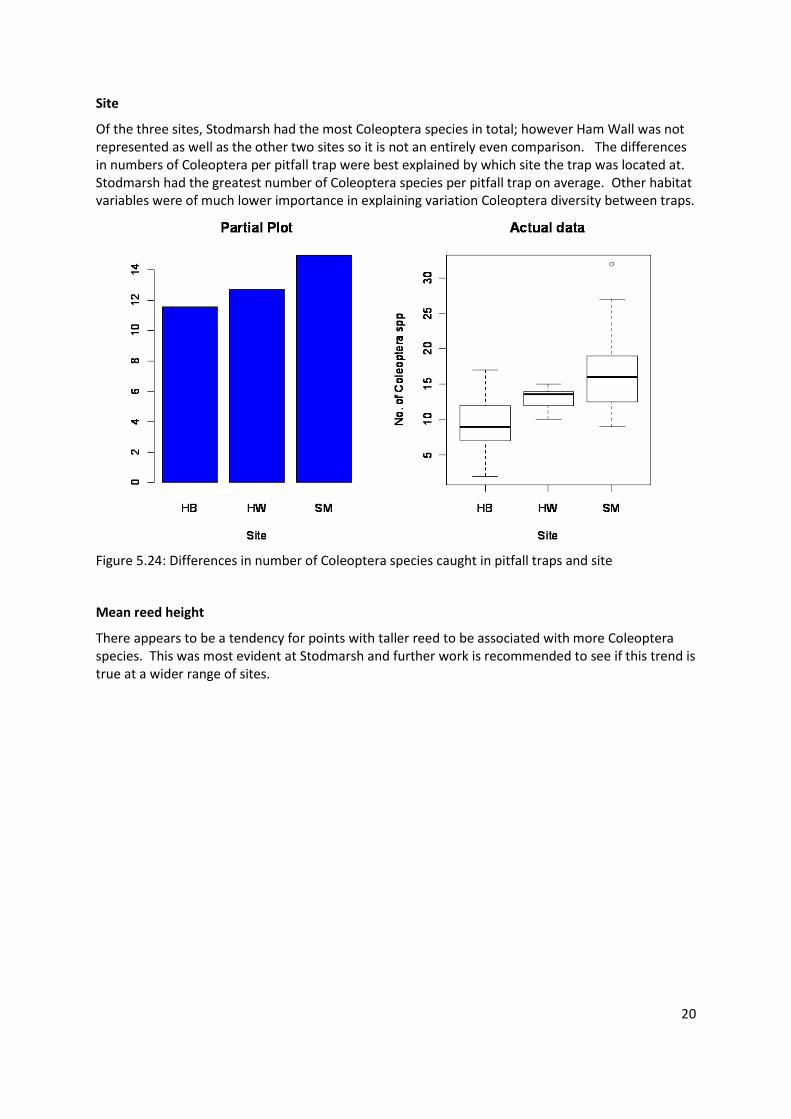
Site
Of the three sites, Stodmarsh had the most Coleoptera species in total; however Ham Wall was not represented as well as the other two sites so it is not an entirely even comparison. The differences in numbers of Coleoptera per pitfall trap were best explained by which site the trap was located at. Stodmarsh had the greatest number of Coleoptera species per pitfall trap on average. Other habitat variables were of much lower importance in explaining variation Coleoptera diversity between traps.
Figure 5.24: Differences in number of Coleoptera species caught in pitfall traps and site
Mean reed height
There appears to be a tendency for points with taller reed to be associated with more Coleoptera species. This was most evident at Stodmarsh and further work is recommended to see if this trend is true at a wider range of sites.

21
Figure 5.25: Relationship between mean reed height and number of Coleoptera species in each
pitfall trap
Plant species diversity
At Stodmarsh, points with fewer plant species were associated with more Coleoptera species, however this trend was not seen at other sites.
Figure 5.26: Relationship between plant species richness and number of Coleoptera in pitfall traps
1.0 1.5 2.0 2.5
12
.21
2.4
12
.61
2.8
13
.01
3.2
Partial Plot
Mean reed height
1.0 1.5 2.0 2.5
51
01
52
02
53
0
Actual data
Mean reed height
No
. o
f C
ole
op
tera
sp
p
0 2 4 6 8 10 12
12
.51
3.0
13
.5
Partial Plot
Plant richness
0 2 4 6 8 10 12
51
01
52
02
53
0
Actual data
Plant richness
No
. o
f C
ole
op
tera
sp
p
0 10 20 30 40
45
67
89
10
11
standing.water.summer.2010
Ere
ed
be
d
HW
HB
SM
0 10 20 30 40
45
67
89
10
11
standing.water.summer.2010
Ere
ed
be
d
HW
HB
SM

22
Litter depth
A tendency for points with shallower litter to be associated with more Coleoptera species was shown by the model and this was most evident at Stodmarsh.
Diameter
The model showed a tendency for points with thicker reed stems to be associated with greater numbers of Coleoptera in pitfall traps. This was most evident at Stodmarsh.
Figure 5.28: Relationship between reed stem diameter and number of Coleoptera in pitfall traps
5 10 15 20
12
.61
2.8
13
.01
3.2
13
.4
Partial Plot
Litter depth
5 10 15 20
51
01
52
02
53
0
Actual data
Litter depth
No
. o
f C
ole
op
tera
sp
p
2 3 4 5
12
.01
2.5
13
.01
3.5
Partial Plot
Diameter
2 3 4 5
51
01
52
02
53
0
Actual data
Diameter
No
. o
f C
ole
op
tera
sp
p
Figure 5.27: Relationship between litter depth and number of Coleoptera in pitfall traps
0 10 20 30 40
45
67
89
10
11
standing.water.summer.2010
Ere
ed
be
d
HW
HB
SM
0 10 20 30 40
45
67
89
10
11
standing.water.summer.2010
Ere
ed
be
d
HW
HB
SM

23
Litter saturation
Points that were dry between May and August 2009 tended to trap more Coleoptera species in August. However the points were biased towards dry sites. Interestingly, wet points (n=3) had on average higher numbers of Coleoptera trapped than partially saturated points (n=11). However this comparison was not even so further work is needed on the variation in Coleoptera diversity along hydrological gradients in reedbeds.
Figure 5.29: Relationship between litter saturation categories and number of Coleoptera species in
pitfall traps
Habitat associations with wetland specialist Coleoptera species in pitfall traps
This analysis looks at the habitat variables related to the number of wetland specialist beetles in pitfall traps.
Figure 5.30: Importance of habitat variables in explaining variation in number of wetland specialist Coleoptera species in pitfall traps. These models explained 90% of the variance.
-4-202468
1012
Var
iab
le im
po
rtan
ce (
%In
cMSE
)
Habitat variables
Coleoptera wetland specialists
24
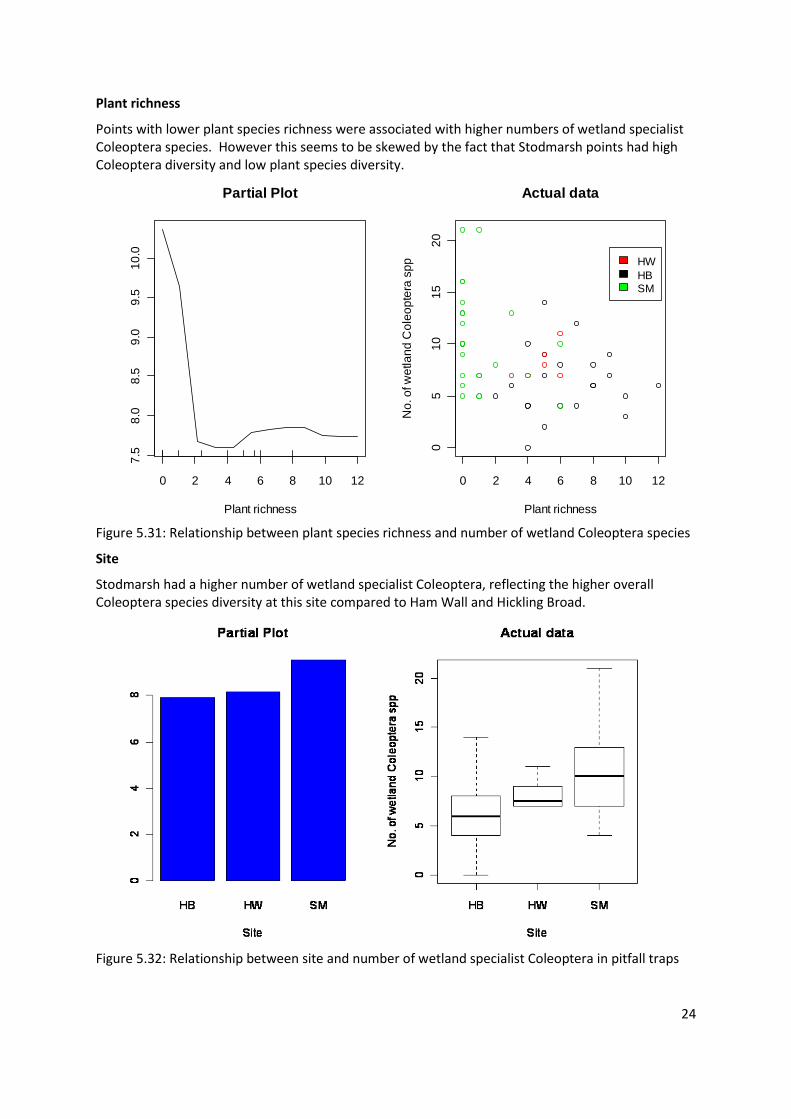
Plant richness
Points with lower plant species richness were associated with higher numbers of wetland specialist Coleoptera species. However this seems to be skewed by the fact that Stodmarsh points had high Coleoptera diversity and low plant species diversity.
Figure 5.31: Relationship between plant species richness and number of wetland Coleoptera species
Site
Stodmarsh had a higher number of wetland specialist Coleoptera, reflecting the higher overall Coleoptera species diversity at this site compared to Ham Wall and Hickling Broad.
Figure 5.32: Relationship between site and number of wetland specialist Coleoptera in pitfall traps
0 2 4 6 8 10 12
7.5
8.0
8.5
9.0
9.5
10
.0
Partial Plot
Plant richness
0 2 4 6 8 10 12
05
10
15
20
Actual data
Plant richness
No
. o
f w
etla
nd
Co
leo
pte
ra s
pp
0 10 20 30 40
45
67
89
10
11
standing.water.summer.2010
Ere
ed
be
d
HW
HB
SM

25
Mean reed height
Points with taller reed on average tended to trap more wetland specialists Coleoptera species in pitfall traps. This appeared to be true at Stodmarsh and Hickling analysed separately.
Figure 5.33: Relationship between mean reed height and number of wetland specialist Coleoptera species
Diameter
Points with greater reed stem diameters were associated with higher numbers of wetland specialist Coleoptera species. This relates to the trend with taller reed height. Again it could be skewed by Stodmarsh points tending to have thicker stems and higher Coleoptera diversity.
Figure 5.34: Relationship between reed stem diameter and number of wetland Coleoptera species
1.0 1.5 2.0 2.5
8.0
8.2
8.4
8.6
8.8
9.0
9.2
Partial Plot
Mean Reed Height
1.0 1.5 2.0 2.5
05
10
15
20
Actual data
Mean Reed Height
No
. o
f w
etla
nd
Co
leo
pte
ra s
pp
2 3 4 5
8.0
8.5
9.0
Partial Plot
Diameter
2 3 4 5
05
10
15
20
Actual data
Diameter
No
. o
f w
etla
nd
Co
leo
pte
ra s
pp
0 10 20 30 40
45
67
89
10
11
standing.water.summer.2010
Ere
ed
be
d
HW
HB
SM
0 10 20 30 40
45
67
89
10
11
standing.water.summer.2010
Ere
ed
be
d
HW
HB
SM

26
Stem density
Points with higher stem densities were associated with higher numbers of wetland specialist Coleoptera species and this appeared to be the case at Stodmarsh and Hickling Broad alone.
Figure 5.35: Relationship between stem density and number of wetland Coleoptera specialist species
Litter saturation was of low importance and was biased towards dry points (only 3 were wet).
Habitat associations with Coleoptera conservation scores in pitfall traps
This analysis looks at the conservation scores of pitfall traps calculated just for Coleoptera. It shows which habitat variables were associated with traps with beetles with a conservation status.
Figure 5.36: Relative importance of habitat variables in explaining variation in Coleoptera conservation scores. These models explained 93% of the variance.
100 200 300 400 500
8.0
8.5
9.0
9.5
10
.01
0.5
11
.0
Partial Plot
Stems per square metre
100 200 300 400 500
05
10
15
20
Actual data
Stems per square metre
No
. o
f w
etla
nd
Co
leo
pte
ra s
pp
0123456789
10
Var
iab
le im
po
rtan
ce (
%In
cMSE
)
Habitat variables
Coleoptera conservation score
0 10 20 30 40
45
67
89
10
11
standing.water.summer.2010
Ere
ed
be
d
HW
HB
SM

27
Diameter
Points with thicker reed stems were associated with more Coleoptera species with conservation status at Stodmarsh and Hickling Broad.
Figure 5.37: Relationship between reed stem diameter and Coleoptera conservation score
Litter depth
All but the shallowest litter depths were capable of trapping high numbers of Coleoptera species with conservation statuses.
Figure 5.38: Relationship between litter depth and Coleoptera conservation score
2 3 4 5
10
.01
0.5
11
.01
1.5
12
.0
Partial Plot
Diameter
2 3 4 5
05
10
15
20
25
30
35
Actual data
Diameter
Co
leo
pte
ra c
on
se
rva
tio
n S
co
re
5 10 15 20
9.5
10
.01
0.5
11
.01
1.5
12
.0
Partial Plot
Litter Depth
5 10 15 20
05
10
15
20
25
30
35
Actual data
Litter Depth
Co
leo
pte
ra c
on
se
rva
tio
n S
co
re0 10 20 30 40
45
67
89
10
11
standing.water.summer.2010
Ere
ed
be
d
HW
HB
SM
0 10 20 30 40
45
67
89
10
11
standing.water.summer.2010
Ere
ed
be
d
HW
HB
SM

28
Scrub distance
The relationship between scrub distance and number of Coleoptera species with a conservation status was unclear and needs further investigation.
Figure 5.39: Relationship between scrub distance and Coleoptera conservation score
Plant species richness
Points with low plant species diversity tended to trap more Coleoptera species with a conservation status, however these tended to be points at Stodmarsh so further work would be needed to see how general this trend is. It is interesting to note that Coleoptera species with a conservation score were trapped at points where the only plant was reed. Only two of the Coleoptera in pitfall traps with conservation scores were reedbed specialists.
Figure 5.40: Relationship between plant richness and Coleoptera conservation score
0 50 100 150 200 250 300
10
.51
1.0
11
.51
2.0
Partial Plot
Scrub distance
0 50 100 150 200 250 300
05
10
15
20
25
30
35
Actual data
Scrub Distance
Co
leo
pte
ra c
on
se
rva
tio
n S
co
re
0 2 4 6 8 10 12
10
.01
0.5
11
.01
1.5
12
.01
2.5
13
.0
Partial Plot
Plant richness
0 2 4 6 8 10 12
05
10
15
20
25
30
35
Actual data
Plant richness
Co
leo
pte
ra c
on
se
rva
tio
n S
co
re0 10 20 30 40
45
67
89
10
11
standing.water.summer.2010
Ere
ed
be
d
HW
HB
SM
0 10 20 30 40
45
67
89
10
11
standing.water.summer.2010
Ere
ed
be
d
HW
HB
SM

29
Litter saturation: Points that were dry tended to trap more Coleoptera species with a conservation score, however this is likely to be highly biased by the fact that pitfall traps were placed in dry areas.
Composite habitat variables
A number of the measured habitat variables are associated with each other, due to the nature of reedbed successional habitat. Although this inter-correlation was controlled for in random forest models, a separate principle component analysis (PCA) was carried out to see if similar results were found when composite habitat variables were used.
Here, the PCA has been done for each survey dataset individually, in order to relate gradients to the number of species caught. In a separate analysis, habitat variables across all surveys were combined to look at the main environmental gradients in reedbeds (Chapter 2). In addition the audit data was analysed to look at a wider range of sites. The principle components from these wider analyses could not be directly related to numbers of invertebrates in the traps, since they either combined different trapping techniques (pitfall and water trap) or were from points without trap data (audit points). Therefore to relate principle components to numbers of invertebrates in the traps, separate analysis on each survey dataset was carried out.
Summary of tests correlating principle components for pitfall traps with bootstrapped species richness in traps
The first four principle components explained 81% of the data. None of the principle components were significantly correlated with bootstrapped number of species in the pitfall traps. PC1 was closest to being significant, which was a gradient of increasing stem density, decreasing panicle percentage and decreasing plant species richness. PC1 was tending towards a negative correlation with bootstrapped species richness, which would have meant points with higher plant species richness, higher percentage of panicles and lower stem densities were associated with higher invertebrate diversity. Random forest models found high plant species richness to be important. Standing water was not included as a habitat variable since all points were dry. This means fewer associations between habitat variables and water levels exist as there is not the same gradient of wetness seen at the watertrap and moth points.
Table 5.4: Principle components of habitat variables measured at pitfall trap points
PC1 PC2 PC3 PC4
Litter depth (cm) -0.079 0.502 -0.498 0.093
Stem density (stems/m2) 0.531 0.045 -0.034 -0.269
Dead stems (%) 0.031 -0.233 -0.789 -0.239
Panicles (%) -0.490 0.001 -0.022 0.269
Mean reed height (m) 0.181 -0.529 -0.304 0.418
Diameter (mm) 0.445 -0.243 0.135 0.464
Distance to scrub (m) -0.111 -0.468 0.131 -0.619
Plant species richness -0.478 -0.366 -0.004 0.128

30
-3 -2 -1 0 1 2 3
-3-2
-10
12
x[, 1]
x[, 2
]
1
2
3
4
Standard deviation 1.538 1.355 1.110 1.048
Proportion of variance 0.296 0.230 0.154 0.137
Cumulative variance 0.296 0.525 0.679 0.816
Table 5.5: Results of Pearson’s Correlation Tests on bootstrapped number of species against principle components for pitfall traps.
Component Pearsons df t p
PC1 -0.213 50 -1.55 0.129 .
PC2 0.091 50 0.643 0.523
PC3 0.101 50 0.717 0.477
PC4 -0.088 50 -0.625 0.535
Reedbed specialists
To see if the traps where reedbed specialist invertebrates were caught were associated with a particular combination of habitat variables, these traps were highlighted on the ordination plot. Distinct clusters did not emerge so reedbed specialists are fairly widely distributed across the environmental gradients.
Figure 5.41: Ordination showing pitfall traps containing reedbed specialists with the number of reedbed specialists given different colours.
As the number of reedbed specialists in pitfall traps increased, the points are more central in PC1. Points with more than one reedbed specialist tended to have lower PC2 values, representing shallower litter depths and taller reed heights. However this is a vague visual trend and the data does not support a firm conclusion on the habitat preferences of reedbed specialists.
-3 -2 -1 0 1 2 3
-3-2
-10
12
x[, 1]
x[, 2
]

31
References
UK BAP http://www.ukbap.org.uk
Appendix to invertebrate results
Table 5A: List of reedbed specialists as defined by experts and the category “reedfen and pool” in ISIS for pitfall trap samples
Higher Taxon Family
Experts reedbed specialists from pitfalls Higher Taxon Family
ISIS reedbed and fen from pitfalls
Araneae Salticidae Marpissa radiata Coleoptera Carabidae Demetrias imperialis
Coleoptera Carabidae Demetrias imperialis Coleoptera Carabidae Odacantha melanura
Coleoptera Carabidae Paradromius longiceps Coleoptera Carabidae Oodes helopioides
Hemiptera Lygaeidae Ischnodemus sabuleti Coleoptera Carabidae Paradromius longiceps
Coleoptera Malachiidae Anthocomus rufus
Coleoptera Malachiidae Cerapheles terminatus
Coleoptera Staphylinidae Ocyusa picina
Coleoptera Staphylinidae Pachnida nigella
Coleoptera Staphylinidae Paederus riparius
Coleoptera Staphylinidae Quedius balticus
Coleoptera Staphylinidae Stenus carbonarius
Table 5B: Wetland specialists (ISIS and experts lists compared) from pitfall samples
Higher taxon Family Experts wetland Higher taxon Family ISIS W2 and W3
Araneae Clubionidae Clubiona juvenis Araneae Araneidae Larinioides cornutus
Araneae Clubionidae Clubiona phragmitis Araneae Clubionidae
Clubiona juvenis
Araneae Linyphiidae Allomengea vidua Araneae Clubionidae Clubiona phragmitis
Araneae Linyphiidae Donacochara speciosa Araneae Clubionidae
Clubiona subtilis
Araneae Linyphiidae Gnathonarium dentatum Araneae Hahniidae
Antistea elegans
Araneae Linyphiidae Gongylidiellum murcidum Araneae Linyphiidae
Allomengea vidua
Araneae Linyphiidae Hypomma fulvum Araneae Linyphiidae Bathyphantes approximatus
Araneae Linyphiidae Microlinyphia impigra Araneae Linyphiidae
Donacochara speciosa
Araneae Linyphiidae Oedothorax gibbosus Araneae Linyphiidae
Gnathonarium dentatum
Araneae Linyphiidae Silometopus
Araneae Linyphiidae Gongylidiellum

32
elegans murcidum
Araneae Linyphiidae Walckenaeria vigilax Araneae Linyphiidae
Hypomma fulvum
Araneae Lycosidae Arctosa leopardus Araneae Linyphiidae Leptorhoptrum robustum
Araneae Lycosidae Pirata latitans Araneae Linyphiidae Lophomma punctatum
Araneae Lycosidae Pirata piscatorius Araneae Linyphiidae Microlinyphia impigra
Basommatophora Planorbidae Anisus leucostoma Araneae Linyphiidae
Oedothorax gibbosus
Coleoptera Cantharidae Cantharis thoracica Araneae Linyphiidae
Silometopus elegans
Coleoptera Carabidae Acupalpus dubius Araneae Lycosidae Arctosa leopardus
Coleoptera Carabidae Agonum emarginatum Araneae Lycosidae
Pardosa amentata
Coleoptera Carabidae Agonum fuliginosum Araneae Lycosidae
Pardosa proxima
Coleoptera Carabidae Agonum thoreyi Araneae Lycosidae Pirata hygrophilus
Coleoptera Carabidae Anisodactylus binotatus Araneae Lycosidae Pirata latitans
Coleoptera Carabidae Badister dilatatus Araneae Lycosidae Pirata piraticus
Coleoptera Carabidae Bembidion assimile Araneae Lycosidae
Pirata piscatorius
Coleoptera Carabidae Bembidion biguttatum Araneae Salticidae
Marpissa radiata
Coleoptera Carabidae Bembidion fumigatum Araneae Tetragnathidae
Pachygnatha clercki
Coleoptera Carabidae Carabus granulatus Basommatophora Ellobiidae
Carychium minimum
Coleoptera Carabidae Demetrias imperialis Basommatophora Planorbidae
Anisus leucostoma
Coleoptera Carabidae Elaphrus cupreus Coleoptera Carabidae Acupalpus dubius
Coleoptera Carabidae Leistus terminatus Coleoptera Carabidae Agonum emarginatum
Coleoptera Carabidae Odacantha melanura Coleoptera Carabidae
Agonum fuliginosum
Coleoptera Carabidae Oodes helopioides Coleoptera Carabidae Agonum thoreyi
Coleoptera Carabidae Oxypselaphus obscurus Coleoptera Carabidae
Anisodactylus binotatus
Coleoptera Carabidae Paradromius longiceps Coleoptera Carabidae
Badister dilatatus
Coleoptera Carabidae Paranchus albipes Coleoptera Carabidae Bembidion assimile

33
Coleoptera Carabidae Pterostichus anthracinus Coleoptera Carabidae
Bembidion biguttatum
Coleoptera Carabidae Pterostichus diligens Coleoptera Carabidae
Bembidion fumigatum
Coleoptera Carabidae Pterostichus gracilis Coleoptera Carabidae Blemus discus
Coleoptera Carabidae Pterostichus minor Coleoptera Carabidae
Carabus granulatus
Coleoptera Carabidae Pterostichus nigrita Coleoptera Carabidae
Demetrias imperialis
Coleoptera Chrysomelidae Aphthona nonstriata Coleoptera Carabidae
Elaphrus cupreus
Coleoptera Clambidae Clambus armadillo Coleoptera Carabidae Odacantha melanura
Coleoptera Coccinellidae Coccidula rufa Coleoptera Carabidae Oodes helopioides
Coleoptera Dytiscidae Hydroporus angustatus Coleoptera Carabidae
Oxypselaphus obscurus
Coleoptera Dytiscidae Hyphydrus ovatus Coleoptera Carabidae Paradromius longiceps
Coleoptera Dytiscidae Ilybius quadriguttatus Coleoptera Carabidae
Pterostichus anthracinus
Coleoptera Haliplidae Haliplus flavicollis Coleoptera Carabidae Pterostichus diligens
Coleoptera Helophoridae Helophorus brevipalpis Coleoptera Carabidae
Pterostichus gracilis
Coleoptera Helophoridae Helophorus grandis Coleoptera Carabidae
Pterostichus minor
Coleoptera Helophoridae Helophorus strigifrons Coleoptera Carabidae
Pterostichus nigrita
Coleoptera Heteroceridae Heterocerus fenestratus Coleoptera Chrysomelidae
Aphthona nonstriata
Coleoptera Hydraenidae Hydraena testacea Coleoptera Coccinellidae Coccidula rufa
Coleoptera Hydraenidae Ochthebius dilatatus Coleoptera Dytiscidae
Hydroporus angustatus
Coleoptera Hydraenidae Ochthebius minimus Coleoptera Dytiscidae
Hyphydrus ovatus
Coleoptera Hydrophilidae Anacaena globulus Coleoptera Dytiscidae
Ilybius quadriguttatus
Coleoptera Hydrophilidae Anacaena limbata Coleoptera Haliplidae Haliplus flavicollis
Coleoptera Hydrophilidae Cercyon convexiusculus Coleoptera Helophoridae
Helophorus brevipalpis
Coleoptera Hydrophilidae Cercyon marinus Coleoptera Helophoridae Helophorus grandis
Coleoptera Hydrophilidae Cercyon sternalis Coleoptera Helophoridae Helophorus strigifrons

34
Coleoptera Hydrophilidae Cercyon tristis Coleoptera Heteroceridae Heterocerus fenestratus
Coleoptera Hydrophilidae Cercyon ustulatus Coleoptera Hydraenidae Hydraena testacea
Coleoptera Hydrophilidae Coelostoma orbiculare Coleoptera Hydraenidae
Ochthebius dilatatus
Coleoptera Hydrophilidae Hydrobius fuscipes Coleoptera Hydraenidae
Ochthebius minimus
Coleoptera Malachiidae Anthocomus rufus Coleoptera Hydrophilidae Anacaena globulus
Coleoptera Malachiidae Cerapheles terminatus Coleoptera Hydrophilidae
Anacaena limbata
Coleoptera Phalacridae Stilbus oblongus Coleoptera Hydrophilidae Cercyon convexiusculus
Coleoptera Ptiliidae Baeocrara variolosa Coleoptera Hydrophilidae
Cercyon marinus
Coleoptera Scirtidae Cyphon hilaris Coleoptera Hydrophilidae Cercyon sternalis
Coleoptera Scirtidae Microcara testacea Coleoptera Hydrophilidae Cercyon tristis
Coleoptera Scydmaenidae Euconnus hirticollis Coleoptera Hydrophilidae
Cercyon ustulatus
Coleoptera Scydmaenidae Stenichnus collaris Coleoptera Hydrophilidae Coelostoma orbiculare
Coleoptera Silvanidae Psammoecus bipunctatus Coleoptera Hydrophilidae
Hydrobius fuscipes
Coleoptera Staphylinidae Anotylus rugosus Coleoptera Malachiidae Anthocomus rufus
Coleoptera Staphylinidae Atheta graminicola Coleoptera Malachiidae
Cerapheles terminatus
Coleoptera Staphylinidae Boreophilia eremita Coleoptera Scirtidae Cyphon hilaris
Coleoptera Staphylinidae Brachygluta fossulata Coleoptera Scirtidae
Microcara testacea
Coleoptera Staphylinidae Brachygluta helferi Coleoptera Silvanidae
Psammoecus bipunctatus
Coleoptera Staphylinidae Bryaxis bulbifer Coleoptera Staphylinidae Anotylus rugosus
Coleoptera Staphylinidae Carpelimus corticinus Coleoptera Staphylinidae
Atheta graminicola
Coleoptera Staphylinidae Carpelimus lindrothi Coleoptera Staphylinidae
Bryaxis bulbifer
Coleoptera Staphylinidae Carpelimus zealandicus Coleoptera Staphylinidae
Carpelimus corticinus
Coleoptera Staphylinidae Dacrila fallax Coleoptera Staphylinidae Carpelimus lindrothi
Coleoptera Staphylinidae Deinopsis erosa Coleoptera Staphylinidae Dacrila fallax
Coleoptera Staphylinidae Dilacra luteipes Coleoptera Staphylinidae Deinopsis

35
erosa
Coleoptera Staphylinidae Erichsonius cinerascens Coleoptera Staphylinidae
Dilacra luteipes
Coleoptera Staphylinidae Euaesthetus ruficapillus Coleoptera Staphylinidae
Erichsonius cinerascens
Coleoptera Staphylinidae Gabrius bishopi Coleoptera Staphylinidae Euaesthetus ruficapillus
Coleoptera Staphylinidae Lathrobium brunnipes Coleoptera Staphylinidae
Lathrobium elongatum
Coleoptera Staphylinidae Lathrobium elongatum Coleoptera Staphylinidae
Lathrobium impressum
Coleoptera Staphylinidae Lathrobium impressum Coleoptera Staphylinidae
Lathrobium quadratum
Coleoptera Staphylinidae Lathrobium quadratum Coleoptera Staphylinidae
Lathrobium terminatum
Coleoptera Staphylinidae Lathrobium terminatum Coleoptera Staphylinidae Lesteva sicula
Coleoptera Staphylinidae Lesteva sicula Coleoptera Staphylinidae Myllaena dubia
Coleoptera Staphylinidae Mycetota laticollis Coleoptera Staphylinidae Myllaena minuta
Coleoptera Staphylinidae Myllaena dubia Coleoptera Staphylinidae Ochthephilum fracticorne
Coleoptera Staphylinidae Myllaena minuta Coleoptera Staphylinidae Ocyusa maura
Coleoptera Staphylinidae Ochthephilum fracticorne Coleoptera Staphylinidae Ocyusa picina
Coleoptera Staphylinidae Ocyusa maura Coleoptera Staphylinidae Olophrum fuscum
Coleoptera Staphylinidae Ocyusa picina Coleoptera Staphylinidae Oxypoda elongatula
Coleoptera Staphylinidae Olophrum fuscum Coleoptera Staphylinidae Oxypoda procerula
Coleoptera Staphylinidae Oxypoda elongatula Coleoptera Staphylinidae
Pachnida nigella
Coleoptera Staphylinidae Oxypoda procerula Coleoptera Staphylinidae
Paederus riparius
Coleoptera Staphylinidae Pachnida nigella Coleoptera Staphylinidae Philhygra gyllenhalii
Coleoptera Staphylinidae Paederus riparius Coleoptera Staphylinidae Philhygra malleus
Coleoptera Staphylinidae Philhygra gyllenhalii Coleoptera Staphylinidae
Philhygra terminalis
Coleoptera Staphylinidae Philhygra malleus Coleoptera Staphylinidae Philhygra volans
Coleoptera Staphylinidae Philhygra terminalis Coleoptera Staphylinidae
Philonthus fumarius
Coleoptera Staphylinidae Philhygra volans Coleoptera Staphylinidae Philonthus quisquiliarius

36
Coleoptera Staphylinidae Philonthus fumarius Coleoptera Staphylinidae
Quedius balticus
Coleoptera Staphylinidae Philonthus quisquiliarius Coleoptera Staphylinidae
Quedius boopoides
Coleoptera Staphylinidae Quedius balticus Coleoptera Staphylinidae Quedius fuliginosus
Coleoptera Staphylinidae Quedius boopoides Coleoptera Staphylinidae
Rybaxis longicornis
Coleoptera Staphylinidae Rybaxis longicornis Coleoptera Staphylinidae
Stenus bimaculatus
Coleoptera Staphylinidae Stenus bimaculatus Coleoptera Staphylinidae
Stenus canaliculatus
Coleoptera Staphylinidae Stenus canaliculatus Coleoptera Staphylinidae
Stenus carbonarius
Coleoptera Staphylinidae Stenus carbonarius Coleoptera Staphylinidae Stenus juno
Coleoptera Staphylinidae Stenus juno Coleoptera Staphylinidae Stenus latifrons
Coleoptera Staphylinidae Stenus latifrons Coleoptera Staphylinidae Stenus melanopus
Coleoptera Staphylinidae Stenus melanopus Coleoptera Staphylinidae Stenus nitens
Coleoptera Staphylinidae Stenus nitens Coleoptera Staphylinidae Stenus pallipes
Coleoptera Staphylinidae Stenus pallipes Coleoptera Staphylinidae Stenus palustris
Coleoptera Staphylinidae Stenus palustris Coleoptera Staphylinidae Tachyporus transversalis
Coleoptera Staphylinidae Tachyporus transversalis Hemiptera Lygaeidae
Ischnodemus sabuleti
Hemiptera Lygaeidae Ischnodemus sabuleti Hemiptera Nepidae Nepa cinerea
Hemiptera Nepidae Nepa cinerea Hemiptera Saldidae Chartoscirta cincta
Hemiptera Saldidae Chartoscirta cincta Hemiptera Veliidae
Microvelia reticulata
Hemiptera Veliidae Microvelia reticulata Orthoptera Tetrigidae Tetrix subulata
Isopoda Ligiidae Ligidium hypnorum Stylommatophora Agriolimacidae
Deroceras laeve
Isopoda Trachelipidae Trachelipus rathkei Stylommatophora Vertiginidae
Vertigo antivertigo
Orthoptera Tetrigidae Tetrix subulata Stylommatophora Zonitidae Zonitoides nitidus
Stylommatophora Agriolimacidae Deroceras laeve
Stylommatophora Vertiginidae
Vertigo antivertigo
Stylommatophora Zonitidae Zonitoides nitidus
Quedius balticus

37
Table 5C: List of grid references of points where Quedius balticus was found
Trap Code
Total Number of specimens
Grid reference
HBA1 4 642458 321925 HBA2 4 642490 321954 HBA4 1 642468 322116 HBA5 5 642423 322087 HBA6 1 642408 322037 HBA8 10 642359 322092
HBA9 1 642434 322139
HBPDD3 1 643420 320840
HBPDD6 2 643613 320704 HBPDD8 2 643691 320591
Maps of the locations where Quedius balticus was trapped
Figure 5A: Map of locations at Hickling Broad and hydrological units.
38
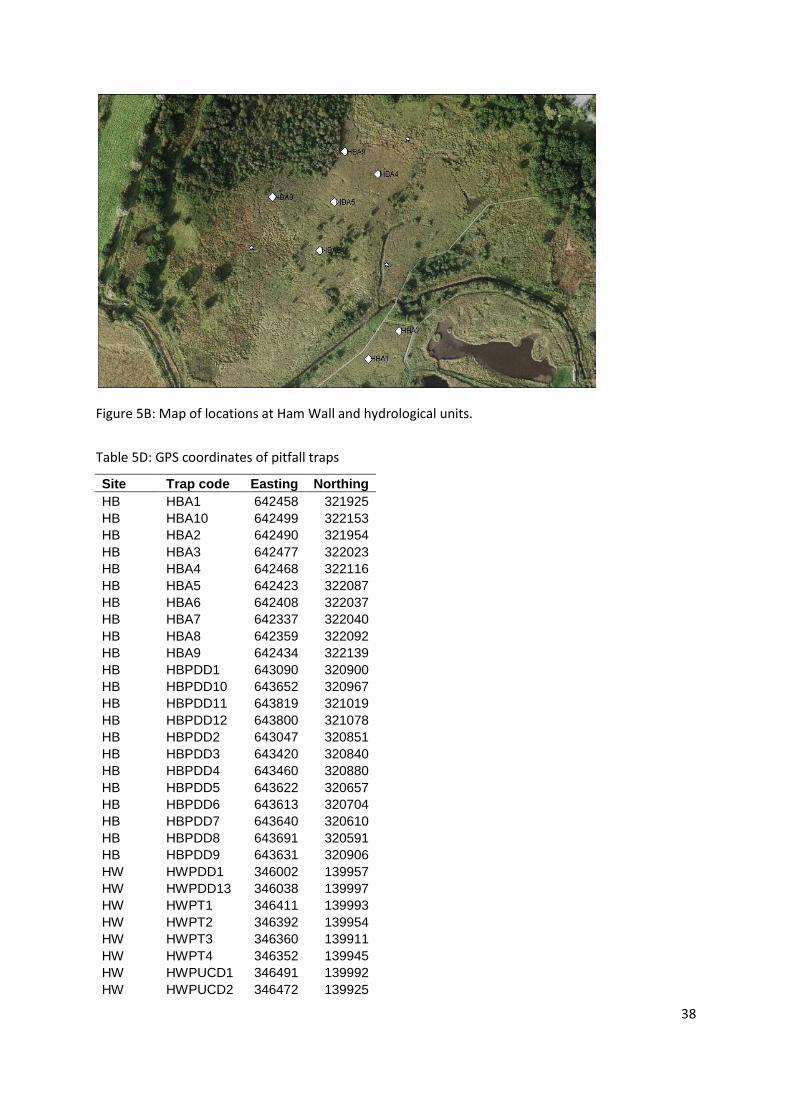
Figure 5B: Map of locations at Ham Wall and hydrological units.
Table 5D: GPS coordinates of pitfall traps
Site Trap code Easting Northing
HB HBA1 642458 321925
HB HBA10 642499 322153
HB HBA2 642490 321954
HB HBA3 642477 322023
HB HBA4 642468 322116
HB HBA5 642423 322087
HB HBA6 642408 322037
HB HBA7 642337 322040
HB HBA8 642359 322092
HB HBA9 642434 322139
HB HBPDD1 643090 320900
HB HBPDD10 643652 320967
HB HBPDD11 643819 321019
HB HBPDD12 643800 321078
HB HBPDD2 643047 320851
HB HBPDD3 643420 320840
HB HBPDD4 643460 320880
HB HBPDD5 643622 320657
HB HBPDD6 643613 320704
HB HBPDD7 643640 320610
HB HBPDD8 643691 320591
HB HBPDD9 643631 320906
HW HWPDD1 346002 139957
HW HWPDD13 346038 139997
HW HWPT1 346411 139993
HW HWPT2 346392 139954
HW HWPT3 346360 139911
HW HWPT4 346352 139945
HW HWPUCD1 346491 139992
HW HWPUCD2 346472 139925

39
HW HWPUCD3 346456 139882
HW HWPUCD4 346410 139879
HW HWPUCD5 346412 139923
HW HWPUCD6 346452 139957
SM SMPDD1 622730 161813
SM SMPDD10 623361 162428
SM SMPDD11 623530 162320
SM SMPDD12 623680 162360
SM SMPDD2 622790 161830
SM SMPDD3 623490 162786
SM SMPDD4 623579 162750
SM SMPDD5 623671 162635
SM SMPDD6 623708 162650
SM SMPDD7 623655 162694
SM SMPDD8 623297 162464
SM SMPDD9 623340 162370
SM SMPWD1 622233 161127
SM SMPWD10 621588 161213
SM SMPWD11 621590 161150
SM SMPWD12 623183 162560
SM SMPWD2 622260 161170
SM SMPWD3 622264 161240
SM SMPWD4 622223 161271
SM SMPWD5 621580 161580
SM SMPWD6 621610 161532
SM SMPWD7 621560 161521
SM SMPWD8 621629 161323
SM SMPWD9 621670 161280