wildlife viewing in utah: participation & e i c ib i...
TRANSCRIPT

Wildlife Viewing in Utah: Participation & E i C ib i (1996 2006)Economic Contributions (1996 – 2006)
D E D l Ut h Wildlif R USFWS
National Extension Tourism Conference Park City, Utah
Dana E. Dolsen, Utah Wildlife Resources USFWS National Survey of Fishing, Hunting & Wildlife-Associated Recreation


Total 2001 – 2006 Economic Contributions of Fishing Hunting & Wildlife Viewing in UtahFishing, Hunting, & Wildlife Viewing in Utah
1.6T t l I t
$ Billions1.57 Utah’s Economy Ripple Effects:
1
1.2
1.4
2001T t l
Total Impacts:$2.3 billion in 2006$2 6 billion in 2001
1.041.23
1.0
0.6
0.8
1 TotalImpacts2006Total
$2.6 billion in 2001 Fishing and Hunting –
$1.23 billion combined in 2006
0
0.2
0.4TotalImpacts
$$1.57 billion combined in 2001
Wildlife Viewing –0
Hunt/Fish $1.0 billion in 2006$1.04 billion in 2001
Hunt/Fish View


Days of Hunting Wildlife in Utah: 1996 20061996 - 2006
2.5 mNumbers in THOUSANDS
2,000
2,500
T1 7 m1,500 T
O
TOTU
UT
1.7 m1.4 mT U
500
1,000 OTA
AL
UTAH
AH NON
UTNONUT
NONUT
OTA
UTA
01996 2001 2006
L H
Days hunted in Utah decreased by a million in 2006 vs 2001
AL
H
Days hunted in Utah decreased by a million in 2006 vs. 2001, dropping about a third of a million days compared to 1996!
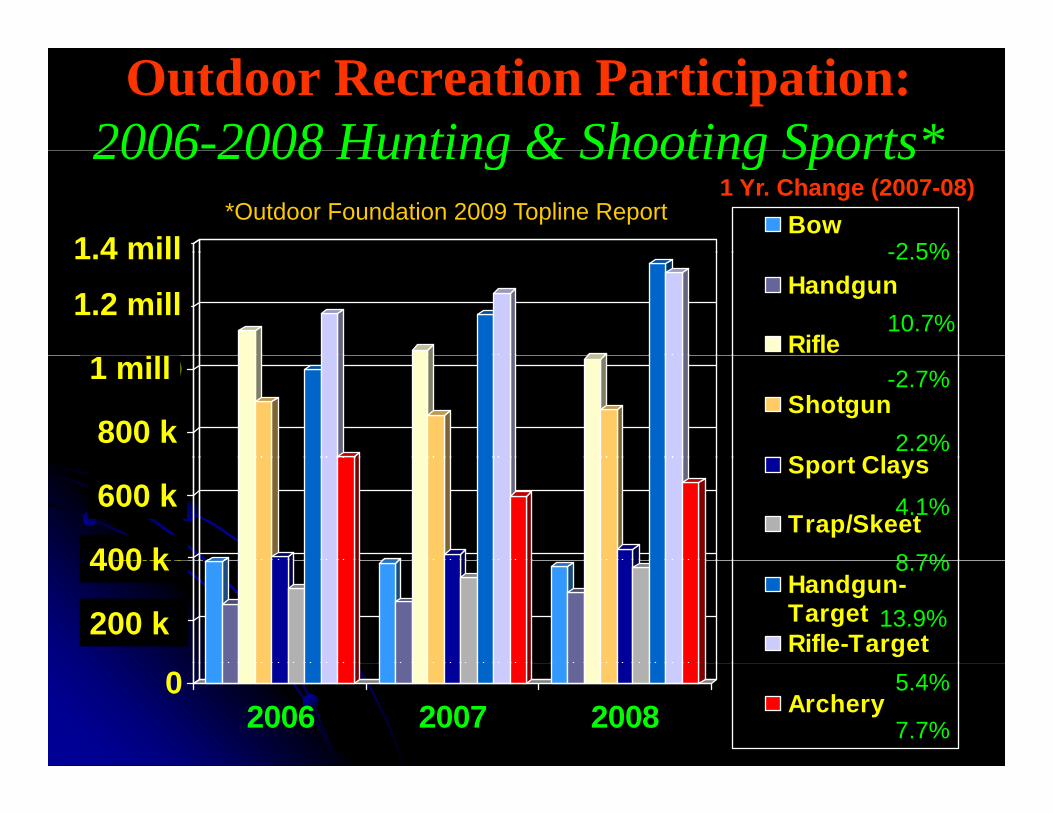
Outdoor Recreation Participation:2006-2008 Hunting & Shooting Sports*2006 2008 Hunting & Shooting Sports
14000 Bow-2 5%
1 Yr. Change (2007-08)*Outdoor Foundation 2009 Topline Report
1 4 mill
12000
14000Handgun
Rifle
-2.5%
10.7%
1.4 mill
1.2 mill
8000
10000Shotgun
S t Cl
-2.7%
2.2%
1 mill
800 k
4000
6000Sport Clays
Trap/Skeet4.1%
8 7%
600 k
400 k
2000
4000Handgun-TargetRifle-Target
8.7%
13.9%
400 k
200 k
02006 2007 2008 Archery
5.4%
7.7%


Utah Hunting Expenditures: 1996 20061996 - 2006
Numbers in THOUSANDS
400000THOUSANDS
$306.2 m $274 4 m
200000
300000
$189.5 m
$274.4 m
100000
200000
01996 2001 20061996 2001 2006
Hunting expenditures in Utah decreased in 2006 from 2001,But still far exceeded ($85 million more) those of 1996!


Days of Angling in Utah: 1996 20061996 - 2006
Numbers in THOUSANDS
5,000
6,000THOUSANDS
T
5.2 m
3 9 m 3 8
3 000
4,000
T
T
O UT
3.9 mT
3.8 m
1 000
2,000
3,000 TOTA
T
AU
AHNO O
OTA U
O0
1,000
1996 2001 2006
AL L
UT
NS
NONUT
NONUT
AL T NON
UT
Fewer days by Utah anglers in 2006 vs. 2001, 2006 > 1996!
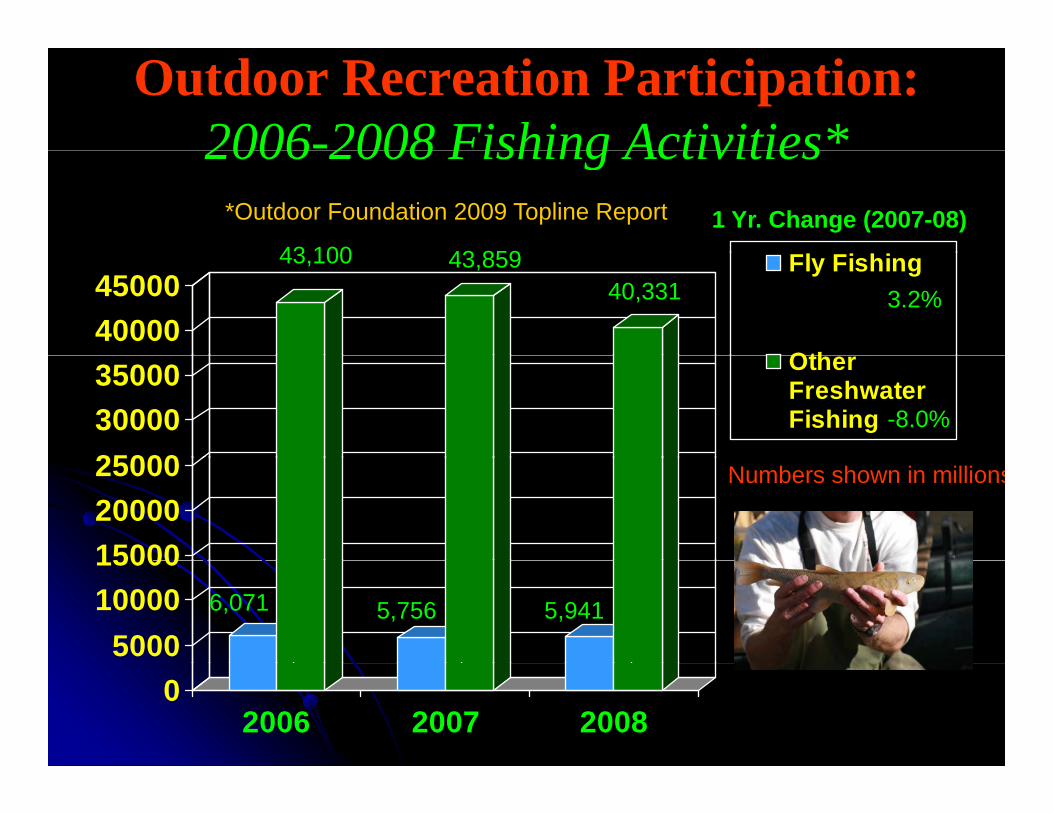
Outdoor Recreation Participation:2006-2008 Fishing Activities*2006 2008 Fishing Activities
1 Yr. Change (2007-08)43 100 43 859
*Outdoor Foundation 2009 Topline Report
4000045000
Fly Fishing
Oth
3.2%
43,100 43,85940,331
250003000035000 Other
FreshwaterFishing -8.0%
150002000025000 Numbers shown in millions
50001000015000
6,071 5,756 5,941
02006 2007 2008


Utah Angling Expenditures: 1996 20061996 - 2006
400000
Numbers in THOUSANDS $398.3 m $376.5 m
300000
400000
$214 m200000
$214 m
100000
01996 2001 2006
Still $145 million more spent on angling in Utah during 2006Still $145 million more spent on angling in Utah during 2006 than in 1996; down $16 million from 2001.


Outdoor Recreation Participation:2006 08 Wildlif Vi & Bi d W t h *
25000
2006-08 Wildlife Viewers & Bird Watchers**Outdoor Foundation
22,97424 113
20000
2009 Topline Report20,29424,113
Numbers shown in millions
150002006 Wildlife Viewers2007 Wildlife Viewers2008 Wildlife Viewers
11,07011,783
12,417
10000
2008 Wildlife Viewers2006 Bird Watchers2007 Bird Watchers2008 Bird Watchers
50002008 Bird Watchers
0Total Number

Days of Viewing Wildlife Away from i h 1996 2006Home in Utah: 1996 - 2006
Numbers in THOUSANDS
4,000
5,000 4.4 m
3,000
,
T
TOT
2.8 mU T
3.0 m
1,000
2,000 OTA
TALU U
TNONNON NON
UTAH
OTA
01996 2001 2006
AL T T UTUT
D i i ildlif i Ut h i d f 1996 t 2001
NONUT
H AL
Days viewing wildlife in Utah increased from 1996 to 2001, but then returned to almost the 1996 level in 2006!

Outdoor Recreation Participant Ages:2009 Wildlif Vi i Bi d W t hi *
120002009 Wildlife Viewing vs. Bird Watching*
*Outdoor Foundation
8000
10000 2009 Topline Report
6000
8000
2007 Wildlife Viewers2008 Wildlife Viewers
4000
2008 Wildlife Viewers2007 Bird Watchers2008 Bird Watchers
0
2000
Youth(6-17)
YoungAdults(18-24)
Adults(25-44)
Adults(45+)


Utah Viewing Trip-Related di 1996 2006Expenditures: 1996 - 2006
Numbers in THOUSANDS
800000
THOUSANDS$682 m
$543 m600000
$543 m
200000
400000 $236 m
0
200000
1996 2001 20061996 2001 2006
Viewing expenditures in Utah almost tripled from 1996 in 2001 and stayed relatively high in 2006!


Wildlife Viewing Economic ContributionAn In-Depth Look at the Impact in Utah
•Equipment PurchaseEquipment Purchase
•State Tax Revenue
•Retail Sales
•Jobs Generated


Viewing Equipment Expenditures i U h 1996 2006in Utah: 1996 - 2006
Numbers in
500000THOUSANDS
$404.2 m
300000
400000
$220.7 m
100000
200000 $83.4 m
0
100000
1996 2001 20061996 2001 2006
Viewers in 2006 spent half as much on equipment as they did in 2001, yet this is still almost three times 1996!


1996 - 2006 Economic Contributions of Wildlife Viewing on Utah Tax Revenues
50,000,0055,000,00
0
60,000,000 * $55.8 million total tax
revenues generated in 2006;55.8
$60 million$55 million$50 million
Important Impacts
30 000 0035,000,00
0
40,000,000
45,000,000
, ,00 revenues generated in 2006;
$18M more than 2001, more than 3 times that of 1996!
* $29 4 million in Utah29.4
$45 million$40 million$35 million
38.9
15,000,0020,000,00
0
25,000,000
30,000,0000 * $29.4 million in Utah
sales/fuel tax was generated in 2001; $18.7 million more than in 1996 ($10 710 7
15.5
29.4$30 million$25 million$20 million$15 illi
05,000,00010,000,00
000 than in 1996 ($10.7
million).* $9.5 million was generated i U h i i 2001
10.7$15 million$10 million$ 5 million
0 4.8 9.51996 2001 2006 in Utah income tax in 2001;
$4.7 million more than in 1996 ($4.8 million).
SALES/FUELTAX
INCOME TAX
0TOTAL
TAXTOTAL
TAX
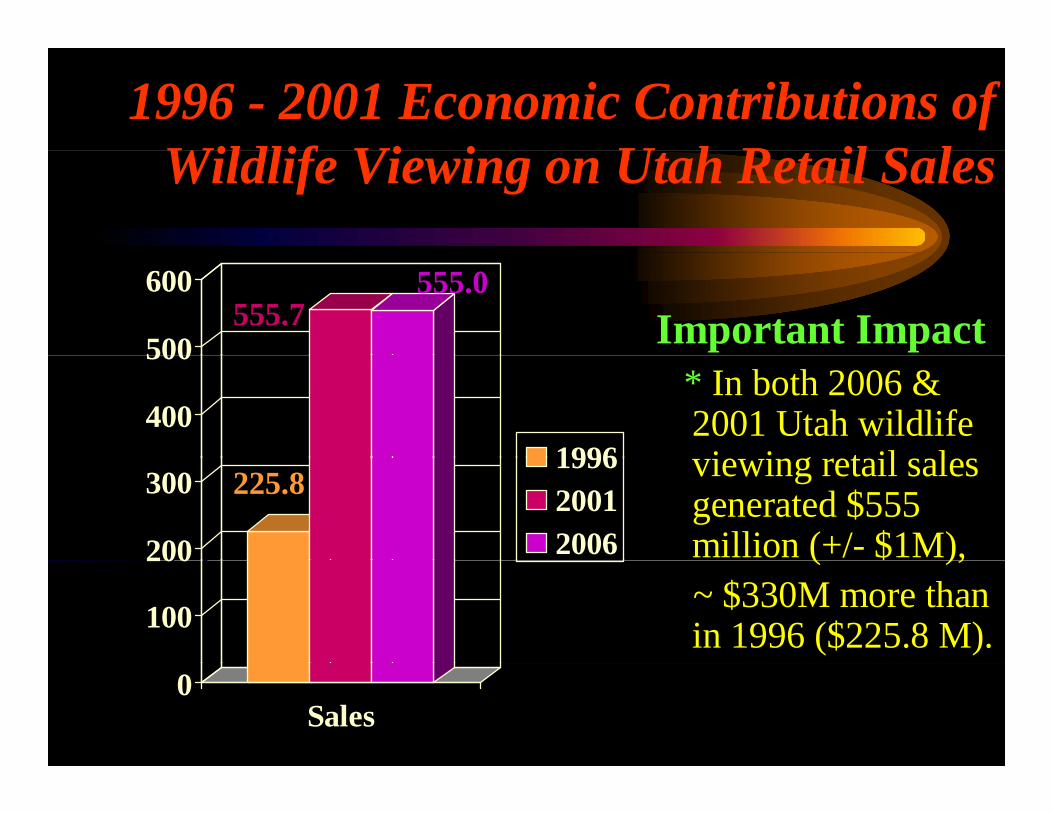
1996 - 2001 Economic Contributions of Wildlif Vi i U h R il S lWildlife Viewing on Utah Retail Sales
500
600
Important Impact555.7555.0
400
500
1996
* In both 2006 & 2001 Utah wildlife
i i t il l
200
300199620012006
viewing retail sales generated $555 million (+/- $1M),
225.8
100
200 ( ),~ $330M more than in 1996 ($225.8 M).
0Sales


1996 & 2001 Economic Contributions of Wildlife Viewing on Utah Jobsof Wildlife Viewing on Utah Jobs
Created/Maintained
1600018000 Important Impact
* I 2006 10
16,374
100001200014000
1996
* In 2006, over 10 thousand Utah jobs were created/sustained
10,569
60008000
10000 199620012006
were created/sustained 6K less than in 2001 (16,374) almost 4K
6,749
020004000
( , )more jobs than in 1996 (6,749).0
Jobs


Those who dwell, as scientists or laymen, among the beauties and mysteries of the earth are neverthe beauties and mysteries of the earth are never alone or weary of life.
YYour sage questions arewelcome!welcome!
