will british columbia’s new ndp government abandon past ... · rent fiscal position relative to...
TRANSCRIPT

fraserinstitute.org FRASER RESEARCH BULLETIN 1
F R A S E R RESEARCHBULLETIN
February 2018
�� In many respects, British Columbia can currently boast of having the soundest fiscal position of any Canadian province. While other provinces, including Ontario and Alberta, have struggled in recent years with comparatively large budget deficits and significant debt accu-mulation, BC recorded a $2.7 billion operating surplus last year (2016/17)—its fourth consecu-tive operating surplus and the largest positive fiscal balance among the provinces.
�� A key reason for BC’s favourable fiscal standing today is its relative spending disci-pline since 2001. After accounting for inflation and population, BC’s program spending in-creased at an average annual rate of 0.9 per-cent from 2002/03 to 2016/17—the lowest rate of any province. In Alberta and Ontario, pro-gram spending grew at faster annual rates—1.3 percent and 1.8 percent, respectively.
�� If BC had increased program spending at the same rate as Alberta, the province would today be spending approximately $54.5 billion instead of what it actually spent ($46.1 billion). If BC’s program spending had increased at the same rate as Ontario’s, its spending level would have been $55.0 billion—almost $9 billion higher than was in fact the case. If spending increas-es in BC had grown at the average rate of the Canadian provinces (excluding BC), program spending in 2016/17 would have been $56.4 bil-lion, approximately $10 billion more than the actual figure.
�� From 2001/02 to 2016/17, BC ran nine oper-ating budget surpluses and seven budget defi-cits, totaling an aggregate surplus of $10 billion over the period. Under each of the alternative spending scenarios, BC’s fiscal outcomes since 2001 would have been dramatically worse.
Summary
Will British Columbia’s New NDP Government Abandon Past Spending Discipline?by Charles Lammam, Ben Eisen, and Milagros Palacios

Will BC’s New NDP Government Abandon Past Spending Discipline?
fraserinstitute.org FRASER RESEARCH BULLETIN 2
tabled by the new BC government suggest the latter is a more likely scenario.
The bulletin is organized as follows. The first section provides a brief overview of British Co-lumbia’s current fiscal position. The next sec-tion compares BC’s spending trajectory over the past decade and a half to other provinces and finds that BC has demonstrated greater spending restraint than any other province over the period. The third section shows that spend-ing restraint has contributed to BC’s recent fis-cal success; it does so by estimating how BC’s budget balance would have looked under less restrained spending scenarios modeled on the spending trajectories of other provinces. The analysis focuses particularly on Alberta and On-tario. The concluding section discusses British Columbia’s September 2017 fiscal update, which signals that the new government’s approach to spending could mark a departure from the rela-tively prudent approach followed during most of the preceding 16 years.
British Columbia’s enviable current fiscal positionIn many respects, BC’s current fiscal position, both in dollar amounts as well as relative to the size of the economy, looks impressive when stacked up against the other provinces. 1 Com-
1 BC’s current favourable fiscal position was not always this way. During the 1990s, British Columbia’s economy generally suffered from lacklustre growth and poor fiscal performance. To bring the extent of BC’s fiscal and economic weakness into focus, consider that the 1990s have been referred to as the province’s “lost decade” (Clemens and Emes, 2001). In every year of the 1990s, British Columbia ran bud-get deficits—at a time when many other provinces were implementing successful fiscal consolidations and producing balanced budgets. Following the fis-cal consolidations of the early 1990s, nearly every
IntroductionIn many respects, British Columbia can cur-rently boast of having the soundest fiscal po-sition of any Canadian province. While several other provinces have struggled in recent years with comparatively large budget deficits and significant debt accumulation, BC recorded a $2.7 billion operating surplus last year (2016/17), the province’s fourth consecutive surplus bud-get. Moreover, this sound performance in bal-ancing operating budgets has contributed to BC’s relatively low government debt burden.
BC has not always enjoyed such an enviable fis-cal position within Confederation. During the 1990s, while many other jurisdictions across Canada were implementing successful fiscal consolidations that led to balanced budgets and debt reduction, BC struggled with an uninter-rupted string of operating deficits. Indeed, BC had the dubious distinction of being one of only two provinces that did not balance its bud-get at any point during the 1990s. (The other was Nova Scotia.) With weak budgetary per-formance and mediocre overall economic per-formance, the 1990s in BC have been referred to as the province’s “lost decade” (Clemens and Emes, 2001).
So how was BC able to dramatically reverse its relative fiscal standing within Canada? This bul-letin argues that relatively disciplined spend-ing management since 2001 is a key reason that BC has been able to strengthen its public fi-nances even as other large provinces, including Alberta and Ontario, have struggled. However, with a new provincial government elected last year, BC is now at a crossroads: it can either continue its path of relative fiscal prudence or follow the lead of the other provinces plagued by chronic fiscal mismanagement and ongo-ing budgetary challenges. Unfortunately, early signs from the September 2017 fiscal update

Will BC’s New NDP Government Abandon Past Spending Discipline?
fraserinstitute.org FRASER RESEARCH BULLETIN 3
paring budget balances helps to illustrate not just the very dissimilar fiscal conditions that have prevailed in different jurisdictions, but the relative strength of BC’s position compared to other provinces. In 2016/17 (the last fiscal year with historical data), British Columbia recorded a sizable $2.7 billion operating budget surplus. This was BC’s fourth consecutive surplus oper-ating budget. No other province has posted four consecutive balanced budgets in that period.
other province saw its net financial position (gov-ernment liabilities minus financial assets) relative to GDP either essentially hold steady or improve over the second half of the 1990s. BC, on the other hand, saw continued growth in its debt-to-GDP ratio through the second half of that decade.
As figure 1a shows, BC’s positive budget bal-ance in 2016/17 was the largest in dollar terms among the ten provinces. The figure also shows that BC is one of only three provinces to have recorded a surplus budget last year. (Quebec and Nova Scotia are the other two.) As a share of the provincial economy, BC’s budget balance further stands out as being the largest among the provinces at 1.0 percent of GDP (see figure 1b). Quebec’s operating surplus is the second largest, at 0.6 percent of its GDP, followed by Nova Scotia’s at 0.4 percent.
Another metric highlighting BC’s positive cur-rent fiscal position relative to other provinces is its net debt (government liabilities minus fi-nancial assets) -to-GDP ratio. By this measure of the sustainability of a government’s debt
Figure 1b: Budget Balance as a Percent of GDP, 2016/17
Sources: Canada, Department of Finance, Fiscal Reference Tables 2017; Provincial Public Accounts, 2016/17.
Sources: Canada, Department of Finance, Fiscal Reference Tables 2017; Provincial Public Accounts, 2016/17; Statistics Canada, CANSIM Table 384-0037; calculations by authors.
Figure 1a: Budget Balance (in $ millions), 2016/17
2,737 2,392
150
-1 -119-764 -991
-1,148-1,218
-10,784-$12,000
-$10,000
-$8,000
-$6,000
-$4,000
-$2,000
$0
$2,000
$4,000
BC QC NS PEI NB MB ON NL SK AB
1.0%
0.6%0.4%
0.0% -0.1%-0.3%
-1.1%
-1.6%
-3.4%-3.7%-4.0%
-3.0%
-2.0%
-1.0%
0.0%
1.0%
2.0%
BC QC NS PEI ON NB MB SK AB NL

Will BC’s New NDP Government Abandon Past Spending Discipline?
fraserinstitute.org FRASER RESEARCH BULLETIN 4
burden, BC maintained the third lowest rate in 2016/17 at 14.3 percent. As figure 2a illus-trates, only Saskatchewan (13.5 percent) and Alberta (2.8 percent) had lower debt-to-GDP ratios. Critically, however, both of these prov-inces are currently grappling with significant budget deficits and rapid debt accumulation in recent years (Eisen et al., 2017).2 Recent credit
2 A budget deficit in the government’s operating budget is just one reason why net debt may in-crease. A deficit in the capital budget, which in-cludes spending on infrastructure and is separate from day-to-day operations, is another reason for increasing government debt. It is possible for a gov-ernment to post a balanced—or even surplus—oper-ating budget but still increase its debt if it finances significant capital spending with debt. Indeed, this occurred in BC from 2013/14 to 2015/16, although net debt did fall in 2016/17.
downgrades underscore the fragility of public finances in both provinces, despite low current debt-to-GDP ratios. Given these immediate challenges in Saskatchewan and Alberta, BC’s overall financial position arguably ranks as the strongest in the country.
This conclusion is further supported when we focus on the amount of net debt that each citizen is responsible for, as illustrated in fig-ure 2b. In BC, the level of provincial net debt per person was just below $8,000—the sec-ond lowest of all the provinces behind only Al-berta (approximately $2,100) which, as noted, is adding new debt at a rapid pace. In fact, by 2019/20, the Alberta government forecasts that its net debt per capita will be larger than British Columbia’s (Eisen et al., 2017). Current-ly, BC’s per-person debt level is just 37 percent
Figure 2b: Net Debt per Capita, 2016/17
Sources: Canada, Department of Finance, Fiscal Reference Tables 2017; Provincial Public Accounts, 2016/17; Statistics Canada, CANSIM Table 384-0037; calculations by authors.
Sources: Canada, Department of Finance, Fiscal Reference Tables 2017; Provincial Public Accounts, 2016/17; Statistics Canada, CANSIM Table 051-0001; calculations by authors.
Figure 2a: Net Debt as a Percent of GDP, 2016/17
46.0%43.7%
40.4%38.0%
35.8%34.4%
33.4%
14.3%13.5%
2.8%
0%
10%
20%
30%
40%
50%
QC NL NB ON NS PEI MB BC SK AB
25,641
21,84121,583
18,25617,216
15,76514,530
8,8737,944
2,101
$0
$5,000
$10,000
$15,000
$20,000
$25,000
$30,000
NL QC ON NB MB NS PEI SK BC AB

Will BC’s New NDP Government Abandon Past Spending Discipline?
fraserinstitute.org FRASER RESEARCH BULLETIN 5
of Ontario’s, which was approximately $21,600 last year.
In short, BC has enjoyed a relatively positive fiscal position within Canada over the last sev-eral years. After struggling throughout the 1990s, BC has emerged as one of Canada’s best fiscal performers. It has consistently run oper-ating surpluses while several other provinces have regularly reported deficits and seen their underlying fiscal conditions deteriorate. More-over, BC currently maintains one of the low-est provincial government debt burdens in the country. The next section will examine the crit-ical role that spending restraint has played in driving these outcomes.
Past spending restraint: The key to BC’s fiscal success today To understand why BC’s fiscal performance has been relatively strong in recent years, it is nec-essary to consider the trend in government spending over the past decade and a half. In any given year, each province’s budget balance is driven by revenue and spending trajectories that have been shaped over a longer period of time. The positive effects of past policy choices, such as relative spending restraint in BC, can be realized in later years.3
3 Another contributing factor to BC’s strong fiscal performance has been relatively strong economic growth since 2001, which itself was buoyed by sound policy choices including prudent fiscal policy and more competitive tax rates (Dahlby and Ferede, 2008). From 2002 to 2016, BC’s average nominal an-nual economic growth rate was 4.5 percent, higher than the national rate (excluding BC) of 3.9 percent. With strong economic growth, governments benefit as revenues tend to increase as well. However, in BC’s case, revenue growth has been relatively mod-est despite a growing economy, in part due to tax reductions. Over the same period, nominal rev-
An examination of program spending (all spending excluding debt service payments) makes it clear that BC has exercised greater spending restraint than any other province over the past decade and a half. Figure 3 illustrates this by comparing nominal program spending growth in all 10 provinces between 2002/03 and 2016/17 (the last fiscal year with historical data available).4 The figure shows that nomi-nal program spending in British Columbia in-creased at an average annual rate of 3.5 percent over the period—the lowest rate of any prov-ince.5 Alberta had the highest rate of spending growth at 6.0 percent while Ontario’s rate was 4.9 percent.
Figure 4 further demonstrates that BC has ex-ercised greater spending restraint than any other jurisdiction in Canada. It compares pro-gram spending from 2002/03 to 2016/17 in all 10 provinces after accounting for inflation and population growth. BC’s inflation adjust-ed per-person spending increased by an an-nual average of just 0.9 percent, the lowest rate of increase in Canada. By comparison, infla-tion adjusted per-person spending in Alberta rose faster over the period, at an average rate
enue grew by an average annual rate of 4.1 percent compared to average revenue growth of 4.7 percent in the rest of Canada (years of major accounting changes are excluded from this average; see notes to figure 3 for details).
4 The fiscal year 2002/03 is selected as the first year of spending growth data since a change in the province’s fiscal direction occurred following the election of Gordon Campbell as premier in the fiscal year 2001/02 (Veldhuis and Lammam, n.d.).
5 This spending comparison includes only operat-ing spending, not capital spending. It is beyond the scope of this paper to examine which particular areas of spending were most and least restrained in BC and the specific driver(s) of the overall restraint.

Will BC’s New NDP Government Abandon Past Spending Discipline?
fraserinstitute.org FRASER RESEARCH BULLETIN 6
Figure 3: Average Program Spending Growth, 2002/03 – 2016/17
General note: Several provinces experienced breaks in the data due to accounting changes. For this reason, the years after the accounting change took place were excluded. See the specific notes below for details.
Specific notes: 1) Nova Scotia: Figures are on a non-consolidated basis. 2) Quebec: Due to a break in the series following the implementation of the accounting reform, data from 1997/98 onward, 2006/07 onward, and 2009/10 onward are not directly comparable with earlier years. The government has prepared con-solidated financial statements since 1997/98. From 2006/07 to 2008/09, the net results of the health and social services and education networks were established using the modified equity method. As of 2009/10, the revenue and expenditure of the networks are consolidated line by line, like those of non-budget-funded bodies and special funds. 3) Ontario: Due to a break in the series, data from 2001/02 onward are not directly comparable with earlier years. Notably, education property taxes are reported as revenue, whereas previously they were netted against expenditures. Amounts for 2015/16 and 2016/17 are not directly comparable with earlier years as they have been restated to reflect a presentation change for hospitals, school boards and colleges. Third-party revenue for these organizations, previously netted against sector expenses, is now classified as revenue. 4) Manitoba: Due to a break in the series following the move to summary account budgeting, data from 2003/04 onward are not directly comparable with earlier years. 5) Alberta: Data are not fully comparable due mainly to various changes to accounting standards. Major breaks in the series include:
• 1990/91 to 1992/93: expense excludes change in unfunded pension liabilities; net financial debt / (assets) does include unfunded pension liabilities;• 1993/94 to 2003/04: SUCH sector (school boards, universities and colleges, health entities) own-source revenue and expense, and assets and liabilities not included in numbers (grants to these entities are included in expense);• 2004/05 to 2007/08: SUCH sector included on “net equity” basis (net revenue included in revenue; net assets included in assets);• 2008/09 to 2016/17: SUCH sector included on “line-by-line” basis (revenue, expense, assets and liabilities reported in revenue, expense, assets and liabilities).
6) British Columbia: Due to a break in the series following the move to fully comply with generally accepted accounting principles, data from 1998/99 onward are not directly comparable with earlier years.
Sources: Canada, Department of Finance, Fiscal Reference Tables 2017; Provincial Public Accounts, 2016/17; calculations by authors.
6.0%5.5%
5.0% 5.0% 5.0% 4.9% 4.6%4.4%
4.1%
3.5%
0%
1%
2%
3%
4%
5%
6%
7%
AB SK NL MB NS ON PEI NB QC BC

Will BC’s New NDP Government Abandon Past Spending Discipline?
fraserinstitute.org FRASER RESEARCH BULLETIN 7
of 1.3 percent per year. In Ontario, real program spending growth during this period was faster still, at 1.8 percent per year.6
These differences in the annual spending growth rate between provinces may appear relatively small at first glance. However, com-pounded over time they have a substantial im-pact on a province’s overall spending level. Fig-
6 These average annual growth rates in spending exclude years in which major accounting changes occurred. For instance, the 2015/16 program spend-ing growth rate for Ontario was excluded from the average. Similarly, data for 2004/05 and 2008/09 were excluded for Alberta. If the data for those years were not excluded from the average, the real per capita spending growth rate would be the same in Alberta and Ontario (2.1 percent).
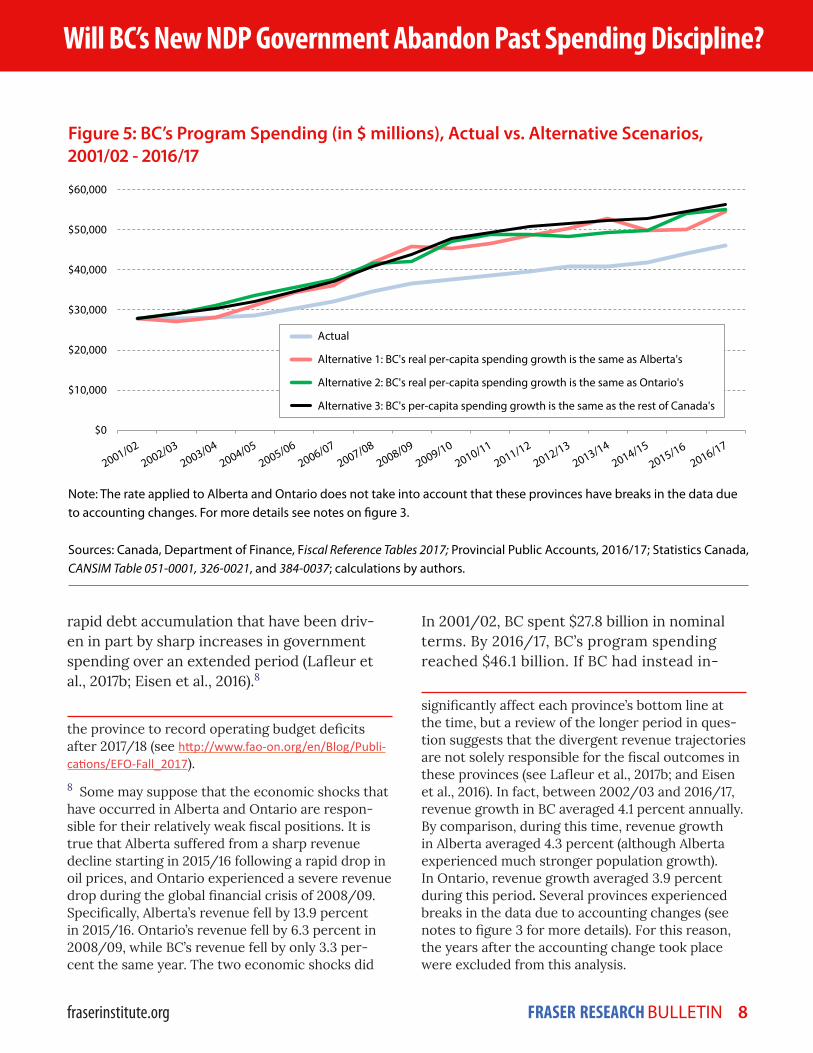
ure 5 illustrates this fact by comparing BC’s actual spending trajectory since 2001/02 to how spending would have evolved under other expenditure growth scenarios. For the other scenarios, we consider the spending paths in both neighbouring Alberta and in Ontario, Can-ada’s largest province, as well as the average of all the provinces minus BC. Alberta and Ontario are singled out because both of these compara-tively large and economically important prov-inces have faced persistent budget deficits7 and
7 Of note, the Ontario government expects to balance its operating budget for the first time in 2017/18 after nearly a decade of deficits. However, the province still plans to increase net debt by ap-proximately $10 billion in each of the next three years due to capital budget deficits. The govern-ment’s own Financial Accountability Office expects
Figure 4: Average Real Per-Capita Program Spending Growth, 2002/03 - 2016/17
Notes: See figure 3.
Sources: Canada, Department of Finance, Fiscal Reference Tables 2017; Provincial Public Accounts, 2016/17; Statistics Canada, CANSIM Table 051-0001 and CANSIM Table 326-0021; calculations by authors.
2.8% 2.8%
2.4% 2.4%
2.2%2.0%
1.8%
1.5%1.3%
0.9%
0.0%
0.5%
1.0%
1.5%
2.0%
2.5%
3.0%
NL NS SK NB MB PEI ON QC AB BC
Will BC’s New NDP Government Abandon Past Spending Discipline?
fraserinstitute.org FRASER RESEARCH BULLETIN 8
rapid debt accumulation that have been driv-en in part by sharp increases in government spending over an extended period (Lafleur et al., 2017b; Eisen et al., 2016).8
the province to record operating budget deficits after 2017/18 (see http://www.fao-on.org/en/Blog/Publi-cations/EFO-Fall_2017).
8 Some may suppose that the economic shocks that have occurred in Alberta and Ontario are respon-sible for their relatively weak fiscal positions. It is true that Alberta suffered from a sharp revenue decline starting in 2015/16 following a rapid drop in oil prices, and Ontario experienced a severe revenue drop during the global financial crisis of 2008/09. Specifically, Alberta’s revenue fell by 13.9 percent in 2015/16. Ontario’s revenue fell by 6.3 percent in 2008/09, while BC’s revenue fell by only 3.3 per-cent the same year. The two economic shocks did
In 2001/02, BC spent $27.8 billion in nominal terms. By 2016/17, BC’s program spending reached $46.1 billion. If BC had instead in-
significantly affect each province’s bottom line at the time, but a review of the longer period in ques-tion suggests that the divergent revenue trajectories are not solely responsible for the fiscal outcomes in these provinces (see Lafleur et al., 2017b; and Eisen et al., 2016). In fact, between 2002/03 and 2016/17, revenue growth in BC averaged 4.1 percent annually. By comparison, during this time, revenue growth in Alberta averaged 4.3 percent (although Alberta experienced much stronger population growth). In Ontario, revenue growth averaged 3.9 percent during this period. Several provinces experienced breaks in the data due to accounting changes (see notes to figure 3 for more details). For this reason, the years after the accounting change took place were excluded from this analysis.
Figure 5: BC’s Program Spending (in $ millions), Actual vs. Alternative Scenarios, 2001/02 - 2016/17
Note: The rate applied to Alberta and Ontario does not take into account that these provinces have breaks in the data due to accounting changes. For more details see notes on figure 3.
Sources: Canada, Department of Finance, Fiscal Reference Tables 2017; Provincial Public Accounts, 2016/17; Statistics Canada, CANSIM Table 051-0001, 326-0021, and 384-0037; calculations by authors.
$0
$10,000
$20,000
$30,000
$40,000
$50,000
$60,000
Actual
Alternative 1: BC's real per-capita spending growth is the same as Alberta's
Alternative 2: BC's real per-capita spending growth is the same as Ontario's
Alternative 3: BC's per-capita spending growth is the same as the rest of Canada's

Will BC’s New NDP Government Abandon Past Spending Discipline?
fraserinstitute.org FRASER RESEARCH BULLETIN 9
creased its rate of program spending at the same pace as Alberta did during this period, after adjusting for inflation and population growth the province would today be spending approximately $54.5 billion instead of what it actually spent ($46.1 billion). A comparison with Ontario yields a similar result. If pro-gram spending in BC had grown at the same real per capita growth rate as in Ontario, BC’s spending level in 2016/17 would have been $55.0 billion—almost $9 billion higher than it was. If spending increases in BC had grown at the average rate of the Canadian provinces (excluding BC), program spending in 2016/17
would have been $56.4 billion, approximately $10 billion more than the actual figure.9
To summarize, BC has exercised greater over-all spending restraint than other jurisdictions in Canada since 2001/02. If BC had pursued a spending trajectory more closely aligned with other provinces, specifically Alberta and Ontar-
9 For the alternative spending scenarios, the data do not exclude years with accounting changes. The analysis assumes BC follows the same spending pat-tern as Alberta and Ontario including their account-ing changes.
Figure 6: BC’s Budget Balance (in $ millions), Actual vs. Alternative Scenarios, 2001/02 – 2016/17
Sources and note: See figure 5.
-$14,000
-$12,000
-$10,000
-$8,000
-$6,000
-$4,000
-$2,000
$0
$2,000
$4,000
$6,000
Actual
Alternative 1: BC's real per-capitaspending growth is the same as Alberta's
Alternative 2: BC's real per-capitaspending growth is the same as Ontario's
Alternative 3: BC's per-capita spendinggrowth is the same as the rest of Canada's
Will BC’s New NDP Government Abandon Past Spending Discipline?
fraserinstitute.org FRASER RESEARCH BULLETIN 10
io, program spending today in BC would be sub-stantially higher than it is. The next section will turn to the implications of spending restraint for BC’s budget balance (ie., deficit or surplus).
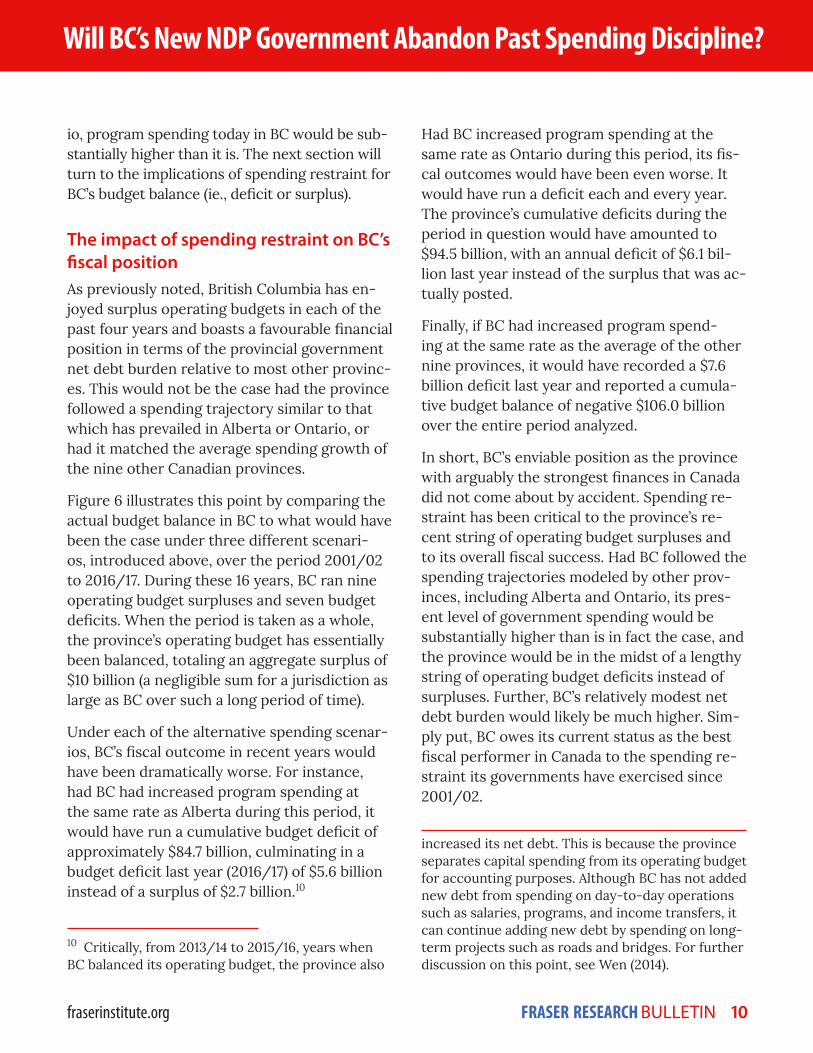
The impact of spending restraint on BC’s fiscal positionAs previously noted, British Columbia has en-joyed surplus operating budgets in each of the past four years and boasts a favourable financial position in terms of the provincial government net debt burden relative to most other provinc-es. This would not be the case had the province followed a spending trajectory similar to that which has prevailed in Alberta or Ontario, or had it matched the average spending growth of the nine other Canadian provinces.
Figure 6 illustrates this point by comparing the actual budget balance in BC to what would have been the case under three different scenari-os, introduced above, over the period 2001/02 to 2016/17. During these 16 years, BC ran nine operating budget surpluses and seven budget deficits. When the period is taken as a whole, the province’s operating budget has essentially been balanced, totaling an aggregate surplus of $10 billion (a negligible sum for a jurisdiction as large as BC over such a long period of time).
Under each of the alternative spending scenar-ios, BC’s fiscal outcome in recent years would have been dramatically worse. For instance, had BC had increased program spending at the same rate as Alberta during this period, it would have run a cumulative budget deficit of approximately $84.7 billion, culminating in a budget deficit last year (2016/17) of $5.6 billion instead of a surplus of $2.7 billion.10
10 Critically, from 2013/14 to 2015/16, years when BC balanced its operating budget, the province also
Had BC increased program spending at the same rate as Ontario during this period, its fis-cal outcomes would have been even worse. It would have run a deficit each and every year. The province’s cumulative deficits during the period in question would have amounted to $94.5 billion, with an annual deficit of $6.1 bil-lion last year instead of the surplus that was ac-tually posted.
Finally, if BC had increased program spend-ing at the same rate as the average of the other nine provinces, it would have recorded a $7.6 billion deficit last year and reported a cumula-tive budget balance of negative $106.0 billion over the entire period analyzed.
In short, BC’s enviable position as the province with arguably the strongest finances in Canada did not come about by accident. Spending re-straint has been critical to the province’s re-cent string of operating budget surpluses and to its overall fiscal success. Had BC followed the spending trajectories modeled by other prov-inces, including Alberta and Ontario, its pres-ent level of government spending would be substantially higher than is in fact the case, and the province would be in the midst of a lengthy string of operating budget deficits instead of surpluses. Further, BC’s relatively modest net debt burden would likely be much higher. Sim-ply put, BC owes its current status as the best fiscal performer in Canada to the spending re-straint its governments have exercised since 2001/02.
increased its net debt. This is because the province separates capital spending from its operating budget for accounting purposes. Although BC has not added new debt from spending on day-to-day operations such as salaries, programs, and income transfers, it can continue adding new debt by spending on long-term projects such as roads and bridges. For further discussion on this point, see Wen (2014).

Will BC’s New NDP Government Abandon Past Spending Discipline?
fraserinstitute.org FRASER RESEARCH BULLETIN 11
Is BC set to abandon spending discipline in the years ahead?As this bulletin has shown, relative spending restraint over an extended period of time has helped BC achieve its current enviable fiscal position among the provinces. However, there is reason to be concerned that the BC govern-ment may be poised to abandon the fiscal re-straint that has served the province so well. In July 2017, a new NDP minority government was officially formed with the support of the Green Party.11 During the election campaign, both par-ties in the coalition made expensive platform promises which, if implemented, could signifi-cantly increase the rate of spending growth in the province in the next few years. A prominent example is the NDP’s plan to implement a $10 per day subsidized day care program, which the election platform estimated would cost $855 million over three years (NDP, 2017).
Early indications suggest the new government will govern as it campaigned and at least par-tially abandon BC’s long-term commitment to relative spending restraint. In February, the then-governing Liberals tabled a budget that projected program spending growth of 2.1 per-cent during the 2017/18 fiscal year and aver-aging 1.5 percent (in nominal terms) between 2017/18 and 2019/20.12 In short, the Liberals’
11 A government’s political stripe does not necessar-ily predict whether it will be prudent in restraining spending. Indeed, a prominent example of prudent managment of government spending comes from Saskatchewan and the NDP government under Roy Romanow. The Romanow government was among the first governments in Canada in the 1990s to re-strain and reduce spending to tackle chronic budget deficits (Clemens et al., 2017).
12 Notably, this would have represented greater restraint on spending growth than the govern-ment had shown in the previous three years. From
February budget called for a continuation of the policy of spending restraint. Following the election, the new government tabled its own fiscal update with a markedly different plan (see figure 7). The September 2017 fiscal update called for 6.6 percent annual program spend-ing growth in 2017/18. In fact, the September update called for an additional $4.4 billion in cumulative program spending from 2017/18 to 2019/20. While the fiscal update forecasts a re-turn to restraint in subsequent years, the large spending increase in the new government’s first year in office raises questions about whether a return to discipline and restraint will in fact
2014/15 to 2016/17, BC’s program spending in-creased at an annual rate of 4.1 percent compared to the average of 2.2 percent among the other provinc-es. Still, the February budget signaled that the gov-ernment was at least planning on greater restraint.
Figure 7: BC’s Program Spending (in $ millions): February 2017 Budget vs. September 2017 Update
Sources: British Columbia, Ministry of Finance, 2017a, 2017b and 2017c.
$44,000
$45,000
$46,000
$47,000
$48,000
$49,000
$50,000
$51,000
2016/17 2017/18 2018/19 2019/20
Feb 2017 Budget Sept 2017 Update
Cumulative difference:$4.4 billion

Will BC’s New NDP Government Abandon Past Spending Discipline?
fraserinstitute.org FRASER RESEARCH BULLETIN 12
come to pass. This is especially dubious given that the government has not yet provided de-tails of how it will fund many of the commit-ments it made on the campaign trail (Clemens and Veldhuis, 2017).
ConclusionBritish Columbia’s status as one of Canada’s top fiscal performers in recent years represents a remarkable reversal from its standing at the turn of the century, when it was coming off of a “lost decade” during which it failed to bal-ance its budget even once. This turnaround did not occur by accident. In large measure it is a result of a long-term approach to fiscal policy anchored by the principle of spending restraint and lower rates of spending growth than have prevailed in other provinces. If BC is now pre-paring to end its era of spending restraint, it may also be preparing to end its era of enjoying public finances that are among the strongest in Confederation.
References
Alberta, Ministry of Finance (2017a). Public Ac-counts 2016-17. Government of Alberta.
Alberta, Ministry of Finance (2017b). 2017-18 Second Quarter Fiscal Update and Economic Statement. Government of Alberta.
BC New Democratic Party [NDP] (2017). Work-ing For You: 2017 BC NDP Platform. BC NDP. <https://action.bcndp.ca/page/-/bcndp/docs/BC-NDP-Platform-2017.pdf>, as of Janu-ary 29, 2018.
British Columbia, Ministry of Finance (2017a). Public Accounts 2016/17. Government of Brit-ish Columbia.
British Columbia, Ministry of Finance (2017b). Budget and Fiscal Plan 2017/18 - 2019/20 (Feb-ruary). Government of British Columbia.
British Columbia, Ministry of Finance (2017c). 2017/18 Second Quarterly Report. Government of British Columbia.
Canada, Department of Finance (2017). Fis-cal Reference Tables. Government of Canada. <https://www.fin.gc.ca/frt-trf/2017/frt-trf-17-eng.asp>, as of January 10, 2018.
Clemens, Jason, and Joel Emes (2001). Return-ing British Columbia to Prosperity. Public Policy Sources, number 47. Fraser Institute. <https://www.fraserinstitute.org/sites/de-fault/files/ReturningBCtoProsperity.pdf>, as of January 10, 2018.
Clemens, Jason, Milagros Palacios, Mathew Lau, and Niels Veldhuis (2017). End of the Chretien Consensus? Fraser Institute. <https://www.fra-serinstitute.org/sites/default/files/Chretien_Consensus_Book.pdf>, as of Jan. 29, 2018.
Clemens, Jason, and Niels Veldhuis (2017, Sep-tember 30). B.C. Provincial Finances Precari-ous After Just a Few Months of NDP Gov-ernance. Fraser Forum Blog. <https://www.fraserinstitute.org/article/bc-provincial-fi-nances-precarious-after-just-a-few-months-of-ndp-governance>, as of January 10, 2018.
Dahlby, Bev, and Ergete Ferede (2008). Assess-ing British Columbia’s Incentive-Based Tax Cuts. Studies in Economic Prosperity, number 5. Fraser Institute. <https://www.fraserinsti-tute.org/sites/default/files/AssessingBC-TaxCuts.pdf>, as of January 29, 2018.
Eisen, Ben, Charles Lammam, and Milagros Pa-lacios (2016). Spending is the Source of On-tario’s Deficit and Debt Problem. Research Bulletin. The Fraser Institute. <https://www.fraserinstitute.org/sites/default/files/spending-is-the-source-of-ontarios-deficit-and-debt-problem.pdf>, as of Jan. 10, 2018.

Will BC’s New NDP Government Abandon Past Spending Discipline?
fraserinstitute.org FRASER RESEARCH BULLETIN 13
Eisen, Ben, Charles Lammam, and Feixue Ren (2017). Canada’s Past Fiscal Leaders Are Now Fiscal Laggards: An Analysis of 2017 Provincial Budgets. The Fraser Institute. <https://www.fraserinstitute.org/sites/default/files/can-adas-past-fiscal-leaders-are-now-fiscal-lag-gards.pdf>, as of January 29, 2018.
Lafleur, Steve, Ben Eisen, and Milagros Palacios (2017a). Race to the Bottom: Comparing the Re-cent Deficits of Alberta and Ontario. Research Bulletin. The Fraser Institute. <https://www.fraserinstitute.org/sites/default/files/race-to-the-bottom-comparing-the-recent-defi-cits-of-alberta-and-ontario.pdf>, as of Janu-ary 10, 2018.
Lafleur, Steve, Ben Eisen, Milagros Palacios, and Charles Lammam (2017b). Alberta’s Budget Deficit: Why Spending Is to Blame, 2017. Re-search Bulletin. The Fraser Institute. <https://www.fraserinstitute.org/sites/default/files/albertas-budget-deficit-why-spending-is-to-blame-2017.pdf>, as of January 10, 2018.
Manitoba, Ministry of Finance (2017). Public Ac-counts of Manitoba. Government of Manitoba.
New Brunswick, Department of Finance (2017). Public Accounts. Government of New Brunswick.
Newfoundland & Labrador, Department of Fi-nance (2017). Public Accounts. Government of Newfoundland & Labrador.
Nova Scotia, Department of Finance (2017). Pub-lic Accounts of the Province of Nova Scotia. Government of Nova Scotia.
Ontario, Ministry of Finance (2017a). Public Ac-counts of Ontario. Government of Ontario.
Ontario, Ministry of Finance (2017b). Ontario Economic Outlook and Fiscal Review. Govern-ment of Ontario.
Prince Edward Island, Department of Finance (2017). Public Accounts. Government of Prince Edward Island.
Québec, Ministère des Finances (2017a). Public Accounts. Government of Québec.
Québec, Ministère des Finances (2017b). The Quebec Economic Plan—November 2017 Up-date. Government of Québec.
Saskatchewan, Ministry of Finance (2017). Public Accounts. Government of Saskatchewan.
Statistics Canada (annual). CANSIM Table 051-0001: Estimates of Population, by Age Group and Sex for July 1, Canada, Provinc-es and Territories. Government of Cana-da. <http://www5.statcan.gc.ca/cansim/a26?lang=eng&id=0510001>, as of Jan. 10, 2018.
Statistics Canada (annual). CANSIM Table 326-0021: Consumer Price Index (CPI). Government of Cana da. <http://www5.statcan.gc.ca/can-sim/a26?id=326002101>, as of Jan. 10, 2018.
Statistics Canada (annual). CANSIM Table 384-0037: Gross Domestic Product, Income-Based, Provincial and Territorial. Government of Cana da. <http://www5.statcan.gc.ca/can-sim/a26?lang=eng&id=3840037>, as of Janu-ary 10, 2018.
Veldhuis, Niels, and Charles Lammam (2009, April 27). Pro-growth Policies Helped B.C. Succeed. Vancouver Sun. <https://www.fra-serinstitute.org/article/pro-growth-policies-helped-bc-succeed>, as of January 10, 2018.
Wen, Jean-François (2014). Capital Budgeting and Fiscal Sustainability in British Columbia. The Fraser Institute. <https://www.fraserin-stitute.org/sites/default/files/capital-bud-geting-and-fiscal-sustainability-in-british-columbia.pdf>, as of January 10, 2017.

Will BC’s New NDP Government Abandon Past Spending Discipline?
fraserinstitute.org FRASER RESEARCH BULLETIN 14
Milagros Palacios is the Associate Director of the Addington Centre for Measurement at the Fraser In-stitute. She holds a BSc in Indus trial Engineering from the Pon tifical Catholic University of Peru and an MSc in Economics from the Univer-sity of Concepción, Chile. She has published or co-published over 100 research studies and over 80 com-mentaries on a wide range of public policy issues.
Ben Eisen is Director of Provincial Prosperity Studies at the Fraser In-stitute. He holds a BA from the Uni-versity of Toronto and an MPP from the University of Toronto’s School of Public Policy and Governance. Mr. Eisen has published influential stud-ies on several policy topics, including intergovernmental relations, public finance, and higher education policy. He has been widely quoted in major Canadian newspapers.
Charles Lammam is Director of Fis-cal Studies at the Fraser Institute. He has published over 100 studies and 400 original articles on a wide range of economic policy issues. He holds an MA in public policy and a BA in economics with a minor in business administration from Simon Fraser University.
AcknowledgmentsThe authors wish to thank Fraser Institute senior policy analyst Hugh MacIntyre for his research assistance. They also thank the anonymous reviewers for their sugges-tions and feedback. Any remaining errors or oversights are the sole responsibility of the authors. As the researchers have worked in-dependently, the views and conclusions ex-pressed in this paper do not necessarily re-flect those of the Board of Directors of the Fraser Institute, the staff, or supporters.
Copyright © 2018 by the Fraser Institute. All rights re-served. Without written permission, only brief passag-es may be quoted in critical articles and reviews.
ISSN 2291-8620
Media queries: For media enquiries, please contact our communications department via e-mail: [email protected]; telephone: 604.714.4582. In Toronto, contact our media specialist via telephone at 416.363.6575, ext. 238.
Support the Institute: call 1.800.665.3558, ext. 574 or e-mail: [email protected]
Visit our website: www.fraserinstitute.org