william a. orme working paper series - college of ... exchanges entirely independent of each other....
TRANSCRIPT

College of Business Administration
University of Rhode Island
2011/2012 No. 9
This working paper series is intended tofacilitate discussion and encourage the
exchange of ideas. Inclusion here does notpreclude publication elsewhere.
It is the original work of the author(s) andsubject to copyright regulations.
WORKING PAPER SERIESencouraging creative research
Office of the DeanCollege of Business AdministrationBallentine Hall7 Lippitt RoadKingston, RI 02881401-874-2337www.cba.uri.edu
William A. Orme
Xia Pan, Kebing Li, and Jeffrey E. Jarrett
and Hong Kong H-Shares of Dual-Listed CompaniesThe Relationship of High Frequency Interactions between Chinese A-Shares

The Relationship of High Frequency Interactions between Chinese A-Shares and Hong Kong H-Shares of Dual-Listed
Companies
Xia Pan, PhD Lingnan College, Sun Yat-sen University
Kebing Li
Lingnan College, Sun Yat-sen University
Jeffrey E. Jarrett,PhD*
University of Rhode Island
(Sep 19, 2011) *Corresponding Author

The Relationship of High Frequency Interactions between Chinese A-Shares and Hong Kong H-Shares For Dual-Listed Companies
Abstract
Previous studies showed that Chinese equity markets interact with those other equity
markets in Asia and the larger equity markets of developed Western Nations. Established in
1992, the Chinese equity markets grew to become the second largest equity markets after the
United States. The Chinese equity changed in an evolutionary manner with the decrease in
State owned shares and from CEPA to QDII. However, equity markets still display
somewhat immature characteristics. Hence, our purpose is to determine the co integration of
Chinese A-shares with that of Hong Kong H-shares, and on how it relates to the functions of
finance, including investment strategy and/or arbitrage. Implementing Granger Causality (GE)
and the Vector Error Correction Model (VECM), this manuscript pragmatically studies on 44
cross-listed firms. The data examined is high frequency and, in turn , we utilize arbitrage to
confirm the comovement of cross-listed companies under the application of VECM. The
results indicate an expected degree of correlation between the two equity markets in the
short-term. For the long-term, we find co integration for the firms sampled in the two equity
markets. This last result suggests slow movement in the adjustments by the equity markets to
each other.
【Keywords】:
A-shares, H-shares, Unit Root, Co integration,
Vector Error Correction Model (VECM), Arbitrage

1 Introduction
The Chinese equity markets are no longer among the mysteries of finance and
investments due to a large amount of literature in the past several decades. Jarrett, Pan and
Chen (2009), studied the relationship of the Chinese equity markets (Shanghai and Shenzhen)
to that if the Macroeconomy of China. Thomas (2001) discussed in great detail characteristics
of the Shanghai market over its illustrious and ever-changing history offering insights into the
characteristics of the market. Others (Eun and Huang, 2007; Ng and Wu, 2007; Shenoy and
Ying, 2007; Weilli et al., 2009, Wang et al., 2004; and Wang et al., 2007) investigated the
growth in the Chinese equity markets became increasingly important for global investors.
Bailey et al. (2006) studied the Shanghai equity market and discovered characteristics
concerning order balances of individuals and institutional investors. Jarrett and Kyper (2011)
examined anomalies in the Chinese markets that were seen earlier in the m ore developed
markets of the Western nations. Finally, Chen and Jarrett (2011) examined the market
efficiency of Chinese markets during different periods of decline and growth in the Chinese
economy.
The rapid changes in the Chinese economy, equity markets and its integration in the
neighboring markets in Asia and the influences of the established western equity markets
created the great interest and speculation with regard to Chinese equities. Hence, many
Chinese firms wish to list in the Hong Kong market as well as the growing Shanghai market.
This strategy confirmed their competitive status and enabled investors to purchase equity
shares of Chinese firms not heretofore possible in non-Chinese markets. Hence, the equity
shares became universally available in a manner similar to the characteristics of the western
equity markets. Accordingly, Cross listings (relying heavily on information from the
depositary banks to create depository receipt programs) achieved great importance in the
international financial markets, and studies correlation with them are going to be a major
theme in financial field [ See Karolyi (1998)). Studies by Lee (1991), Torabzadeh, Bertin and
Zivney (1992), Damodoran, Liu and Van Harlow (1993), Varela and Lee (1993b), and Lau,
Diltz and Apilado (1994) which all found the evidence that share price reactions to
cross-listing decisions. Fanto and Karmel (1997) surveyed managers of a number of firms
that listed as an American Depositary Receipt(ADR), in the United States and reported that
managers cited increased access to new capital as one of the most important motivations for
pursuing overseas listings. Karolyi (1998) provides an exhaustive review of the theories and
empirical tests of international cross-listing. Foerster and Karolyi (1999) and Miller (1999)
found changes in the informational environment of cross-listed firms that influence listing
decisions
The Shanghai Stock market, with only about 20 years history, appears somewhat
fledgling and irregular with respect to the New York Stock Market. According to China’s
security statutes, the Chinese corporations may list only in three ways:
(1) Domestically, listed domestic capital stocks, or A shares, which priced and are
settled in Chinese currency.
(2) In January, 2002, the Qualified Foreign Institutional Investors (QFII) opened up
equity markets in China by supplying access to invest in the “A” share market
for foreign institutional investors. In turn, these share were domestically listed
as foreign-investment shares, or “B” shares, which priced in Chinese currency

but traded in foreign currency.
(3) Overseas listed foreign equity markets including “H” shares (listed in Hong
Kong), “N” shares New York and S shares in Singapore. For example, H
shares are priced the par-value (Chinese currency) and transacted in Hong
Kong dollars.
Chinese equity markets experienced a rapid increase in volume upon implementing the
new strategy. By the end of 2009, the total market capitalization of A shares increased to
24.27 trillion RMB (Chinese currency) (or 3.57 trillion U.S. Dollars) which represented a
doubling in size and exceeded the size of the Japanese equity market which had been the
second largest equity market for many years.
Following the implementation of the above strategy, cross-listed firms made changes to
their capital structure. These changes were related to the opening of global equity markets to
otherwise only locally listed firms. A question arises as to the effects of being listed twice on
two different markets. In particular, the markets in Shanghai and Hong Kong, although
relatively close in global geography, may have differing effects (specifically prices) on the
firms that cross-listed. We focus on the differing prices of shares in both of these markets.
That is, do these share prices react to each other or are the prices of cross-listed firms on two
Asian exchanges entirely independent of each other. With the economic relationship
between Hong Kong (HK) and China (MC) increasingly close, more and more mainland
enterprises chose the Hong Kong stock market to advance their initial offerings as a first step
in the capitalization process. For example, since HK has international status and normative
market mechanisms, on July 15, 1993, the first domestic company, TSINGTAO BREW,
listed on the Stock Exchange of Hong Kong (SEHK). By March, 2009, sixty-six Chinese
incorporated enterprises listed on the SHE by the issuance of H-shares. Recently, many
H-shares listed firms, [56 by March, 2009] refinanced on the Shanghai or Shenzhen stock
exchanges in China through the issuance of A-shares. This trend not only appears in the
capital demand of firms, but also represents the increasing attractiveness of the A-shares
market as shown in Table 1 below:
Table 1
Increase in Firms using A-shares and H-shares over a twenty-six year period.

1993-1996 1997-2000 2001-2004 2005-2009
A listed 13 7 12 24
H listed 18 15 7 16
Cross listed 13 5 11 27
Fong found a combination of micro and macro factors, that accounted for the difference
in prices of cross-listed securities in these two markets (Fong et al. ,2007). In turn, the
co-movement between both markets was considered important factors by large investment
institutions, especially offshore hedge funds in evaluating the performance of cross-listed
firms. These evaluations were made by both qualified Foreign Institutional Investors (QFII)
and qualified domestic institutional investors (QDII). Sun et al. (2000) indicated that
restrictions by similar macroeconomic factors, an inevitable connection exists among the
H-shares, the Chinese firms listed in Hong Kong, but based and controlled in MC. Thus, the
movements in A-shares and H-shares should be related to each other. Poon et al. (2000)
provides evidence that there is a stable inherent relationship among the H-shares, i.e., the
“red-chip” markets in Hong Kong, and the and A-shares market. Chong and Qian (2006)
found that only a small portion of the cross-listed Chinese companies have a co-movement in
their A- and H-share prices and that the stock markets of MC and HK are segmented. On the
other hand, Han and Dezong (2006) believe that QDII will be one of the important institutions
which would remove the segmentation of the A and H shares markets. By implementing a
co-integration analysis and test, Chong et al., (2007) speculated that the current Closer
Economic Partnership Arrangement (CEPA) between MC and HK resulted in the prices of a
substantial number of A shares and H shares to begin to co integrate. Also, they pointed out
that the stock market co-movements between dual-listed firms contributed to the increased
financial openness of these firms. Zeng and Luo (2009) indicated that the correlation between
the A-shares and the H-shares markets is dynamic but not asymmetric. Further, Zhou and Wei
(2009) found that movements in Shanghai stock market in part explain movements in the
Hong Kong market. Xu (2010) indicated that the share reform in MC caused the increase the
interactivity of A and H-shares. By exploring 30 cross-listed firms, Ma et al. (2010) found tha
prices of these same firms became increasingly co-integrated resulting in an improvement in
MC equity market.
From its establishment in 1992, China’s equity markets became the second largest of the
global equity markets in the world. In part, this is related to the decrease in State-owned
shares and from a CEPA to QDII type equity market. Next, we wish to identify and account
for the cointegreation of the Shanghai and Hong Kong Equity markets and does this co
integration result in greater openness and the evolution of the MC to a fully developed market.
Our task is to determine the extent of co integration and would it result on greater

internationalization of it’s a-shares. Using the Granger Causality Test and Vector Error
Correction Model, the remainder of this manuscript focuses on a study on 44 cross-listed
firms containing adequate data. The data is high frequency. Finally, the data is subjected to an
arbitrage test to confirm the co-movement of cross-listed firms under the practical application
of the VECM.
2 Co integration Analysis and tests and equity markets
Granger (1981) advanced co integration analysis for its use studying relationships
between different sets of data. Specifically, when studying equity markets, one wants to
determine the correlation among equity market data and strategies to diversify one’s portfolio
to avoid risks associated with investing in capital assets. Grangers methods permit one to
determine if one can find what is now called the “Granger cause’ on one action with respect to
a second action. The analsyst employs Granger methods to ascertain whether long-term
equilibrium relationship and short-term interaction exists in equity markets of different
nations.
This method was used previously by Meric (2001) who applied the relevant examination
and factor analysis method to study Argentina, Brazil, Chile and Mexico, i.e., the four biggest
Latin American equity markets. He observed that among the four equity markets, there
relation rose ceaselessly. Also, investors should pay more attention on individual share prices
rather than an index number for price change.
In addition, Pascual (2003) utilized tests for unit root to indicate that the equity markets
of Britain, France and Germany do not demonstrate that they have increasing co integration.
Darne (2004) expanded the use of the maximum likelihood co integration method. He studied
both seasonally adjusted and unadjusted time series, as well as time series with other periodic
adjustments. After inspection, the seasonally adjusted time series indicated that a strong co
integration exists between American manufacturing industry data and that of its stock price.
Utilizing the time sequence relevant method for equity market time series data for the
United States, Great Britain, Germany and Japan, Morana and Beltrattib (2008) observed that
stock prices, the rate of return and the coefficient of fluctuation, have convergent positive
correlations, and that the linkage strengthens ceaselessly.
Through the massive theories and the empirical study, the domestic and foreign scholars
have proven that under segment market conditions the cross-listing stock appear with price
differentials in each equity market. The overseas investor will observe a high price than that
of the domestic investor. On the other hand, Bailey (1994), Sun and Tong (2000), Wang and
Jiang (2004) and Mei, Scheinkman and Xiong (2005)’ s studies indicated that this
phenomenon was not true. They indicated that A- share prices possessed a long-term
premium in comparison to H-shares. This phenomenon is called, by Bailey, Chung and Kang

(1999) and Fernald and Rogers (2002), “the discount puzzle in H- share market.” We need to
resolve this issue by the methods Granger and verify its results.
Use the Granger causality analysis, Aaltonen and Östermark (1997) studied the early
1990s Japan equity market's impact on the Finish equity market and found Granger causality.
This was an early introduction of Granger causality test into equity market. Pan, Jarrett and
Chen (2009) also utilized Granger causality in studying Chinese equity market and
macroeconomic. Hence the use of Granger causality is well established in financial time
series research and analysis.
Further, Bonfiglioli (2005), studied financial market time series from the United States
and Germany. They produced a VECM from their results which indicated that both financial
markets do not possess a long-term mutually interdependent relation. Instead they possess
short-term interdependence relations, namely the short-term fluctuation of the US stock price
overflows to the Germany stock price.
By applying component analysis and Grange causality, Meric(2008) analyzed the co
integration relationship under both bull and bear market condition among four developed
stock exchanges, i.e., Great Britain, Germany, France and Japan. He found a strong
cointegreation in bull markets but a more limited result for bear markets. Another example of
this analysis can be found by Vazquez (2008).
3 The Methodology
The phenomenon that a foreign capital stock discount appears in China Stock market data was
first researched by Bailey (1994) when he aimed at A- and B- shares. He verified, using
Granger causality, the interaction between the two time series. Also, using regression analysis,
Bailey explained the factors that influenced the spread in the prices in the two financial
markets. Lee (1991) proposed investor sentiment expresses the resons for the price spread
based from a behavioral viewpoint.
Wang Qunyong and Wu Na (2004)’s studies indicated that both A- and H-share prices
are a first-order difference variable. The panel cointegreation test indicated that A and H
prices are co integrated and maintain the equilibrium during the long-term although other
factors exist. Based on the monthly data from June, 2001, to May, 2003, Wang Weian and Bai
Na (2004) established other factors for difference in the prices of af the A- and H-shares.
Using the multivariable cointegration test, Pan and Wu (2005) empirically studied the
relationship among the H-shares, the “red-chip” markets in Hong Kong and A-shares market.
They determined that a long-term stability cointegration relation existed in these markets and
this balanced relation is strengthened after B-shares open for trading. Wu also used VECM
Granger causality. Others utilized the Granger and con integration methods to analyze the
relation between A- and H- shares and they include Yang et al. (2006), Chen and Xie (2007),

and Liu (2007).
In each case they studied the interaction of data on A- and H-shares and looked at
interaction occurring in high frequency. High frequency interaction is the focus of this study
because it is with these transactions that we can see the immediate effects on changes in one
market as it affects the other without environmental and other factors influencing chare prices.
Accordingly, we select 5 minute and 1 minute intervals and will utilize previously used
methods to determine the extent and causes of the co integration if it exists.
4 Time Series Data and Selection
In this paper, all the frequency data, 5 minute (from 2007 to 2009) and 1 minute (from
November 2008 to Marrch 2009), come from WSTOCK.NET. The list of cross-listed firms
comes from Sina. Finance (http://finance.sina.com.cn/ ) and Hong Kong Stock Exchange
(HKSE:http://www.hkex.com.hk/ ). Although Hong Kong and China dominate equity
transactions in their common time zone, there exist differences between HKSE and the
Chinese exchange including the trading days (differing public holidays) and the trading hours.
The daily transaction periods in HKSE are from 10:00 to 12:30 and from 14:30 to 15:55;
correspondingly, Chinese exchanges operate differently; from 9:30 to 11:30 and from 13:00 to
15:00, each trading day.
Insert Table 2 here
Stoll and Whaley’s (1990) research indicated that the interval from the opening bell to
the first transaction is about 5 to 7 minutes for the New York Stock Exchange. This, in turn ,
eliminated a pair of early transacting in the largest American equity exchanges noted in Darrat
et al. (2003). With this knowledge, we take into account the actual conditions both in the
China and Hong Kong exchanges. Therefore, we eliminated the first five minutes and paired
the Chinese and Hong Kong trading hours, i.e., the hours are now from 10:05 to 11:30 (86
figures) and from 14:35 to 15:00 ( 26 figures).
Also, the A- shares (and H-shares) price of the last transaction during each minute
became the strike price for that minute. For minutes without transactions, we adopted the
conventional Fixed Time Intervals method to provide a reasonable estimate the strike price.
Fixed Time Intervals method assumed that transaction price changes occur over time in a
linear fashion. Based on this assumption, when a one minute, for example 2T (shown in 1),
during which A-shares (H-shares) trading did not occur, the strike price mean cannot be
estimated, this text applied the linear interpolation value of price at the last deal (occurring at
1T) before time 2T
and the first deal (occurring at 3T ) after 2T as the strike price at 2T
.

Namely,
1313
1212 PP
TT
TTPP
, (1)
Where 1P , 2P and 3P respectively corresponded with the price at 1T , 2T and 3T ;
12 TT denote the time span between 1T and 2T ; 13 TT represent the time span
between 1T and 3T .
Figure 1
Sketch of the Fixed Time Intervals method
For the most part, additional models and analyses are based on consecutive data. Since
the transaction time limitations exists for both in A- and H-shares, cracks between daily data
resulting in differing degree of freedom for each trading day results. This is common in time
series data with daily intervals. However, we should account for the continuity of data. To
solve this notion as to the cohesion of data, we concluded that the coefficient in each day is
the initial step of the analysis. The coefficient found by the VECM, n
, in each day is the
first step in the statistical method to estimate the real coefficient , , for the entire period.
That is,
),()...
,...
(~
),(~ˆ
...
),(~ˆ
),(~ˆ
2
2ˆ
2ˆ
2ˆ
2ˆ
2ˆ2
2ˆ1
21
2
1
sNn
sss
nN
sN
sN
sN
n
nn
Where 2ˆn
s denote standard deviation of daily coefficient,
2s denotes standard
deviation of real coefficient.
Then, the resulting hypothesis to be tested is as follow,
n
sss
n
st
H
H
n
n
a
2ˆ
2ˆ
2ˆ
21
ˆ
0
...
ˆ...ˆˆ
ˆ
0:
0:
21
β
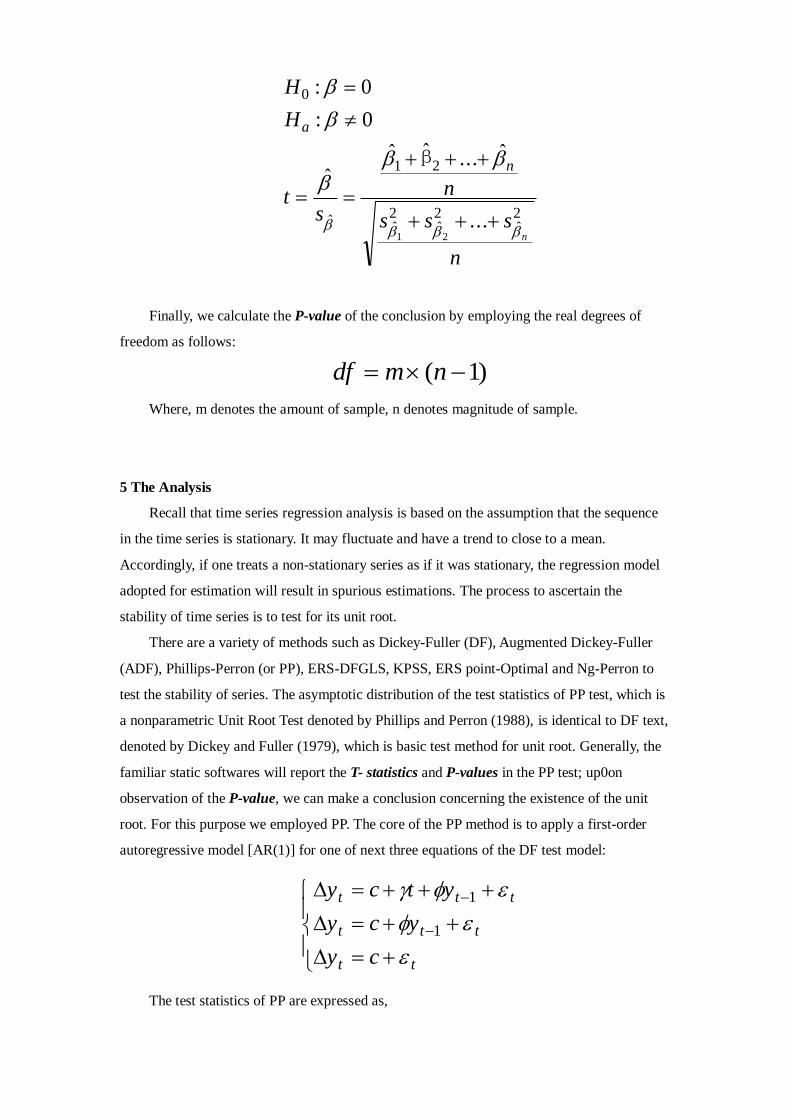
Finally, we calculate the P-value of the conclusion by employing the real degrees of
freedom as follows:
)1( nmdf
Where, m denotes the amount of sample, n denotes magnitude of sample.
5 The Analysis
Recall that time series regression analysis is based on the assumption that the sequence
in the time series is stationary. It may fluctuate and have a trend to close to a mean.
Accordingly, if one treats a non-stationary series as if it was stationary, the regression model
adopted for estimation will result in spurious estimations. The process to ascertain the
stability of time series is to test for its unit root.
There are a variety of methods such as Dickey-Fuller (DF), Augmented Dickey-Fuller
(ADF), Phillips-Perron (or PP), ERS-DFGLS, KPSS, ERS point-Optimal and Ng-Perron to
test the stability of series. The asymptotic distribution of the test statistics of PP test, which is
a nonparametric Unit Root Test denoted by Phillips and Perron (1988), is identical to DF text,
denoted by Dickey and Fuller (1979), which is basic test method for unit root. Generally, the
familiar static softwares will report the T- statistics and P-values in the PP test; up0on
observation of the P-value, we can make a conclusion concerning the existence of the unit
root. For this purpose we employed PP. The core of the PP method is to apply a first-order
autoregressive model [AR(1)] for one of next three equations of the DF test model:
tt
ttt
ttt
cy
ycy
ytcy
1
1
The test statistics of PP are expressed as,

sf
sefT
f 5.00
00
5.0
0
0~
2
)()(
Where, T is magnitude of swatch,
denote the estimator of coefficient,
in the
model, represents the test statistics, )(
se denote the estimated standard deviation of
coefficient, s is the standard error of the regression equation, and 0f stands for the residual
spectrum estimator of frequency zero. Moreover, 0 is the uniform variance estimator. If the
number of dependent variables equal to k, the 0 could be expressed as,
20 s
T
kT
The sample data set contains 56 cross-listed firms. In turn, we selected the minute data,
from Jul. 2007 to Feb. 2009, at the same time each day to create a group of daily data, and
made several groups in the same way, to make a approximate evaluation about the unit root of
minute data. We show this as follows:
Figure 2:
Sketch of the Time dimension of the data
Market
type A H A A H A A H A
Time 10:30 10:35 10:40 11:00 11:05 11:10 14:40 14:45 14:50
Adopting a P-value>0.05 to not reject the null hypothesis, namely the stock price is a
non-stationary series, and if P-value<0.05 then we reject the null hypothesis. This means that
the stock price series is stationary.
According to the result, almost all the stock price series have a unit root except for
CHINA RAIL CONS (CH601186, HK1186), PETRO CHINA (CH601857, HK0857), and
DATANG POWER (CH601991, HK0991). The result are in table 3.
Insert Table 3 here
Granger (1981), developed the co integration analysis. He stated that there are some
linear combinations among time series that could result in stability among them. We can infer

a long-run stable relationship may exist in sequences of data. We can describe this
relationship in mathematical terms;
we assume that there are two time series variables, tx and ty , and both variables obey
a first-order integration (I(1) ) process, and if one of the linear combinations based on tx
and ty , for example ttt yxz , represent a stationary sequence, namely tx and ty
having a co integration relationship and the co integration vector is ( 1,- ) .
Moreover, Engle and Granger (1987) provide the method for the co integration test. The
main idea of this method is that adopt a methodology to inspect whether a co integration
relationship exists among the non-stationary variables (with the integration characteristics);
that is, we whether a pre-combination could form a stationary sequence.
PP test was used here and the results show that almost all A and H stock prices have a co
integration relation, except BANK OF CHINA (CH601628, HK3328), ZIJIN MINING
(CH601899, HK2899), CHINA SHIP DEV (CH600026, HK1138), and BANKCOMM
(CH601328, HK3328), shown in Tables 4 and 5.
Insert Tables 4 and 5
To avoid the spurious regression results, we adopted a VECM that is a restricted vector
autoregressive model (VAR) designed for use with non-stationary series that are known to be
co integrated. The VECM contains cointegration relations built into the specification so that it
restricts the long-run behavior of the endogenous variables to converge to their cointegrating
relationships while allowing for short-run adjustment dynamics. The cointegration term is
known as the error correction term since the deviation from long-run equilibrium is corrected
gradually through a series of partial short-run adjustments.
Although a long-run equilibrium relation exited between tx1 and tx2 , hence the expect
value of te will equal to 0 in a long term, a disequilibrium occur in the short term condition.
Then, tx1 and tx2 should experience the dynamic adjustment, correcting the disequilibrium
into a equilibrium state.
The corresponding VECM is:
tttt
tttt
xxx
xxx
,21,11,22,2
,11,11,21,1
)(
)(
To build a VECM, the lag length must be confirmed firstly and both sufficient lags and
degree of freedom are required. We utilized the Akaike Information Criterion (AIC), shown
as,

TkTlAIC /2/1
Where, T is magnitude of swatch and k is the number of dependent variables.
The optimal lag length present equals 1. Finally, a more general A-H stock price VECM
is built:
HtHtHttHt
AtAtAttAt
cHACHAH
cHACHAA
1111
1111
)(
)(
Where, tA (or tH ) is A (or H) share the stock price at time t, tA (or tH ) is the
difference between tA and 1tA (or tH and 1tH ), and represent regression
coefficients, C and c are the constant before and after correction, moreover A and H
work as correction factors.
First, we selected 1 minute date, 10:35~11:30, in each day from 2008-2009 as sample
and processed the unit root and cointegration test on 44 crossing-listed companies with
sufficient data. If these data indicated a co integration relation, we would reconnect these data
each day by the method described earlier and estimate the coefficients by VECM adopted.
Using the P-value as a criterion, we tested the results and found that the P-values of A and
H in majority sample stocks are more than 0.05. Thus, we could not reject the null
hypothesis that coefficients equal zero. The final results are shown in Table 6.
Furthermore, treaded 5 minute data at 10:30 in each day as daily data, I made a second
round VCM model estimation. The result indicated that cause-effect reaction exited between
samples with a cointegreation relationship.
Insert Table 6
6 Arbitrage Test and Results
To confirm the usefulness in adopting a general VECM, we made a test for arbitrage on
16 cross-listed firms that passed the unit root test and co integration test and have sufficient
data, i.e., more than a 30 day time series.. The arbitrage utilizes the values of tA and tH ,
counted by VEC M, as indicators to indicate what the transactions will be. These transactions
originate from the equations of the model whose coefficients were estimated by equation (1)
with varying groups of (5 days, 10 days, 20 days, 30 days, or 40 days) . These values are then
used to forecast the trend in the next trading day. For example, using the data from Nov.1,
2008 to Nov. 5, 2008 (5 days), we can anticipate the minute by minute trend on Nov.6, 2008.
Similarly, we estimate rolling trend and assume a transaction costs of 100,000 (Chinese
Currency) and 100,000 (Hong Kong Dollars). All the forecast s and transaction costs are

based on historical data. These assumptions are all used to make the arbitrage decisions and
the trade days of the selected firms in different forecast groups are shown in Table 7
Table 7: Trading Days
Company 5 Day 10 Day 20 Day 30 Day 40 Day
ANGANG NEWSTEEL 59 54 44 29 19
HUANENG POWER 55 50 40 25 15
TSINGTAO BREW 25 20 10 - -
CHINA MERCHANTS
BANK 62 57 47 32 22
AIR CHINA 34 29 19 - -
CHALCO 57 52 42 27 17
CSR 50 45 35 20 10
PING AN 60 55 45 30 20
CHINA LIFE 60 55 45 30 20
CHINA SHENHUA
ENERGY 59 54 44 29 19
SINOPEC CORP 63 58 48 33 23
CHINA COSCO 54 49 39 24 14
CHINA RAILWAY 54 49 39 24 14
CHINA COAL 59 54 44 29 19
ZTE 59 54 44 29 19
Assuming the unit in the trade is on a per share basis, ignoring the commission and
other transaction costs, and making the maximum trade in each transaction, we adopt the
trading strategy to be as follows:
Under a bear position,
if tA ( tH )>0, buy and take a full position;
if tA ( tH )≤0,wait and take a bear position;
When under a full position,
if tA ( tH )>0, hold and take a full position;
if tA ( tH )≤0,sell and take a bear position;
After the data analysis and tests, about 52.33% of the samples contain positive profits
per day and are shown in Table 8. Hence, we could alter the trading strategy to arrive at better
results (those that are more profitable), we conclude at this point that arbitrage is applicable in
these trading situations. The possibilities are almost endless at this point so we will simply
conclude that arbitrage has significant affects.
Insert Table 8

7 Conclusions
This study focused on the interactivity between A- and H- shares prices in two
geographically similar markets. The data selected eere firms cross l;isted on both the
Shanghai and Hong Kong equity exchanges. Using the analyses and methods of unit root,
Granger causality and VECM, we attempted to simulate decisions made by investors in both
exchanges. The arbitrage simulation did not result in a short term co integration of the two
equity markets. In a sense, the influence of one market did not seem to affect transaction in
the second equity market. These results are probably not surprising since the high frequency
data appears to have long run relationships. The VECM also, indicated that the two markets
do need a period to adjust to each other.
There are some technical problems concerning the time series studied. Of course, as time
goes on, more firms will be cross-listed and hence, the addition data and increase the
statistical degrees of freedom will result in definitive results. Longer periods of time can also
be studied as data becomes universally available. We did not consider the asynchronous
running time in both equity markets which may yield further evidence of an explanation about
the stock prices of both A and H shares. Changes in the arbitrage rule may also yield
additional information.
References
Aaltonen, J. and R. Östermark (1997) “A Rolling Test of Granger Causality between the
Finnish and Japanese Security Markets, Omega, 25, 6, 625-642
Bailey, W., (1994) Risk and return on China’s new stock markets: Some preliminary evidence,
Pacific Basin Finance Journal, 2, 243-260.
Bailey, Warren and Julapa Jagtiani, Julapa (1994), “Foreign Ownership Restrictions And
Stock Prices In The Thai Capital Market,” Journal of Financial Economics, 36, 57-87.
Bekaert, G. and C. Harvey, (1995) “Time varying world market integration, Journal of
Finance, 50, 403-444.
Bekaert, G., (1995) “Market Integration and Investment Barriers in Emerging Equity Markets,
World Bank Economic Review 9, 75-107.
Bonfiglioli, A. and C. A. Favero (2005) “Explaining Co-movements between Stock Markets:
The Case of US and Germany. Journal of International Money and Finance, (24):1299-1316
Chen, F. and J. E. Jarrett (2011) “Financial crises and the market efficiency in the Chinese
equity markets, Journal of the Asia Pacific Economy, 16,3, 456-463
Choi, J.J., M. Rajan (1997) “ A Joint Test of Market Segmentation and Exchange Risk Factor
in International Capital Markets,” Journal of International Business Studies, first quarter, pp.
30-49.
Chong, T. L. and Q. Su. (2006) “On the comovement of A and H shares,” The Chinese Economy, 39(5),
68-86
Chong, T. L., Q. Su. and Ming K.. (2007) “On the convergence of the Chinese and Hong Kong
stock markets: a cointegration analysis of the A and H shares,” Applied Financial Economics,
2007, vol. 17, issue 16, pages 1349-1357
Damodaran, A., C. Liu and W. Van Harlow (1993) “The Effects of International Dual
Listings on Stock Price Behavior,” New York University working paper.
Darne, O. (2004) “Seasonal Co-integration for Monthly Data,” Economics Letters (82)
349-356
Darrat, A. F., S. Rahman, and M. Zhong, (2003) “Intraday trading volume and return
volatility of the DJIA stocks: A note,” Journal of Banking and Finance, 27, 2033-2043.
Dickey, D. and Fuller, W. (1979), Distribution of the estimators for autoregressive time series
with a unit root, Journal of the American Statistical Association 74, 427-431.
Engle, R. and Granger, C. (1987) “Cointegration and error correction: representation,
estimation and testing,” Econometrica, 55, 251-276.
Eun, Cheol S. and S. Janakiramanan. (1986), "A Model Of International Asset Pricing With A
Constraint On The Foreign Equity Ownership," Journal of Finance, 41(4), 897-914.
Fanto, James A., and Roberta S. Karmel, 1997, A Report on the Attitudes of Foreign
Companies Regarding a U.S. Listing, Stanford Journal of Law, Business, and Finance 3,
46-82.
Foerster, Stephen, and G. Andrew Karolyi, 1999, The Effects of Market Segmentation and
Investor Recognition on Asset Prices: Evidence from Foreign Stocks Listing in the U.S.,
Journal of Finance 54, 981-1013.
Fong, T., Wong, A. and Yong, I., (2007) Share Price Disparity in Chinese Stock Markets,
Hong Kong Monetary Authority Working Paper 11/2007.

Granger, C. W. J. (1981) “Some properties of times data and their use in econometric model
specification,” Journal of Econometrics, 16, 121-130.
Han D, (2006), “Study on Factors of Soft Segmentation of A and H Share Market-and on
Steps and Time of Setting up QDII[J],” Business Economics and Administration;2006-03
Hietala, P. T. (1989), "Asset Pricing In Partially Segmented Markets: Evidence From The
Finnish Market," Journal of Finance, Vol. 44(3), 697-718.
Jarrett, J. E., X. Pan and S. Chen (2009) “Do the Chinese Bourses (Stock Markets) Predict
Economic Growth? ,” International Journal of Business and Economics, 8,3, 201-211
Jarrett, J. E., and E. Kyper (2011) “ARIMA Modeling With Intervention to Forecast and
Analyze Chinese Stock Prices,” International Journal of Engineering Business Management,
3,3, 53-58
Morana, C. and A. Beltrattib (2008) “Co-movements in International Stock Markets Science,”
Finance Markets and Money (18):31-45
Meric, I., Ratner, M. and G Meric (2008) “Co-movements of Sector Index Returns in the
World's Major Stock Markets in Bull and Bear Markets: Portfolio Diversification
Implications,” International Review of Financial Analysis. 2008, (17): 156-177
Pascual, A. G. (2003) “Assessing European Stock Markets Co-integration,” Economics
Letters, (78): 197-203
Vazquez, J. (2008) “The Co-movement between Monetary and Fiscal Policy Instruments
during the Post-war Period in the U. S,” International Review of Economics and Finance. 17,
412-424
Karolyi, A. G (1998) “Why do companies list shares abroad? A survey of the evidence and its
managerial implications,” Financial Markets, Institutions and Instruments, 7, 1, 1-60
Lau, S., D. Diltz and V. Apilado, (1994) “Valuation Effects of International Stock Exchange
Listings,” Journal of Banking and Finance 18, 743-755.
Lee, I., 1991, “The Impact of Overseas Listings on Shareholder Wealth: The Case of the
London and Toronto Stock Exchanges,” Journal of Business Finance and Accounting 18,
583-592.
Lee, I., (1991) “The Impact of Overseas Listings on Shareholder Wealth: The Case of the
London and Toronto Stock Exchanges,” Journal of Business Finance and Accounting 18,
583-592.
Liu Feifei (2007) “A Study on Price Behavior of A+H Cross-listed Stocks in China,” Master
degree paper, Central South University

Ma, Jingyun, Swan, Peter L. and Song, Fengming (2010) “Price Discovery and Information in
an Emerging Market: Evidence from China (July 15, 2010), working paper.
Mei, J., J. Scheinkman and W. Xiong, (2006) “Speculative trading and Stock prices: Evidence
from Chinese A-B Share premia,” NBER working Paper 11362.
Meric, G, and P. C. Ricardo (2001) “Co-movements of U. S. and Latin American Equity
Markets before and after the 1987 Crash, “ International Review of Financial Analysis. 2001,
(1):219-235
Miller, Darius P., 1999, “The market reaction to international cross-listings: Evidence from
Depositary Receipts,” Journal of Financial Economics 51, 103-123
Darne, O. (2004) “Seasonal Co-integration for Monthly Data,” Economics Letters (82)
349-356
Phillips P. R C, (1988) “Testing, or a unit rot in time series regression,” Biometrika, 75,
335-346.
Poon W P H, Fung H G. (2000) “Red chips or H shares: Which China Backed Securities
Process Information the fastest,” Journal of Multinational Financial Management, 10 (324):
315-343
Stoll, H. and R. Whaley, (1990) “Stock market structure and volatility, Review of Financial
Studies, 3 (1), 37-71.
Sun, Qian and Wilson H. S. Tong (2000) "The Effect Of Market Segmentation On Stock
Prices," Journal of Banking and Finance, 24(12) 1875-1902.
Torabzadeh, K., W. Bertin, and T. Zivney (1992) “Valuation Effects of International
Listings,” Global Finance Journal 3, 159-170.
Varela O. and S. Lee, 1993b, “The Combined Effects of International Listing on the Security
Market Line and Systematic Risk for US Listings on The London and Tokyo Stock
Exchanges,” in International Financial Market Integration, S. Stansell (ed.), Blackwell
Publishers, Cambridge MA, 367-388.
Wang Qunyong and Wu Na (2004) “A panel cointegration test on the long-run equilibrium
relationship between A share and H share,” conference paper, the 5th China economics
Annual conference
Wang Weian and Bai Na(2004) “An Empirical Study on Prices Diferenle Between A-share
and H-share”, South China Financial Research, 19, 2, 31-39
Wang, S. S. and L. Jiang, (2004) Location of trade, ownership restrictions, and market

illiquidity: Examining Chinese A- and H-shares,” Journal of Banking and Finance, 28,
1273-1297.
Wu S., Pan Y. (2005) “A Study on Co- integration and Causality among HongKong Red
Chips, H-Shares and Mainland Stock Market,” Chinese Journal of Management,. 2 , 2,
190-199
Xu Yang (2010), “The Influence of the Split Share Structure Reform on AH Share Market
Information Transmission and Correlativity,” Journal of Shenyang Normal University (Social
Science Edition) 2010-03
Yang P., Zhu T., Yang Y. and X. Xinzhong (2006) “A Study of Price Discovery on China A
Share and H Share,” conference paper, the 3rd China Finance Annual conference
Zeng, W. and Luo, W. (2009), Dynamic Conditional Correlation among the A-share, the
B-share and the H-share Markets in China, “ Journal of Business Economics;2009-07
Zhou Wei (2009) “Characteristics of co-movement among stock markets in Shanghai, U.S.
and Hong,” Economic Theory and Business Management, 2009-04

Table 2
There are 56 companies both listed in China A stock exchange and Hong Kong H
stock exchange. The name, code in A and H market, and listed times are ontained in
this table.
Name A share code H share code A listed time H listed time
ZTE CH000063 HK763 1997/11/18 2004/12/9
WEICHAI POWER CH000338 HK2338 2004/3/21 2007/4/30
CHENMING PAPER CH000488 HK1812 2000/11/20 2008/6/18
NE ELECTRIC CH000585 HK42 1995/12/13 1995/7/6
JINGWEI TEXTILE CH000666 HK350 1996/12/10 1996/2/2
SHANDONG XINHUA CH000756 HK719 1997/8/6 1996/12/31
ANGANG NEWSTEEL CH000898 HK347 1997/12/25 1997/7/24
GUANGDONG KELON CH000921 HK921 1999/7/13 1996/7/23
HUANENG POWER CH600011 HK902 2001/12/6 1998/1/21
ANHUIEXPRESSWAY CH600012 HK995 2003/1/7 1996/11/13
CHINA SHIP DEV CH600026 HK1138 2002/5/23 1994/11/11
HUADIAN POWER CH600027 HK1071 2005/2/3 1999/6/30
SINOPEC CORP CH600028 HK386 2001/8/8 2000/10/19
CHINA SOUTH AIR CH600029 HK1055 2003/7/25 1997/7/31
CHINA MERCHANTS BANK CH600036 HK3968 2002/4/9 2006/9/23
CHINA EAST AIR CH600115 HK670 1997/11/5 1997/2/5
YANZHOU COAL CH600188 HK1171 1998/7/1 1998/4/1
GUANGZHOU PHAR CH600332 HK874 2001/2/6 1997/10/30
JIANGXI COPPER CH600362 HK358 2002/1/11 1997/6/12
JIANGSU EXPRESS CH600377 HK177 2001/1/16 1997/6/27
SHENZHEN EXPRESS CH600548 HK548 2001/12/25 1997/3/12
ANHUI CONCH CH600585 HK914 2002/2/7 1997/10/21
TSINGTAO BREW CH600600 HK168 1993/8/27 1993/7/15
GUANGZHOU SHIP CH600685 HK317 1993/10/28 1993/8/6
SHANGHAI PECHEM CH600688 HK338 1993/11/8 1993/7/26
NANJING PANDA CH600775 HK553 1996/11/18 1996/5/2
JIAODA HIGHTECH CH600806 HK0300 1994/1/3 1993/12/7
MAANSHAN IRON CH600808 HK323 1994/1/6 1993/11/3
BEIREN PRINTING CH600860 HK187 1994/5/6 1993/8/6
YIZHENG CHEM CH600871 HK1033 1995/4/11 1994/3/29
TIANJIN CAPITAL CH600874 HK1065 1995/6/30 1994/5/17
DONGFANG ELEC CH600875 HK1072 1995/10/10 1994/6/6
LUOYANG GLASS CH600876 HK1108 1995/10/31 1994/7/8
CHONGQING IRON CH601005 HK1053 2007/2/28 1997/10/17
CHINA SHENHUA ENERGY CH601088 HK1088 2007/10/9 2005/6/15
AIR CHINA CH601111 HK0753 2006/8/18 2004/12/15
CHINA RAIL CONS CH601186 HK1186 2008/3/10 2008/3/14
PING AN CH601318 HK2318 2007/3/1 2004/6/24
BANKCOMM CH601328 HK3328 2007/5/15 2005/6/23

GUANGSHEN RAIL CH601333 HK0525 2006/12/22 1996/5/14
Name A share code H share code A listed time H listed time
CHINA RAILWAY CH601390 HK0390 2007/12/3 2007/12/7
ICBC CH601398 HK1398 2006/10/27 2006/10/27
BEIJING N STAR CH601588 HK0588 2006/10/16 2006/9/29
CHALCO CH601600 HK2600 2007/4/30 2001/12/12
CHINA LIFE CH601628 HK2628 2007/1/9 2007/3/18
CSR CH601766 HK1766 2008/8/18 2008/8/21
CHINA OILFIELD CH601808 HK2883 2007/9/28 2002/11/20
PETROCHINA CH601857 HK0857 2007/11/5 2000/4/7
CSCL CH601866 HK2866 2007/12/12 2004/6/16
CHINA COAL CH601898 HK1898 2008/2/1 2006/12/19
ZIJIN MINING CH601899 HK2899 2008/4/25 2003/12/23
CHINA COSCO CH601919 HK1919 2007/6/26 2005/6/30
CCB CH601939 HK0939 2007/9/25 2005/10/27
BANK OF CHINA CH601988 HK3988 2006/7/5 2006/6/1
DATANG POWER CH601991 HK0991 2006/12/20 1997/3/21
CITIC BANK CH601998 HK0998 2007/4/27 2007/4/27
0
5
10
15
20
25
30
1993-1996 1997-2000 2001-2004 2005-2009
A listed
H listed
Both listed
The number of company listed in A and H share market
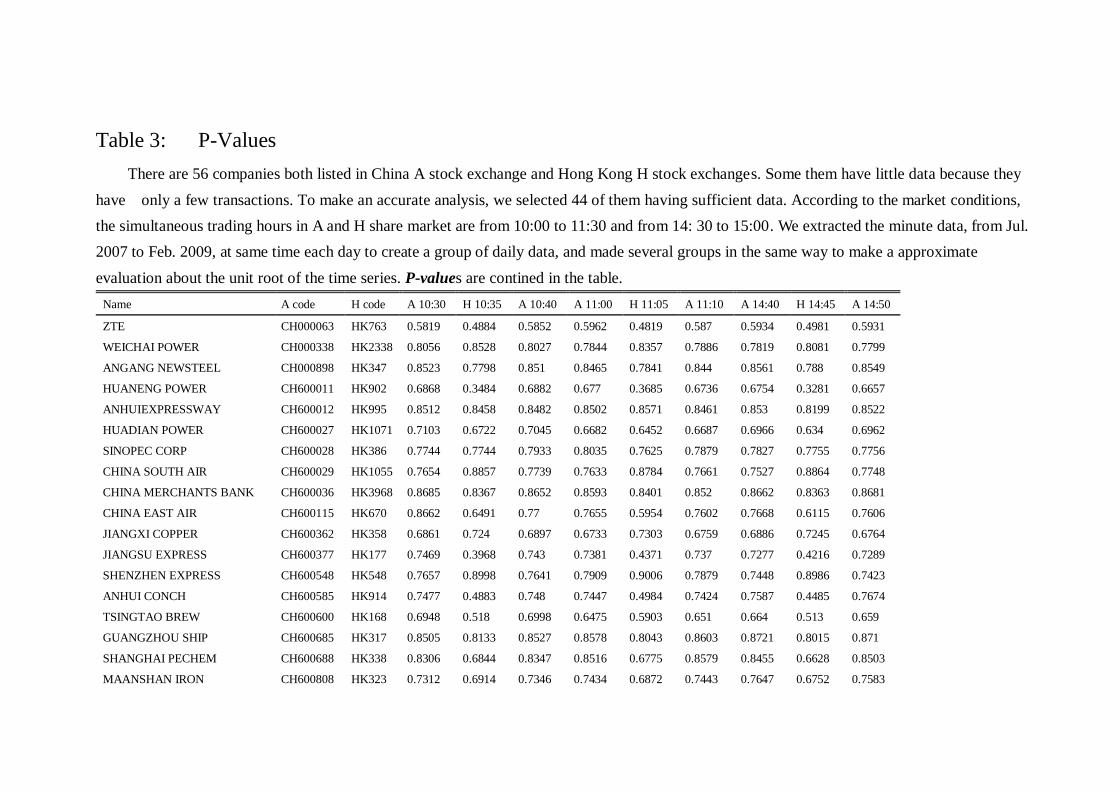
Table 3: P-Values
There are 56 companies both listed in China A stock exchange and Hong Kong H stock exchanges. Some them have little data because they
have only a few transactions. To make an accurate analysis, we selected 44 of them having sufficient data. According to the market conditions,
the simultaneous trading hours in A and H share market are from 10:00 to 11:30 and from 14: 30 to 15:00. We extracted the minute data, from Jul.
2007 to Feb. 2009, at same time each day to create a group of daily data, and made several groups in the same way to make a approximate
evaluation about the unit root of the time series. P-values are contined in the table.
Name A code H code A 10:30 H 10:35 A 10:40 A 11:00 H 11:05 A 11:10 A 14:40 H 14:45 A 14:50
ZTE CH000063 HK763 0.5819 0.4884 0.5852 0.5962 0.4819 0.587 0.5934 0.4981 0.5931
WEICHAI POWER CH000338 HK2338 0.8056 0.8528 0.8027 0.7844 0.8357 0.7886 0.7819 0.8081 0.7799
ANGANG NEWSTEEL CH000898 HK347 0.8523 0.7798 0.851 0.8465 0.7841 0.844 0.8561 0.788 0.8549
HUANENG POWER CH600011 HK902 0.6868 0.3484 0.6882 0.677 0.3685 0.6736 0.6754 0.3281 0.6657
ANHUIEXPRESSWAY CH600012 HK995 0.8512 0.8458 0.8482 0.8502 0.8571 0.8461 0.853 0.8199 0.8522
HUADIAN POWER CH600027 HK1071 0.7103 0.6722 0.7045 0.6682 0.6452 0.6687 0.6966 0.634 0.6962
SINOPEC CORP CH600028 HK386 0.7744 0.7744 0.7933 0.8035 0.7625 0.7879 0.7827 0.7755 0.7756
CHINA SOUTH AIR CH600029 HK1055 0.7654 0.8857 0.7739 0.7633 0.8784 0.7661 0.7527 0.8864 0.7748
CHINA MERCHANTS BANK CH600036 HK3968 0.8685 0.8367 0.8652 0.8593 0.8401 0.852 0.8662 0.8363 0.8681
CHINA EAST AIR CH600115 HK670 0.8662 0.6491 0.77 0.7655 0.5954 0.7602 0.7668 0.6115 0.7606
JIANGXI COPPER CH600362 HK358 0.6861 0.724 0.6897 0.6733 0.7303 0.6759 0.6886 0.7245 0.6764
JIANGSU EXPRESS CH600377 HK177 0.7469 0.3968 0.743 0.7381 0.4371 0.737 0.7277 0.4216 0.7289
SHENZHEN EXPRESS CH600548 HK548 0.7657 0.8998 0.7641 0.7909 0.9006 0.7879 0.7448 0.8986 0.7423
ANHUI CONCH CH600585 HK914 0.7477 0.4883 0.748 0.7447 0.4984 0.7424 0.7587 0.4485 0.7674
TSINGTAO BREW CH600600 HK168 0.6948 0.518 0.6998 0.6475 0.5903 0.651 0.664 0.513 0.659
GUANGZHOU SHIP CH600685 HK317 0.8505 0.8133 0.8527 0.8578 0.8043 0.8603 0.8721 0.8015 0.871
SHANGHAI PECHEM CH600688 HK338 0.8306 0.6844 0.8347 0.8516 0.6775 0.8579 0.8455 0.6628 0.8503
MAANSHAN IRON CH600808 HK323 0.7312 0.6914 0.7346 0.7434 0.6872 0.7443 0.7647 0.6752 0.7583

YIZHENG CHEM CH600871 HK1033 0.8575 0.7445 0.8542 0.8611 0.7042 0.8626 0.8593 0.7248 0.8633
Name A code H code A 10:30 H 10:35 A 10:40 A 11:00 H 11:05 A 11:10 A 14:40 H 14:45 A 14:50
TIANJIN CAPITAL CH600874 HK1065 0.5863 0.5399 0.5919 0.5349 0.5334 0.5754 0.5968 0.6472 0.5941
DONGFANG ELEC CH600875 HK1072 0.7475 0.7409 0.7428 0.7563 0.7515 0.7554 0.715 0.7299 0.7127
CHONGQING IRON CH601005 HK1053 0.6907 0.6879 0.6943 0.6976 0.7026 0.7054 0.7197 0.7218 0.7214
CHINA SHENHUA ENERGY CH601088 HK1088 0.7239 0.8389 0.7289 0.7327 0.8464 0.734 0.7287 0.8433 0.7242
AIR CHINA CH601111 HK0753 0.7977 0.8099 0.8093 0.8034 0.818 0.8335 0.8434 0.8067 0.8137
CHINA RAIL CONS CH601186 HK1186 0.0402 0.0198 0.0356 0.0468 0.0309 0.0469 0.0257 0.0267 0.0275
PING AN CH601318 HK2318 0.8471 0.7235 0.8462 0.8507 0.7208 0.8489 0.8572 0.7559 0.8542
BANKCOMM CH601328 HK3328 0.9097 0.8096 0.9094 0.9089 0.8155 0.9043 0.8949 0.8177 0.891
GUANGSHEN RAIL CH601333 HK0525 0.8851 0.8392 0.8859 0.8765 0.8428 0.8737 0.8666 0.7716 0.8622
CHINA RAILWAY CH601390 HK0390 0.6357 0.6748 0.6303 0.6217 0.6492 0.6138 0.6337 0.6485 0.6234
ICBC CH601398 HK1398 0.8209 0.6616 0.8199 0.8219 0.6365 0.8174 0.8089 0.6784 0.7929
BEIJING N STAR CH601588 HK0588 0.8613 0.8353 0.8584 0.851 0.8536 0.8553 0.8419 0.814 0.8377
CHALCO CH601600 HK2600 0.8211 0.7755 0.8279 0.8206 0.7599 0.8221 0.8229 0.7687 0.8195
CHINA LIFE CH601628 HK2628 0.8565 0.7096 0.8564 0.8376 0.6784 0.8419 0.8498 0.6865 0.8481
CSR CH601766 HK1766 0.6776 0.3713 0.622 0.6283 0.3357 0.6327 0.5487 0.2327 0.559
CHINA OILFIELD CH601808 HK2883 0.4865 0.8 0.4973 0.5005 0.7761 0.4728 0.5233 0.7856 0.5279
PETROCHINA CH601857 HK0857 0 0.0481 0 0 0.0821 0 0 0.0751 0
CSCL CH601866 HK2866 0.4543 0.6871 0.4742 0.4525 0.5882 0.468 0.4116 0.5075 0.4085
CHINA COAL CH601898 HK1898 0.5905 0.7565 0.6477 0.5743 0.763 0.5729 0.5867 0.7787 0.5848
ZIJIN MINING CH601899 HK2899 0.3022 0.5251 0.3093 0.3527 0.5359 0.3574 0.3611 0.554 0.3575
CHINA COSCO CH601919 HK1919 0.8154 0.8165 0.8191 0.8071 0.8213 0.8051 0.8133 0.7843 0.8095
CCB CH601939 HK0939 0.8372 0.6642 0.8269 0.838 0.6562 0.8353 0.8135 0.6728 0.8047
BANK OF CHINA CH601988 HK3988 0.892 0.8342 0.8878 0.8652 0.8097 0.8523 0.841 0.7852 0.8266
DATANG POWER CH601991 HK0991 0.8283 0.0031 0.8164 0.806 0.0025 0.8096 0.7906 0.002 0.7947

CITIC BANK CH601998 HK0998 0.8835 0.7426 0.8791 0.881 0.7467 0.8823 0.9045 0.7347 0.9017

Table 4
PP test used here and the result that almost all 27 listed companies’, with sufficient data,
A and H stock price have a cointegration relation, P-value shown as
P-value
Name A(10:30) to
H(10:35)
H(10:35) to
A(10:40)
A(11:00) to
H(11:05)
H(11:05) to
A(11:10)
A(14:40) to
H(14:45)
H(14:45) to
A(14:50)
CHINA LIFE 0.002 0.005 0.003 0.002 0.004 0.008
CHINA COSCO 0.024 0.037 0.021 0.032 0.027 0.033
SINOPEC CORP 0 0.001 0.003 0.003 0.004 0.004
ANGANG NEWSTEEL 0.002 0.003 0.002 0.003 0.003 0.003
ZTE 0.013 0.017 0.015 0.024 0.019 0.026
HUANENG POWER 0.001 0.004 0.002 0.004 0.001 0.004
CHINA SOUTH AIR 0.031 0.015 0.028 0.019 0.03 0.021
CHINA MERCHANTS BANK 0.015 0.02 0.016 0.017 0.013 0.017
CCB 0.043 0.09 0.044 0.096 0.043 0.089
BANK OF CHINA 0.05 0.063 0.056 0.072 0.048 0.067
ZIJIN MINING 0.129 0.084 0.108 0.086 0.16 0.149
CHINA COAL 0.018 0.017 0.017 0.012 0.01 0.007
CSR 0.014 0.038 0.011 0.039 0.004 0.014
GUANGZHOU SHIP 0.001 0.002 0.001 0 0.001 0.002
TSINGTAO BREW 0 0 0 0 0 0.001
CHINA SHIP DEV 0.061 0.059 0.059 0.051 0.037 0.038
CHINA EAST AIR 0 0 0 0 0 0
ICBC 0.0399 0.0889 0.0456 0.0879 0.051 0.0777
BEIJING N STAR 0.0043 0.0071 0.0113 0.0127 0.0107 0.0114
CHALCO 0.003 0.0033 0.0025 0.0036 0.0027 0.0037
CHINA RAILWAY 0.0037 0.004 0.0029 0.0023 0.005 0.0066
CHONGQING IRON 0.0041 0.0047 0.0043 0.0033 0.0056 0.0056
AIR CHINA 0.0004 0.0007 0.0006 0.0006 0.0004 0.0004
BANKCOMM 0.0902 0.1227 0.0812 0.1268 0.0932 0.1285
GUANGSHEN RAIL 0.0003 0.0005 0.0004 0.0005 0.0007 0.0009
PING AN 0.003 0.0047 0.0022 0.0035 0.0019 0.0056
CHINA SHENHUA ENERGY 0.0011 0.0016 0.0011 0.0009 0.0016 0.0014
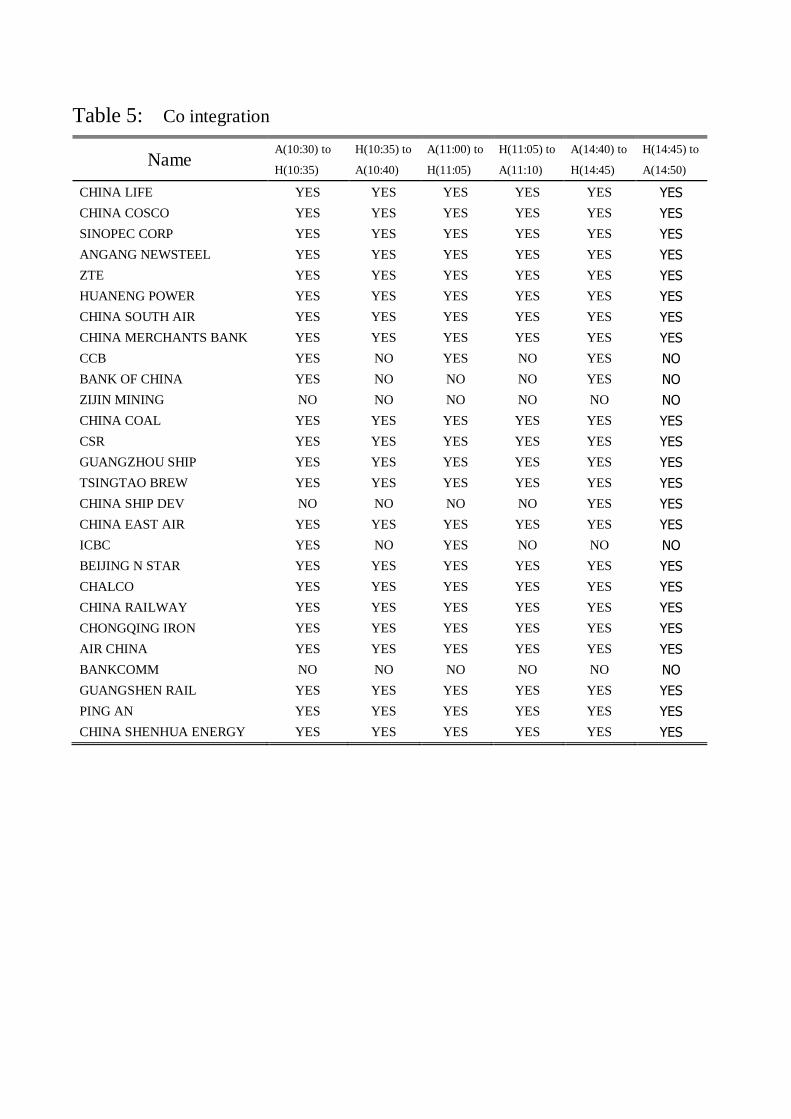
Table 5: Co integration
Name A(10:30) to
H(10:35)
H(10:35) to
A(10:40)
A(11:00) to
H(11:05)
H(11:05) to
A(11:10)
A(14:40) to
H(14:45)
H(14:45) to
A(14:50)
CHINA LIFE YES YES YES YES YES YES
CHINA COSCO YES YES YES YES YES YES
SINOPEC CORP YES YES YES YES YES YES
ANGANG NEWSTEEL YES YES YES YES YES YES
ZTE YES YES YES YES YES YES
HUANENG POWER YES YES YES YES YES YES
CHINA SOUTH AIR YES YES YES YES YES YES
CHINA MERCHANTS BANK YES YES YES YES YES YES
CCB YES NO YES NO YES NO
BANK OF CHINA YES NO NO NO YES NO
ZIJIN MINING NO NO NO NO NO NO
CHINA COAL YES YES YES YES YES YES
CSR YES YES YES YES YES YES
GUANGZHOU SHIP YES YES YES YES YES YES
TSINGTAO BREW YES YES YES YES YES YES
CHINA SHIP DEV NO NO NO NO YES YES
CHINA EAST AIR YES YES YES YES YES YES
ICBC YES NO YES NO NO NO
BEIJING N STAR YES YES YES YES YES YES
CHALCO YES YES YES YES YES YES
CHINA RAILWAY YES YES YES YES YES YES
CHONGQING IRON YES YES YES YES YES YES
AIR CHINA YES YES YES YES YES YES
BANKCOMM NO NO NO NO NO NO
GUANGSHEN RAIL YES YES YES YES YES YES
PING AN YES YES YES YES YES YES
CHINA SHENHUA ENERGY YES YES YES YES YES YES

Table 6: VECM estimation under 1 minute data
Name A code H code A H
β C
CHINA LIFE CH601628 HK2628 value -0.876 -0.332 -0.077 0.073 0.015 0.000 0.063 -0.009 -0.062 0.000
P-value 0.000 0.000 0.000 0.219 0.807 0.000 0.780 0.000 0.669
TRUE YES YES YES NO NO YES NO YES NO
CHINA COSCO CH601919 HK1919 value -0.207 -8.777 -0.083 0.212 0.028 0.000 0.026 0.016 0.034 0.000
P-value 0.283 0.000 0.000 0.130 0.585 0.001 0.465 0.046 0.550
TRUE NO YES YES NO NO YES NO YES NO
SINOPEC CORP CH600028 HK386 value 0.725 -12.268 -0.110 0.012 0.013 0.000 0.035 0.008 -0.082 0.000
P-value 0.467 0.000 0.475 0.512 0.769 0.000 0.640 0.000 0.239
TRUE NO YES NO NO NO YES NO YES NO
ANGANG NEWSTEEL CH000898 HK347 value -5.049 42.884 -0.080 -0.035 0.027 0.000 0.035 0.045 0.047 0.000
P-value 0.003 0.000 0.037 0.062 0.607 0.002 0.098 0.001 0.317
TRUE YES YES YES NO NO YES NO YES NO
CHINA MERCHANTS BANK CH600036 HK3968 value -1.513 6.139 -0.079 0.089 0.029 0.000 0.016 0.061 0.013 0.000
P-value 0.000 0.000 0.000 0.044 0.599 0.096 0.019 0.348 0.720
TRUE YES YES YES YES NO NO YES NO NO
CHINA SOUTH AIR CH600029 HK1055 value -1.437 -1.811 -0.103 -0.073 -0.032 -0.001 0.012 0.013 -0.152 0.000
P-value 0.000 0.000 0.034 0.614 0.135 0.400 0.684 0.018 0.329
TRUE YES YES YES NO NO NO NO YES NO
CHINA SHENHUA ENERGY CH601088 HK1088 value 0.066 -16.873 -0.073 0.017 0.050 0.000 0.024 -0.007 0.082 0.000
P-value 0.818 0.000 0.325 0.001 0.933 0.009 0.768 0.000 0.893
TRUE NO YES NO YES NO YES NO YES NO
A A A Ac H H H Hc

Name A code H code A H
β C
HUANENG POWER CH600011 HK902 value 0.837 -11.485 -0.153 -0.121 0.050 0.000 0.003 0.009 -0.017 0.000
P-value 0.000 0.000 0.000 0.006 0.506 0.778 0.662 0.342 0.607
TRUE YES YES YES YES NO NO NO NO NO
ZTE CH000063 HK763 value 0.835 -40.813 -0.069 0.081 0.014 0.001 0.015 0.092 0.002 -0.001
P-value 0.020 0.000 0.000 0.406 0.485 0.082 0.000 0.900 0.550
TRUE YES YES YES NO NO NO YES NO NO
CHINA EAST AIR CH600115 HK670 value 19.178 -24.079 -0.064 0.002 0.027 -0.001 0.018 -0.004 -0.151 0.000
P-value 0.000 0.000 0.935 0.632 0.104 0.001 0.775 0.009 0.386
TRUE YES YES NO NO NO YES NO YES NO
GUANGZHOU SHIP CH600685 HK317 value -0.865 -8.210 -0.096 0.213 -0.032 0.000 0.049 -0.006 -0.045 0.001
P-value 0.000 0.000 0.000 0.366 0.796 0.000 0.844 0.197 0.366
TRUE YES YES YES NO NO YES NO NO NO
TSINGTAO BREW CH600600 HK168 value -2.628 19.634 -0.076 -0.028 -0.003 -0.001 0.010 0.013 -0.001 0.000
P-value 0.000 0.000 0.160 0.841 0.024 0.414 0.745 0.937 0.747
TRUE YES YES NO NO YES NO NO NO NO
CSR CH601766 HK1766 value 1.397 -9.563 -0.088 -0.182 0.009 0.000 0.037 0.048 -0.070 0.000
P-value 0.121 0.000 0.000 0.514 0.655 0.001 0.036 0.000 0.285
TRUE NO YES YES NO NO YES YES YES NO
CHINA COAL CH601898 HK1898 value -7.514 39.733 -0.076 0.093 0.025 0.000 0.005 0.028 -0.003 0.000
P-value 0.013 0.000 0.000 0.089 0.766 0.658 0.260 0.822 0.563
TRUE YES YES YES NO NO NO NO NO NO
A A A Ac H H H Hc

Name A code H code A H
β C
BEIJING N STAR CH601588 HK0588 value 10.720 -17.431 -0.075 -0.139 0.047 0.000 -0.035 -0.016 -0.097 0.000
P-value 0.038 0.000 0.012 0.315 0.722 0.161 0.827 0.040 0.832
TRUE YES YES YES NO NO NO NO YES NO
CHALCO CH601600 HK2600 value 4.705 -25.041 -0.083 -0.023 0.040 0.000 0.030 0.003 -0.023 -0.001
P-value 0.004 0.000 0.180 0.047 0.963 0.000 0.883 0.256 0.770
TRUE YES YES NO YES NO YES NO NO NO
CHINA RAILWAY CH601390 HK0390 value -0.697 -2.029 -0.105 -0.128 0.005 0.000 0.047 0.014 -0.081 0.000
P-value 0.000 0.000 0.000 0.717 0.179 0.000 0.546 0.000 0.968
TRUE YES YES YES NO NO YES NO YES NO
CHONGQING IRON CH601005 HK1053 value -0.916 -3.124 -0.081 -0.030 -0.055 0.000 0.044 0.001 -0.051 0.000
P-value 0.009 0.000 0.303 0.092 0.774 0.000 0.968 0.115 0.361
TRUE YES YES NO NO NO YES NO NO NO
AIR CHINA CH601111 HK0753 value 0.768 -6.502 -0.087 -0.057 0.013 0.000 0.024 0.015 -0.131 0.000
P-value 0.157 0.000 0.001 0.576 0.742 0.000 0.334 0.000 0.834
TRUE NO YES YES NO NO YES NO YES NO
GUANGSHEN RAIL CH601333 HK0525 value -3.739 5.558 -0.062 -0.181 0.052 -0.001 0.000 0.069 0.048 0.000
P-value 0.000 0.009 0.004 0.458 0.179 0.997 0.288 0.494 0.447
TRUE YES YES YES NO NO NO NO NO NO
PING AN CH601318 HK2318 value 0.596 -49.963 -0.066 0.068 0.006 0.000 0.054 0.051 0.039 0.001
P-value 0.050 0.000 0.000 0.520 0.916 0.000 0.166 0.000 0.483
TRUE NO YES YES NO NO YES NO YES NO
A A A Ac H H H Hc


Table 8: VECM estimation under Daily data
Name A code
H
code β C A A A Ac H H H Hc
CHINA LIFE
CH60162
8
HK262
8
-2.17
2
31.25
8
-0.01
2
-0.08
8 0.146
-0.06
8
0.01
6 0.068
-0.14
1
-0.02
2
CHINA COSCO
CH60191
9
HK191
9
-1.68
6 2.846
-0.00
5
-0.15
1 0.416
-0.04
4
0.01
4
-0.03
9 0.181
-0.04
4
SINOPEC CORP
CH60002
8 HK386
-2.42
0 4.946
-0.02
8 0.000 0.018
-0.01
1
0.01
7 0.240
-0.10
8
-0.01
2
ANGANG NEWSTEEL
CH00089
8 HK347
-1.22
2 1.817
-0.01
1
-0.02
5 0.080
-0.02
7
0.02
9 0.075
-0.03
9
-0.03
0
CHINA MERCHANTS
BANK
CH60003
6
HK396
8
-1.29
5 5.402
-0.00
2
-0.08
9 0.137
-0.03
1
0.02
6 0.114
-0.11
4
-0.04
5
CHINA SOUTH AIR
CH60002
9
HK105
5
-1.45
6
-1.10
5
-0.05
2
-0.03
4 0.047
-0.00
3
0.00
1
-0.01
3
-0.11
8
-0.01
4
CHINA SHENHUA
ENERGY
CH60108
8
HK108
8
-1.54
9 6.222
-0.02
8 0.037 0.177
-0.15
6
0.02
1 0.040
-0.03
3
-0.09
9
HUANENG POWER
CH60001
1 HK902
-2.12
6 3.824
-0.02
8
-0.03
0
-0.03
3
-0.00
7
0.02
0
-0.05
2
-0.00
6
-0.01
1
ZTE
CH00006
3 HK763
-1.05
0
-2.33
6
-0.00
6
-0.06
7 0.119
-0.01
0
0.06
1
-0.12
6 0.039
-0.03
7
CHINA EAST AIR
CH60011
5 HK670
-2.27
9
-1.90
7
-0.05
6 0.096
-0.10
0
-0.02
6
0.00
8 0.031
-0.11
5
-0.01
9
GUANGZHOU SHIP
CH60068
5 HK317
-1.56
7 0.314
-0.05
0
-0.06
4 0.122
-0.09
8
0.00
5 0.088
-0.03
3
-0.08
6
TSINGTAO BREW
CH60060
0 HK168
-1.50
3 4.064
-0.03
7 0.010
-0.01
8
-0.01
9
0.06
2
-0.07
6 0.004
-0.01
4
CSR
CH60176
6
HK176
6
-1.45
1 0.799
-0.01
2
-0.09
5 0.052 0.012
0.06
4
-0.15
4 0.048 0.008
CHINA COAL
CH60189
8
HK189
8
-0.99
2
-2.08
3
-0.04
1
-0.03
4 0.110
-0.05
6
0.01
4
-0.02
6 0.147
-0.04
8
BEIJING N STAR
CH60158
8
HK058
8
-2.34
4
-0.97
9
-0.03
5
-0.05
9 0.210
-0.01
7
0.00
4 0.009
-0.04
8
-0.01
6
CHALCO
CH60160
0
HK260
0
-2.42
2 4.399
-0.00
4
-0.04
8 0.321
-0.02
0
0.01
5 0.020
-0.04
7
-0.02
9
CHINA RAILWAY
CH60139
0
HK039
0
-1.06
4 0.177 0.012
-0.19
1 0.134
-0.01
2
0.07
0
-0.26
6 0.131
-0.01
4
CHONGQING IRON
CH60100
5
HK105
3
-1.73
8
-0.91
4
-0.02
0
-0.08
4 0.068
-0.01
0
0.02
1 0.065
-0.01
4
-0.00
7
AIR CHINA
CH60111
1
HK075
3
-2.55
4 1.682
-0.04
4
-0.01
5 0.283
-0.00
8
0.00
5
-0.01
0 0.015
-0.01
1
GUANGSHEN RAIL
CH60133
3
HK052
5
-1.77
1 1.441
-0.02
3
-0.09
1 0.087
-0.00
9
0.02
3
-0.04
1
-0.06
0
-0.01
1

PING AN
CH60131
8
HK231
8
-1.71
8
39.07
2
-0.00
4
-0.13
9 0.215
-0.11
9
0.02
5
-0.02
6
-0.01
4
-0.05
4

Table 8 The profit ratio of arbitrage test
Panel A: Simulation trade in A share market (the coefficient before hypothesis test)
Name 5 Day 10 Day 20 Day 30 Day 40 Day
ANGANG NEWSTEEL 0.13% 0.01% -0.14% 0.37% 0.00%
HUANENG POWER 0.26% 0.62% 0.95% 0.75% 0.00%
TSINGTAO BREW -0.16% 0.23% -0.03% - -
CHINA MERCHANTS BANK 0.55% 0.85% 0.24% -0.03% -0.04%
AIR CHINA 0.17% 0.28% 1.18% - -
CHALCO 0.19% -0.15% -0.01% 0.08% 0.31%
CSR -0.15% 0.26% 0.23% -0.08% -0.42%
PING AN 0.28% 0.52% 0.38% 0.71% 0.92%
CHINA LIFE -0.18% 0.00% 0.18% 0.66% -0.40%
CHINA SHENHUA ENERGY 0.01% 0.05% 0.06% 0.00% 0.00%
SINOPEC CORP 0.34% 0.33% 0.49% 0.53% 0.26%
CHINA COSCO 0.33% 0.70% 0.82% 0.34% 0.56%
CHINA RAILWAY -0.22% -0.15% 0.36% -0.12% 0.00%
CHINA COAL 0.03% 0.02% 0.22% -0.01% 0.21%
ZTE 0.49% -0.07% 0.28% 0.00% 0.00%
Panel B: Simulation trade in A share market (the coefficient after hypothesis test)
Name 5 Day 10 Day 20 Day 30 Day 40 Day
ANGANG NEWSTEEL 0.25% 0.00% -0.15% 0.38% 0.00%
HUANENG POWER 0.31% 0.64% 0.94% 0.71% 0.00%
TSINGTAO BREW -0.16% 0.23% -0.04% - -
CHINA MERCHANTS BANK 0.62% 0.80% 0.22% -0.03% -0.04%
AIR CHINA 0.12% 0.40% 1.13% - -
CHALCO 0.18% -0.14% 0.00% 0.10% 0.32%
CSR -0.17% 0.28% 0.21% -0.08% -0.46%
PING AN 0.29% 0.51% 0.39% 0.73% 0.96%
CHINA LIFE -0.18% 0.00% 0.18% 0.66% -0.40%
CHINA SHENHUA ENERGY -0.07% 0.04% 0.06% 0.00% 0.00%
SINOPEC CORP 0.30% 0.34% 0.49% 0.53% 0.26%
CHINA COSCO 0.35% 0.71% 0.82% 0.33% 0.47%
CHINA RAILWAY -0.21% -0.14% 0.38% -0.13% 0.00%
CHINA COAL 0.12% 0.02% 0.22% -0.01% 0.17%
ZTE 0.40% -0.12% 0.25% 0.00% 0.00%
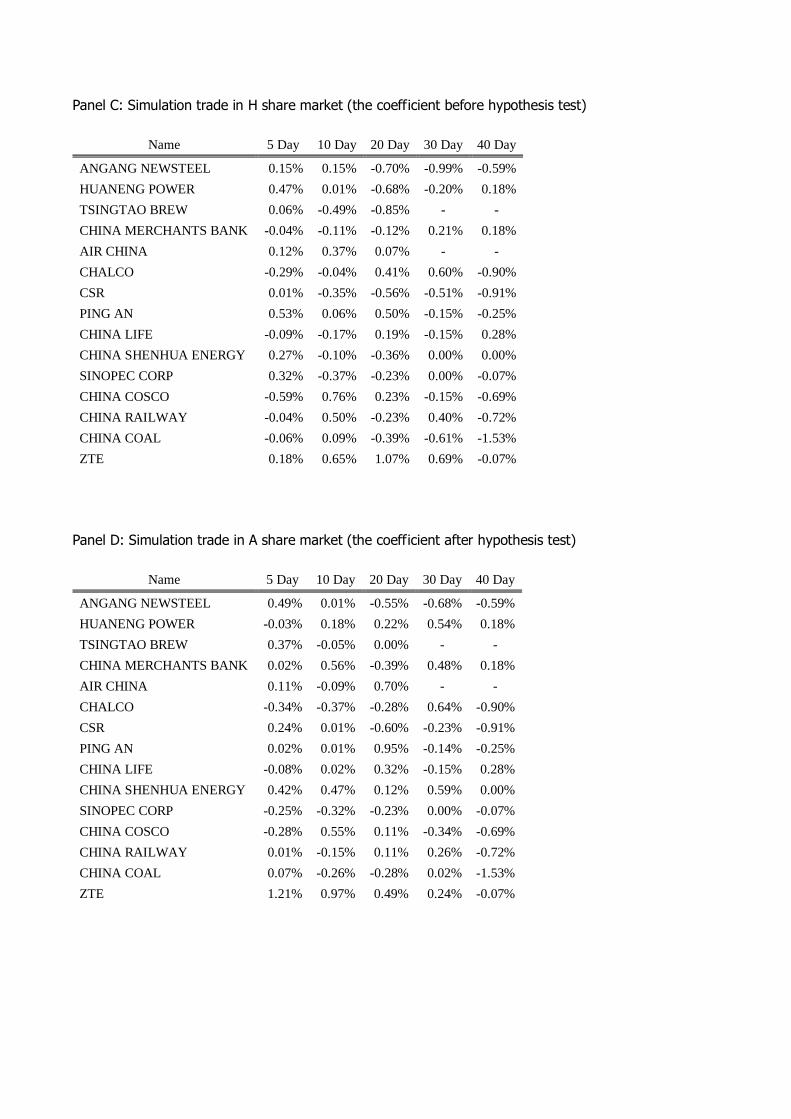
Panel C: Simulation trade in H share market (the coefficient before hypothesis test)
Name 5 Day 10 Day 20 Day 30 Day 40 Day
ANGANG NEWSTEEL 0.15% 0.15% -0.70% -0.99% -0.59%
HUANENG POWER 0.47% 0.01% -0.68% -0.20% 0.18%
TSINGTAO BREW 0.06% -0.49% -0.85% - -
CHINA MERCHANTS BANK -0.04% -0.11% -0.12% 0.21% 0.18%
AIR CHINA 0.12% 0.37% 0.07% - -
CHALCO -0.29% -0.04% 0.41% 0.60% -0.90%
CSR 0.01% -0.35% -0.56% -0.51% -0.91%
PING AN 0.53% 0.06% 0.50% -0.15% -0.25%
CHINA LIFE -0.09% -0.17% 0.19% -0.15% 0.28%
CHINA SHENHUA ENERGY 0.27% -0.10% -0.36% 0.00% 0.00%
SINOPEC CORP 0.32% -0.37% -0.23% 0.00% -0.07%
CHINA COSCO -0.59% 0.76% 0.23% -0.15% -0.69%
CHINA RAILWAY -0.04% 0.50% -0.23% 0.40% -0.72%
CHINA COAL -0.06% 0.09% -0.39% -0.61% -1.53%
ZTE 0.18% 0.65% 1.07% 0.69% -0.07%
Panel D: Simulation trade in A share market (the coefficient after hypothesis test)
Name 5 Day 10 Day 20 Day 30 Day 40 Day
ANGANG NEWSTEEL 0.49% 0.01% -0.55% -0.68% -0.59%
HUANENG POWER -0.03% 0.18% 0.22% 0.54% 0.18%
TSINGTAO BREW 0.37% -0.05% 0.00% - -
CHINA MERCHANTS BANK 0.02% 0.56% -0.39% 0.48% 0.18%
AIR CHINA 0.11% -0.09% 0.70% - -
CHALCO -0.34% -0.37% -0.28% 0.64% -0.90%
CSR 0.24% 0.01% -0.60% -0.23% -0.91%
PING AN 0.02% 0.01% 0.95% -0.14% -0.25%
CHINA LIFE -0.08% 0.02% 0.32% -0.15% 0.28%
CHINA SHENHUA ENERGY 0.42% 0.47% 0.12% 0.59% 0.00%
SINOPEC CORP -0.25% -0.32% -0.23% 0.00% -0.07%
CHINA COSCO -0.28% 0.55% 0.11% -0.34% -0.69%
CHINA RAILWAY 0.01% -0.15% 0.11% 0.26% -0.72%
CHINA COAL 0.07% -0.26% -0.28% 0.02% -1.53%
ZTE 1.21% 0.97% 0.49% 0.24% -0.07%
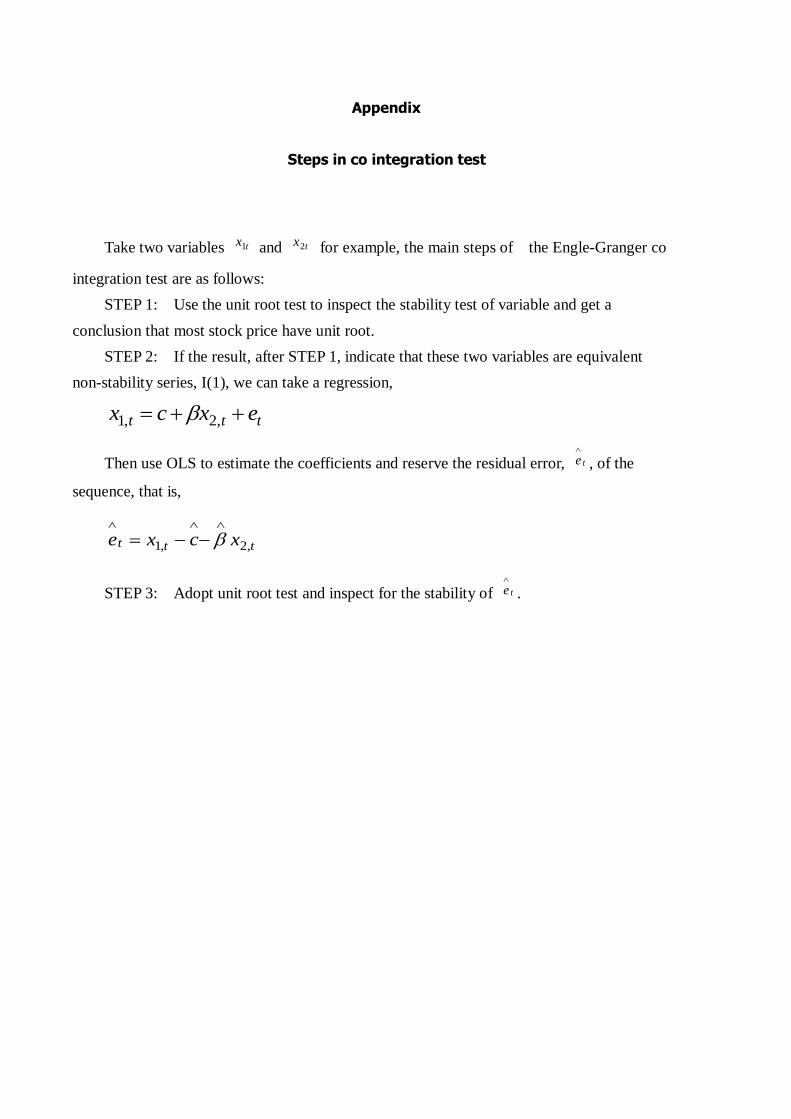
Appendix
Steps in co integration test
Take two variables tx1 and tx2 for example, the main steps of the Engle-Granger co
integration test are as follows:
STEP 1: Use the unit root test to inspect the stability test of variable and get a
conclusion that most stock price have unit root.
STEP 2: If the result, after STEP 1, indicate that these two variables are equivalent
non-stability series, I(1), we can take a regression,
ttt excx ,2,1
Then use OLS to estimate the coefficients and reserve the residual error, te
, of the
sequence, that is,
ttt xcxe ,2,1
STEP 3: Adopt unit root test and inspect for the stability of te
.

Our responsibility is to provide strong academic programs that instill excellence,confidence and strong leadership skills in our graduates. Our aim is to (1)promote critical and independent thinking, (2) foster personal responsibility and(3) develop students whose performance and commitment mark them as leaderscontributing to the business community and society. The College will serve as acenter for business scholarship, creative research and outreach activities to thecitizens and institutions of the State of Rhode Island as well as the regional,national and international communities.
Mission
The creation of this working paper serieshas been funded by an endowmentestablished by William A. Orme, URICollege of Business Administration,Class of 1949 and former head of theGeneral Electric Foundation. This workingpaper series is intended to permit facultymembers to obtain feedback on researchactivities before the research is submitted toacademic and professional journals andprofessional associations for presentations.
An award is presented annually for the mostoutstanding paper submitted.
Founded in 1892, the University of Rhode Island is one of eight land, urban, and sea grantuniversities in the United States. The 1,200-acre rural campus is lessthan ten miles from Narragansett Bay and highlights its traditions ofnatural resource, marine and urban related research. There are over14,000 undergraduate and graduate students enrolled in seven degree-granting colleges representing 48 states and the District of Columbia.More than 500 international students represent 59 different countries.Eighteen percent of the freshman class graduated in the top ten percentof their high school classes. The teaching and research faculty numbersover 600 and the University offers 101 undergraduate programs and 86advanced degree programs. URI students have received Rhodes,
Fulbright, Truman, Goldwater, and Udall scholarships. There are over 80,000 active alumnae.
The University of Rhode Island started to offer undergraduate businessadministration courses in 1923. In 1962, the MBA program was introduced and the PhDprogram began in the mid 1980s. The College of Business Administration is accredited byThe AACSB International - The Association to Advance Collegiate Schools of Business in1969. The College of Business enrolls over 1400 undergraduate students and more than 300graduate students.
Ballentine HallQuadrangle
Univ. of Rhode IslandKingston, Rhode Island