william hunnicutt
DESCRIPTION
qqTRANSCRIPT

7/17/2019 William Hunnicutt
http://slidepdf.com/reader/full/william-hunnicutt 1/139
CHARACTERIZATION OF CALCIUM-SILICATE-HYDRATE AND CALCIUM-ALUMINO-SILICATE-HYDRATE
BY
WILLIAM ALBERT HUNNICUTT
THESIS
Submitted in partial fulfillment of the requirements
for the degree of Master of Science in Civil Engineeringin the Graduate College of theUniversity of Illinois at Urbana-Champaign, 2013
Urbana, Illinois
Adviser:
Professor Leslie Struble

7/17/2019 William Hunnicutt
http://slidepdf.com/reader/full/william-hunnicutt 2/139
ii
ABSTRACT
The primary objectives of this thesis were to synthesize calcium silicate hydrate
(C-S-H) and calcium aluminosilicate hydrate (C-A-S-H) and characterize their
structures with varying Ca/Si ratios and aluminum content. As a secondary objective,
carbonation behavior in synthesized C-S-H was studied. C-S-H was synthesized in the
lab using two different methods: the double decomposition of calcium nitrate and
sodium silicate solutions, and the direct reaction between calcium oxide and fumed
silica in water. In C-A-S-H the source of aluminum was sodium aluminate or aluminum
nitrate. A variety of phases were present depending on the degree of carbonation of the
C-S-H or C-A-S-H. C-S-H, C-A-S-H, alumina/silica gel, calcite, aragonite, and vaterite
were all observed throughout the course of study. X-ray diffraction (XRD) was the
technique used to identify these phases. XRD was also used to explore the changes in
crystal structure with varying Ca/Si ratios and aluminum content. No significant
changes to the crystal structure were found. The effect of Ca/Si ratio, aluminum
content, and synthesis method were studied on the molecular scale using 29Si and 27Al
nuclear magnetic resonance spectroscopy (NMR). An increasing Ca/Si ratio has the
effect of a shorter alumino-silicate chain length and an increase in aluminum content
increases the alumino-silicate chain length. Aluminum substitution occurred primarily
in the bridging tetrahedron position, but also in the pairing tetrahedron position.
Aluminum uptake was also examined with respect with Ca/Si ratio and was found to
decrease with increasing Ca/Si ratio. The changes in chemical environment of the
7/17/2019 William Hunnicutt
http://slidepdf.com/reader/full/william-hunnicutt 3/139
iii
aluminum ion with varying Ca/(Si+Al) ratios was also observed by 27Al NMR. It was
found that as the Ca/(Si+Al) ratio increased, the amount of chemical shielding of the
27Al nuclei decreased . Carbonation of C-S-H was also examined and it was found that
the double decomposition synthesis method allows for more rapid carbonation of the C-
S-H. The source of increased carbonation rate is the high pH of the solutions.

7/17/2019 William Hunnicutt
http://slidepdf.com/reader/full/william-hunnicutt 4/139
iv
ACKNOWLEDGEMENTS
I would like to first, and foremost, thank my advisor, Professor Leslie Struble, for
her guidance and support throughout this research project. Her dedication to her
research and students is unparalleled and I am grateful I had the opportunity to work
with her. Considerable thanks go to Dr. Jennifer Rapp as well for her invaluable help
with nuclear magnetic resonance spectroscopy. Without her constant support this
project would not have been possible. Professor Paramita Mondal has also contributed
through her helpful discussions and I look forward to my future work with her.
My fellow colleagues deserve recognition for their helpful discussions on a
multitude of topics related to this project. Eric Kim and Xu Chen provided many useful
conversations on nuclear magnetic resonance and the influence of alkali ions in
polymerized structures. Sravanthi Puligilla’s knowledge of, and willingness to discuss,
carbonation behavior was appreciated. Drew Bishop and Victor Elizondo aided me in
the laboratory frequently over the past two years and their time is appreciated.
A special thank you goes to Tom Wilson and Binh Phan at CalPortland – Central
Laboratory for their XRF analysis of my samples.

7/17/2019 William Hunnicutt
http://slidepdf.com/reader/full/william-hunnicutt 5/139
v
TABLE OF CONTENTS
1. INTRODUCTION .................................................................................................................... 1
2. LITERATURE REVIEW........................................................................................................... 4
2.1 NUCLEAR MAGNETIC RESONANCE SPECTROSCOPY ......................................... 4
2.2 STRUCTURE OF CALCIUM SILICATE HYDRATE .................................................... 5
2.3 EFFECT OF CA/SI RATIO ON MOLECULAR STRUCTURE .................................. 13
2.4 EFFECT OF ALUMINUM ON MOLECULAR STRUCTURE ................................... 16
2.5 CARBONATION OF C-S-H ........................................................................................... 19
3. EXPERIMENTAL PROCEDURES ....................................................................................... 21
3.1 SYNTHESES ...................................................................................................................... 21
3.2 X-RAY DIFFRACTION ................................................................................................... 27
3.3 NUCLEAR MAGNETIC RESONANCE ....................................................................... 28
3.4 X-RAY FLUORESCENCE ............................................................................................... 30
3.5 THERMOGRAVIMETRIC ANALYSIS ......................................................................... 30
4. RESULTS ................................................................................................................................. 31
4.1 XRD .................................................................................................................................... 32
4.2 29Si NMR ............................................................................................................................ 44
4.3 27Al NMR ........................................................................................................................... 76

7/17/2019 William Hunnicutt
http://slidepdf.com/reader/full/william-hunnicutt 6/139
vi
4.4 XRF ..................................................................................................................................... 96
4.5 TGA .................................................................................................................................. 105
5. DISCUSSION ........................................................................................................................ 108
5.1 EFFECT OF CA/SI RATIO ........................................................................................... 108
5.2 EFFECT OF AL INCORPORATION ........................................................................... 111
5.3 DEPENDENCE OF AL UPTAKE ON CA/SI RATIO .............................................. 115
5.4 CARBONATION ............................................................................................................ 121
6. CONCLUSIONS ................................................................................................................... 125
7. REFERENCES ....................................................................................................................... 127

7/17/2019 William Hunnicutt
http://slidepdf.com/reader/full/william-hunnicutt 7/139
1
1. INTRODUCTION
Calcium silicate hydrate (C-S-H) is the main binding component of portland
cement paste, constituting 60-70% of a fully hydrated paste [1]. In portland cement, β-
C2S and C3S hydrate to form calcium hydroxide (CH) and C-S-H. Cement shorthand
nomenclature is used throughout this thesis, where C=CaO, S=SiO2, A=Al2O3, H=H2O.
C-S-H and C-A-S-H imply a variable composition of these species. C-S-H is nearly
amorphous, has a variable stoichiometry, and is able to incorporate guest ions, most
notably aluminum. The natural calcium silicate hydrate tobermorite has been used
extensively as a model for the molecular structure of C-S-H. It is likely that
incorporation of aluminum into the C-S-H structure plays a role in the chemical and
mechanical behavior of C-S-H [2].
Supplementary cementitious materials (SCMs) can be added to concrete mixtures
to replace portland cement in order to gain beneficial properties. The most commonly
used SCMs, fly ash and slag, contain substantial amounts of reactive aluminum.
Kalousek was the first to show that aluminum can be incorporated into the natural
calcium silicate hydrate tobermorite [3]. Since then, there have been numerous reports
of aluminum in the C-S-H structure [2, 4, 5]. Aluminum substituted C-S-H (C-A-S-H) is
formed when portland cement is hydrated in the presence of Al3+ ions [6], which are
present when fly ash and slag are dissolved in water. The benefits of C-A-S-H can be
achieved in concrete by adding SCMs that contain reactive aluminum to concrete
mixtures.
7/17/2019 William Hunnicutt
http://slidepdf.com/reader/full/william-hunnicutt 8/139
2
The primary objective of the work presented in this thesis is to synthesize C-S-H
and C-A-S-H, which requires substantial detailed characterization techniques. Two
different synthesis methods are used, differing in starting materials and reaction time.
C-S-H and C-A-S-H of different Ca/Si and Al/Si ratios are synthesized. The molecular
structure of C-S-H and C-A-S-H was studied when varying these ratios. Additionally,
the effect of Ca/Si ratio on the incorporation of aluminum into the structure was
studied. The changes in molecular structure associated with changes in the Ca/Si and
Al/Si ratios are thought to influence the mechanical properties of C-S-H and C-A-S-H
and will be the subject of future work. The primary methods of characterization were:
X-ray diffraction (XRD) and magic angle spinning nuclear magnetic resonance (MAS-
NMR).
Carbonation of C-S-H and C-A-S-H was observed in this work and was
subsequently studied. The effect of carbonation of the molecular structure of C-S-H and
C-A-S-H is studied, along with factors that influence the rate of carbonation, such as the
introduction of sodium ions and changes in pH.
This thesis is divided into the following chapters. Chapter 2 is a literature review
discussing nuclear magnetic resonance spectroscopy, the molecular structure of C-S-H
and C-A-S-H with varying Ca/Si and Al/Si ratios, and carbonation of C-S-H with guest
ions. Chapter 3 describes experimental procedures, including syntheses and
characterization techniques. Chapter 4 presents the results of the characterization

7/17/2019 William Hunnicutt
http://slidepdf.com/reader/full/william-hunnicutt 9/139
3
techniques with analysis of XRD patterns and NMR spectra. Chapter 5 is a discussion of
the results and in Chapter 6 conclusions are drawn.

7/17/2019 William Hunnicutt
http://slidepdf.com/reader/full/william-hunnicutt 10/139
4
2. LITERATURE REVIEW
2.1 NUCLEAR MAGNETIC RESONANCE SPECTROSCOPY
Nuclear magnetic resonance spectroscopy (NMR) is a powerful characterization
method capable of providing information about the structure of materials. The method
exploits the interaction of nonzero spin nuclei and an external magnetic field to gain
information about the local atomic environment of a specific nucleus. In cementitious
materials, the 29Si and 27Al nuclei are the most widely studied nuclei. The NMR of solids
requires spinning the sample very quickly (kHz) at an angle of 54.7°, called the magic
angle. This simulates the Brownian motion of a liquid that is required for NMR
experiments of solids. Different nuclei have different natural abundances and spins
which affect the clarity of the resulting spectra. The 29Si nucleus has a spin of 1/2 and a
natural abundance of 4.7% and the 27Al has a spin of 5/2 and a natural abundance of
100%. Nuclei with a spin greater than 1/2 have a non-spherical electrical charge
distribution that causes an electric quadrupole moment. This causes the spectral lines to
be significantly broadened and interact differently with different strengths of magnetic
field due to the inhomogeneous interaction with the magnetic field [7]. This often leads
to difficult interpretation and limited data from the spectrum. The natural abundance of
a nucleus affects the time required for an experiment to achieve an acceptable
signal/noise ratio. A higher natural abundance requires less experimental time.
Much information can be gained from the 29Si nucleus in cementitious materials.
The presentation of structural information obtained from 29Si NMR in silicates often
7/17/2019 William Hunnicutt
http://slidepdf.com/reader/full/william-hunnicutt 11/139
5
uses Q notation: Qn(mAl), where Q indicates a silica tetrahedron forming bridges
through n oxygen atoms with adjacent tetrahedra, of which m are alumina tetrahedra,
where n and m range from 0 to 4 [8]. A Q1 structure would have a single silica
tetrahedron bonded to one other silica tetrahedron, Q2 is a silicon tetrahedron bonded
to two silica tetrahedra, and Q2(1Al) is a silica tetrahedron bonded to one silica
tetrahedron and one alumina tetrahedron.
The information gained from 27Al NMR is much more limited due to the
quadrupolar interaction of the 5/2 spin nucleus. The quadrupolar interaction causes
extreme line broadening that makes it nearly impossible to make fine distinctions in the
local atomic environment. An increase in the magnetic field used greatly reduces these
effects. The basic 27Al NMR experiment only gives information about the coordination
of the aluminum nucleus, and not information on specific local bonding to the nucleus.
Methods do exist that can gleam more information from the 27Al nucleus, such as multi-
quantum NMR, double rotation NMR, and dynamic angle spinning NMR [9].
2.2 STRUCTURE OF CALCIUM SILICATE HYDRATE
The chemical composition and molecular structure of calcium silicate hydrate (C-
S-H) is thought to substantially affect many properties of concrete, where it is the
primary binding phase. The structure of C-S-H has been studied extensively since the
first structural models were presented in 1952 [10]. Due to the low crystallinity of C-S-
H, X-ray diffraction (XRD) has not been the most useful method for characterizing the
material. Instead, more advanced techniques such as magic angle spinning nuclear

7/17/2019 William Hunnicutt
http://slidepdf.com/reader/full/william-hunnicutt 12/139
6
magnetic resonance (MAS-NMR), which detects short-range order, have aided much in
solving the structure of C-S-H.
2.2.1 STRUCTURAL MODELS
Several models for the molecular structure of C-S-H have been proposed, which
broadly portray it is a non-crystalline calcium oxide layer sandwiched by short and
discrete silicate chains [10, 11, 12, 13]. These models bear resemblance to the naturally
forming tobermorite and jennite, in which a calcium oxide layer is sandwiched by
infinite silicate chains. The silicate chain is comprised of tetrahedral silica in a
“dreierketten” arrangement, in which the smallest repeating unit is three tetrahedra,
one bridging and two pairing. Space between silicate chains is referred to as the
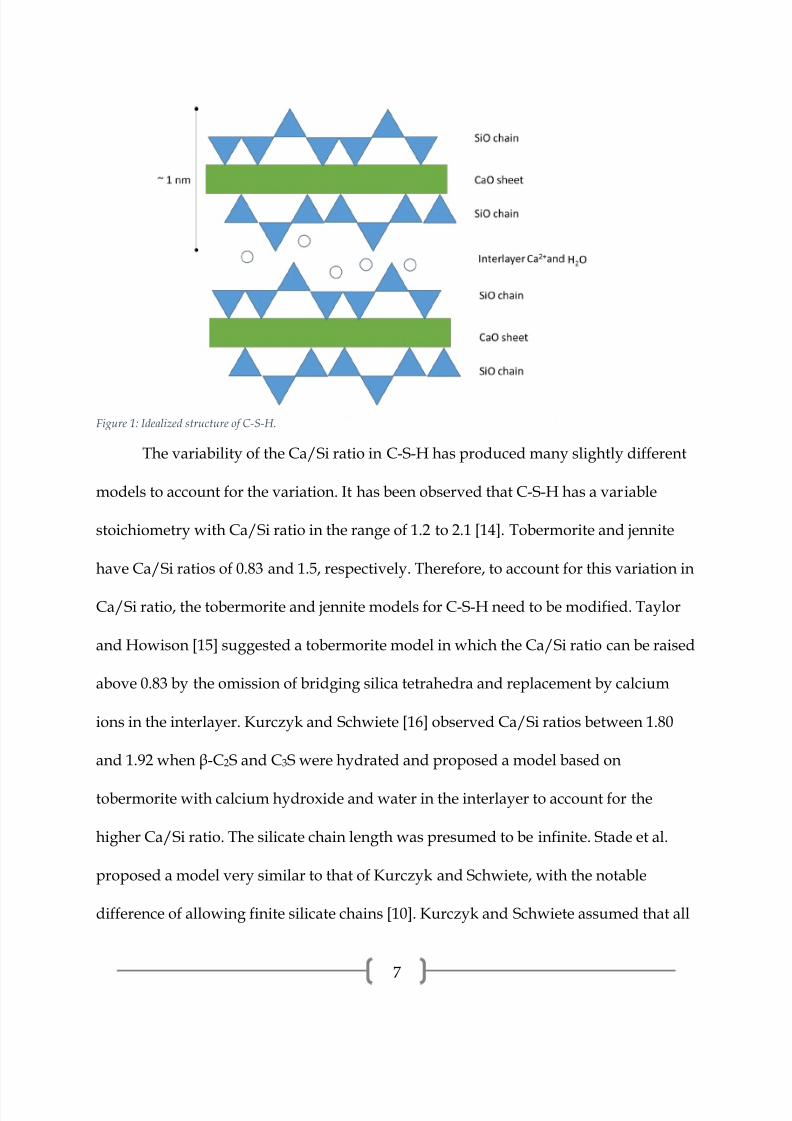
“interlayer”. A schematic of the structure is presented in Figure 1. It has been observed
experimentally that the length of the silicate chain follows 3n-1, where n is an integer
[10]. This is critical evidence of the “dreierketten” structure. The pairing tetrahedra
share two oxygen atoms with the calcium oxide layer and the bridging tetrahedra share
only one oxygen atom with the calcium oxide layer.
7/17/2019 William Hunnicutt
http://slidepdf.com/reader/full/william-hunnicutt 13/139
7
The variability of the Ca/Si ratio in C-S-H has produced many slightly different
models to account for the variation. It has been observed that C-S-H has a variable
stoichiometry with Ca/Si ratio in the range of 1.2 to 2.1 [14]. Tobermorite and jennite
have Ca/Si ratios of 0.83 and 1.5, respectively. Therefore, to account for this variation in
Ca/Si ratio, the tobermorite and jennite models for C-S-H need to be modified. Taylor
and Howison [15] suggested a tobermorite model in which the Ca/Si ratio can be raised
above 0.83 by the omission of bridging silica tetrahedra and replacement by calcium
ions in the interlayer. Kurczyk and Schwiete [16] observed Ca/Si ratios between 1.80
and 1.92 when β-C2S and C3S were hydrated and proposed a model based on
tobermorite with calcium hydroxide and water in the interlayer to account for the
higher Ca/Si ratio. The silicate chain length was presumed to be infinite. Stade et al.
proposed a model very similar to that of Kurczyk and Schwiete, with the notable
difference of allowing finite silicate chains [10]. Kurczyk and Schwiete assumed that all
Figure 1: Idealized structure of C-S-H.

7/17/2019 William Hunnicutt
http://slidepdf.com/reader/full/william-hunnicutt 14/139
8
silicate dimers were fully protonated. Taylor [13] continued to develop his earlier work
in modeling the structure of C-S-H by proposing a model that is composed of structural
components of jennite and 1.4 nm tobermorite. The range in Ca/Si ratio was explained
by omission of bridging tetrahedra, and was linearly proportional to the reciprocal of
the silicate chain length. However, limiting assumptions were made about protonation
of silica tetrahedra.
Richardson and Groves [12, 17] proposed a general model that could be
interpreted from the tobermorite/jennite or tobermorite/calcium hydroxide
perspective. This model did not fix the level of protonation of the silicate chain. The
generalized model is very similar to many of the previous models for the structure of C-
S-H, but its generality allows for the specific inconsistencies of other models to be
compensated. Cong and Kirkpatrick [11] proposed a defect-tobermorite structure
similar to 1.4 nm tobermorite, except with a substantial amount of defects and less
order. These defects stem from the omission of bridging tetrahedra and the silica
tetrahedra are displaced and rotated relative to the CaO layer. Electroneutrality is
maintained by Ca2+ and OH- in the interlayer depending on the availability of Ca2+.
Richardson [18] noted that the models by Cong and Kirkpatrick [11], Nonat and Lecoq
[19], and Chen et al. [20] are very similar to the generalized Richardson and Groves
model.

7/17/2019 William Hunnicutt
http://slidepdf.com/reader/full/william-hunnicutt 15/139
9
2.2.2 INCORPORATION OF ALUMINUM
Richardson and Groves’ model also accounts for guest ions to be incorporated
into the C-S-H structure. Kalousek [3] was the first to note that aluminum ions can
substitute for silicon in the silicate chain in tobermorite and suggested that substitution
only occurs in the bridging tetrahedra. Komarneni et al. [21] synthesized tobermorite
with aluminum by direct reaction in a Parr bomb and examined samples by XRD and
MAS-NMR. The authors observed that aluminum is tetrahedrally coordinated in
tobermorite. Aluminum occurred in both Q2 (chain) and Q3 (branching) sites, as
inferred from 29Si NMR. A schematic of aluminum in a Q3 site is presented in Figure 2.
Faucon et al. [5] noted tetrahedral and octahedral aluminum in C-A-S-H synthesized by
direct reaction of calcium hydroxide, silica, and gypsite in water. The octahedral
aluminum was suggested to occur in the octahedral layer or interlayer of C-A-S-H. Two
different tetrahedral aluminum sites were assigned: In the bridging tetrahedra and the
pairing tetrahedra positions with a majority being in the bridging position [22, 23].
These assignments were based on an advanced NMR method known as triple quantum
NMR (3Q-NMR), which gives better resolution of quadrupolar nuclei, in addition to 29Si
MAS-NMR, which indicated aluminum linkage to tetrahedral silicon. The maximum
Al[4]/(Si+Al[4]) was 0.26. The authors noted that this is still well below the expected
maximum of 0.50 in accordance with the Lowenstein rule, which states that no Al-O-Al
bonds will occur. The explanation of this is that high electrostatic repulsion is induced
within the aluminosilicate chains by the net negative charge of aluminum and that a
minimum distance between aluminum tetrahedra is required. The addition of sodium

7/17/2019 William Hunnicutt
http://slidepdf.com/reader/full/william-hunnicutt 16/139
10
into the chemical system allowed for a higher degree of aluminum substitution, most
likely due to charge balancing of aluminum by sodium ions in the interlayer.
Sun et al. [2] found tetrahedral, pentahedral, and octahedral aluminum in C-S-H
synthesized from the double decomposition of sodium silicate and calcium nitrate.
Double decomposition refers to the chemical reaction of two solutions that produces
two products, one precipitates and the other remains in solution. Tetrahedral aluminum
occurred in the bridging tetrahedra site while pentahedral and octahedral aluminum
occur in the interlayer and possibly on particle surfaces. The presence of aluminum
substituting for calcium in the octahedral layer was ruled out due to lack of change in
the XRD pattern when aluminum was incorporated into the structure. Incorporation of
aluminum in the octahedral layer would have caused a change in the (hk0) dimensions.
The tetrahedral aluminum in the bridging site was found to be in three different
Figure 2: Idealized structure of C-A-S-H with crosslinking.

7/17/2019 William Hunnicutt
http://slidepdf.com/reader/full/william-hunnicutt 17/139
11
chemical environments by 29Si MAS-NMR and 27Al MAS-NMR: Q3 sites bonding across
the interlayer, Q2 sites charge balanced by Ca2+, Na+, or H+ in the interlayer, and Q2 sites
charged balanced by pentahedral and octahedral aluminum in the interlayer. It was
suggested that aluminum enters the bridging tetrahedra site preferentially since this
position shares only one bond with the calcium oxide layer, and the pairing position
shares two bonds with the calcium oxide layer. Therefore, the bridging position is more
able to accommodate a different size atom. The Al[4]-O bond length is approximately
0.01 nm longer than the Si-O bond length and there is more room to fit into the C-S-H
structure at bridging sites than pairing sites. The maximum observed substitution of
silicon by tetrahedral aluminum (Al[4]/(Si+Al[4])) was 0.22. Samples with longer
reaction times had an Al[4]/(Si+Al[4]) of 0.17, corresponding to 1/6 of all tetrahedra, or
1/2 of bridging tetrahedra.
Andersen et al. [6, 24] hydrated white portland cement in water and a solution of
NaAlO2. Tetrahedral, pentahedral, and octahedral aluminum were detected by 27Al
MAS-NMR, but it was determined that only tetrahedral aluminum occurs in the silicate
chain while pentahedral aluminum occurs in the interlayer. The octahedral aluminum
was thought to occur in other aluminate phases, such as ettringite, monosulfate, and a
third aluminate hydrate phase by evidence from cross polarization MAS-NMR
experiments. When Faucon [25] found octahedral aluminum, the authors assigned it to
the octahedral layer of C-A-S-H, substituting for calcium. However, Andersen et al.
produced substantial evidence that octahedral aluminum does not substitute for
7/17/2019 William Hunnicutt
http://slidepdf.com/reader/full/william-hunnicutt 18/139
12
calcium in the octahedral layer in C-S-H [6, 24]. Tetrahedral aluminum was found to
occur only in Q2 sites by 29Si MAS-NMR. The amount of aluminum substitution in C-S-
H (Al/Si) ranged from 0.059 to 0.104. The authors suggested that high amounts of
aluminum (Al/Si≈0.20) can only be incorporated into synthetic C-S-H when the
Al[4]/Si ratios of the initial reagents are high, such as in Faucon’s work [5, 22, 23].
Schneider et al. [26] activated blast-furnace slag cements with various activation
and curing conditions. The 27Al and 29Si MAS-NMR corroborated to indicate that
tetrahedral aluminum is occurring in the silicate chain of C-S-H, but it was not possible
to discern whether aluminum was in the bridging and pairing positions. It was found
that less substitution occurred when activated with CH and more substitution occurred
when activated with solutions containing high concentrations of Na2O. It is thought that
sodium plays a key role in charge balancing the aluminum tetrahedra.
Molecular dynamics simulations have also allowed for study of the incorporation
of aluminum in C-S-H and gives a slightly different insight to the nature of aluminum
substitution. Faucon et al. [27] studied C-S-H with Ca/Si ratios of 0.66 and 0.83, which
are closer to that of tobermorite than C-S-H from portland cement hydration, with the
incorporation of aluminum. When aluminum was placed in the bridging tetrahedra and
the structure was relaxed, no rupture of the aluminosilicate chain was observed and the
charge deficit was compensated primarily by protons. When aluminum is positioned in
the pairing tetrahedra the chain breaks and Q1 tetrahedra are formed. It was observed
that, despite this reorganization, there was no chain ending aluminum tetrahedron.

7/17/2019 William Hunnicutt
http://slidepdf.com/reader/full/william-hunnicutt 19/139
13
Manzano et al. [28] showed that, when aluminum is incorporated, the 3n-1 chain length
is still maintained, as observed in C-S-H not substituted by aluminum by Richardson
[10]. It was thought that chain growth was caused by the merging of dimers to create
pentamers. It was noted that the energy gains to create Si monomers was higher than to
produce dimers, so the merging mechanism is secondary to monomer production.
When aluminum provides the link between dimers the merging energy is significantly
higher than when silicon provides the link, resulting in a more favorable process.
Aluminum was also considered in the pairing and chain ending positions and it was
found that aluminum is most favorable in the bridging position followed by pairing
and chain ending. In a separate molecular dynamics study, Manzano et al. [29] noted
that, as the Ca/Si ratio of the C-S-H increases, aluminum is more likely to be
incorporated into the pairing tetrahedra position.
2.3 EFFECT OF CA/SI RATIO ON MOLECULAR STRUCTURE
The Ca/Si ratio of C-S-H is variable in the range of 1.2 to 2.1 in hydrated cement
[14]. This variability has an effect on the molecular structure of C-S-H. Modern and well
accepted models for the structure of C-S-H consider the change in Ca/Si ratio by
omitting bridging silica tetrahedra and adding interlayer Ca2+ when the Ca/Si ratio is
increased [10]. Grutzeck et al. [30] synthesized C-S-H by direct reaction of fumed silica
and freshly calcined CaCO3 in water with Ca/Si ratios ranging from 0.00 to 1.31.
Samples with a Ca/Si ratio below 0.12 consisted of Q3 and Q4 silica tetrahedra at -100.7
ppm and 114.5 ppm as measured by 29Si NMR. The sample at Ca/Si=0.12 Q3 and Q4

7/17/2019 William Hunnicutt
http://slidepdf.com/reader/full/william-hunnicutt 20/139
14
sites were still present and a new peak at -85.0 ppm assigned to Q2 appeared. At
Ca/Si=0.91 a small shoulder attributed to Q1 appeared, indicating the end of a silicate
chain. At Ca/Si ratios above 1.07 contained only peaks attributable to Q2 and Q1.
Cong and Kirkpatrick [11] synthesized C-S-H with Ca/Si ratios ranging from
0.41 to 1.85. The highest Ca/Si ratio that formed phase-pure C-S-H was 1.56, above
which calcium hydroxide was also formed. Amorphous silica was present when the
Ca/Si ratio was 0.41. The crystal cell dimensions of the C-S-H varied with Ca/Si ratios.
The ‘a’ dimension increased and the ‘b’ and ‘c’ dimensions decreased with increasing
Ca/Si ratios. The 29Si NMR results indicate that samples with Ca/Si ratios at or below
0.79 had Q3 peaks at approximately -94 ppm. The sample with Ca/Si=0.41 also had Q4
peaks which were assigned to silica gel. In higher Ca/Si ratios, only Q1 and Q2 peaks
were observed. The ratio Q1/ΣQi was used as indicator of silicate chain polymerization
and decreased as Ca/Si increased. At Ca/Si>1.3 the amount of polymerization
decreased less rapidly than at lower Ca/Si ratios.
Garcia-Lodeiro et al. [31] synthesized C-S-H by double decomposition of sodium
silicate and calcium nitrate with Ca/Si ratios of ranging from 0.39 to 1.54. The authors
noted that substantial carbonation occurred in all samples except for those with Ca/Si
ratios of 1.02 and 1.54. This was intentionally done by exposing the reaction to
laboratory air during synthesis. In the samples with Ca/Si ratios of 0.75, 0.67, and 0.65 a
peak at approximately -83 ppm appeared which was assigned to Q2 silica tetrahedra in
the bridging position, in addition to Q2 in the pairing position and Q1. The other
7/17/2019 William Hunnicutt
http://slidepdf.com/reader/full/william-hunnicutt 21/139
15
samples with higher Ca/Si also showed intensity in this range, but a clear peak could
not be identified due to overlap of the Q2 pairing and Q1 peaks. In the two samples that
were not carbonated, the mean chain length (MCL) of the silicate chain was 4.68 and
3.02 silica tetrahedra for Ca/Si ratios of 1.02 and 1.54, respectively.
Faucon et al. [27] conducted molecular dynamics simulations with Ca/Si ratios
of 0.66 and 0.83. At Ca/Si=0.66 the chains were infinitely long and at Ca/Si=0.83 about
15% of the silica tetrahedra were Q1. When the Ca/Si=0.66 the oxygen atoms bonded to
the bridging silica tetrahedra that were not shared with pairing tetrahedra were
hydroxylated. When the Ca/Si=0.83 Ca2+ is in the interlayer and creates a charge deficit
on the oxygen atoms bonded to the bridging silica tetrahedra that were not shared with
pairing tetrahedra. This is the result of the rupture of the silicate chain and subsequent
hydroxylation of the silica tetrahedra and formation of Q1 environments.
Dolado et al. [1] used molecular dynamics simulations of C-S-H with varying
Ca/Si ratios to examine the structure. C-S-H with Ca/Si ratios of 0.7, 1.0, 1.4, and 2.0
were simulated. It was found that the presence of Ca atoms decreases the rate of
polymerization of the silica chain. The simulation with Ca/Si=0.7 had 15% Q3+Q4
environments and that proportion decreased with increasing Ca/Si ratios. At Ca/Si=2.0
all nonlinear environments were absent. Calcium ions were concluded to enforce linear
structures. Additionally, the ratio of Q1/(Q1+Q2+Q3), an inverse indicator of silicate
chain length, increased as the Ca/Si ratio increased.
7/17/2019 William Hunnicutt
http://slidepdf.com/reader/full/william-hunnicutt 22/139
16
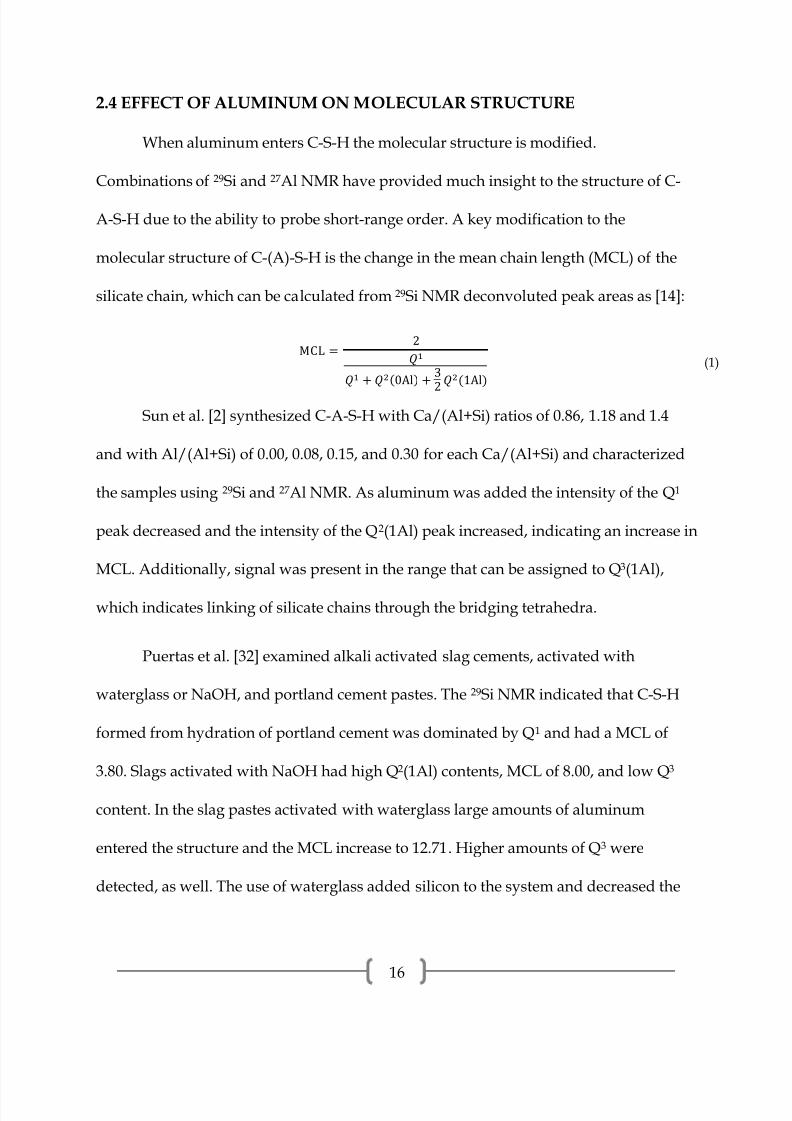
2.4 EFFECT OF ALUMINUM ON MOLECULAR STRUCTURE
When aluminum enters C-S-H the molecular structure is modified.
Combinations of 29Si and 27Al NMR have provided much insight to the structure of C-
A-S-H due to the ability to probe short-range order. A key modification to the
molecular structure of C-(A)-S-H is the change in the mean chain length (MCL) of the
silicate chain, which can be calculated from 29Si NMR deconvoluted peak areas as [14]:
MCL =2
+ (0Al) + 3
2
(1Al)
(1)
Sun et al. [2] synthesized C-A-S-H with Ca/(Al+Si) ratios of 0.86, 1.18 and 1.4
and with Al/(Al+Si) of 0.00, 0.08, 0.15, and 0.30 for each Ca/(Al+Si) and characterized
the samples using 29Si and 27Al NMR. As aluminum was added the intensity of the Q1
peak decreased and the intensity of the Q2(1Al) peak increased, indicating an increase in
MCL. Additionally, signal was present in the range that can be assigned to Q3(1Al),
which indicates linking of silicate chains through the bridging tetrahedra.
Puertas et al. [32] examined alkali activated slag cements, activated with
waterglass or NaOH, and portland cement pastes. The 29Si NMR indicated that C-S-H
formed from hydration of portland cement was dominated by Q1 and had a MCL of
3.80. Slags activated with NaOH had high Q2(1Al) contents, MCL of 8.00, and low Q3
content. In the slag pastes activated with waterglass large amounts of aluminum
entered the structure and the MCL increase to 12.71. Higher amounts of Q3 were
detected, as well. The use of waterglass added silicon to the system and decreased the

7/17/2019 William Hunnicutt
http://slidepdf.com/reader/full/william-hunnicutt 23/139
17
Ca/Si ratio of the C-S-H. The decrease in Ca/Si ratio may be the cause of the difference
between activated slag pastes.
Andersen et al. [6] hydrated white portland cement with water and with a
solution of 0.3 M NaAlO2. Aluminum from the NaAlO2 solution was taken up into the
bridging tetrahedra and the quantity of aluminum increased with hydration time.
When hydration occurred in NaAlO2 solution, the C-(A)-S-H had a slightly longer chain
length at every time interval measured (12 hours to 1 year) than the C-(A)-S-H hydrated
in water. The difference ranged between 0.08 and 0.58 tetrahedra.
Garcia-Lodeiro et al. [33] synthesized C-S-H from the double decomposition of
calcium nitrate and sodium silicate solutions. A control sample and samples with
NaOH, NaOH and Al(NO3)3 , and NaOH and Al(NO3)3 and Na2SiO3 were
characterized. The control sample was predominately Q1 from 29Si NMR while the rest
of the samples showed large Q2
peaks with small Q1
peaks. Peaks assigned to Q3
and Q4
sites were also detected, most likely from a silica gel-like material with ionic
substitutions. The MCL for samples the control sample and sample with NaOH were
3.05 and 9.44, respectively. MCL was not given for samples with NaOH and Al(NO3)3
and samples with NaOH, Al(NO3)3, and Na2SiO3, but the proportion of Q1 was low
compared to Q2(nAl) sites, indicating long chain lengths.
Garcia-Lodeiro [34] studied C-S-H synthesized with a target Ca/Si ratio of 1.9
and the effect of the simultaneous addition of aluminum nitrate and sodium hydroxide.
The addition of aluminum and sodium caused a shift in the 29Si NMR spectra from

7/17/2019 William Hunnicutt
http://slidepdf.com/reader/full/william-hunnicutt 24/139
18
predominantly Q1 to Q2. Small amounts of Q3 were present and it was inferred that this
arose from silica gel due to carbonation of the samples. The possibility of sample
carbonation make it difficult to draw conclusions on the effect of the simultaneous
addition of aluminum and sodium on the molecular structure of C-S-H.
Andersen et al. [24] hydrated white portland cement in 0.3 M and 0.5 M solutions
of NaAlO2 and characterized the pastes with 29Si and 27Al NMR. A steady increase in
Q2(1Al) intensity was detected with time and the intensity was greater with higher
concentrations of NaAlO2. The MCL was consistently higher for higher concentrations
of NaAlO2 and increased with time. After 2 years, the MCL of the cement hydrated in
water, 0.3 M NaAlO2, and 0.5 M NaAlO2 were 3.85, 5.17, and 6.09, respectively. A
method of calculating the mean chain length of “pure” SiO4 tetrahedra was suggested
as:
MCL = + + (1)
12
( + (1)) (2)
The MCLSi were 3.13, 3.55, and 3.56 for cement hydrated in water, 0.3 M NaAlO2, and
0.5 M NaAlO2, respectively. Since the MCLSi values are lower than the MCL values the
authors concluded that the alumina tetrahedra are linking existing silicate chains.
Manzano et al. [29] used molecular dynamics to study aluminum in C-S-H and
the resulting molecular structure. Linear structures (Q2) were always found to be
dominant, but as the Al/Si ratio increased the proportion of Q3+Q4 increased for

7/17/2019 William Hunnicutt
http://slidepdf.com/reader/full/william-hunnicutt 25/139
19
various Ca/Si ratios. Similarly, as Al/Si increased the MCL increased. Simulations
showed good agreement with experimental MCL data.
2.5 CARBONATION OF C-S-H
Carbonation of C-S-H is an issue that has plagued many characterization studies
of synthesized C-S-H. Four phases of calcium carbonate exist with increasing stability,
amorphous calcium carbonate, vaterite, aragonite, and calcite [35]. Carbonated C-S-H
becomes highly porous with a low Ca/Si ratio, upon further reaction, hydrous silica is
formed with a Q3 and Q4 structure [36].
Garcia-Lodeiro et al. [33] noted that when synthesized C-S-H was mixed with a
solution of 8 M NaOH, calcite peaks appeared in the XRD pattern and the 29Si spectrum
indicated a large increase in MCL, from 3.05 to 9.44. Additionally, Q3 and Q4 sites were
present, which are associated with the formation of silica gel. The authors stated that
the addition of highly concentrated alkali solution caused polymerization of the silicate
structure.
Groves et al. [37] studied hydrated C3S pastes in regard to carbonation in a CO2
environment. By XRD, calcite was the most dominant polymorph of calcium carbonate,
with some vaterite. From 29Si NMR, as the carbonation time increased the predominant
peak shifted from Q1 to Q2 with some Q3 and Q4 becoming apparent after 4 hours and
abundant after 8 hours. When the paste was carbonated for 16 hours a large amorphous
hump was observed in the XRD pattern around 20° 2θ indicating silica gel. It was stated
that the calcium hydroxide present in the C3S paste initially carbonated more quickly

7/17/2019 William Hunnicutt
http://slidepdf.com/reader/full/william-hunnicutt 26/139
20
than C-S-H, but the rate decreased after approximately half of the CH had reacted. C-S-
H continued to carbonate through this period.
Garcia-Loderio [38] studied synthesized C-S-H with Ca/Si of 1.9 mixed with
different amounts of an 8M solution of sodium hydroxide to achieve specific
Na2O/SiO2 ratios. FTIR analysis indicated that calcium carbonate was present in all
samples. When NaOH was added, the CH band that was present in the control sample
disappeared and the intensity of the calcite bands increased. It is expected that the
addition of NaOH would encourage the precipitation of CH due to the common ion
effect. The authors proposed that Ca2+ is being redistributed on the surface of C-S-H or
N-S-H (sodium silicate hydrate) to satisfy surface charges and that sodium silicate gels
are formed or the degree of silicate polymerization in C-S-H is increased by the addition
of NaOH. As the amount of NaOH increased, bands in the FTIR spectra indicated that
silica gel may be forming. The authors also stated that carbonation can cause
polymerization and silica gel formation and cannot be ruled out for the development of
these characteristics. Other literature indicates that these characteristics are typical of
carbonation of C-S-H [37].

7/17/2019 William Hunnicutt
http://slidepdf.com/reader/full/william-hunnicutt 27/139
21
3. EXPERIMENTAL PROCEDURES
3.1 SYNTHESES
C-S-H and C-A-S-H were synthesized by two methods using different sources of
calcium and silicon. The double decomposition method was chosen for its fast reaction
rate while the direct reaction was chosen for the lack of extraneous ions in the reaction.
Both methods have been used frequently for C-S-H synthesis [2, 4, 5, 20, 34].
The sample names follow the formatting presented here.
“MATERIAL”_”SYNTHESIS METHOD”_”Ca/Si OR Ca/(Si+Al)””IDENTIFIER,”
where the “MATERIAL” is CSH or CASH, “SYNTHESIS METHOD” is DD, for double
decomposition, or DR, for direct reaction, “Ca/Si OR Ca/(Si+Al)” is a numeral, and
“IDENTIFIER” is an alphabetic character used to differentiate similar samples, their
meaning is stated in the text.
3.1.1 DOUBLE DECOMPOSITION
C-S-H was synthesized by double decomposition of solutions of sodium silicate
and calcium nitrate. Nanopure water was boiled to remove dissolved CO2 and
subsequently placed under vacuum and rapidly cooled to room temperature using an
ice water slurry. Quantities of sodium silicate (Na2SiO3.9H2O Fisher Scientific) and
calcium nitrate (Ca(NO3).4H2O Fisher Scientific), shown in Table 1, where added to 125
mL and 75 mL of water, respectively. The calcium nitrate solution was added drop by
drop to the continuously stirred sodium silicate solution under continuous nitrogen
flow to avoid exposure to CO2. A precipitate formed immediately. The 500 mL HDPE
7/17/2019 William Hunnicutt
http://slidepdf.com/reader/full/william-hunnicutt 28/139
22
bottle containing the solution and precipitate was backfilled with nitrogen, capped, and
allowed to stir for one hour. The precipitate was then filtered using a Buchner funnel
and Whatman Grade 50 filter paper (2.7 µm). Samples CSH_DD_1.0A, CSH_DD_1.3A,
and CSH_DD_1.5A were rinsed with 100 mL of degassed Nanopure water and 200 mL
of ethanol. Samples CSH_DD_1.1B, CSH_DD_1.3B, CSH_DD_0.8B, CSH_DD_1.5B, and
CSH_DD_0.9B were rinsed with 2 liters of degassed Nanopure water.
C-A-S-H was synthesized by taking half of the C-S-H synthesized by the above
method and adding it to 140 mL of a solution of sodium aluminate backfilled with
nitrogen and stirring for 24 hours. Additionally, CASH_DD_2.2H and CASH_DD_2.2L
were synthesized in a similar method with high, “H”, and low, “L”, aluminum
amounts. The precipitate was then filtered using a Buchner funnel and Whatman Grade
50 filter paper (2.7 µm) and rinsed with 2 liters of degassed Nanopure water. Table 1
shows the proportions of each reagent used in synthesis.
7/17/2019 William Hunnicutt
http://slidepdf.com/reader/full/william-hunnicutt 29/139
23
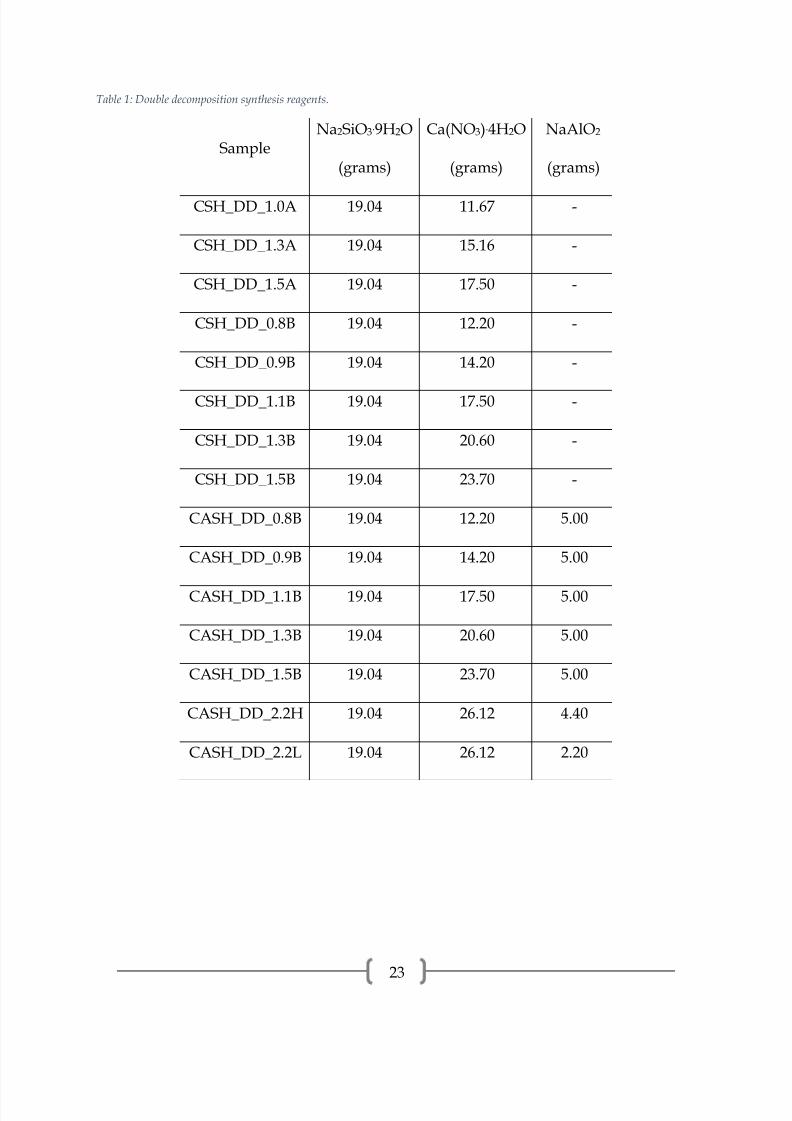
Table 1: Double decomposition synthesis reagents.
SampleNa2SiO3.9H2O
(grams)
Ca(NO3).4H2O
(grams)
NaAlO2
(grams)
CSH_DD_1.0A 19.04 11.67 -
CSH_DD_1.3A 19.04 15.16 -
CSH_DD_1.5A 19.04 17.50 -
CSH_DD_0.8B 19.04 12.20 -
CSH_DD_0.9B 19.04 14.20 -
CSH_DD_1.1B 19.04 17.50 -
CSH_DD_1.3B 19.04 20.60 -
CSH_DD_1.5B 19.04 23.70 -
CASH_DD_0.8B 19.04 12.20 5.00
CASH_DD_0.9B 19.04 14.20 5.00
CASH_DD_1.1B 19.04 17.50 5.00
CASH_DD_1.3B 19.04 20.60 5.00
CASH_DD_1.5B 19.04 23.70 5.00
CASH_DD_2.2H 19.04 26.12 4.40
CASH_DD_2.2L 19.04 26.12 2.20
7/17/2019 William Hunnicutt
http://slidepdf.com/reader/full/william-hunnicutt 30/139
24
3.1.2 DIRECT REACTION
C-S-H was synthesized by the direct reaction of calcium oxide and fumed silica
in water. Calcium oxide was obtained by calcining CaCO3 (Sigma-Aldrich) at 900°C for
24 hours and storing in a vacuum desiccator. Fumed silica (SiO2, Sigma-Aldrich) was
placed in an oven at 105°C for at least three hours to remove water. Nanopure water
was boiled to remove dissolved CO2 and subsequently placed under vacuum and
rapidly cooled to room temperature using an ice water slurry. Quantities of calcium
oxide (CaO) and fumed silica, shown in Table 2, were dry mixed in 500 mL HDPE
bottles. Four hundred mL of degassed Nanopure water was added to the bottles,
backfilled with nitrogen, shaken, and allowed to stir for one week. The precipitate was
then filtered using a Buchner funnel and Whatman Grade 50 filter paper (2.7 µm) and
rinsed in two batches with 100 mL of degassed Nanopure water and 200 mL of ethanol
for each batch.
C-A-S-H was synthesized similarly to the C-S-H. Nanopure water was boiled to
remove dissolved CO2 and subsequently placed under vacuum and rapidly cooled to
room temperature using an ice water slurry. For samples CASH_DR_1.0A,
CASH_DR_1.3A, CASH_DR_1.5A, CASH_DR_1.0B, CASH_DR_1.3B, and
CASH_DR_1.5B quantities of calcium oxide (CaO), fumed silica (SiO2), and aluminum
nitrate (Al(NO3)3.9H2O Sigma-Aldrich), shown in Table 2, were dry mixed in 500 mL
HDPE. Four hundred mL of degassed Nanopure water was added to the bottles,
backfilled with nitrogen, shaken, and allowed to stir for one week. For samples

7/17/2019 William Hunnicutt
http://slidepdf.com/reader/full/william-hunnicutt 31/139
25
CASH_DR_0.9H, CASH_DR_1.1H, CASH_DR_1.3H, CASH_DR_1.5H,
CASH_DR_1.7H, CASH_DR_0.9L, CASH_DR_1.1L, CASH_DR_1.3L, CASH_DR_1.5L,
and CASH_DR_1.7L quantities of calcium oxide (CaO) and fumed silica (SiO2), shown
in Table 2, were dry mixed in a 500 mL HDPE bottle. Four hundred mL of degassed
Nanopure water was added to the bottles, backfilled with nitrogen, shaken, and
allowed to stir for one week. Then, the precipitate was split in two and each was placed
in a 140 mL of a solution of aluminum nitrate, backfilled with nitrogen, and allowed to
stir for 24 hours. The precipitate was then filtered using a Buchner funnel and
Whatman Grade 50 filter paper (2.7 µm) and rinsed in two batches with 100 mL of
degassed Nanopure water and 200 mL of ethanol for each batch. Sample
CASH_DR_1.0C was synthesized by taking 3 grams of CSH_DR_1.0A and adding it to
400 mL of aluminum nitrate solution, backfilled with nitrogen, and stirred for 24 hours.
The precipitate was then filtered using a Buchner funnel and Whatman Grade 50 filter
paper (2.7 µm) and rinsed in two batches with 100 mL of degassed Nanopure water and
200 mL of ethanol for each batch.
The sample names for direct reaction synthesis follow the formatting listed
below. Sample names ending in “A” have a nominal Ca/Si ratio equal to the number
preceding it while sample names ending in ”B” have a nominal Ca/(Si+Al) ratio equal
to the number preceding it. Sample names ending in “H” have a nominal Al/Si=1/6
and sample names ending in “L” have a nominal Al/Si=1/12. The sample name ending
in “C” has a nominal Ca/Si ratio of 1.0.

7/17/2019 William Hunnicutt
http://slidepdf.com/reader/full/william-hunnicutt 32/139
26
Table 2: Direct reaction synthesis reagents.
Sample CaO (grams) SiO2 (grams) Al(NO3)3.9H2O (grams)
CSH_DR_1.0A 14.48 15.52 0.00
CSH_DR_1.3A 16.45 13.56 0.00
CSH_DR_1.5A 17.50 12.50 0.00
CASH_DR_1.0C 14.48 15.52 9.38
CASH_DR_1.0A 9.97 8.90 11.14
CASH_DR_1.3A 11.77 8.09 10.14
CASH_DR_1.5A 12.82 7.63 9.56
CASH_DR_1.0B 14.48 15.52 19.38
CASH_DR_1.3B 16.45 13.56 16.93
CASH_DR_1.5B 17.50 12.50 15.61
CASH_DR_0.9H 9.13 10.87 3.50
CASH_DR_1.1H 10.13 9.87 3.16
CASH_DR_1.3H 10.96 9.04 2.90
CASH_DR_1.5H 11.67 8.33 2.67
CASH_DR_1.7H 12.27 7.73 2.48
CASH_DR_0.9L 9.13 10.87 1.75
CASH_DR_1.1L 10.13 9.87 1.58
CASH_DR_1.3L 10.96 9.04 1.45
CASH_DR_1.5L 11.67 8.33 1.33
CASH_DR_1.7L 12.27 7.73 1.24

7/17/2019 William Hunnicutt
http://slidepdf.com/reader/full/william-hunnicutt 33/139
27
3.1.3 CARBONATION TREATMENT
C-S-H was treated with four different solutions to examine the effect of alkali
and hydroxide ions on carbonation. Two grams of dried CSH_DR_1.3A with a nominal
Ca/Si ratio of 1.3 were placed in Nanopure water, 0.1 M solution of NaOH, 0.1 M
solution of KOH, and 0.1 M solution of NaNO3 and allowed to stir for one hour in open
air. The water used in these solutions was not boiled and contained dissolved CO2. The
pH of the solutions were 6.32, 12.83, 12.88, and 6.44, respectively read by a pH meter.
The solutions were filtered using a Buchner funnel and Whatman Grade 50 filter paper
(2.7 µm). The solids were dried and analyzed with XRD, TGA, and 29Si NMR.
3.1.4 DRYING PROCEDURE
After filtering and rinsing, the C-S-H and C-A-S-H were dried for
characterization. The samples were placed in a vacuum oven set at 40°C at -18 inches of
Hg from atmospheric pressure. Drying below 50°C does not cause significant changes in
the crystal structure of C-S-H [39]. The samples were dried to constant mass and stored
in a vacuum desiccator until characterization. Samples CASH_DD_2.2H and
CASH_DD_2.2L were allowed to dry to constant mass in a vacuum desiccator at room
temperature. These samples were dried at room temperature due to a malfunction of
the vacuum oven.
3.2 X-RAY DIFFRACTION
X-Ray diffraction (XRD) was performed to identify crystalline phases and
observe changes in the unit cell dimensions in the C-(A)-S-H. Samples were ground
7/17/2019 William Hunnicutt
http://slidepdf.com/reader/full/william-hunnicutt 34/139
28
using a mortar and pestle and passed through a #200 sieve. The sample passing the
#200 sieve was packed into a low-background sample holder. A Siemens-Bruker D5000
powder diffractometer with Cu-Kα radiation in the theta/theta configuration was used
for measurements. The diffractometer was operated at 40 kV and 30 mA. Measurements
were made from 2° to 60° 2θ at a rate of 1°/min with a step size of 0.02° 2θ. The
diffraction pattern was analyzed using MDI Jade. Peaks were indexed using PDF cards
from Jade and literature.
3.3 NUCLEAR MAGNETIC RESONANCE
Solid state magic angle spinning nuclear magnetic resonance was performed on
sampled to characterize the local atomic structure of 29Si and 27Al nuclei.
3.3.1 29Si NMR
The 29Si NMR measurements were made using a Varian Unity Inova 300
spectrometer (7.05 T) operating at 59.6 MHz. A 4-mm Chemagnetic probe was used,
spinning at 10 kHz. Chemical shifts were measured relative to tetramethylsilane (TMS).
The direct polarization experiment used a π/2 flip angle (2.45 µs pulse width) with 1H
decoupling and a recycle delay of 60 seconds. The acquisition time was 20.48 ms. In
total, 1536 scans were made for most samples. Samples CASH_DR_1.0A and
CASH_DR_1.0B were run with 3725 scans due to low signal intensity when run with
1536 scans.

7/17/2019 William Hunnicutt
http://slidepdf.com/reader/full/william-hunnicutt 35/139
29
3.3.2 27Al NMR
27Al NMR measurements were made using a Varian VNMRS 750WB (17.6 T)
operating at 195 MHz, a Varian VNS 750NB (17.6 T) operating at 195 MHz, and a Varian
Unity Inova 300 spectrometer (7.05 T) operating at 78.2 MHz. A 4-mm T3 Triple Res
HXY Solids probe was used for the 17.6 T spectrometers, spinning at 15 kHz, and a 4-
mm Chemagnetic probe was used for the 7.05 T spectrometer, spinning at 12 kHz.
Chemical shifts were measured relative to aluminum nitrate (Al(NO3)3). The direct
polarization experiment used a π/12 flip angle (1.5 µs pulse width) and a recycle delay
of 5 seconds. A small flip angle was used to ensure that the response was in the linear
regime, and thus quantitative, meaning that deconvolution of peaks yields accurate
comparisons of different chemical environments [40]. The acquisition time was 20 ms.
In total, 256 scans were made for each sample.
3.3.3 DECONVOLUTION
Analysis and deconvolution of NMR spectra were performed using MestreLab
Research Mnova NMR for MAS-NMR experiments. Spectra were phase and baseline
corrected. Exponential apodization was applied based on the line width of the spectra.
Deconvolution is a method of separating a complex curve into individual curves. The
following parameters were adjusted to achieve a good fit: chemical shift, peak height,
peak width, and Lorentzian/Gaussian (l/g) line shape. The areas of each individual
curve are quantitative with respect to the amount of nuclei in that specific chemical
environment. Equation 3 was used to aid in deconvolution:

7/17/2019 William Hunnicutt
http://slidepdf.com/reader/full/william-hunnicutt 36/139
30
ℎ
ℎ =
12
(1) +
(1) +
≈1
2 (3)
where and
are silicon nuclei in the bridging and pairing position, respectively.
This equation assumes a dreierketten silicate structure [10] and that aluminum is only
occurring in the bridging tetrahedra position [2, 21, 28].
3.4 X-RAY FLUORESCENCE
X-Ray fluorescence was provided by Binh Phan and Tom Wilson at the central
laboratory at the CalPortland Company.
3.5 THERMOGRAVIMETRIC ANALYSIS
Thermogravimetric analysis (TGA) was performed on samples to examine the
thermal decomposition, with specific interest in the decomposition of CaCO3 in the
sample due to carbonation. A TA Instruments Q50 TGA was used for measurements.
Samples were run at a heating rate of 20°C/min up to 1000°C in a nitrogen environment
with a flow rate of 60 mL/min. Alumina crucibles were used and the sample weight
was approximately 5 mg. Data were processed using TA Instruments Universal
Analysis 2000.

7/17/2019 William Hunnicutt
http://slidepdf.com/reader/full/william-hunnicutt 37/139
31
4. RESULTS
The calcium silicate hydrate (C-S-H) and calcium aluminosilicate hydrate (C-A-S-
H) were characterized in order to understand the structure and composition of the
synthesized materials. The mean chain length and presence of crosslinking between
chains was of specific interest. Both materials are susceptible to changes in their
structure by interaction with atmospheric carbon dioxide and careful consideration was
given to these changes and to the presence of calcium carbonate (CaCO3). A variety of
characterization techniques were used to probe the materials, including XRD, 29Si and
27Al NMR, XRF, and TGA. Results from these experiments are presented below.

7/17/2019 William Hunnicutt
http://slidepdf.com/reader/full/william-hunnicutt 38/139
32
4.1 XRD
4.1.1 C-S-H SYNTHESIZED BY DOUBLE DECOMPOSITION
Figure 3: XRD pattern of CSH_DD_1.5A, CSH_DD_1.3A, and CSH_DD_1.0A.
0
100
200
300
400
500
600
700
0 10 20 30 40 50 60
2-Theta (degrees)
CSH_DD_1.5A
CSH_DD_1.0A
CSH_DD_1.3A
7/17/2019 William Hunnicutt
http://slidepdf.com/reader/full/william-hunnicutt 39/139
33
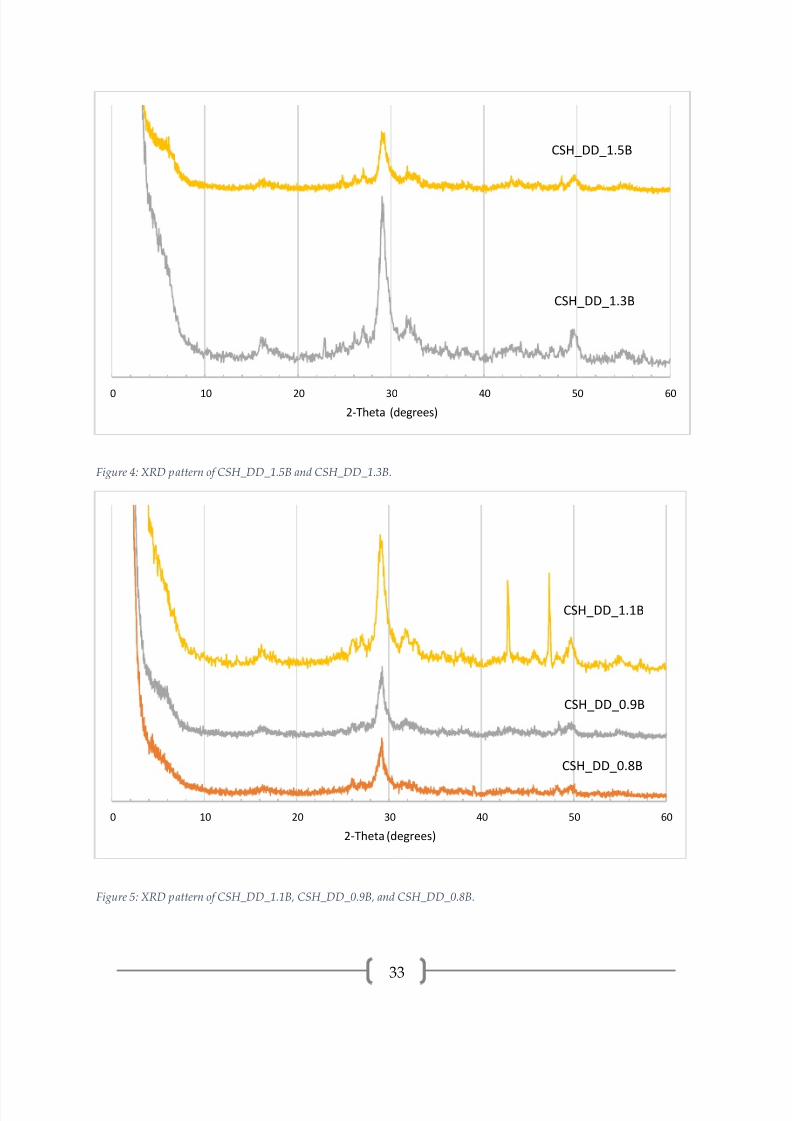
Figure 4: XRD pattern of CSH_DD_1.5B and CSH_DD_1.3B.
Figure 5: XRD pattern of CSH_DD_1.1B, CSH_DD_0.9B, and CSH_DD_0.8B.
0 10 20 30 40 50 60
2-Theta (degrees)
CSH_DD_1.5B
CSH_DD_1.3B
0 10 20 30 40 50 60
2-Theta (degrees)
CSH_DD_1.1B
CSH_DD_0.8B
CSH_DD_0.9B

7/17/2019 William Hunnicutt
http://slidepdf.com/reader/full/william-hunnicutt 40/139
34
The XRD patterns for C-S-H synthesized by double decomposition, presented in
Figures 3-5, all have intense peaks centered around 29.2° (2θ), which is the dominant
peak in both C-S-H and calcite. Other peaks indicating that C-S-H is present are at 16.9°,
32.0°, 42.7°, 49.8°, and 55.3°. CSH_DD_1.3A, CSH_DD_1.0A, CSH_DD_1.5B,
CSH_DD_1.3B, and CSH_DD_0.9B have basal peaks ([00l] reflection). In addition to C-
S-H, samples CSH_DD_1.0A, CSH_DD_1.3B, and CSH_DD_1.1B show amorphous
humps in the 25-35° range, indicating silica gel.
CSH_DD_1.5A and CSH_DD_1.5B have calcite (29.5°, 36.1°, 48.6°), aragonite
(26.1°, 27.1°,45.8°), and vaterite (24.8°, 26.8°, 32.8°) peaks. CSH_DD_1.3B, CSH_DD_1.1B,
and CSH_DD_0.9B have calcite (29.5°, 23.0°, 43.0°, 47.4°, 57.3°) and vaterite (24.9°, 27.0°,
32.8°, 50.0°) peaks. The peaks in CSH_DD_1.1B at 43.0° and 47.4° are very intense, the
reason for this is unknown. CSH_DD_0.8B has calcite (23.0°, 29.5°, 35.9°, 39.3°) and
aragonite (26.1°, 27.0°, 32.8°, 48.4°) peaks. CSH_DD_1.0A has only vaterite (20.9°, 24.8°,
27.0°, 32.8°, 50.0°) as a CaCO3 polymorph. CSH_DD_1.3A did not show any CaCO3
polymorph peaks.
7/17/2019 William Hunnicutt
http://slidepdf.com/reader/full/william-hunnicutt 41/139
35
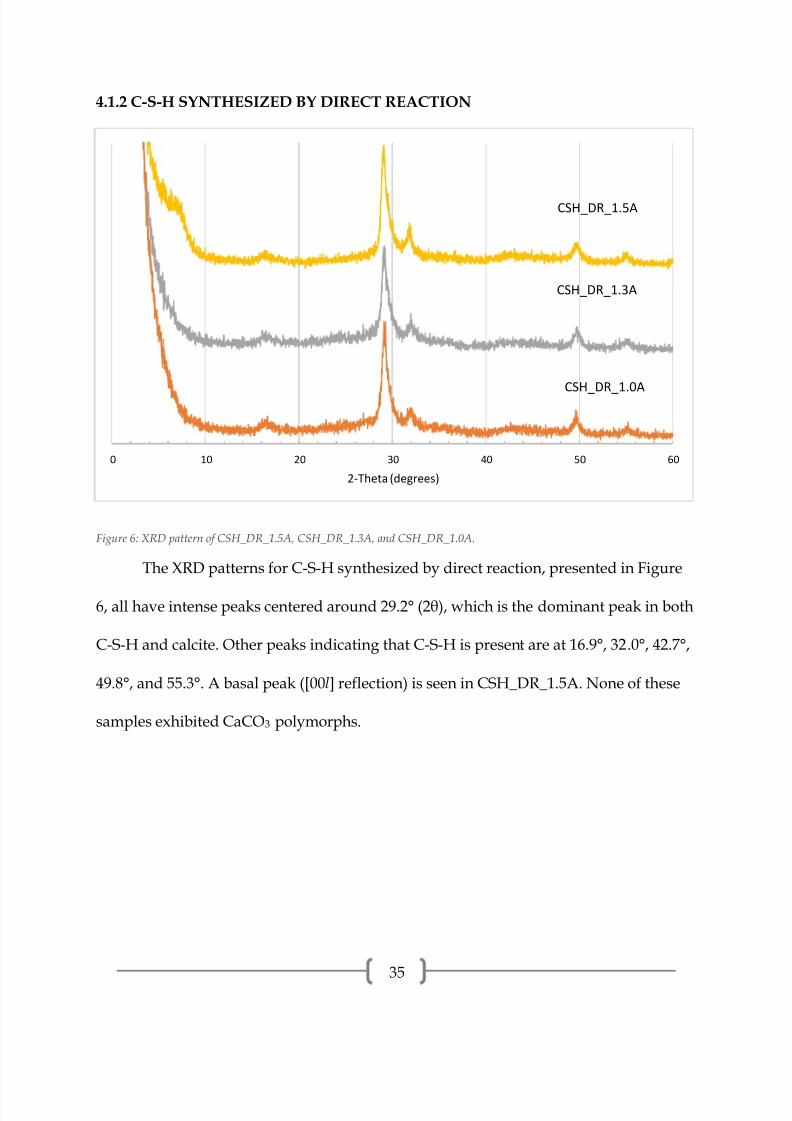
4.1.2 C-S-H SYNTHESIZED BY DIRECT REACTION
Figure 6: XRD pattern of CSH_DR_1.5A, CSH_DR_1.3A, and CSH_DR_1.0A.
The XRD patterns for C-S-H synthesized by direct reaction, presented in Figure
6, all have intense peaks centered around 29.2° (2θ), which is the dominant peak in both
C-S-H and calcite. Other peaks indicating that C-S-H is present are at 16.9°, 32.0°, 42.7°,
49.8°, and 55.3°. A basal peak ([00l] reflection) is seen in CSH_DR_1.5A. None of these
samples exhibited CaCO3 polymorphs.
0 10 20 30 40 50 60
2-Theta (degrees)
CSH_DR_1.5A
CSH_DR_1.0A
CSH_DR_1.3A
7/17/2019 William Hunnicutt
http://slidepdf.com/reader/full/william-hunnicutt 42/139
36
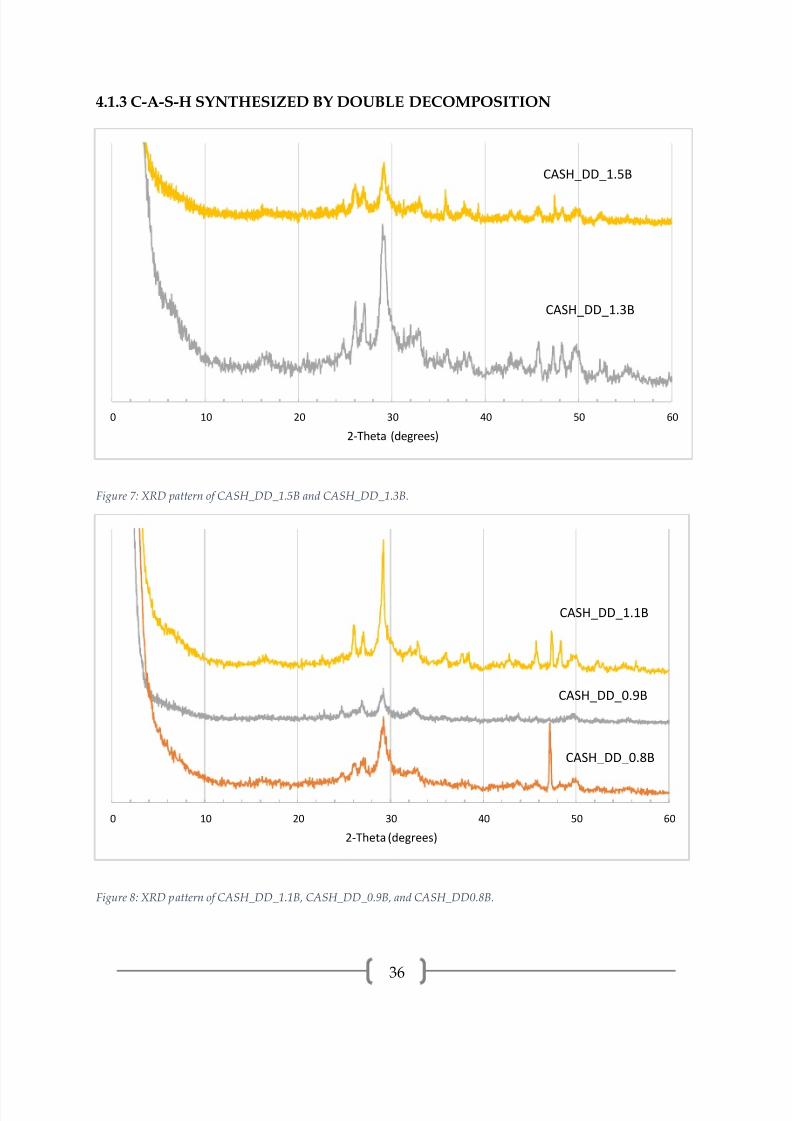
4.1.3 C-A-S-H SYNTHESIZED BY DOUBLE DECOMPOSITION
Figure 7: XRD pattern of CASH_DD_1.5B and CASH_DD_1.3B.
Figure 8: XRD pattern of CASH_DD_1.1B, CASH_DD_0.9B, and CASH_DD0.8B.
0 10 20 30 40 50 60
2-Theta (degrees)
CASH_DD_1.5B
CASH_DD_1.3B
0 10 20 30 40 50 60
2-Theta (degrees)
CASH_DD_1.1B
CASH_DD_0.8B
CASH_DD_0.9B

7/17/2019 William Hunnicutt
http://slidepdf.com/reader/full/william-hunnicutt 43/139
37
Figure 9: XRD pattern of CASH_DD_2.2H.
The XRD patterns for C-A-S-H synthesized by double decomposition, presented
in Figures 7-9, all have intense peaks centered around 29.2° (2θ), which is the dominant
peak in both C-S-H and calcite. Other peaks indicating that C-S-H is present are at 16.9°,
32.0°, 42.7°, 49.8°, and 55.3°. CASH_DD_1.1B and CASH_DD_1.3B have basal peaks
([00l] reflection). CASH_DD_1.3B, CASH_DD_1.1B, CASH_DD_0.8B, and
CASH_DD_2.2H have amorphous humps in the 22-30° range, which indicates silica gel
with alumina.
CASH_DD_1.5B and CASH_DD_1.3B have calcite (23.1°, 29.5°, 35.6°, 47.4°),
aragonite (26.1°, 27.0°, 37.7°, 45.8°), and vaterite (24.8°, 27.0°, 50.0°, 32.7°) peaks.
CASH_DD_1.1B has calcite (29.5°, 35.9°, 47.3°, 48.2°) and aragonite (26.1°, 27.0°, 37.7°,
0 10 20 30 40 50 60
2-Theta (degrees)
CASH_DD_2.2H

7/17/2019 William Hunnicutt
http://slidepdf.com/reader/full/william-hunnicutt 44/139
38
45.8°) peaks. CASH_DD_0.9B has calcite (23.1°, 29.5°, 36.0°) and vaterite (20.9°, 24.7°,
27.0°, 32.6°) peaks. CASH_DD_0.8B has vaterite (20.9°, 24.9°, 27.0°, 32.7°) and aragonite
(26.1°, 27.0°, 37.9°, 38.4°, 45.7°) peaks. The strong reflection at 47.1° in CASH_DD_0.8B is
could either be a calcite or calcium hydroxide peak, but no other peaks from either
phase were observed.
CASH_DD_2.2H appears to be predominately calcium carbonate as evidenced
by the strong reflections of calcite, aragonite and vaterite and the large amorphous
hump. Very little, or no, C-S-H remains in this sample.
4.1.4 C-A-S-H SYNTHESIZED BY DIRECT REACTION
Figure 10: XRD pattern of CASH_DR_1.5A, CASH_DR_1.3A, and CASH_DR_1.0A.
0 10 20 30 40 50 60
2-Theta (degrees)
CASH_DR_1.5A
CASH_DR_1.0A
CASH_DR_1.3A

7/17/2019 William Hunnicutt
http://slidepdf.com/reader/full/william-hunnicutt 45/139
39
Figure 11: XRD pattern of CASH_DR_1.5B, CASH_DR_1.3B, CASH_DR_1.0B.
Figure 12: XRD pattern of CASH_DR_1.7L and CASH_DR_1.5L.
0 10 20 30 40 50 60
2-Theta (degrees)
CASH_DR_1.5B
CASH_DR_1.0B
CASH_DR_1.3B
0 10 20 30 40 50 60
2-Theta (degrees)
CASH_DR_1.7L
CASH_DR_1.5L

7/17/2019 William Hunnicutt
http://slidepdf.com/reader/full/william-hunnicutt 46/139
40
Figure 13: XRD pattern of CASH_DR_1.3L, CASH_DR_1.1L, and CASH_DR_0.9L.
Figure 14: XRD pattern of CASH_DR_1.7H and CASH_DR_1.5H.
0 10 20 30 40 50 60
2-Theta (degrees)
CASH_DR_1.3L
CASH_DR_0.9L
CASH_DR_1.1L
0 10 20 30 40 50 60
2-Theta (degrees)
CASH_DR_1.7H
CASH_DR_1.5H

7/17/2019 William Hunnicutt
http://slidepdf.com/reader/full/william-hunnicutt 47/139
41
Figure 15: XRD pattern of CASH_DR_1.3H, CASH_DR_1.1H, and CASH_DR_0.9H.
Figure 16: XRD pattern of CASH_DR_1.0C.
0 10 20 30 40 50 60
2-Theta (degrees)
CASH_DR_1.3H
CASH_DR_0.9H
CASH_DR_1.1H
0 10 20 30 40 50 60
2-Theta (degrees)
CASH_DR_1.0C
7/17/2019 William Hunnicutt
http://slidepdf.com/reader/full/william-hunnicutt 48/139
42
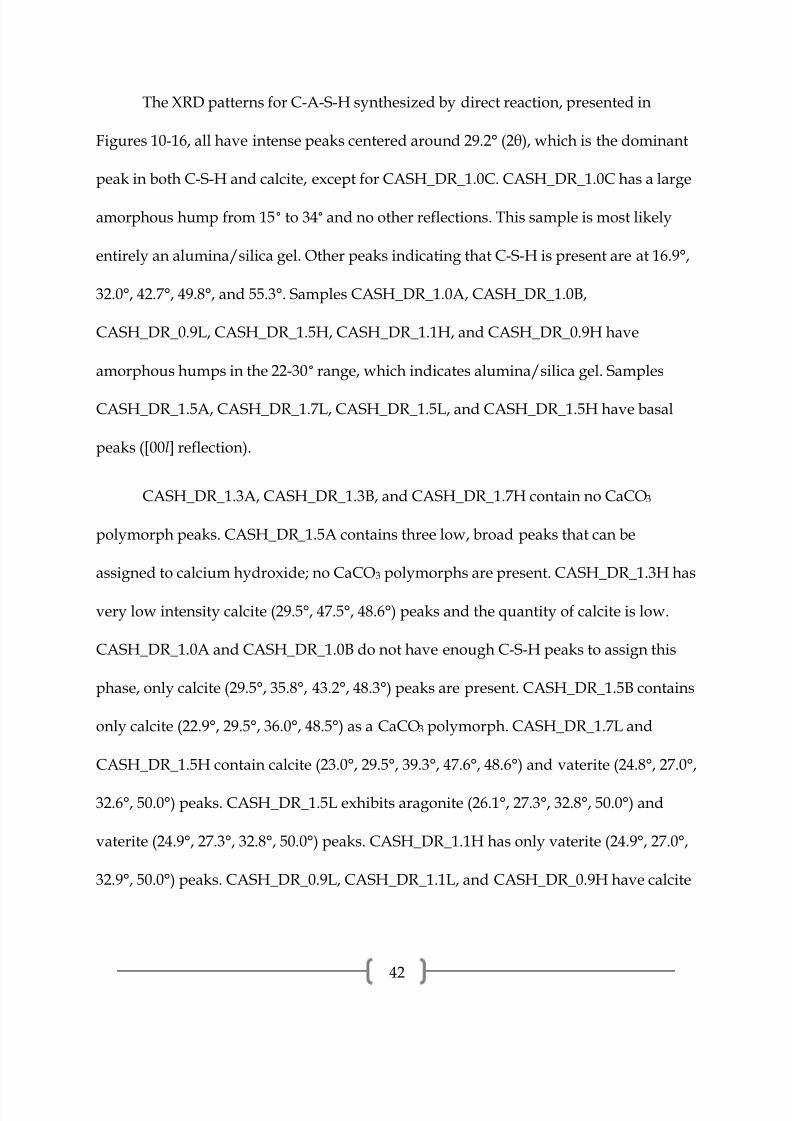
The XRD patterns for C-A-S-H synthesized by direct reaction, presented in
Figures 10-16, all have intense peaks centered around 29.2° (2θ), which is the dominant
peak in both C-S-H and calcite, except for CASH_DR_1.0C. CASH_DR_1.0C has a large
amorphous hump from 15° to 34° and no other reflections. This sample is most likely
entirely an alumina/silica gel. Other peaks indicating that C-S-H is present are at 16.9°,
32.0°, 42.7°, 49.8°, and 55.3°. Samples CASH_DR_1.0A, CASH_DR_1.0B,
CASH_DR_0.9L, CASH_DR_1.5H, CASH_DR_1.1H, and CASH_DR_0.9H have
amorphous humps in the 22-30° range, which indicates alumina/silica gel. Samples
CASH_DR_1.5A, CASH_DR_1.7L, CASH_DR_1.5L, and CASH_DR_1.5H have basal
peaks ([00l] reflection).
CASH_DR_1.3A, CASH_DR_1.3B, and CASH_DR_1.7H contain no CaCO3
polymorph peaks. CASH_DR_1.5A contains three low, broad peaks that can be
assigned to calcium hydroxide; no CaCO3 polymorphs are present. CASH_DR_1.3H has
very low intensity calcite (29.5°, 47.5°, 48.6°) peaks and the quantity of calcite is low.
CASH_DR_1.0A and CASH_DR_1.0B do not have enough C-S-H peaks to assign this
phase, only calcite (29.5°, 35.8°, 43.2°, 48.3°) peaks are present. CASH_DR_1.5B contains
only calcite (22.9°, 29.5°, 36.0°, 48.5°) as a CaCO3 polymorph. CASH_DR_1.7L and
CASH_DR_1.5H contain calcite (23.0°, 29.5°, 39.3°, 47.6°, 48.6°) and vaterite (24.8°, 27.0°,
32.6°, 50.0°) peaks. CASH_DR_1.5L exhibits aragonite (26.1°, 27.3°, 32.8°, 50.0°) and
vaterite (24.9°, 27.3°, 32.8°, 50.0°) peaks. CASH_DR_1.1H has only vaterite (24.9°, 27.0°,
32.9°, 50.0°) peaks. CASH_DR_0.9L, CASH_DR_1.1L, and CASH_DR_0.9H have calcite

7/17/2019 William Hunnicutt
http://slidepdf.com/reader/full/william-hunnicutt 49/139
43
(29.5°, 36.1°, 47.6°, 48.4°) and aragonite (26.1°, 27.0°, 37.8°, 50.0°) peaks. CASH_DR_1.3L
contains calcite (23.1°, 29.5°, 35.9°, 48.6°), aragonite (26.2°, 27.0°, 32.8°, 38.3°, 45.4°), and
vaterite (24.9°, 27.0°, 32.8°, 50.0°).
4.1.5 CARBONATION TREATMENT OF C-S-H
Figure 17: XRD pattern of carbonation treatment samples.
All C-S-H sample subjected to the carbonation treatment still show peaks
associated with C-S-H at 16.9°, 29.2°, 32.0°, 42.7°, 49.8°, and 55.3°, as presented in Figure
17. Additionally, calcite and aragonite peaks are clearly visible in CSH_DR_1.3A_NaOH
and CSH_DR_1.3A_KOH at 29.2°, 35.8° for calcite, and 39.4° and 26.2°, 27.1°, 37.8°,
45.7°, 48.3°, and 52.6° for aragonite. CSH_DR_1.3A_NaNO3 and CSH_DR_1.3A_H2O
0 10 20 30 40 50 60
2-Theta (degrees)
CSH_DR_1.3A_KOH
CSH_DR_1.3A_H2O
CSH_DR_1.3A_NaNO3
CSH_DR_1.3A_NaOH

7/17/2019 William Hunnicutt
http://slidepdf.com/reader/full/william-hunnicutt 50/139
44
contain calcite peaks at 29.2°, 35.8°, and 48.5°. CSH_DR_1.3A_NaOH appears to have
the most distinct carbonate peaks, followed by CSH_DR_1.3A_KOH.
4.229
Si NMR
All of the 29Si spectra presented in this section are composed of three curves: the
experimental curve (black), the individual peaks (red), and the sum of the individual
peaks (blue).
4.2.1 C-S-H SYNTHESIZED BY DOUBLE DECOMPOSITION
Figure 18: 29Si NMR spectrum of CSH_DD_1.0A.

7/17/2019 William Hunnicutt
http://slidepdf.com/reader/full/william-hunnicutt 51/139
45
Figure 20: 29Si NMR spectrum of CSH_DD_1.5A.
Figure 19: 29Si NMR spectrum of CSH_DD_1.3A.
7/17/2019 William Hunnicutt
http://slidepdf.com/reader/full/william-hunnicutt 52/139
46
Table 3: Deconvolution peak properties for CSH_DD_1.0A, CSH_DD_1.3A, and CSH_DD_1.5A.
Qn(mAl)Chemical
shift(ppm)
Width(ppm)
Proportion
CSH_DD_1.0AQ
1
(0Al) -79.3 1.93 7.8%Q2B(0Al) -82.8 1.94 31.2%
Q2P(0Al) -85.6 1.64 61.0%
CSH_DD_1.3A
Q1(0Al)? -77.8 0.82 1.8%
Q1(0Al) -79.3 1.79 27.6%
Q2B(0Al) -82.9 1.83 23.1%
Q2P (0Al) -85.4 1.46 47.4%
CSH_DD_1.5A
Q1(0Al)? -77.6 0.67 1.2%
Q1
(0Al) -79.3 1.39 26.1%Q2
B(0Al) -83.1 1.61 23.2%
Q2P(0Al) -85.6 1.17 49.4%
The 29Si spectra of the C-S-H synthesized by double decomposition, shown in
Figures 18-20 with peak properties in Table 3, show a dreierketten structure, similar to
previous reports [11, 12]. The Q1
(0Al) peak at approximately -79.3 ppm and the Q2
P(0Al)
peak at approximately -85.5 ppm has been reported previously [2, 11, 31]. The Q2B(0Al)
at approximately -83.0 has been previously reported as well, but not as frequently [25,
31] . CSH_DD_1.3A and CSH_DD_1.5A have very similar spectra, with large amounts
of Q2, which indicate a long MCL. CSH_DD_1.0A has a smaller proportion of Q1,
indicating it has a longer MCL than CSH_DD_1.3A and CSH_DD_1.5A. The peaks at -
77.8 and -77.6 are of low intensity, and may be in the noise range. However, they may
represent a Q1 environment with a slightly less magnetically shielded chemical

7/17/2019 William Hunnicutt
http://slidepdf.com/reader/full/william-hunnicutt 53/139
47
environment. A cause of this may be a difference in the ion that is charge balancing
some of the end-chain silica sites.
Figure 21: 29Si NMR spectrum of CSH_DD_0.8B.
Figure 22: 29Si NMR spectrum of CSH_DD_0.9B.
7/17/2019 William Hunnicutt
http://slidepdf.com/reader/full/william-hunnicutt 54/139
48
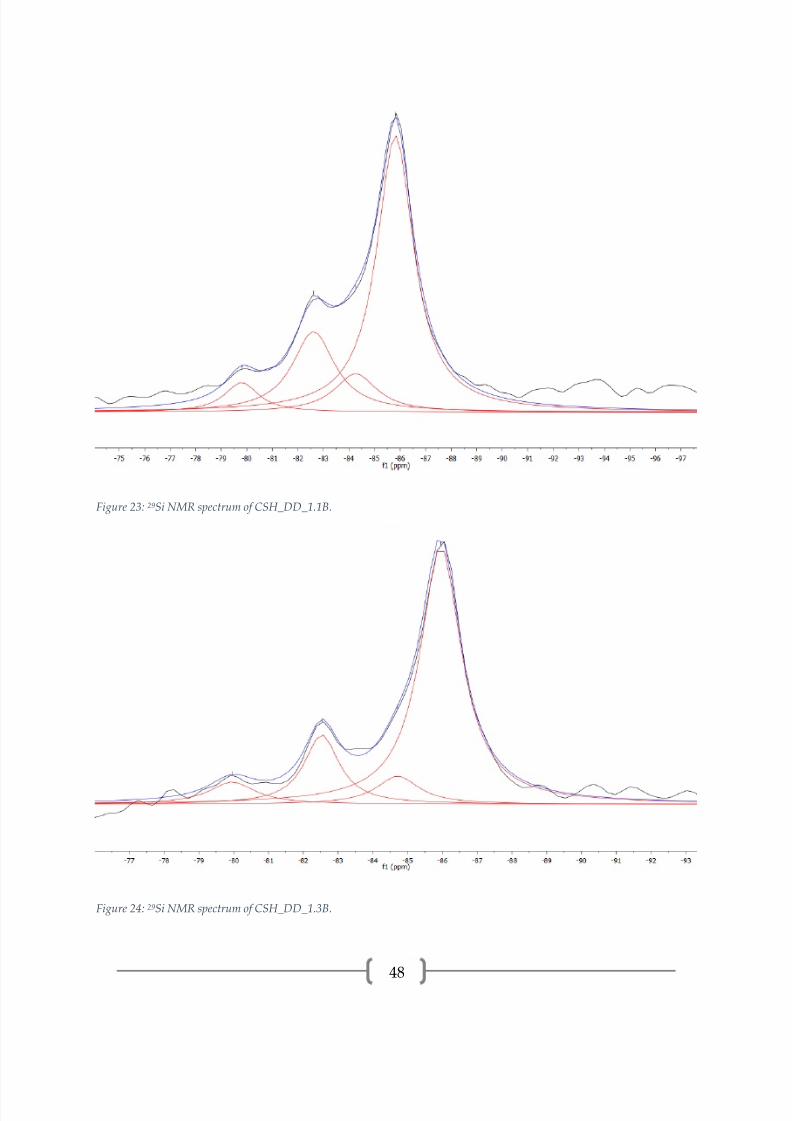
Figure 23: 29Si NMR spectrum of CSH_DD_1.1B.
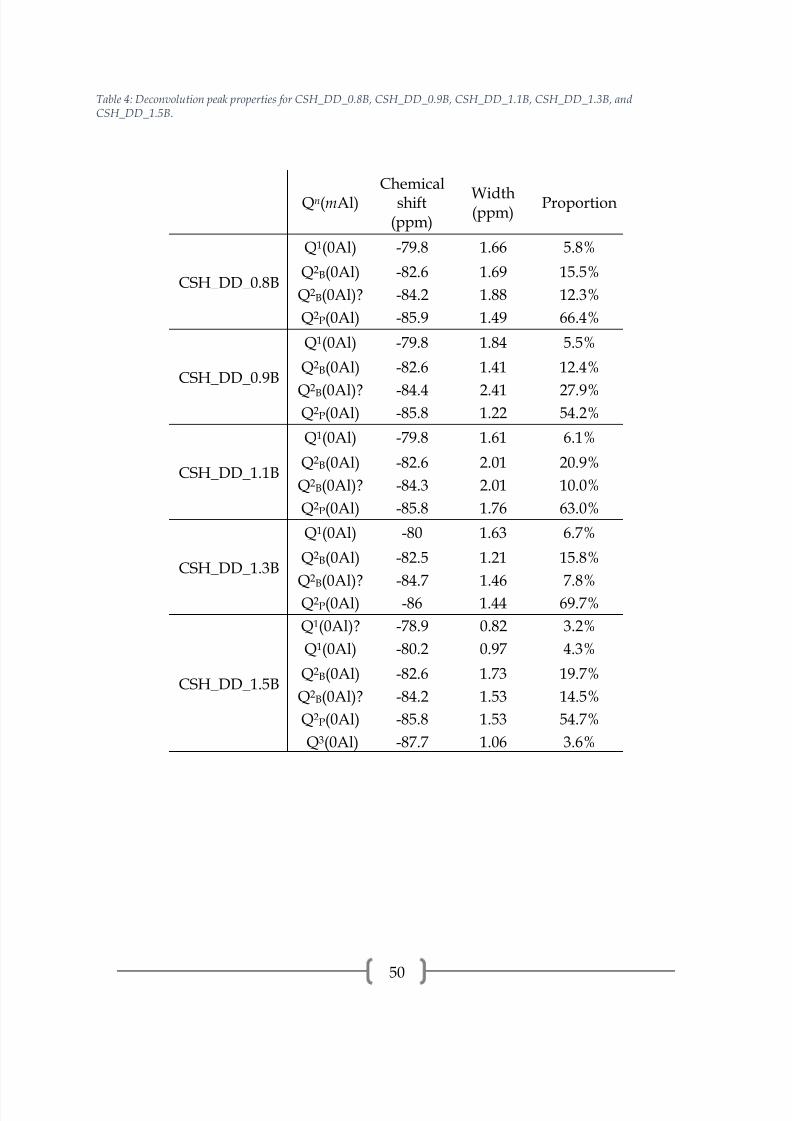
Figure 24: 29Si NMR spectrum of CSH_DD_1.3B.

7/17/2019 William Hunnicutt
http://slidepdf.com/reader/full/william-hunnicutt 55/139
49
Figure 25: 29Si NMR spectrum of CSH_DD_1.5B.
7/17/2019 William Hunnicutt
http://slidepdf.com/reader/full/william-hunnicutt 56/139
50
Table 4: Deconvolution peak properties for CSH_DD_0.8B, CSH_DD_0.9B, CSH_DD_1.1B, CSH_DD_1.3B, andCSH_DD_1.5B.
Qn(mAl)Chemical
shift(ppm)
Width(ppm)
Proportion
CSH_DD_0.8B
Q1(0Al) -79.8 1.66 5.8%
Q2B(0Al) -82.6 1.69 15.5%
Q2B(0Al)? -84.2 1.88 12.3%
Q2P(0Al) -85.9 1.49 66.4%
CSH_DD_0.9B
Q1(0Al) -79.8 1.84 5.5%
Q2B(0Al) -82.6 1.41 12.4%
Q2B(0Al)? -84.4 2.41 27.9%Q2P(0Al) -85.8 1.22 54.2%
CSH_DD_1.1B
Q1(0Al) -79.8 1.61 6.1%
Q2B(0Al) -82.6 2.01 20.9%
Q2B(0Al)? -84.3 2.01 10.0%
Q2P(0Al) -85.8 1.76 63.0%
CSH_DD_1.3B
Q1(0Al) -80 1.63 6.7%
Q2B(0Al) -82.5 1.21 15.8%
Q2
B(0Al)? -84.7 1.46 7.8%Q2P(0Al) -86 1.44 69.7%
CSH_DD_1.5B
Q1(0Al)? -78.9 0.82 3.2%
Q1(0Al) -80.2 0.97 4.3%
Q2B(0Al) -82.6 1.73 19.7%
Q2B(0Al)? -84.2 1.53 14.5%
Q2P(0Al) -85.8 1.53 54.7%
Q3(0Al) -87.7 1.06 3.6%

7/17/2019 William Hunnicutt
http://slidepdf.com/reader/full/william-hunnicutt 57/139
51
The 29Si spectra of the C-S-H samples prepared by double decomposition,
presented in Figures 21-25 and peak properties in Table 4, reveal a dreierketten
structure, as previously seen. All samples have a low Q1 proportion and similar
proportions of Q2B(0Al) to Q2P(0Al). All samples contain an unidentified peak at
approximately -84.3 ppm. This peak is above the noise threshold and may be a Q2B(0Al)
site that is charge balanced by an ion that causes more magnetic shielding than the ion
that is charge balancing the Q2B(0Al) site at approximately -82.5 ppm. A possibility is
Na1+ providing the charge balance for Q2B(0Al) instead of Ca2+, which would result in a
chemical shift. However, normally the bridging tetrahedron site is charge balanced by
Ca2+ and the chemical shift is located at approximately -82.6 ppm and a bridging
tetrahedron site charge balanced by Na1+ would have a less negative chemical shift than
if it were charge balanced by Ca2+ since the atomic number of sodium is lower than that
of calcium. Therefore, this is not a reasonable explanation. The origination of this peak
is still unknown, but it should be noted that when a peak is located under the area of a
more intense peak there is limited confidence. Sample CSH_DD_1.5B also contains an
unidentified peak at -78.9 ppm, which is similar in position to the unidentified peaks in
CSH_DD_1.3A and CSH_DD_1.5A. Again, charge balancing ions may be the cause of
this small peak in the Q1 range. CSH_DD_1.5B also contains a small amount of Q3(0Al)
at -87.7 ppm, indicating crosslinking of dreierketten chains through the silica bridging
tetrahedra [2, 21, 34] . CSH_DD_1.5B showed CaCO3 polymorphs by XRD and the
carbonation of the C-S-H may be the source of Q3 bonds across the silicate chains.

7/17/2019 William Hunnicutt
http://slidepdf.com/reader/full/william-hunnicutt 58/139
52
4.2.2 C-S-H SYNTHESIZED BY DIRECT REACTION
Figure 26: 29Si NMR spectrum of CSH_DR_1.0A.
Figure 27: 29Si NMR spectrum of CSH_DR_1.3A.

7/17/2019 William Hunnicutt
http://slidepdf.com/reader/full/william-hunnicutt 59/139
53
Figure 28: 29Si NMR spectrum of CSH_DR_1.5A.
Table 5: Deconvolution peak properties for CSH_DR_1.0A, CSH_DR_1.3A, and CSH_DR_1.5A.
Qn(mAl)Chemical
shift(ppm)
Width(ppm)
Proportion
CSH_DR_1.0A
Q1(0Al) -79.7 2.53 17.5%
Q2B(0Al) -82.8 2.46 27.5%
Q2P(0Al) -85.9 2.43 55.0%
CSH_DR_1.3A
Q1(0Al) -80 3.89 21.7%
Q2B(0Al) -83.3 2.01 25.2%
Q2P(0Al) -85.9 1.94 46.9%
Q3(0Al) -88.4 1.46 6.1%
CSH_DR_1.5A
Q1(0Al) -79.4 3.20 56.7%
Q2B(0Al) -82.9 2.43 12.0%
Q2P(0Al) -85 2.60 24.1%
Q3(0Al) -88.4 2.65 7.2%

7/17/2019 William Hunnicutt
http://slidepdf.com/reader/full/william-hunnicutt 60/139
54
The 29Si spectra of the C-S-H samples prepared by direct reaction, presented in
Figures 26-28 and peak properties in Table 5, reveal a dreierketten structure, as
previously seen. The proportion of Q1(0Al) increases with the Ca/Si ratio of the starting
reagents, indicating a shorter MCL. CSH_DR_1.3A and CSH_DR_1.5A also contain a
small amount of Q3(0Al), which crosslinks chains through silica bridging tetrahedra.
4.2.3 C-A-S-H SYNTHESIZED BY DOUBLE DECOMPOSITION
Figure 29: 29Si NMR spectrum of CASH_DD_0.9B.
7/17/2019 William Hunnicutt
http://slidepdf.com/reader/full/william-hunnicutt 61/139
55
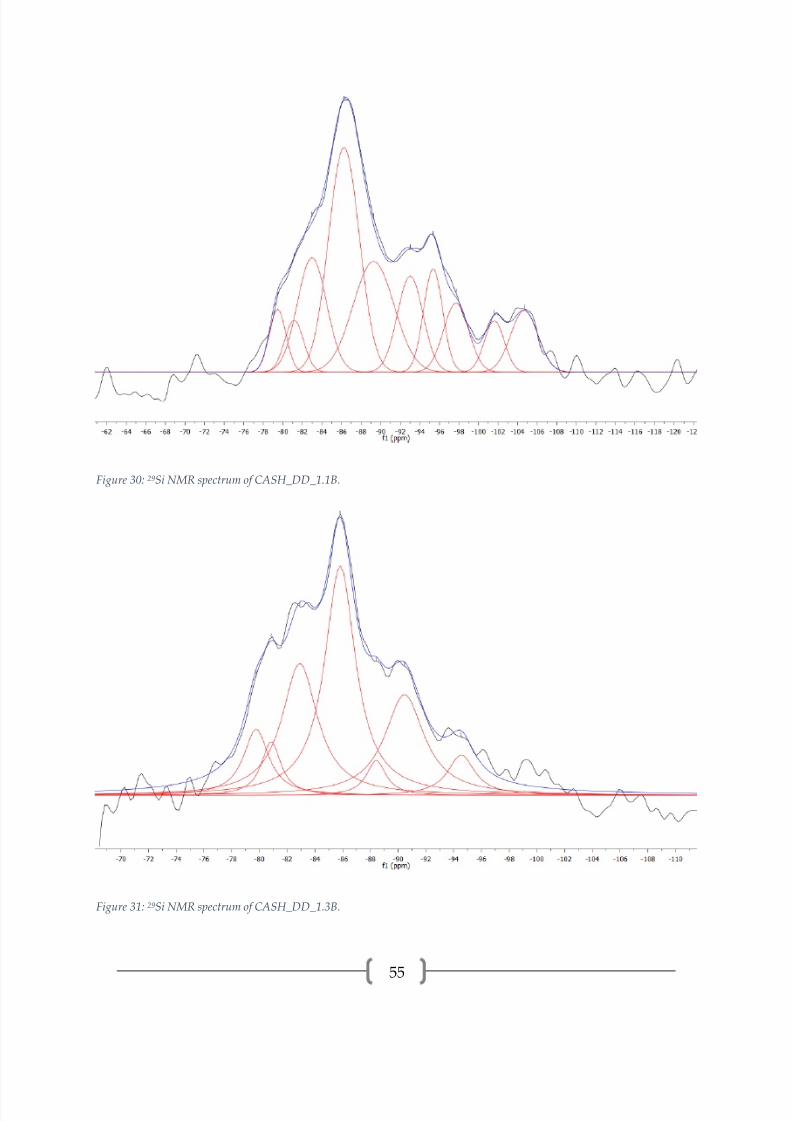
Figure 30: 29Si NMR spectrum of CASH_DD_1.1B.
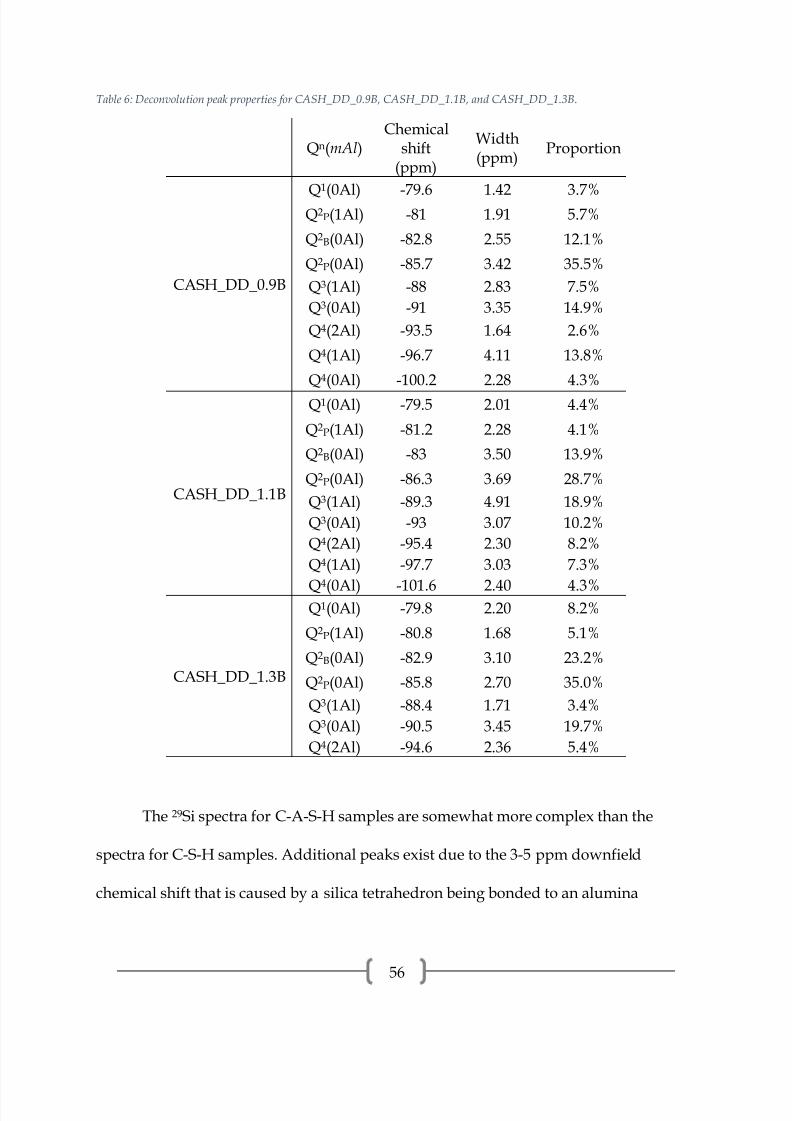
Figure 31: 29Si NMR spectrum of CASH_DD_1.3B.
7/17/2019 William Hunnicutt
http://slidepdf.com/reader/full/william-hunnicutt 62/139
56
Table 6: Deconvolution peak properties for CASH_DD_0.9B, CASH_DD_1.1B, and CASH_DD_1.3B.
Qn(mAl)Chemical
shift(ppm)
Width(ppm)
Proportion
CASH_DD_0.9B
Q1
(0Al) -79.6 1.42 3.7%Q2P(1Al) -81 1.91 5.7%
Q2B(0Al) -82.8 2.55 12.1%
Q2P(0Al) -85.7 3.42 35.5%
Q3(1Al) -88 2.83 7.5%
Q3(0Al) -91 3.35 14.9%
Q4(2Al) -93.5 1.64 2.6%
Q4(1Al) -96.7 4.11 13.8%
Q4(0Al) -100.2 2.28 4.3%
CASH_DD_1.1B
Q1(0Al) -79.5 2.01 4.4%
Q2P(1Al) -81.2 2.28 4.1%
Q2B(0Al) -83 3.50 13.9%
Q2P(0Al) -86.3 3.69 28.7%
Q3(1Al) -89.3 4.91 18.9%
Q3(0Al) -93 3.07 10.2%
Q4(2Al) -95.4 2.30 8.2%
Q4(1Al) -97.7 3.03 7.3%
Q4(0Al) -101.6 2.40 4.3%
CASH_DD_1.3B
Q1(0Al) -79.8 2.20 8.2%
Q2P(1Al) -80.8 1.68 5.1%
Q2B(0Al) -82.9 3.10 23.2%
Q2P(0Al) -85.8 2.70 35.0%
Q3(1Al) -88.4 1.71 3.4%
Q3(0Al) -90.5 3.45 19.7%
Q4(2Al) -94.6 2.36 5.4%
The 29Si spectra for C-A-S-H samples are somewhat more complex than the
spectra for C-S-H samples. Additional peaks exist due to the 3-5 ppm downfield
chemical shift that is caused by a silica tetrahedron being bonded to an alumina
7/17/2019 William Hunnicutt
http://slidepdf.com/reader/full/william-hunnicutt 63/139
57
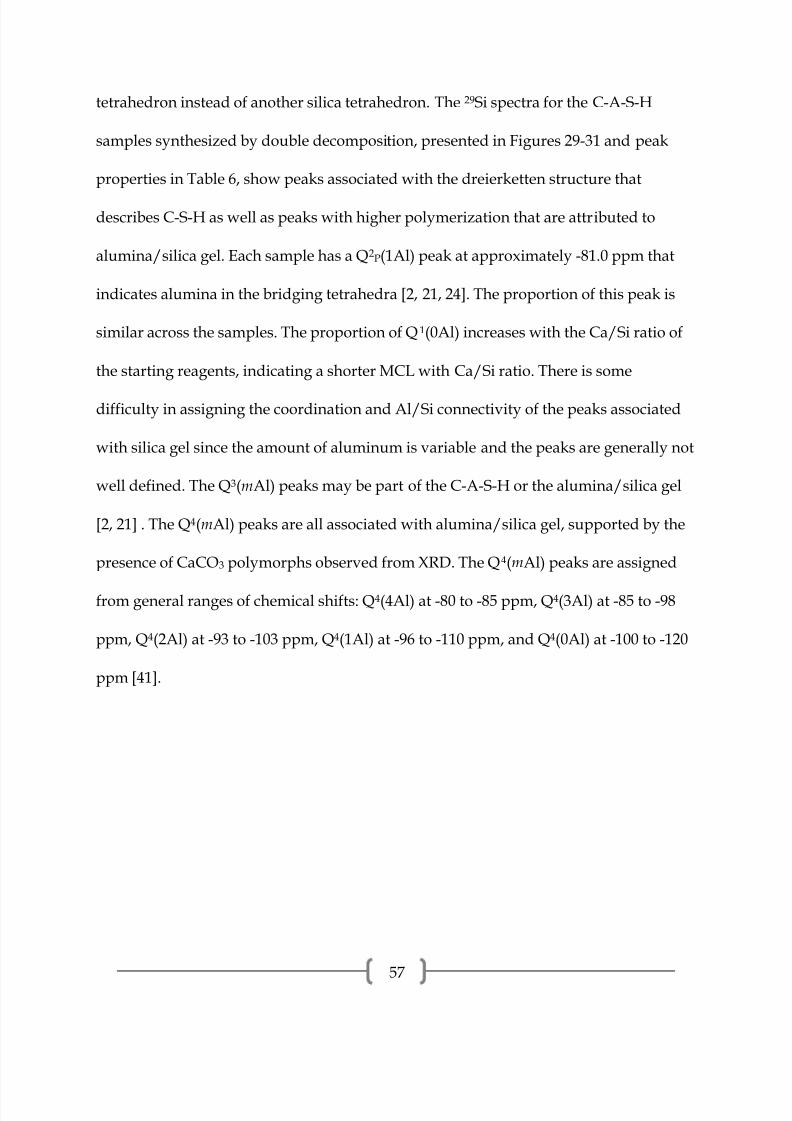
tetrahedron instead of another silica tetrahedron. The 29Si spectra for the C-A-S-H
samples synthesized by double decomposition, presented in Figures 29-31 and peak
properties in Table 6, show peaks associated with the dreierketten structure that
describes C-S-H as well as peaks with higher polymerization that are attributed to
alumina/silica gel. Each sample has a Q2P(1Al) peak at approximately -81.0 ppm that
indicates alumina in the bridging tetrahedra [2, 21, 24]. The proportion of this peak is
similar across the samples. The proportion of Q1(0Al) increases with the Ca/Si ratio of
the starting reagents, indicating a shorter MCL with Ca/Si ratio. There is some
difficulty in assigning the coordination and Al/Si connectivity of the peaks associated
with silica gel since the amount of aluminum is variable and the peaks are generally not
well defined. The Q3(mAl) peaks may be part of the C-A-S-H or the alumina/silica gel
[2, 21] . The Q4(mAl) peaks are all associated with alumina/silica gel, supported by the
presence of CaCO3 polymorphs observed from XRD. The Q4(mAl) peaks are assigned
from general ranges of chemical shifts: Q4(4Al) at -80 to -85 ppm, Q4(3Al) at -85 to -98
ppm, Q4(2Al) at -93 to -103 ppm, Q4(1Al) at -96 to -110 ppm, and Q4(0Al) at -100 to -120
ppm [41].

7/17/2019 William Hunnicutt
http://slidepdf.com/reader/full/william-hunnicutt 64/139
58
Figure 32: 29Si NMR spectrum of CASH_DD_2.2H.

7/17/2019 William Hunnicutt
http://slidepdf.com/reader/full/william-hunnicutt 65/139
59
Figure 33: 29Si NMR spectrum of CASH_DD_2.2L.
Table 7: Deconvolution peak properties for CASH_DD_2.2H and CASH_DD_2.2L.
Qn(mAl)Chemical
shift(ppm)
Width(ppm)
Proportion
CASH_DD_2.2H
Q4(3Al) -86 4.54 13.9%
Q3(0Al) -91.4 4.59 22.0%
Q4(2Al) -95.2 4.27 16.7%
Q4(1Al) -98.9 4.84 23.1%
Q4(0Al) -102.3 4.07 13.4%
Q4(0Al) -105.5 4.16 10.8%
CASH_DD_2.2L
Q1(0Al) -79.3 2.56 11.0%
Q2P(1Al) -81.6 2.46 12.8%
Q2B(0Al) -83.1 2.77 16.7%
Q2P(0Al) -85.5 2.77 34.9%
Q3(1Al) -88 1.84 5.3%
Q3(0Al) -91 4.83 19.2%

7/17/2019 William Hunnicutt
http://slidepdf.com/reader/full/william-hunnicutt 66/139
60
The 29Si spectra, presented in Figure 32 and peak properties in Table 7, for
CASH_DD_2.2H is entirely Q3(0Al) and Q4(mAl), indicating that there is only
alumina/silica gel. CASH_DD_2.2L, presented in Figure 33 and peak properties in
Table 7, shows peaks characteristic of C-A-S-H with a large proportion of Q3(mAl). It is
likely that the Q3(mAl) peaks are associated with crosslinking C-A-S-H and not
alumina/silica gel since there is no Q4(mAl) presence.
4.2.4 C-A-S-H SYNTHESIZED BY DIRECT REACTION
Figure 34: 29Si NMR spectrum of CASH_DR_1.0A.

7/17/2019 William Hunnicutt
http://slidepdf.com/reader/full/william-hunnicutt 67/139
61
Figure 35: 29Si NMR spectrum of CASH_DR_1.3A.
Figure 36: 29Si NMR spectrum of CASH_DR_1.5A.

7/17/2019 William Hunnicutt
http://slidepdf.com/reader/full/william-hunnicutt 68/139
62
Table 8: Deconvolution peak properties for CASH_DR_1.0A, CASH_DR_1.3A, and CASH_DR_1.5A.
Qn(mAl)Chemical
shift(ppm)
Width(ppm)
Proportion
CASH_DR_1.0A
Q1
(0Al) -79 3.45 5.3%Q2P(1Al) -81.4 2.13 1.7%
Q2B(0Al) -83.1 3.96 8.0%
Q2P(0Al) -86.2 4.48 15.9%
Q3(1Al) -90.2 5.46 16.6%
Q4(2Al) -95.5 6.02 21.2%
Q4(1Al) -99.5 5.11 12.6%
Q4(0Al) -104.5 5.53 11.4%
Q4(0Al) -111 5.38 7.4%
CASH_DR_1.3A
Q1(1Al) -76.8 2.28 6.3%Q1(0Al)/Q2B(1Al) -79.1 2.35 9.1%/6.3%
Q2P(1Al) -81.3 2.78 21.1%
Q2B(0Al) -83 2.75 19.0%
Q2P(0Al) -85.5 2.67 38.2%
CASH_DR_1.5A
Q1(0Al) -79.5 2.88 70.0%
Q2B(0Al) -83 2.93 9.5%
Q2P(0Al) -85.4 2.60 20.5%
The 29Si spectra for CASH_DR_1.0A, presented in Figure 34 and peak properties
in Table 8, indicates large amounts of alumina/silica gel with some C-A-S-H. Sample
CASH_DR_1.3A, presented in Figure 35 and peak properties in Table 8, has typical C-
A-S-H peaks, in addition to a peak at -76.8 ppm which can be assigned to Q1(1Al). This
assignment is made based on the 3 to 5 ppm chemical shift downfield from the Q1(0Al)
peak at approximately -79.5 when an alumina tetrahedron is bonded to the tetrahedral
silica. It is highly likely that a Q2B(1Al) environment can be inferred from the presence

7/17/2019 William Hunnicutt
http://slidepdf.com/reader/full/william-hunnicutt 69/139
63
of the Q1(1Al) peak because Al[4] must be in a pairing position, as shown in Figure 37.
Figure 37: Molecular structure and associated 29Si NMR peaks assignments for Al[4] in the pairing tetrahedron.
Aluminum in the pairing tetrahedron has been reported previously, although to a
limited extent [22, 23]. However, the previous reports of aluminum in the pairing
position came from data obtained by triple quantum 27Al experiments This
environment has been assigned to spectra which show a Q1(1Al) peak. The assumption
that there is no Al[4] in a chain ending site is reasonable since the MCL of the samples is
long. If there is no chain ending Al[4], then the quantity of Q2B(1Al) must be equal to or
greater than the quantity of Q1(1Al). The quantity of Q2B(1Al) would be greater than
Q1(1Al) if Al[4] occurred in a pairing tetrahedron in the middle of the chain. For the
purposes of this study, they are assumed to be equal. The Q2B(1Al) and Q1(0Al) peaks
overlap and are not possible to differentiate by means of deconvolution, thus the
proportion of Q1(0Al) and Q2B(1Al) were found by subtracting the area of the peak at -
76.8 ppm from the area of the peak at -79.1 ppm. The presence of the Q1(1Al) peak

7/17/2019 William Hunnicutt
http://slidepdf.com/reader/full/william-hunnicutt 70/139
64
means that alumina is going into some pairing tetrahedra positions, not exclusively into
bridging tetrahedra. CASH_DR_1.5A, presented in Figure 36 and peak properties in
Table 8, has a very intense Q1(0Al) peak which indicates short MCL. No Q2P(1Al) peak
is present, indicating that no aluminum entered the structure. This is confirmed from
27Al NMR in the next section.
Figure 38: 29Si NMR spectrum of CASH_DR_1.0B.
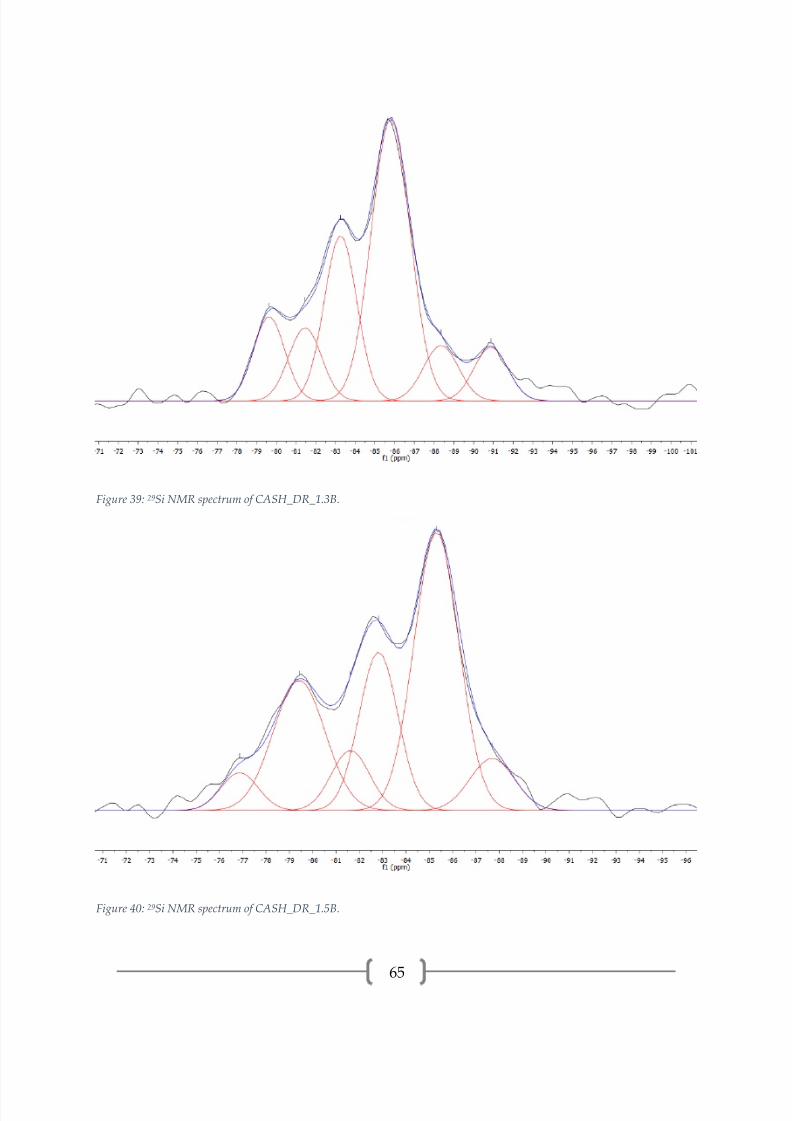
7/17/2019 William Hunnicutt
http://slidepdf.com/reader/full/william-hunnicutt 71/139
65
Figure 39: 29Si NMR spectrum of CASH_DR_1.3B.
Figure 40: 29Si NMR spectrum of CASH_DR_1.5B.

7/17/2019 William Hunnicutt
http://slidepdf.com/reader/full/william-hunnicutt 72/139
66
Table 9: Deconvolution peak properties for CASH_DR_1.0B, CASH_DR_1.3B, and CASH_DR_1.5B.
Qn(mAl)Chemical
shift(ppm)
Width(ppm)
Proportion
CASH_DR_1.0B
Q1
(0Al) -80 1.56 5.6%Q2P(1Al) -81.5 2.36 9.0%
Q2B(0Al) -83.3 2.65 18.3%
Q2P(0Al) -85.8 3.47 36.4%
Q3(1Al) -89.2 2.58 5.2%
Q3(0Al) -92.5 3.39 12.7%
Q4(2Al) -96.8 3.39 12.8%
CASH_DR_1.3B
Q1(0Al) -79.6 1.86 10.5%
Q2P(1Al) -81.5 1.94 9.6%
Q2B(0Al) -83.3 1.94 21.4%
Q2P(0Al) -85.8 2.31 43.6%
Q3(1Al) -88.3 2.08 7.7%
Q3(0Al) -90.9 2.01 7.3%
CASH_DR_1.5B
Q1(1Al) -76.9 1.86 4.5%
Q1(0Al)/Q2B(1Al) -79.4 2.61 17.0%/4.5%
Q2P(1Al) -81.6 1.93 7.3%
Q2B(0Al) -82.8 1.96 19.6%
Q2P(0Al) -85.3 2.26 39.7%Q3(1Al) -87.7 2.25 7.4%
The 29Si spectra for CASH_DR_1.0B, presented in Figure 38 and peak properties
in Table 9, indicates C-A-S-H with some alumina/silica gel present. The Q3(mAl)
connectivity may be in the C-A-S-H or the alumina/silica gel. CASH_DR_1.3B,
presented in Figure 39 and peak properties in Table 8, has a C-A-S-H structure with
some Q3(mAl) connectivity associated with crosslinking of the C-A-S-H.
CASH_DR_1.5B, presented in Figure 40 and peak properties in Table 8, has a C-A-S-H
structure with crosslinking through alumina bridging tetrahedra and some alumina in

7/17/2019 William Hunnicutt
http://slidepdf.com/reader/full/william-hunnicutt 73/139
67
the pairing tetrahedra, as evidenced by the presence of a Q3(1Al) and Q1(1Al) peak,
respectively. A schematic of this environment is shown in Figure 41.
Figure 41: Molecular structure of C-A-S-H with Al[4] in the pairing tetrahedron and crosslinking bridging tetrahedron.
Consequently, a Q2B(1Al) environment is highly likely to exist if a Q1(1Al) environment
exists and the proportion of Q2B(1Al) must equal to or greater than Q1(1Al), for the same
reasons stated previously. For the purposes of this study, they are assumed to be equal.
The Q2B(1Al) and Q1(0Al) peak overlap and are not possible to differentiate by means of
deconvolution, thus the proportion of Q1
(0Al) and Q2
B(1Al) were found by subtracting
the area of the peak at -76.9 ppm from the area of the peak at -79.4 ppm. All samples
have similar amounts of alumina in the C-A-S-H, as evidenced by the proportion of

7/17/2019 William Hunnicutt
http://slidepdf.com/reader/full/william-hunnicutt 74/139
68
Q2P(1Al) and Q1(1Al). The quantity of Q1(mAl) peaks increases with the starting Ca/Si
ratio, indicating a decrease in MCL with increasing Ca/Si.
Figure 42: 29Si NMR spectrum of CASH_DR_1.7L.
Table 10: Deconvolution peak properties for CASH_DR_1.7L.
Qn(mAl)Chemical
shift(ppm)
Width(ppm)
Proportion
CASH_DR_1.7L
Q1(0Al) -79.7 2.63 31.6%
Q2P(1Al) -81.6 2.41 4.7%
Q2B(0Al) -83.2 2.21 16.8%
Q2P(0Al) -85.8 2.51 46.9%

7/17/2019 William Hunnicutt
http://slidepdf.com/reader/full/william-hunnicutt 75/139
69
The 29Si spectrum for CASH_DR_1.7L, presented in Figure 42 and peak
properties in Table 10, indicates C-A-S-H with a larger proportion of Q1(0Al) than other
samples, resulting in a shorter MCL.
Figure 43: 29Si NMR spectrum of CASH_DR_0.9H.
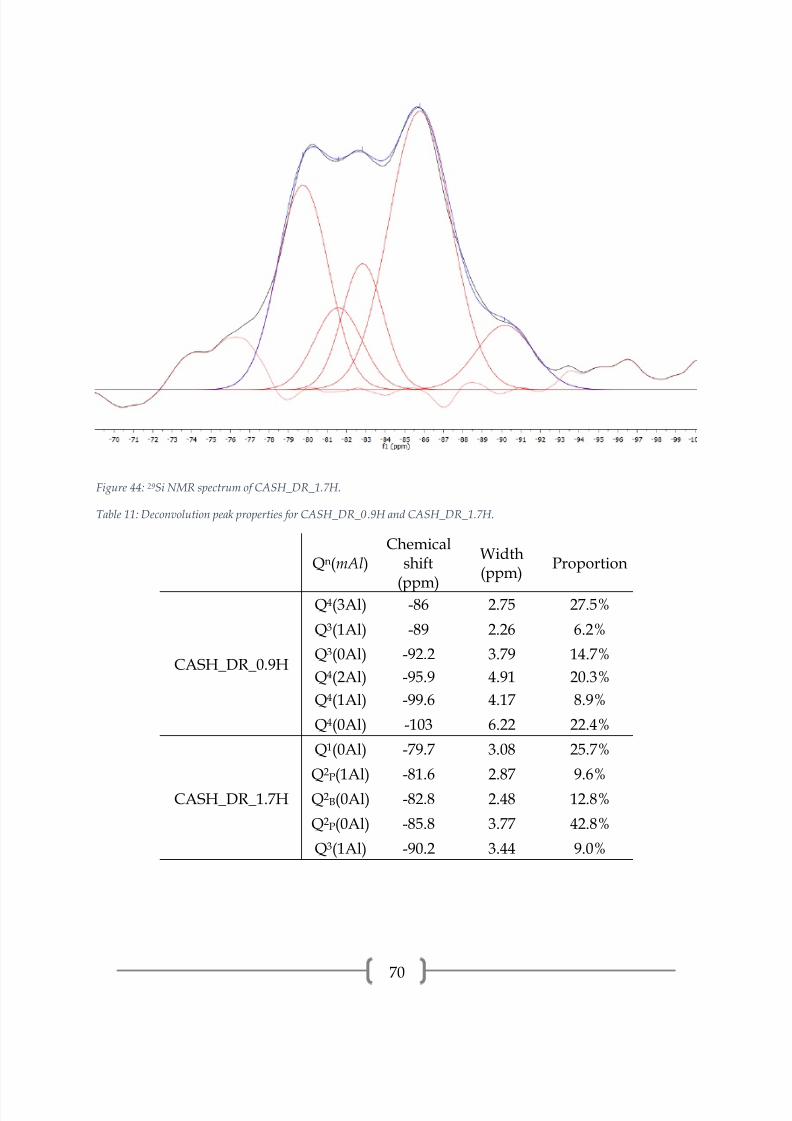
7/17/2019 William Hunnicutt
http://slidepdf.com/reader/full/william-hunnicutt 76/139
70
Figure 44: 29Si NMR spectrum of CASH_DR_1.7H.
Table 11: Deconvolution peak properties for CASH_DR_0.9H and CASH_DR_1.7H.
Qn(mAl)Chemical
shift
(ppm)
Width(ppm)
Proportion
CASH_DR_0.9H
Q4(3Al) -86 2.75 27.5%
Q3(1Al) -89 2.26 6.2%
Q3(0Al) -92.2 3.79 14.7%
Q4(2Al) -95.9 4.91 20.3%
Q4(1Al) -99.6 4.17 8.9%
Q4(0Al) -103 6.22 22.4%
CASH_DR_1.7H
Q1(0Al) -79.7 3.08 25.7%
Q2P(1Al) -81.6 2.87 9.6%
Q2B(0Al) -82.8 2.48 12.8%
Q2P(0Al) -85.8 3.77 42.8%
Q3(1Al) -90.2 3.44 9.0%
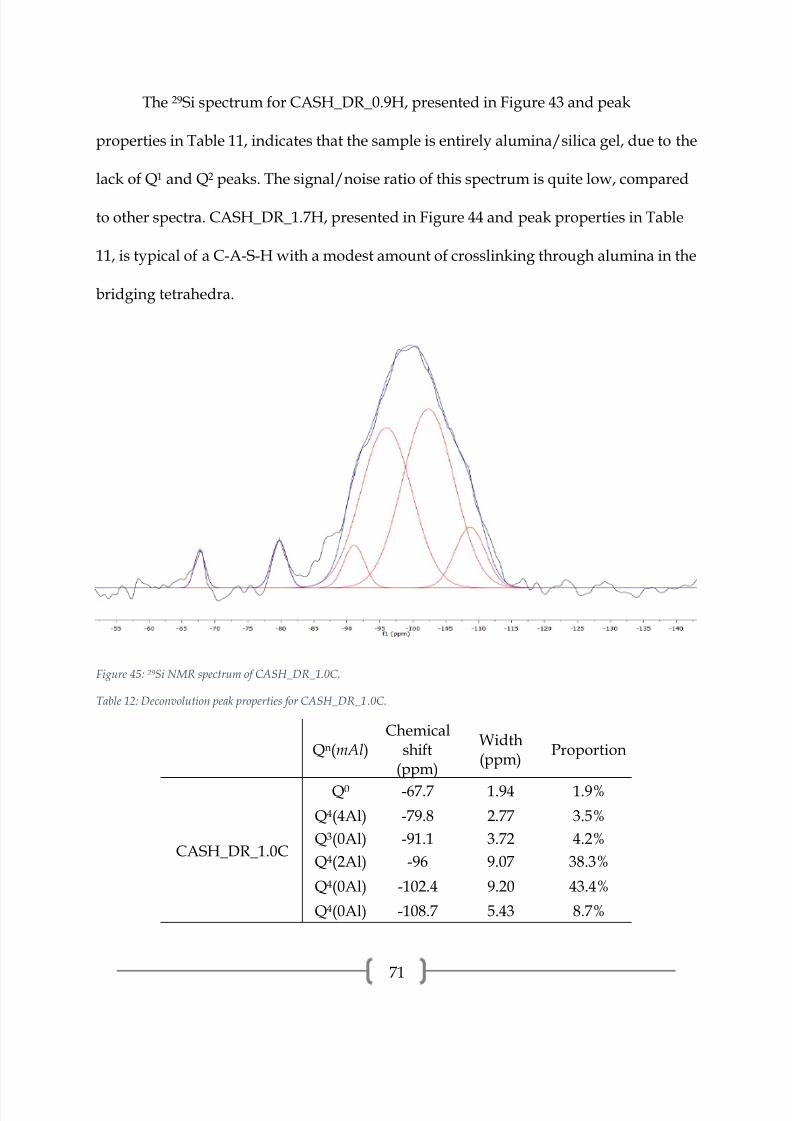
7/17/2019 William Hunnicutt
http://slidepdf.com/reader/full/william-hunnicutt 77/139
71
The 29Si spectrum for CASH_DR_0.9H, presented in Figure 43 and peak
properties in Table 11, indicates that the sample is entirely alumina/silica gel, due to the
lack of Q1 and Q2 peaks. The signal/noise ratio of this spectrum is quite low, compared
to other spectra. CASH_DR_1.7H, presented in Figure 44 and peak properties in Table
11, is typical of a C-A-S-H with a modest amount of crosslinking through alumina in the
bridging tetrahedra.
Figure 45: 29Si NMR spectrum of CASH_DR_1.0C.
Table 12: Deconvolution peak properties for CASH_DR_1.0C.
Qn(mAl)Chemical
shift(ppm)
Width(ppm)
Proportion
CASH_DR_1.0C
Q0 -67.7 1.94 1.9%
Q4(4Al) -79.8 2.77 3.5%
Q3(0Al) -91.1 3.72 4.2%
Q4(2Al) -96 9.07 38.3%
Q4(0Al) -102.4 9.20 43.4%
Q4(0Al) -108.7 5.43 8.7%

7/17/2019 William Hunnicutt
http://slidepdf.com/reader/full/william-hunnicutt 78/139
72
The 29Si spectrum of CASH_DR_1.0C, presented in Figure 45 and peak properties
in Table 12, is entirely alumina/silica gel, as evidenced by the large amounts of Q4(mAl)
present. This is confirmed by XRD, which showed only an amorphous hump. A small
peak at -67.7 ppm exists, which can be attributed to Q0, or a monomer silica tetrahedra
[24]. The presence of the Q0 peak is odd and is typically not observed in C-S-H, but is
observed in portland cement.
4.2.5 CARBONATION TREATMENT OF C-S-H
Figure 46: 29Si NMR spectrum of CSH_DR_1.3A_NaNO3.

7/17/2019 William Hunnicutt
http://slidepdf.com/reader/full/william-hunnicutt 79/139
73
Figure 47: 29Si NMR spectrum of CSH_DR_13A_NaOH.
Figure 48: 29Si NMR spectrum of CSH_DR_13A_KOH.

7/17/2019 William Hunnicutt
http://slidepdf.com/reader/full/william-hunnicutt 80/139
74
Table 13: Deconvolution peak properties for CSH_DR_1.3A_NaNO3, CSH_DR_1.3A_NaOH, and CSH_DR_1.3A_KOH.
Qn(mAl) ppmWidth(ppm)
Proportion
CSH_DR_1.3A_NaNO3
Q1(0Al) -79.4 2.26 7.2%
Q2B(0Al)? -81.6 1.78 11.9%Q2
B(0Al) -83.8 2.33 18.7%
Q2P(0Al) -85.3 2.33 39.6%
Q3(0Al) -88.2 3.10 14.5%
Q3(0Al) -95.6 2.98 8.1%
CSH_DR_1.3A_NaOH
Q0 -68.6 1.46 3.8%
Q1(0Al) -80.0 4.26 20.3%
Q2B(0Al) -83.4 2.80 17.2%
Q2P(0Al) -85.2 3.69 35.2%
Q3(0Al) -88.7 3.49 11.6%Q3(0Al) -92.2 4.02 12.0%
CSH_DR_1.3A_KOH
Q1(0Al) -77.0 2.80 7.8%
Q2B(0Al) -80.3 3.52 24.1%
Q2P(0Al) -84.0 3.35 49.5%
Q3(0Al) -87.2 3.35 18.7%
The29
Si spectrum for CSH_DR_1.3A_NaNO3, presented in Figure 46 and peak
properties in Table 13, is comprised of mostly C-S-H peaks with a some Q3(0Al). Both
Q3(0Al) peaks are attributed to crosslinking the C-S-H. It is presumed that the more
upfield peak is also bonded to sodium, resulting in more chemical shielding. The Q2
environment is the dominant chemical environment. The peak at -81.6 is of unknown
origin. The peak position would indicate a Q2P(1Al) peak, but no aluminum is present
in this system. It is more likely that this peak comes from a Q2B(0Al) site that is charge
balanced by sodium instead of calcium, which would push the peak downfield from the
-83.8 ppm position, which is charge balanced by calcium. The 29Si spectrum of

7/17/2019 William Hunnicutt
http://slidepdf.com/reader/full/william-hunnicutt 81/139
75
CSH_DR_1.3A_NaOH, presented in Figure 47 and peak properties in Table 13, has a
small peak attributed to Q0 that is close to the noise level. Additionally, a C-S-H
dreierketten structure with cross-linking is observed. Both Q3(0Al) peaks are attributed
to crosslinking the C-S-H. It is presumed that the more upfield peak is also bonded to
sodium, resulting in more chemical shielding. This sample has a higher proportion of
Q1(0Al) than the other samples. The 29Si spectrum for CSH_DR_1.3A_KOH, presented
in Figure 48 and peak properties in Table 13, has peaks with chemical shifts that are less
negative than previously seen. However, it is believed that these peaks still represent C-
S-H since it is observed in the XRD patterns. All four peaks are shifted roughly 2 ppm
downfield indicating that there is a universal change in the system, which may be
caused by the potassium or a referencing error in the NMR analysis. The Q3(0Al) peak is
attributed to cross-linking in the C-S-H.

7/17/2019 William Hunnicutt
http://slidepdf.com/reader/full/william-hunnicutt 82/139
76
4.3 27Al NMR
4.3.1 C-A-S-H SYNTHESIZED BY DOUBLE DECOMPOSITION
Figure 49: 27 Al NMR spectrum of CASH_DD_0.8B.

7/17/2019 William Hunnicutt
http://slidepdf.com/reader/full/william-hunnicutt 83/139
77
Figure 50: 27 Al NMR spectrum of CASH_DD_0.9B.
Figure 51: 27 Al NMR spectrum of CASH_DD_1.1B.

7/17/2019 William Hunnicutt
http://slidepdf.com/reader/full/william-hunnicutt 84/139
78
Figure 52: 27 Al NMR spectrum of CASH_DD_1.3B.
Figure 53: 27 Al NMR spectrum of CASH_DD_1.5B.

7/17/2019 William Hunnicutt
http://slidepdf.com/reader/full/william-hunnicutt 85/139
79
Table 14: Deconvolution peak properties for CASH_DD_0.8B, CASH_DD_0.9B, CASH_DD_1.1B, CASH_DD_1.3B, andCASH_DD_1.5B.
AssignmentChemical
shift(ppm)
Width(ppm)
Proportion
CASH_DD_0.8BAl[4] 55.5 17.46 91.3%
Al[5] 36.8 12.20 8.7%
CASH_DD_0.9BAl[4] 55.2 15.38 84.6%
Al[5] 39.8 14.03 15.4%
CASH_DD_1.1B
Al[4] 69.7 9.78 5.2%
Al[4] 56.7 16.84 89.0%
Al[5] 37.9 12.28 5.8%
CASH_DD_1.3B Al[4] 57.9 17.93 100.0%
CASH_DD_1.5BAl[4] 55.5 16.62 89.1%
Al[5] 37.7 14.22 10.9%
The 27Al spectra for all samples, presented in Figures 49-53 and peak properties
in Table 14, are dominated by Al[4], which occurs in the 50 to 80 ppm range [9].
CASH_DD_1.1B has an additional, small Al[4] peak that is presumed to exist due to
asymmetry from the quadrupolar interactions in the 27Al nucleus. Therefore, only one
chemical environment is thought to exist. All samples except for CASH_DD_1.3B also
contained an Al[5] peak, which occurs in the 15 to 40 ppm range [9]. Al[5] is presumed
to occur in the interlayer spacing of the C-A-S-H [2]. The 29Si results for
CASH_DD_0.9B, CASH_DD_1.1B, and CASH_DD_1.3B indicate that Al[4] occurs both
in the C-A-S-H and alumina/silica gel due to the Q2(1Al) peak and Q3/Q4(mAl) peaks.

7/17/2019 William Hunnicutt
http://slidepdf.com/reader/full/william-hunnicutt 86/139
80
Figure 54: 27 Al NMR spectrum of CASH_DD_2.2H.
Figure 55: 27 Al NMR spectrum of CASH_DD_2.2L.

7/17/2019 William Hunnicutt
http://slidepdf.com/reader/full/william-hunnicutt 87/139
81
Table 15: Deconvolution peak properties for CASH_DD_2.2H and CASH_DD_2.2L.
AssignmentChemical
shift
(ppm)
Width
(ppm)
Proportion
CASH_DD_2.2HAl[4] 54 15.35 85.9%
Al[5] 37.3 14.60 14.1%
CASH_DD_2.2L Al[4] 57.6 19.54 100.0%
The 27Al spectrum of CASH_DD_2.2H, presented in Figure 54 and peak
properties in Table 15, contains both Al[4] and Al[5] while CASH_DD_2.2L, presented
in Figure 55 and peak properties in Table 15, only contains Al[4]. The 29Si spectrum for
CASH_DD_2.2H is dominated by Q4 structures and the chemical environment of the
Al[5] is unknown, though it may be occurring in an alumina/silica gel. The 29Si
spectrum for CASH_DD_2.2L indicates that Al[4] occurs in the C-A-S-H in the bridging
tetrahedra by the Q2(1Al) peak.

7/17/2019 William Hunnicutt
http://slidepdf.com/reader/full/william-hunnicutt 88/139
82
4.3.2 C-A-S-H SYNTHESIZED BY DIRECT REACTION
Figure 56: 27 Al NMR spectrum of CASH_DR_1.0A.
Figure 57: 27 Al NMR spectrum of CASH_DR_1.3A.

7/17/2019 William Hunnicutt
http://slidepdf.com/reader/full/william-hunnicutt 89/139
83
Figure 58: 27 Al NMR spectrum of CASH_DR_1.5A.
Table 16: Deconvolution peak properties for CASH_DR_1.0A, CASH_DR_1.3A, and CASH_DR_1.5A.
AssignmentChemical
shift(ppm)
Width(ppm)
Proportion
CASH_DR_1.0A
Al[4] 63.6 8.14 17.9%Al[4] 56.4 8.70 66.3%
Al[6] 3.9 8.32 14.3%
Al[6] -2.94 4.36 1.5%
CASH_DR_1.3A
Al[4] 68.8 8.71 15.6%
Al[4] 60.9 11.44 79.3%
Al[6] 5 5.72 5.1%
CASH_DR_1.5A - - - -
The 27Al spectra for CASH_DR_1.0A, Figure 56, and CASH_DR_1.3A, Figure 57,
are both predominantly Al[4] with some Al[6]. The Al[6] environment appears as signal
intensity in the -20 to 20 ppm range in 27Al NMR [9]. Deconvolution peak properties are
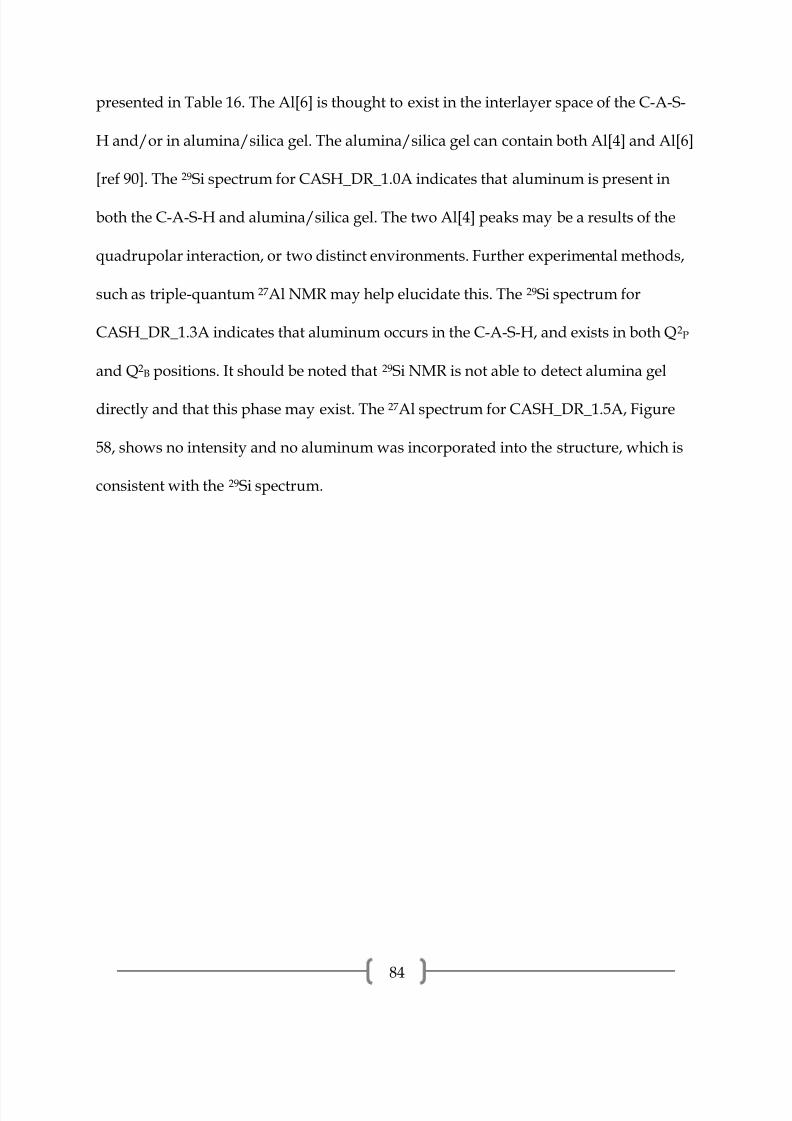
7/17/2019 William Hunnicutt
http://slidepdf.com/reader/full/william-hunnicutt 90/139
84
presented in Table 16. The Al[6] is thought to exist in the interlayer space of the C-A-S-
H and/or in alumina/silica gel. The alumina/silica gel can contain both Al[4] and Al[6]
[ref 90]. The 29Si spectrum for CASH_DR_1.0A indicates that aluminum is present in
both the C-A-S-H and alumina/silica gel. The two Al[4] peaks may be a results of the
quadrupolar interaction, or two distinct environments. Further experimental methods,
such as triple-quantum 27Al NMR may help elucidate this. The 29Si spectrum for
CASH_DR_1.3A indicates that aluminum occurs in the C-A-S-H, and exists in both Q2P
and Q2B positions. It should be noted that 29Si NMR is not able to detect alumina gel
directly and that this phase may exist. The 27Al spectrum for CASH_DR_1.5A, Figure
58, shows no intensity and no aluminum was incorporated into the structure, which is
consistent with the 29Si spectrum.

7/17/2019 William Hunnicutt
http://slidepdf.com/reader/full/william-hunnicutt 91/139
85
Figure 59: 27 Al NMR spectrum of CASH_DR_1.0B.
Figure 60: 27 Al NMR spectrum of CASH_DR_1.3B.

7/17/2019 William Hunnicutt
http://slidepdf.com/reader/full/william-hunnicutt 92/139
86
Figure 61: 27 Al NMR spectrum of CASH_DR_1.5B.
Table 17: Deconvolution peak properties for CASH_DR_1.0B, CASH_DR_1.3B, and CASH_DR_1.5B.
AssignmentChemical
shift
(ppm)
Width(ppm)
Proportion
CASH_DR_1.0B
Al[4] 65.21 8.32 13.7%
Al[4] 56.81 9.25 70.2%
Al[6] 4.36 7.97 14.0%
Al[6] -2.57 4.59 2.0%
CASH_DR_1.3B
Al[4] 61.41 12.56 80.1%
Al[5] 31.85 7.23 2.0%
Al[6] 3.68 8.94 16.8%
Al[6] -4.44 4.05 1.1%
CASH_DR_1.5B
Al[4] 66.78 9.50 13.8%
Al[4] 58.98 11.10 70.9%
Al[5] 30.96 9.18 2.6%
Al[6] 3.67 8.37 11.8%
Al[6] -3.23 3.31 1.0%

7/17/2019 William Hunnicutt
http://slidepdf.com/reader/full/william-hunnicutt 93/139
87
The 27Al spectrum for CASH_DR_1.0B, presented in Figure 59 and peak
properties in Table 17, contains both Al[4] and Al[6] peaks. The smaller Al[6] peak is
thought to exist due to the quadrupolar interaction of the 27Al nucleus which causes
asymmetry in the peak shape and can manifest itself as a false peak. Al[6] is in the
interlayer space of C-A-S-H and in the alumina/silica gel identified by 29Si NMR and
XRD [ref 90]. The smaller Al[4] peak may be to the quadrupolar interaction, or a
different chemical environment caused by the alumina/silica gel that was identified
from the 29Si spectrum [42]. CASH_DR_1.3B, Figure 60, and CASH_DR_1.5B, Figure 61,
both are dominantly Al[4] with some Al[5] and Al[6]. The two Al[4] peaks in
CASH_DR_1.5B may be due to the quadrupolar interaction or the presence of multiple
Al[4] sites as identified by the 29Si spectrum.
Figure 62: 27 Al NMR spectrum of CASH_DR_0.9L.

7/17/2019 William Hunnicutt
http://slidepdf.com/reader/full/william-hunnicutt 94/139
88
Figure 63: 27 Al NMR spectrum of CASH_DR_1.1L.
Figure 64: 27 Al NMR spectrum of CASH_DR_1.3L.
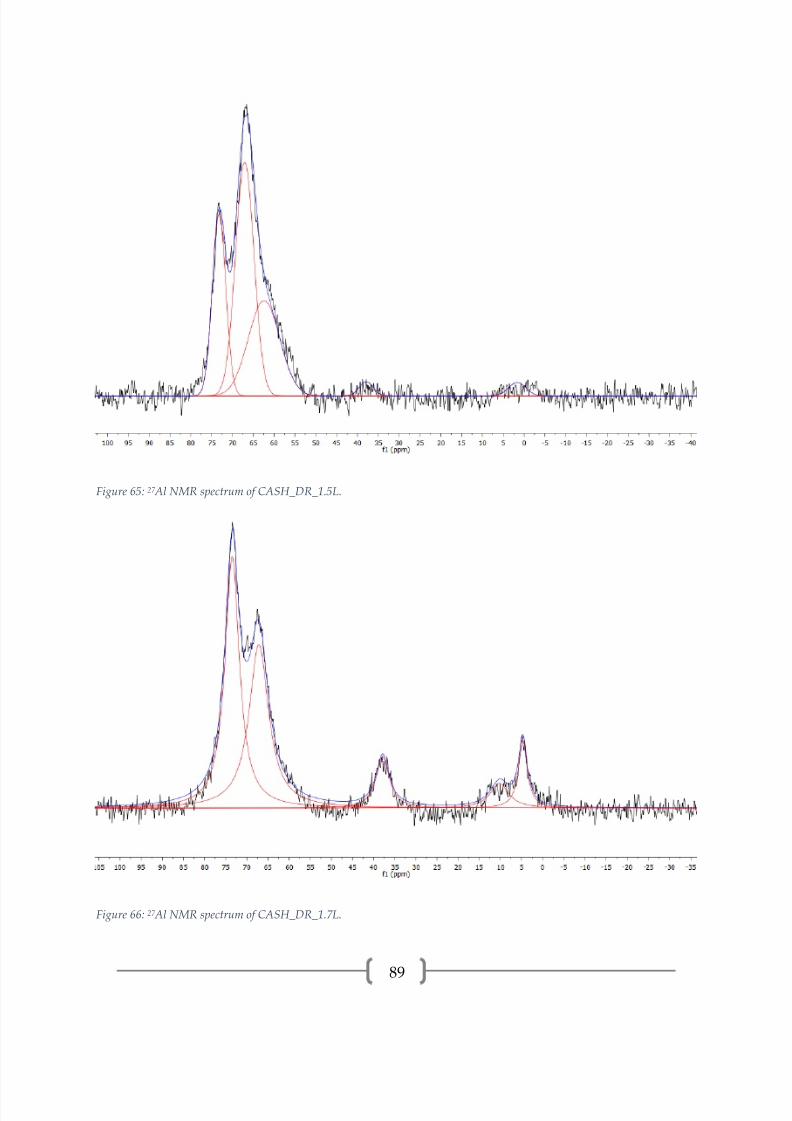
7/17/2019 William Hunnicutt
http://slidepdf.com/reader/full/william-hunnicutt 95/139
89
Figure 65: 27 Al NMR spectrum of CASH_DR_1.5L.
Figure 66: 27 Al NMR spectrum of CASH_DR_1.7L.

7/17/2019 William Hunnicutt
http://slidepdf.com/reader/full/william-hunnicutt 96/139
90
Table 18: Deconvolution peak properties for CASH_DR_0.9L, CASH_DR_1.1L, CASH_DR_1.3L, CASH_DR_1.5L, andCASH_DR_1.7L.
AssignmentChemical
shift(ppm)
Width(ppm)
Proportion
CASH_DR_0.9LAl[4] 63.58 4.56 6.9%
Al[4] 56.78 8.08 93.1%
CASH_DR_1.1L
Al[4] 64.37 5.10 12.8%
Al[4] 58.36 8.17 83.9%
Al[6] -0.05 7.46 3.3%
CASH_DR_1.3L
Al[4] 66.59 6.35 14.0%
Al[4] 59.83 9.74 83.9%
Al[6] -0.88 3.83 2.2%
CASH_DR_1.5L
Al[4] 73.22 3.82 24.0%
Al[4] 67.06 5.25 42.3%Al[4] 62.42 8.91 29.4%
Al[5] 37.89 4.08 2.0%
Al[6] 1.65 4.94 2.3%
CASH_DR_1.7L
Al[4] 77.95 4.01 5.8%
Al[4] 73.46 4.12 36.9%
Al[4] 67.52 5.61 34.1%
Al[4] 62.92 6.43 6.5%
Al[5] 37.86 3.77 6.5%
Al[6] 10.24 5.36 4.5%
Al[6] 4.74 2.47 5.6%
The 27Al spectrum for all of the samples presented in Figures 62-66, and peak
properties in Table 18, are Al[4] dominant. CASH_DR_1.1L, CASH_DR_1.3L,
CASH_DR_1.5L, and CASH_DR_1.7L have some Al[6] present as well. CASH_DR_1.5L
and CASH_DR_1.7L have Al[5]. The Al[6] and Al[5] are both thought to occur in the
interlayer of the C-A-S-H. The Al[6] and Al[5] may also be in alumina/silica gel since
there is evidence of carbonation from XRD. However, this cannot be stated with
certainty since the only 29Si spectrum available is for CASH_DR_1.7L. There are

7/17/2019 William Hunnicutt
http://slidepdf.com/reader/full/william-hunnicutt 97/139
91
multiple, well-defined Al[4] peaks in the CASH_DR_1.5L and CASH_DR_1.7L samples.
The 29Si spectrum for CASH_DR_1.7L does not indicate Al[4] environments besides the
bridging tetrahedra position in C-A-S-H. The XRD patterns of these samples do not
indicate any crystalline phases besides CaCO3 and C-A-S-H. The local atomic
environment of these peaks remains unknown. However, techniques such as triple-
quantum 27Al NMR may prove useful.
Figure 67: 27 Al NMR spectrum of CASH_DR_0.9H.

7/17/2019 William Hunnicutt
http://slidepdf.com/reader/full/william-hunnicutt 98/139
92
Figure 68: 27 Al NMR spectrum of CASH_DR_1.1H.
Figure 69: 27 Al NMR spectrum of CASH_DR_1.3H.

7/17/2019 William Hunnicutt
http://slidepdf.com/reader/full/william-hunnicutt 99/139
93
Figure 70: 27 Al NMR spectrum of CASH_DR_1.5H.
Figure 71: 27 Al NMR spectrum of CASH_DR_1.7H.

7/17/2019 William Hunnicutt
http://slidepdf.com/reader/full/william-hunnicutt 100/139
94
Table 19: Deconvolution peak properties for CASH_DR_0.9H, CASH_DR_1.1H, CASH_DR_1.3H, CASH_DR_1.5H, andCASH_DR_1.7H.
AssignmentChemical
shift(ppm)
Width(ppm)
Proportion
CASH_DR_0.9HAl[4] 65.03 3.61 3.6%
Al[4] 57.39 8.82 96.4%
CASH_DR_1.1H
Al[4] 64.32 4.01 4.0%
Al[4] 56.65 8.75 88.2%
Al[6] 8.46 5.73 4.9%
Al[6] 3.25 5.59 2.9%
CASH_DR_1.3H
Al[4] 65.07 4.66 5.8%
Al[4] 57.08 9.46 93.3%
Al[6] 5.19 4.62 1.0%
CASH_DR_1.5H
Al[4] 73.64 3.19 2.5%Al[4] 68.17 5.69 8.3%
Al[4] 60.94 11.08 86.9%
Al[5] 31.76 2.75 0.8%
Al[6] 4.29 5.54 1.5%
CASH_DR_1.7H
Al[4] 73.57 3.40 12.0%
Al[4] 66.95 7.93 47.8%
Al[4] 60.34 8.55 31.7%
Al[5] 35.43 4.73 0.8%
Al[6] 6.13 6.61 5.2%
Al[6] 0.32 5.80 2.5%
The 27Al spectrum for CASH_DR_0.9H, Figure 67, contains only Al[4] while all
others, Figures 68-71, also contain Al[6]. Deconvolution peak properties are presented
in Table 19. CASH_DR_1.5H and CASH_DR_1.7H also contain Al[5]. The Al[4] in
CASH_DR_0.9H occurs in the alumina/silica gel, which is the predominant phase
indicated by 29Si NMR. In CASH_DR_1.5H and CASH_DR_1.7H there are multiple,
well-defined Al[4] peaks. The 29Si spectrum of CASH_DR_1.7H indicates that Al[4] is
present in both Q2 and Q3 sites, which may lead to multiple peaks in the 27Al spectrum.

7/17/2019 William Hunnicutt
http://slidepdf.com/reader/full/william-hunnicutt 101/139
95
However, other 29Si spectra with Q2 and Q3 Al[4] sites do not show the same 27Al NMR
behavior.
Figure 72: 27 Al NMR spectrum of CASH_DR_1.0C.
Table 20: Deconvolution peak properties.
AssignmentChemical
shift(ppm)
Width(ppm)
Proportion
CASH_DR_1.0C
Al[4] 55.47 7.85 32.8%
Al[4] 60.68 5.88 7.5%
Al[6] 0.72 7.30 18.1%
Al[6] 5.77 3.59 37.1%Al[6] -6.71 6.47 4.6%
The 27Al spectrum for CASH_DR_1.0C, presented in Figure 72 and peak
properties in Table 20, consists of Al[4] and Al[6]. The Al[4] and Al[6] both occur in the
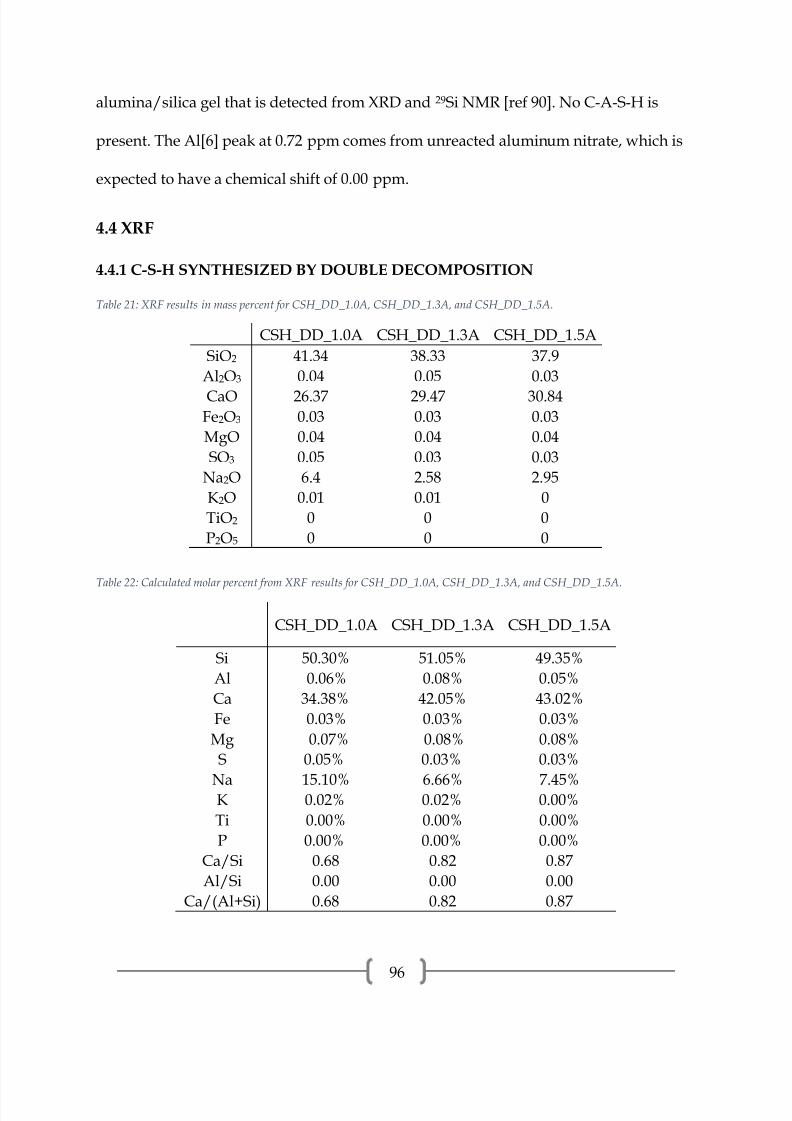
7/17/2019 William Hunnicutt
http://slidepdf.com/reader/full/william-hunnicutt 102/139
96
alumina/silica gel that is detected from XRD and 29Si NMR [ref 90]. No C-A-S-H is
present. The Al[6] peak at 0.72 ppm comes from unreacted aluminum nitrate, which is
expected to have a chemical shift of 0.00 ppm.
4.4 XRF
4.4.1 C-S-H SYNTHESIZED BY DOUBLE DECOMPOSITION
Table 21: XRF results in mass percent for CSH_DD_1.0A, CSH_DD_1.3A, and CSH_DD_1.5A.
CSH_DD_1.0A CSH_DD_1.3A CSH_DD_1.5A
SiO2 41.34 38.33 37.9
Al2O3 0.04 0.05 0.03
CaO 26.37 29.47 30.84Fe2O3 0.03 0.03 0.03
MgO 0.04 0.04 0.04
SO3 0.05 0.03 0.03
Na2O 6.4 2.58 2.95
K2O 0.01 0.01 0
TiO2 0 0 0
P2O5 0 0 0
Table 22: Calculated molar percent from XRF results for CSH_DD_1.0A, CSH_DD_1.3A, and CSH_DD_1.5A.
CSH_DD_1.0A CSH_DD_1.3A CSH_DD_1.5A
Si 50.30% 51.05% 49.35%
Al 0.06% 0.08% 0.05%
Ca 34.38% 42.05% 43.02%
Fe 0.03% 0.03% 0.03%
Mg 0.07% 0.08% 0.08%
S 0.05% 0.03% 0.03%
Na 15.10% 6.66% 7.45%K 0.02% 0.02% 0.00%
Ti 0.00% 0.00% 0.00%
P 0.00% 0.00% 0.00%
Ca/Si 0.68 0.82 0.87
Al/Si 0.00 0.00 0.00
Ca/(Al+Si) 0.68 0.82 0.87

7/17/2019 William Hunnicutt
http://slidepdf.com/reader/full/william-hunnicutt 103/139
97
Table 21 presents the XRF data and Table 22 presents the calculated molar
percentages for CSH_DD_1.0A, CSH_DD_1.3A, and CSH_DD_1.5A. All samples have
Ca/Si ratios well below the starting Ca/Si ratios. Additionally, sodium is found in all
three samples, likely as a charge balancing cation.
Table 23: XRF results in mass percent for CSH_DD_0.8B, CSH_DD_0.9B, CSH_DD_1.1B, CSH_DD_1.3B, andCSH_DD_1.5B.
CSH_DD_0.8B
CSH_DD_0.9B
CSH_DD_1.1B
CSH_DD_1.3B
CSH_DD_1.5B
SiO2 43.31% 42.58% 40.91% 41.22% 41.94%Al2O3 0.40% 0.31% 0.17% 0.56% 0.4.0%
CaO 29.49% 31.1% 30.5% 31.35% 31.62%
Fe2O3 0.04% 0.02% 0.07% 0.06% 0.02%
MgO 0.06% 0.05% 0.07% 0.06% 0.06%
SO3 0.03% 0.01% 0.06% 0.02% 0.01%
Na2O 0.01% 0.00% 0.04% 0.00% 0.00%
K2O 0.01% 0.00% 0.02% 0.00% 0.00%
Table 24: Calculated molar percent from XRF results for CSH_DD_0.8B, CSH_DD_0.9B, CSH_DD_1.1B, CSH_DD_1.3B,and CSH_DD_1.5B.
CSH_DD_0.8B
CSH_DD_0.9B
CSH_DD_1.1B
CSH_DD_1.3B
CSH_DD_1.5B
Si 57.32% 55.76% 55.21% 54.51% 54.89%
Al 0.62% 0.48% 0.27% 0.87% 0.62%
Ca 41.82% 43.64% 44.11% 44.42% 44.34%
Fe 0.04% 0.02% 0.07% 0.06% 0.02%
Mg 0.12% 0.10% 0.14% 0.12% 0.12%
S 0.03% 0.01% 0.06% 0.02% 0.01%Na 0.03% 0.00% 0.10% 0.00% 0.00%
K 0.02% 0.00% 0.03% 0.00% 0.00%
Ca/Si 0.73 0.78 0.80 0.81 0.81
Al/Si 0.01 0.01 0.00 0.02 0.01
Ca/(Al+Si) 0.72 0.78 0.79 0.80 0.80

7/17/2019 William Hunnicutt
http://slidepdf.com/reader/full/william-hunnicutt 104/139
98
Table 23 presents the XRF data and Table 24 presents the calculated molar
percentages for CSH_DD_0.8B, CSH_DD_0.9B, CSH_DD_1.1B, CSH_DD_1.3B, and
CSH_DD_1.5B. All samples have Ca/Si ratios well below the starting Ca/Si ratios.
These Ca/Si ratios are almost equivalent across all samples.
4.4.2 C-S-H SYNTHESIZED BY DIRECT REACTION
Table 25: XRF results in mass percent for CSH_DR_1.0A, CSH_DR_1.3A, and CSH_DR_1.5A.
CSH_DR_1.0A CSH_DR_1.3A CSH_DR_1.5A
SiO2 43.85% 45.27% 37.84%
Al2O3 0.08% 0.04% 0.03%
CaO 28.24% 25.02% 36.81%Fe2O3 0.04% 0.02% 0.02%
MgO 0.03% 0.03% 0.03%
SO3 0.05% 0.03% 0.02%
Na2O 0.00% 0.05% 0.00%
K2O 0.02% 0.00% 0.00%
TiO2 0.00% 0.00% 0.00%
P2O5 0.00% 0.00% 0.00%
Table 26: Calculated molar percent from XRF results for CSH_DR_1.0A, CSH_DR_1.3A, and CSH_DR_1.5A.
CSH_DR_1.0A CSH_DR_1.3A CSH_DR_1.5A
Si 58.98% 62.61% 48.89%
Al 0.13% 0.07% 0.05%
Ca 40.70% 37.08% 50.96%
Fe 0.04% 0.02% 0.02%
Mg 0.06% 0.06% 0.06%
S 0.05% 0.03% 0.02%
Na 0.00% 0.13% 0.00%
K 0.03% 0.00% 0.00%
Ti 0.00% 0.00% 0.00%
P 0.00% 0.00% 0.00%
Ca/Si 0.69 0.59 1.04
Al/Si 0.00 0.00 0.00
Ca/(Al+Si) 0.69 0.59 1.04

7/17/2019 William Hunnicutt
http://slidepdf.com/reader/full/william-hunnicutt 105/139
99
Table 25 presents the XRF data and Table 26 presents the calculated molar
percentages for CSH_DR_1.0A, CSH_DR_1.3A, and CSH_DR_1.5A. The Ca/Si ratios for
all samples are all significantly lower than the starting Ca/Si ratios. Additionally, they
do not maintain the same relative order of Ca/Si ratio, with CSH_DR_1.3A having a
lower Ca/Si than CSH_DR_1.0A.
4.4.3 C-A-S-H SYNTHESIZED BY DOUBLE DECOMPOSITION
Table 27: XRF results in mass percent for CASH_DD_0.8B, CASH_DD_0.9B, CASH_DD_1.1B, CASH_DD_1.3B, andCASH_DD_1.5B.
CASH_DD_ 0.8B
CASH_DD_ 0.9B
CASH_DD_ 1.1B
CASH_DD_ 1.3B
CASH_DD_ 1.5B
SiO2 35.54% 34.22% 32.97% 33.62% 33.27%
Al2O3 11.92% 11.20% 11.03% 11.40% 10.60%
CaO 24.86% 25.54% 26.02% 26.03% 25.40%
Fe2O3 0.04% 0.03% 0.06% 0.04% 0.03%
MgO 0.03% 0.03% 0.04% 0.04% 0.05%
SO3 0.01% 0.01% 0.02% 0.02% 0.01%
Na2O 0.03% 0.03% 0.03% 0.00% 0.02%
K2O 0.01% 0.01% 0.01% 0.00% 0.00%
Table 28: Calculated molar percent from XRF results for CASH_DD_0.8B, CASH_DD_0.9B, CASH_DD_1.1B,CASH_DD_1.3B, and CASH_DD_1.5B.
.
CASH_DD
CASH_DD
CASH_DD_1.
CASH_DD_1.
CASH_DD Si 46.53% 45.67% 44.53% 44.79% 45.50%
Al 18.39% 17.62% 17.56% 17.90% 17.09%
Ca 34.87% 36.52% 37.65% 37.16% 37.22%
Fe 0.04% 0.03% 0.06% 0.04% 0.03%
Mg 0.06% 0.06% 0.08% 0.08% 0.10%S 0.01% 0.01% 0.02% 0.02% 0.01%
Na 0.08% 0.08% 0.08% 0.00% 0.05%
K 0.02% 0.02% 0.02% 0.00% 0.00%
Ca/Si 0.75 0.80 0.85 0.83 0.82
Al/Si 0.40 0.39 0.39 0.40 0.38
Ca/(Al+Si) 0.54 0.58 0.61 0.59 0.59

7/17/2019 William Hunnicutt
http://slidepdf.com/reader/full/william-hunnicutt 106/139
100
Table 27 presents the XRF data and Table 28 presents the calculated molar
percentages for CASH_DD_0.8B, CASH_DD_0.9B, CASH_DD_1.1B, CASH_DD_1.3B,
and CASH_DD_1.5B. The samples all have Ca/Si lower than the starting Ca/Si, and
samples CASH_DD_1.1B, CASH_DD_1.3B, and CASH_DD_1.5B are approximately
equal. The Al/Si ratios for all samples are approximately equal. The Al/Si ratios in
these samples are close to maximum aluminum content in alumina/silica gel if
Lowenstein’s rule (no Al-O-Al bonds) of 38% [25]. This supports the 29Si NMR spectra
of these samples that indicate significant amounts of alumina/silica gel.
4.4.4 C-A-S-H SYNTHESIZED BY DIRECT REACTION
Table 29: XRF results in mass percent for CASH_DR_1.0A, CASH_DR_1.3A, and CASH_DR_1.5A.
CASH_DR_1.0A CASH_DR_1.3A CASH_DR_1.5A
SiO2 44.94% 37.14% 37.50%
Al2O3 8.38% 7.33% 0.23%
CaO 18.75% 27.69% 30.56%
Fe2O3 0.04% 0.02% 0.02%
MgO 0.01% 0.02% 0.03%SO3 0.03% 0.03% 0.03%
Na2O 0.01% 0.00% 0.00%
K2O 0.00% 0.00% 0.00%
TiO2 0.00% 0.00% 0.00%
P2O5 0.00% 0.00% 0.00%

7/17/2019 William Hunnicutt
http://slidepdf.com/reader/full/william-hunnicutt 107/139
101
Table 30: Calculated molar percent from XRF results for CASH_DR_1.0A, CASH_DR_1.3A, and CASH_DR_1.5A.
CASH_DR_1.0A CASH_DR_1.3A CASH_DR_1.5A
Si 59.92% 49.18% 53.12%
Al 13.17% 11.44% 0.38%Ca 26.79% 39.29% 46.38%
Fe 0.04% 0.02% 0.02%
Mg 0.02% 0.04% 0.06%
S 0.03% 0.03% 0.03%
Na 0.03% 0.00% 0.00%
K 0.00% 0.00% 0.00%
Ti 0.00% 0.00% 0.00%
P 0.00% 0.00% 0.00%
Ca/Si 0.45 0.80 0.87
Al/Si 0.22 0.23 0.01Ca/(Al+Si) 0.37 0.65 0.87
Table 29 presents the XRF data and Table 30 presents the calculated molar
percentages for CASH_DR_1.0A, CASH_DR_1.3A, and CASH_DR_1.5A. The Ca/Si
ratios for the samples are all well below the starting Ca/Si ratios. The Al/Si ratios of
CASH_DR_1.0A and CASH_DR_1.3A are approximately equal while CASH_DR_1.5A
did not take up any aluminum.
Table 31: XRF results in mass percent for CASH_DR_1.0B, CASH_DR_1.3B, and CASH_DR_1.5B.
CASH_DR_1.0B CASH_DR_1.3B CASH_DR_1.5BSiO2 42.72% 36.61% 34.40%
Al2O3 8.60% 7.60% 6.76%CaO 18.97% 26.26% 25.08%
Fe2O3 0.04% 0.04% 0.02%MgO 0.02% 0.02% 0.02%SO3 0.06% 0.03% 0.03%
Na2O 0.04% 0.00% 0.00%K2O 0.01% 0.00% 0.00%TiO2 0.00% 0.00% 0.00%P2O5 0.00% 0.00% 0.00%

7/17/2019 William Hunnicutt
http://slidepdf.com/reader/full/william-hunnicutt 108/139
102
Table 32: Calculated molar percent from XRF results for CASH_DR_1.0B, CASH_DR_1.3B, and CASH_DR_1.5B.
CASH_DR_1.0B CASH_DR_1.3B CASH_DR_1.5B
Si 58.22% 49.61% 49.63%Al 13.81% 12.14% 11.50%
Ca 27.70% 38.13% 38.77%
Fe 0.04% 0.04% 0.02%
Mg 0.04% 0.04% 0.04%
S 0.06% 0.03% 0.03%
Na 0.11% 0.00% 0.00%
K 0.02% 0.00% 0.00%
Ti 0.00% 0.00% 0.00%
P 0.00% 0.00% 0.00%Ca/Si 0.48 0.77 0.78
Al/Si 0.24 0.24 0.23
Ca/(Al+Si) 0.38 0.62 0.63
Table 31 presents the XRF data and Table 32 presents the calculated molar
percentages for CASH_DR_1.0B, CASH_DR_1.3B, and CASH_DR_1.5B. The Ca/Si
ratios of all the samples are significantly lower than the starting Ca/Si, and
CASH_DR_1.3B and CASH_DR_1.5B are almost equivalent. The Al/Si ratios remains
approximately constant across all samples.

7/17/2019 William Hunnicutt
http://slidepdf.com/reader/full/william-hunnicutt 109/139
103
Table 33: XRF results in mass percent for CASH_DR0.9H, CASH_DR_1.1H, CASH_DR_1.3H, CASH_DR_1.5H, andCASH_D_1.7H.
CASH_DR_0.9H
CASH_DR_1.1H
CASH_DR_1.3H
CASH_DR_1.5H
CASH_DR_1.7H
SiO2 43.83% 41.05% 27.15% 36.98% 29.19%
Al2O3 9.46% 9.58% 5.45% 8.08% 6.74%
CaO 16.69% 18.28% 14.13% 24.53% 22.42%
Fe2O3 0.17% 0.07% 0.03% 0.05% 0.03%
MgO 0.11% 0.04% 0.04% 0.04% 0.03%
SO3 0.03% 0.02% 0.01% 0.01% 0.01%
Na2O 0.04% 0.00% 0.00% 0.00% 0.00%
K2O 0.05% 0.01% 0.01% 0.01% 0.01%
TiO2 0.01% 0.00% 0.00% 0.00% 0.00%
P2O5 0.00% 0.00% 0.00% 0.00% 0.00%
Table 34: Calculated molar percent from XRF results for CASH_DR0.9H, CASH_DR_1.1H, CASH_DR_1.3H,CASH_DR_1.5H, and CASH_D_1.7H.
CASH_DR_0.9H
CASH_DR _ 1.1H
CASH_DR _ 1.3H
CASH_DR _ 1.5H
CASH_DR _ 1.7H
Si 59.77% 56.96% 55.62% 50.72% 47.66%
Al 15.21% 15.67% 13.16% 13.06% 12.97%
Ca 24.39% 27.18% 31.01% 36.05% 39.22%
Fe 0.17% 0.07% 0.05% 0.05% 0.04%
Mg 0.22% 0.08% 0.12% 0.08% 0.07%
S 0.03% 0.02% 0.02% 0.01% 0.01%
Na 0.11% 0.00% 0.00% 0.00% 0.00%
K 0.09% 0.02% 0.03% 0.02% 0.02%
Ti 0.01% 0.00% 0.00% 0.00% 0.00%
P 0.00% 0.00% 0.00% 0.00% 0.00%
Ca/Si 0.41 0.48 0.56 0.71 0.82
Al/Si 0.25 0.28 0.24 0.26 0.27
Ca/(Al+Si) 0.33 0.37 0.45 0.57 0.65

7/17/2019 William Hunnicutt
http://slidepdf.com/reader/full/william-hunnicutt 110/139
104
Table 33 presents the XRF data and Table 34 presents the calculated molar
percentages for CASH_DR_0.9H, CASH_DR_1.1H, CASH_DR_1.3H, CASH_DR_1.5H,
and CASH_DR_1.7H. The Ca/Si ratios for all of the samples are less than the starting
Ca/Si ratios. The Al/Si ratio is approximately equivalent across all samples.
Table 35: XRF results in mass percent for CASH_DR0.9L, CASH_DR_1.1L, CASH_DR_1.3L, CASH_DR_1.5L, andCASH_D_1.7L
CASH_DR_0.9L
CASH_DR_1.1L
CASH_DR_1.3L
CASH_DR_1.5L
CASH_DR_1.7L
SiO2 43.37 - 30.31 31.14 28.33
Al2O3 5.11 - 3.11 3.06 3.11
CaO 21.99 - 19.03 23.66 25.46Fe2O3 0.03 - 0.02 0.02 0.02
MgO 0.02 - 0.02 0.02 0.03
SO3 0.01 - 0.01 0.01 0.01
Na2O 0 - 0 0 0
K2O 0 - 0 0 0
TiO2 0 - 0 0 0
P2O5 0 - 0 0 0
Table 36: Calculated molar percent from XRF results for CASH_DR0.9L, CASH_DR_1.1L, CASH_DR_1.3L,
CASH_DR_1.5L, and CASH_D_1.7L.
CASH_DR_ 0.9L
CASH_DR_ 1.1L
CASH_DR_ 1.3L
CASH_DR_ 1.5L
CASH_DR_ 1.7L
Si 59.40% - 55.70% 51.77% 47.74%
Al 8.25% - 6.74% 6.00% 6.18%
Ca 32.27% - 37.47% 42.15% 45.97%
Fe 0.03% - 0.03% 0.03% 0.03%
Mg 0.04% - 0.05% 0.05% 0.08%
S 0.01% - 0.01% 0.01% 0.01%
Na 0.00% - 0.00% 0.00% 0.00%K 0.00% - 0.00% 0.00% 0.00%
Ti 0.00% - 0.00% 0.00% 0.00%
P 0.00% - 0.00% 0.00% 0.00%
Ca/Si 0.54 - 0.67 0.81 0.96
Al/Si 0.14 - 0.12 0.12 0.13
Ca/(Al+Si) 0.48 - 0.60 0.73 0.85

7/17/2019 William Hunnicutt
http://slidepdf.com/reader/full/william-hunnicutt 111/139
105
Table 35 presents the XRF data and Table 36 presents the calculated molar
percentages for CASH_DR0.9L, CASH_DR_1.1L, CASH_DR_1.3L, CASH_DR_1.5L, and
CASH_D_1.7L. XRF results for sample CASH_DR_1.1L could not be obtained due to a
loss of vacuum during the experiment. All samples have lower Ca/Si ratios than the
starting Ca/Si ratios. The Al/Si ratio is approximately equal across all samples. These
samples had an Al/Si of approximately half that of the CASH_DR_#H samples.
4.5 TGA
Figure 73: TGA results of CSH_DR_1.3A_NaNO3.

7/17/2019 William Hunnicutt
http://slidepdf.com/reader/full/william-hunnicutt 112/139
106
Figure 74: TGA results for CSH_DR_1.3A_NaOH.
Figure 75: TGA results for CSH_DR_1.3E_KOH.

7/17/2019 William Hunnicutt
http://slidepdf.com/reader/full/william-hunnicutt 113/139
107
Figure 76: TGA results for CSH_DR_1.3A_H2O.
The TGA results for the carbonation treatment reveal mass loss associated with
CO2 release (550-1000°C) in Figures 73-76. The sample treated with KOH had the largest
mass loss (12.9%) followed by NaOH (12.7%), H2O (10.1%), and NaNO3 (6.7%).
7/17/2019 William Hunnicutt
http://slidepdf.com/reader/full/william-hunnicutt 114/139
108
5. DISCUSSION
The results presented in Chapter 4 use advanced characterization techniques to
probe the molecular structure of C-S-H and C-A-S-H with varying Ca/Si ratios and
aluminum content. Additionally, the carbonation behavior of C-S-H under different
alkali and pH conditions was observed. These results were analyzed in order to
understand the effect of these factors on the composition and molecular structure of
these phases.
5.1 EFFECT OF CA/SI RATIO
5.1.1 CRYSTAL STRUCTURE
The XRD analysis shows that C-S-H was formed in all syntheses of C-S-H. Many
of the patterns contained basal peaks, but there is no relation to the Ca/Si ratio of the C-
S-H. The samples in series CSH_DD_#A have more intense C-S-H peaks as the Ca/Si
ratio decreases. However, this trend does not hold with the samples synthesized by
direct reaction in which there is no apparent trend. There is no shift in peak position
with changing Ca/Si ratio.
5.1.2 MOLECULAR STRUCTURE
The effect of the Ca/Si ratio is most readily observed from 29Si NMR. The
calculation of MCL of the silicate chain in C-S-H can be calculated under the
assumption of a dreierkettern structure by:

7/17/2019 William Hunnicutt
http://slidepdf.com/reader/full/william-hunnicutt 115/139
109
MCL =2
(0)
(0) + (0Al) +
(0Al) +32
(1Al) + (0) + (1)
(4)
which is a modified version of Equation 1 to include Q3. The presence of Q3 is
incorporated into this equation by simply adding Q3(0Al) and Q3(1Al) to the sum all
tetrahedra in the denominator. The original equation did only considered linear chain
structures. Figure 77 and Table 37 show the MCL data in relation to the Ca/Si ratio
from XRF.
Figure 77: Plot of Ca/Si ratio from XRF versust MCL from 29Si NMR for C-S-H.
y = -0.0088x + 0.9092
y = -0.0055x + 0.9616
y = -0.0513x + 1.1886
0.4
0.5
0.6
0.7
0.8
0.9
1
1.1
0 5 10 15 20 25 30 35 40
C a / S i
MCL
CSH_DD_#A
CSH_DD_#B
CSH_DR_#A

7/17/2019 William Hunnicutt
http://slidepdf.com/reader/full/william-hunnicutt 116/139
110
Table 37: MCL from 29Si NMR and Ca/Si ratio from XRF for C-S-H.
MCL Ca/Si
CSH_DD_1.0A 25.7 0.68CSH_DD_1.3A 6.8 0.82
CSH_DD_1.5A 7.3 0.87
CSH_DD_0.8B 34.3 0.73
CSH_DD_0.9B 36.4 0.78CSH_DD_1.1B 32.6 0.80CSH_DD_1.3B 29.8 0.81CSH_DD_1.5B 26.8 0.81CSH_DR_1.0A 11.4 0.69CSH_DR_1.3A 9.2 0.59
CSH_DR_1.5A 3.5 1.04
From Figure 77 it is apparent that there is a general trend of increase in MCL with a
decrease in Ca/Si ratio, this agrees with the literature [11, 30]. However, the
relationship is not strong. The narrow spread of Ca/Si ratios limits broad interpretation
of the samples. The slopes of the linear regressions for the C-S-H synthesized by double
decomposition are similar and the slope of the linear regression line of the C-S-H
synthesized by direct reaction is greater. The CSH_DD_#B samples have a higher MCL
than CSH_DD_#A for a given Ca/Si ratio due to the effect of carbonation increasing the
MCL. Carbonation was more significant for the CSH_DD_#B samples, as indicated by
XRD. The influence of Ca/Si ratio on MCL is dependent on the synthesis method.

7/17/2019 William Hunnicutt
http://slidepdf.com/reader/full/william-hunnicutt 117/139
111
5.2 EFFECT OF AL INCORPORATION
5.2.1 CRYSTAL STRUCTURE
The XRD analysis shows that, in most cases, C-A-S-H was formed. The position
of the diffraction peaks for C-A-S-H is indistinguishable from the position of the
diffraction peaks in C-S-H. Samples CASH_DR_1.0A and CASH_DR_1.0B, presented in
Figure 10 and Figure 11, do not indicate C-A-S-H. These plots show only one peak at
about 29.2° that has been previously reported for C-S-H, but this peak can also be
attributed to calcite. Additionally, a large amorphous hump is present between about
20° and 30°. This hump indicates alumina/silica gel with low structural order. Neither
of these samples showed substantial CaCO3 peaks. The lack of CaCO3 peaks suggests
that the silica gel and very poorly ordered C-S-H were formed during synthesis and
that these phases are not the results of carbonation.
When Al is incorporated into the C-S-H structure there is no change in
diffraction peak positions. Specifically, the peaks corresponding to the (200) at 32.0° and
(020) at 49.8° dimensions of C-S-H did not change position. These dimensions are of the
octahedral CaO layer. The lack of change in these dimensions indicates that octahedral
aluminum is not being incorporated into the CaO layer of the C-S-H. The dimensions of
the octahedral CaO layer were not observed to change in Sun’s work either [2]. The
Al[6] and Al[5] that were observed by 27Al NMR is presumed to be located in the
interlayer where there is little long range order as proposed by Sun et al. [2]. The lack of

7/17/2019 William Hunnicutt
http://slidepdf.com/reader/full/william-hunnicutt 118/139
112
change in the XRD patterns with aluminum addition reflects this lack of long range
order.
5.2.2 MOLECULAR STRUCTURE
The effect of aluminum incorporation on the molecular structure is most easily
observed from 29Si NMR. Samples CASH_DR_1.3A and CASH_DR_1.5B have Al[4] in
the pairing tetrahedron position. The MCL was calculated for C-A-S-H samples by a
modification of Equation 4 to include the presence of Al[4] in the pairing position of the
alumino-silicate chain:
MCL
=2
+ (1)
+ (1) + +
+ 32
(1) + 2
(1) + + (1) −12
((1) − (1))
. (5)
The aluminum in the pairing tetrahedron position was considered by adding Q1(1Al) to
the numerator and denominator and Q2B(1Al) times a factor of two to the denominator
in order to count both the detected silicon tetrahedron in the bridging position and the
bonded aluminum in the pairing position. The term −
(
(1) − (1) is in the
denominator to ensure that the aluminum in pairing positions in the middle of the
chain are not counted multiple times since aluminum in the pairing position is bonded
to silicon in the bridging position and silicon in the pairing position.
In the C-A-S-H samples which contained C-A-S-H and alumina/silica gel two
MCL values were calculated, with and without Q3, to find lower and upper bounds of
the MCL since it is difficult to differentiate between Q3 in the C-S-H and Q3 in the
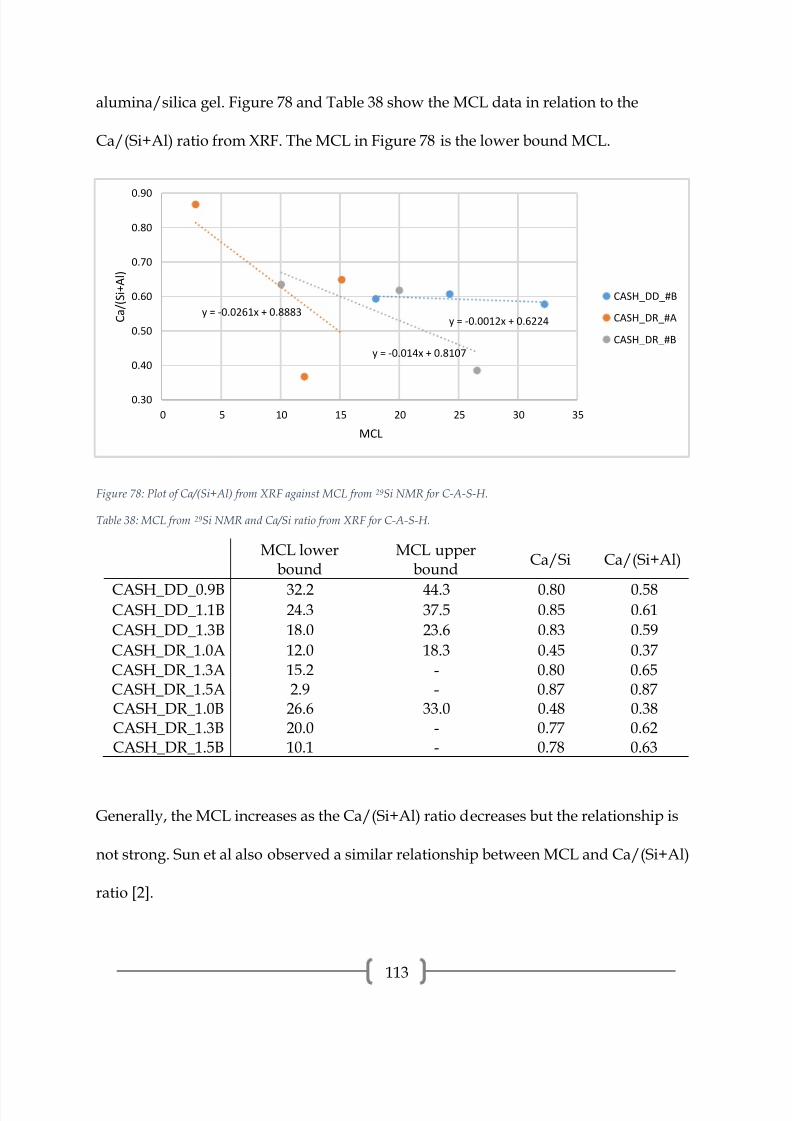
7/17/2019 William Hunnicutt
http://slidepdf.com/reader/full/william-hunnicutt 119/139
113
alumina/silica gel. Figure 78 and Table 38 show the MCL data in relation to the
Ca/(Si+Al) ratio from XRF. The MCL in Figure 78 is the lower bound MCL.
Figure 78: Plot of Ca/(Si+Al) from XRF against MCL from 29Si NMR for C-A-S-H.
Table 38: MCL from 29Si NMR and Ca/Si ratio from XRF for C-A-S-H.
MCL lowerbound
MCL upperbound
Ca/Si Ca/(Si+Al)
CASH_DD_0.9B 32.2 44.3 0.80 0.58CASH_DD_1.1B 24.3 37.5 0.85 0.61
CASH_DD_1.3B 18.0 23.6 0.83 0.59
CASH_DR_1.0A 12.0 18.3 0.45 0.37
CASH_DR_1.3A 15.2 - 0.80 0.65CASH_DR_1.5A 2.9 - 0.87 0.87CASH_DR_1.0B 26.6 33.0 0.48 0.38CASH_DR_1.3B 20.0 - 0.77 0.62CASH_DR_1.5B 10.1 - 0.78 0.63
Generally, the MCL increases as the Ca/(Si+Al) ratio decreases but the relationship is
not strong. Sun et al also observed a similar relationship between MCL and Ca/(Si+Al)
ratio [2].
y = -0.0012x + 0.6224y = -0.0261x + 0.8883
y = -0.014x + 0.8107
0.30
0.40
0.50
0.60
0.70
0.80
0.90
0 5 10 15 20 25 30 35
C a / ( S i + A l )
MCL
CASH_DD_#B
CASH_DR_#A
CASH_DR_#B
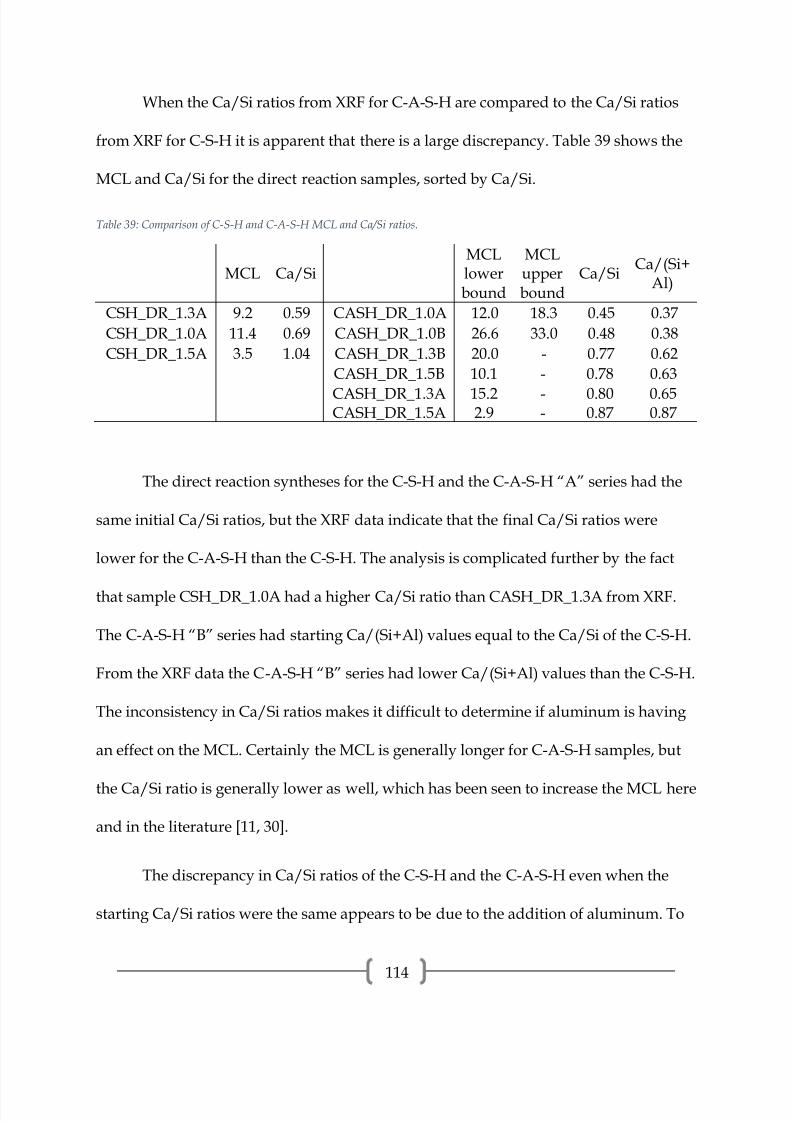
7/17/2019 William Hunnicutt
http://slidepdf.com/reader/full/william-hunnicutt 120/139
114
When the Ca/Si ratios from XRF for C-A-S-H are compared to the Ca/Si ratios
from XRF for C-S-H it is apparent that there is a large discrepancy. Table 39 shows the
MCL and Ca/Si for the direct reaction samples, sorted by Ca/Si.
Table 39: Comparison of C-S-H and C-A-S-H MCL and Ca/Si ratios.
MCL Ca/SiMCLlowerbound
MCLupperbound
Ca/SiCa/(Si+
Al)
CSH_DR_1.3A 9.2 0.59 CASH_DR_1.0A 12.0 18.3 0.45 0.37
CSH_DR_1.0A 11.4 0.69 CASH_DR_1.0B 26.6 33.0 0.48 0.38
CSH_DR_1.5A 3.5 1.04 CASH_DR_1.3B 20.0 - 0.77 0.62
CASH_DR_1.5B 10.1 - 0.78 0.63
CASH_DR_1.3A 15.2 - 0.80 0.65CASH_DR_1.5A 2.9 - 0.87 0.87
The direct reaction syntheses for the C-S-H and the C-A-S-H “A” series had the
same initial Ca/Si ratios, but the XRF data indicate that the final Ca/Si ratios were
lower for the C-A-S-H than the C-S-H. The analysis is complicated further by the fact
that sample CSH_DR_1.0A had a higher Ca/Si ratio than CASH_DR_1.3A from XRF.
The C-A-S-H “B” series had starting Ca/(Si+Al) values equal to the Ca/Si of the C-S-H.
From the XRF data the C-A-S-H “B” series had lower Ca/(Si+Al) values than the C-S-H.
The inconsistency in Ca/Si ratios makes it difficult to determine if aluminum is having
an effect on the MCL. Certainly the MCL is generally longer for C-A-S-H samples, but
the Ca/Si ratio is generally lower as well, which has been seen to increase the MCL here
and in the literature [11, 30].
The discrepancy in Ca/Si ratios of the C-S-H and the C-A-S-H even when the
starting Ca/Si ratios were the same appears to be due to the addition of aluminum. To
7/17/2019 William Hunnicutt
http://slidepdf.com/reader/full/william-hunnicutt 121/139
115
further explore this, CASH_DR_1.0C was synthesized by placing CSH_DR_1.0A in a
solution of aluminum nitrate backfilled with nitrogen and stirring for 24 hours. The
XRD pattern in Figure 16 of this sample shows only alumina/silica gel in the form of an
amorphous hump from 20° to 30° with no CaCO3 or C-S-H peaks. The 29Si spectrum in
Figure 45 also shows only alumina/silica gel in this sample. From these experiments, it
appears that the addition of aluminum to C-S-H is a dissolution/precipitation
phenomenon. If dissolution/precipitation does not occur, it is expected that the general
structure of C-S-H would be preserved with the addition of aluminum. The
dissolution/precipitation process may explain the discrepancy in the C-S-H and C-A-S-
H Ca/Si ratios from XRF in which the precipitate is tending towards alumina/silica gel.
5.3 DEPENDENCE OF AL UPTAKE ON CA/SI RATIO
5.3.1 QUANTITY OF AL UPTAKE
The quantity of aluminum taken into the C-S-H structure was determined using
three different methods. The area of the Al[4] peaks from 27Al NMR was normalized to
the mass of the sample and compared. An area function was developed to correlate data
taken using the 750NB and 750WB magnets by running a sample of reagent grade
NaAlO2 on each spectrometer and comparing the integrated areas, shown in Table 40.
The samples run on the 300UI spectrometer are compared to each other, but not to other
samples, shown in Table 41. The Al/Si ratio was calculated from XRF in molar percent.
The Al/Si ratio was also calculated from the 29Si spectra according to:

7/17/2019 William Hunnicutt
http://slidepdf.com/reader/full/william-hunnicutt 122/139
116
Al/Si =
12
(1) +
(1) − 12
((1) − (1))
(0) + (1) + (0) +
(0) + (1) +
(1) + (0) + (1) (6)
which is a modification of an equation proposed by Richardson [14] to include
aluminum in the pairing tetrahedron position and Q3 positions. The aluminum in the
pairing tetrahedron position was considered by adding Q1(1Al) and Q2B(1Al) in the
denominator and adding Q2B(1Al) in the numerator. The term −
(
(1) − (1) is in
the numerator to ensure that the aluminum in pairing positions in the middle of the
chain are not counted multiple times since aluminum in the pairing position is bonded
to silicon in the bridging position and silicon in the pairing position. The Q3 position is
considered by adding Q3(0Al) and Q3(1Al) to the denominator. Not all samples have
29Si NMR data and therefore Al/Si ratios from 29Si NMR are not available for these
samples.
Table 40: Quantity of aluminum uptake into C-A-S-H.
Normalized Al[4] - Al/Si - Al/Si -CASH_DR_1.0A 130.8 0.22 0.02
CASH_DR_1.3A 61.0 0.23 0.18
CASH_DR_1.5A 0.0 0.01 0.00
CASH_DR_1.0B 142.4 0.24 0.05
CASH_DR_1.3B 121.3 0.24 0.05
CASH_DR_1.5B 155.5 0.23 0.09
CASH_DR_0.9H 113.8 0.25 -
CASH_DR_1.1H 232.2 0.28 -
CASH_DR_1.3H 173.9 0.24 -
CASH_DR_1.5H 37.0 0.26 -CASH_DR_1.7H 50.7 0.27 0.05
CASH_DR_0.9L 45.4 0.14 -
CASH_DR_1.1L 15.1 - -
CASH_DR_1.3L 17.9 0.12 -
CASH_DR_1.5L 15.9 0.12 -
CASH_DR_1.7L 15.0 0.13 0.02

7/17/2019 William Hunnicutt
http://slidepdf.com/reader/full/william-hunnicutt 123/139
117
Table 41: Quantity of aluminum uptake in C-A-S-H.
Normalized Al[4] -27Al
Al/Si - XRF Al/Si - 29Si
CASH_DD_0.8B 147.1 0.40 -CASH_DD_0.9B 119.7 0.39 0.04
CASH_DD_1.1B 150.0 0.39 0.03
CASH_DD_1.3B 141.1 0.40 0.03
CASH_DD_1.5B 123.9 0.38 -
The normalized Al[4] content is not constant across samples and is discussed in
more detail below. The Al/Si ratios from XRF for the CASH_DR_#A and CASH_DR_#B
series are all similar (≈0.23) and close to the maximum observed by others [2, 5, 22, 23],
with the exception of CASH_DR_1.5A which contained no aluminum. Similarly, the
CASH_DR_#H series also had Al/Si ratios that were consistent and ≈0.26. The
CASH_DR_#L series had consistent Al/Si ratios of approximately half that of the
CASH_DR_#H series. The concentration of the aluminum nitrate solution used to add
aluminum to the C-S-H in the CASH_DR_#L series was half that of the CASH_DR_#H
series. The Al/Si ratio is dependent on the concentration of aluminum in the solution
when adding aluminum to already formed C-S-H.
The CASH_DD_#B series also have similar Al/Si ratio from XRF. However, they
are≈
0.39 which is well above the maximum Al/Si ratios observed in the literature. The
29Si spectra for CASH_DD_0.9B, CASH_DD_1.1B, and CASH_DD_1.3B all have Q3 and
Q4 peaks associated with alumina/silica gel. Since aluminum appears to be occurring in
the alumina/silica gel, then the Al/Si ratio given by XRF is not the Al/Si ratio of the C-

7/17/2019 William Hunnicutt
http://slidepdf.com/reader/full/william-hunnicutt 124/139
118
A-S-H, which aids in the explanation of the discrepancy in Al/Si ratios from the XRF
and 29Si data.
The Al/Si ratios from29
Si are not consistent with the Al/Si ratios from XRF. One
reason for this is that the 29Si spectra only detect aluminum which is bonded to silicon
which, in C-A-S-H, is tetrahedral. The 27Al spectra for these samples also include Al[5]
and Al[6] which are not detected by 29Si NMR, and are not included in the assumptions
for the equations for calculating Al/Si from the 29Si NMR spectra. Due to these factors,
it is reasonable that the Al/Si ratios from the 29Si calculation are lower than the Al/Si
ratios from the XRF data. However, this large of a discrepancy is still surprisingly large.
The quantities of Al[4] from 27Al NMR of the samples synthesized by direct
reaction have a weak positive correlation to the MCL and a weak negative correlation to
the Ca/Si ratio, as seen in Figure 79 and Figure 80.
Figure 79: Plot of CASH_DR_#A and CASH_DR_#B Al[4] content against MCL.
y = 4.2825x + 39.988
R² = 0.3481
0.0
20.0
40.0
60.0
80.0
100.0
120.0
140.0
160.0
180.0
0.0 5.0 10.0 15.0 20.0 25.0 30.0
N o r m a l i z e d A l [ 4 ] c o n t e n t
MCL

7/17/2019 William Hunnicutt
http://slidepdf.com/reader/full/william-hunnicutt 125/139
119
Figure 80: Plot of CASH_DR series Al[4] content against Ca/Si ratio.
These weak correlations suggest that the Ca/Si ratio or MCL impact the quantity of
Al[4] incorporated. Since the Ca/Si ratio is correlated to the MCL, it is expected that the
Al[4] content would correlate with both. However, the causation of the increase in Al[4]
content is not apparent. The samples synthesized by double decomposition all have
similar Ca/Si ratios from XRF and similar normalized Al[4] contents. The limited range
of Ca/Si ratios in these samples makes it difficult to draw conclusions from these
correlations. Faucon et al showed a similar lack of dependence of Al/Si ratio on
Ca/(Si+Al) ratio to this work when the Ca/(Si+Al) ratio was less than 1.00, as is the case
in our samples. At Ca/(Si+Al) greater than 1.00, the Al/Si ratio decreased with
Ca/(Si+Al) ratio [22].
y = -252.02x + 257.47
R² = 0.3988
0.0
50.0
100.0
150.0
200.0
250.0
0.00 0.20 0.40 0.60 0.80 1.00 1.20
N o r m a l i z e d A l [ 4 ] c o n t e n t
Ca/Si
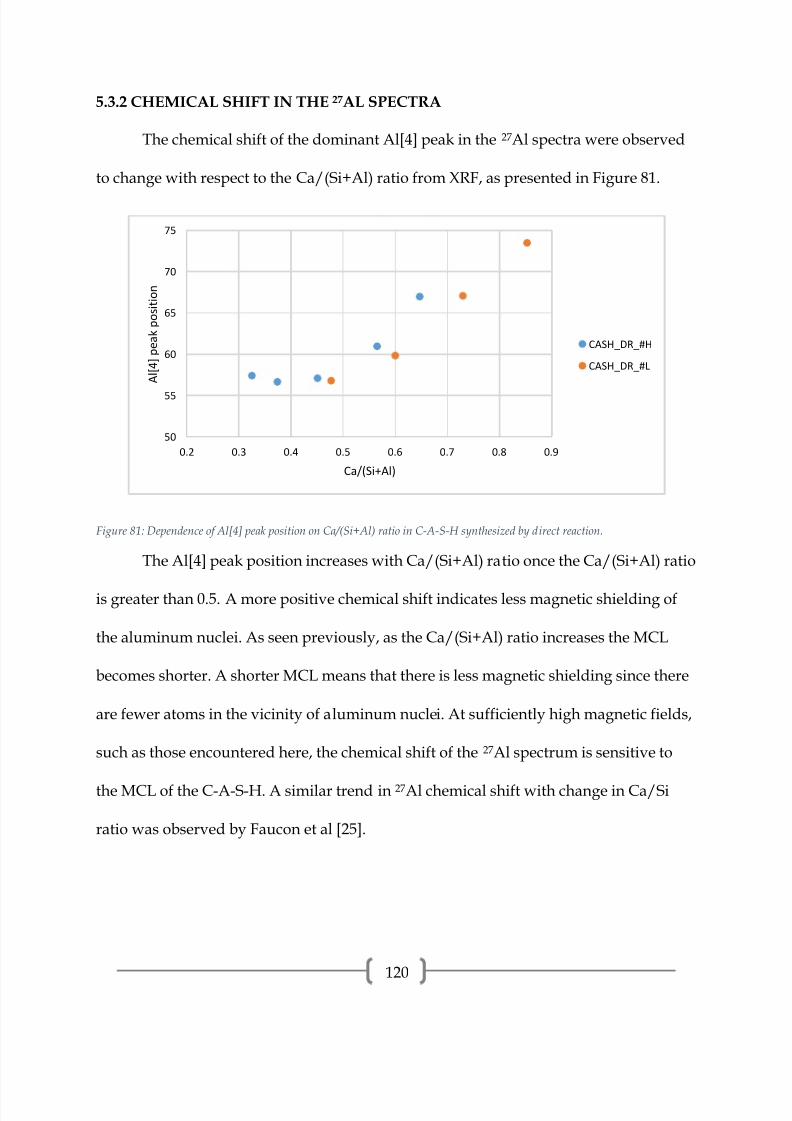
7/17/2019 William Hunnicutt
http://slidepdf.com/reader/full/william-hunnicutt 126/139
120
5.3.2 CHEMICAL SHIFT IN THE 27AL SPECTRA
The chemical shift of the dominant Al[4] peak in the 27Al spectra were observed
to change with respect to the Ca/(Si+Al) ratio from XRF, as presented in Figure 81.
Figure 81: Dependence of Al[4] peak position on Ca/(Si+Al) ratio in C-A-S-H synthesized by direct reaction.
The Al[4] peak position increases with Ca/(Si+Al) ratio once the Ca/(Si+Al) ratio
is greater than 0.5. A more positive chemical shift indicates less magnetic shielding of
the aluminum nuclei. As seen previously, as the Ca/(Si+Al) ratio increases the MCL
becomes shorter. A shorter MCL means that there is less magnetic shielding since there
are fewer atoms in the vicinity of aluminum nuclei. At sufficiently high magnetic fields,
such as those encountered here, the chemical shift of the 27Al spectrum is sensitive to
the MCL of the C-A-S-H. A similar trend in 27Al chemical shift with change in Ca/Si
ratio was observed by Faucon et al [25].
50
55
60
65
70
75
0.2 0.3 0.4 0.5 0.6 0.7 0.8 0.9
A l [ 4 ] p e a k p o s i t i o n
Ca/(Si+Al)
CASH_DR_#H
CASH_DR_#L

7/17/2019 William Hunnicutt
http://slidepdf.com/reader/full/william-hunnicutt 127/139
121
5.4 CARBONATION
The XRD patterns show that peaks associated with CaCO3 were more prevalent
in the C-S-H samples synthesized by double decomposition. None of the direct reaction
syntheses indicated CaCO3 polymorphs, while all but one, CSH_DD_1.3A, of the
double decomposition syntheses had peaks associated with CaCO3. Additionally, an
amorphous hump associated with silica gel is seen in three of the double decomposition
syntheses (CSH_DD_1.0A, CSH_DD_1.3B, and CSH_DD_1.1B) indicating a substantial
change to the C-S-H structure caused by carbonation.
From Figure 77 it is apparent that the trend for double decomposition and direct
reaction syntheses are different. The slopes of the linear regressions for the samples
synthesized by double decomposition are similar, while the slope of the linear
regression for the samples synthesized by direct reaction is much steeper. Additionally,
the MCL is generally higher for a given Ca/Si when synthesized by double
decomposition. This is thought to be due to the modification of the C-S-H structure
from carbonation, as observed from XRD.
Similarly, in Figure 78 the slopes of the linear regressions are different for double
decomposition and direct reaction synthesis methods in C-A-S-H. The slope of the
double decomposition linear regression is significantly less than that of the direct
reaction linear regressions, indicating a change in behavior with synthesis method. All
three of the double decomposition samples were carbonated, as observed by XRD. Of
the direct reaction samples, only CASH_DR_1.0A, CASH_DR_1.0B, and

7/17/2019 William Hunnicutt
http://slidepdf.com/reader/full/william-hunnicutt 128/139
122
CASH_DR_1.5B contained any CaCO3 peaks and they were less well defined. Again,
the MCL is generally higher for a given Ca/(Si+Al) when synthesized by double
decomposition. The change in MCL dependence on Ca/(Si+Al) ratio in the double
decomposition samples is thought to be due to the modification of the C-S-H structure
from carbonation, as observed from XRD.
When C-S-H was treated with 0.1M solutions of NaOH, KOH, NaNO3, and
water, carbonation was detected by XRD. The most intense carbonate peaks were in
samples that were treated with NaOH and KOH. Table 34 presents the MCL and %Q3
for each treatment. An increase in MCL and %Q3 are both results of the modification of
C-S-H by carbonation. The data for the original C-S-H before treatment are also
included.
Table 42: 29Si NMR properties related to carbonation of treated samples.
MCL %Q3
NaOH 8.3 23.6KOH 25.7 18.7
NaNO3 22.2 21.6
Original 9.2 6.1
The sample treated with KOH had the largest increase in MCL while the sample
treated with NaOH had the largest increase in %Q3. Interestingly, the MCL for the
NaOH treatment was lower than that of the original. The mass loss of carbonate,
obtained from TGA, was 12.7% for NaOH, 12.9% for KOH, 6.7% for NaNO3, and 10.1%
for H2O. The XRD and TGA results indicate that the samples treated with NaOH and
KOH were more carbonated than those treated with NaNO3 and H2O. The 29Si spectra

7/17/2019 William Hunnicutt
http://slidepdf.com/reader/full/william-hunnicutt 129/139
123
are inconclusive in terms of the amount of carbonation that has occurred. From the XRD
and TGA results, the pH, not sodium content, is affecting the carbonation rate of the C-
S-H. When the reaction for the formation of CaCO3 in water is examined, one of the
reasons for this increase in carbonation is apparent.
CO2 + 2OH- CO32- + H2O
CO32- + H2O + Ca2+ CaCO3 + H2O
In a high pH solution there are more hydroxide ions present, which is on the reactant
side for the reaction. Therefore, when the pH is high the reaction will proceed more
quickly. Additionally, the solubility of CaCO3 is affected by pH. Since the anion of
CaCO3 is the salt of a weak acid, CO32- becomes protonated when acid is added to the
solution and the concentration of carbonate ion is reduced. Le Chatelier’s principle then
dictates that some CaCO3 will dissolve to maintain equilibrium. Thus, as pH is
decreased the solubility of CaCO3 increases. Therefore, at high pH the solubility of
CaCO3 is low and precipitation occurs more readily.
Further evidence of the effect of pH on carbonation of C-S-H can be seen from
the carbonation of C-S-H samples synthesized by double decomposition and direct
reaction. The pH of the supernatant solution of the C-S-H syntheses are presented in
Table 43.

7/17/2019 William Hunnicutt
http://slidepdf.com/reader/full/william-hunnicutt 130/139
124
Table 43: pH values for C-S-H syntheses.
pH
CSH_DD_1.0A 12.55CSH_DD_1.3A 11.75
CSH_DD_1.5A 11.48CSH_DR_1.0A 10.6CSH_DR_1.3A 10.1
CSH_DR_1.5A 12.51
Generally, the C-S-H synthesized by double decomposition had a higher pH than
C-S-H synthesized by direct reaction. The C-S-H synthesized by double decomposition
showed more CaCO3 polymorphs as indicated by XRD and higher MCL and Q3
quantities as indicated by 29Si NMR.

7/17/2019 William Hunnicutt
http://slidepdf.com/reader/full/william-hunnicutt 131/139
125
6. CONCLUSIONS
The primary objectives of this thesis were to synthesize C-S-H and C-A-S-H and
characterize the structures. Changes were observed with varying Ca/Si ratios and
aluminum content. Additionally, the effect of carbonation on synthesized C-S-H was
examined. The use of 29Si and 27Al NMR provided critical information on the effect of
varying Ca/Si ratio, aluminum content, and synthesis method.
The following conclusions can be drawn from this work:
The MCL of C-S-H increases with decreasing Ca/Si.
The dependence of MCL on Ca/Si ratio changes when different synthesis
methods are used.
The crystal structure of C-S-H does not change with Ca/Si ratio.
Incorporation of Al in C-S-H is a dissolution/precipitation procedure.
Al does not enter the octahedral CaO layer,
Al[5] and Al[6] occur in the interlayer and/or the alumina/silica gel.
The crystal structure does not change when aluminum is added to C-S-H.
Al[4] does occur in the pairing tetrahedron position, but the bridging tetrahedron
position is favored.
A formula for MCL from 29Si deconvolutions including Al[4] in the pairing
tetrahedron position and Q3 positions was derived.
A formula for Al/Si from 29Si deconvolutions including Al[4] in the pairing
tetrahedron position and Q3 positions was derived.
7/17/2019 William Hunnicutt
http://slidepdf.com/reader/full/william-hunnicutt 132/139
126
The Al/Si ratio of the C-A-S-H is dependent on the concentration of aluminum in
the solution when adding aluminum to already formed C-S-H.
There is a weak negative correlation between the Ca/Si ratio and normalized
Al[4] content.
There is a weak positive correlation between the MCL and normalized Al[4]
content.
The chemical shift of the 27Al spectrum is sensitive to the MCL or Ca/Si ratio of
the C-A-S-H.
The rate of carbonation of C-S-H is increased with higher pH.
Double decomposition has longer MCL for a given Ca/Si, partially due to
increased carbonation sensitivity.

7/17/2019 William Hunnicutt
http://slidepdf.com/reader/full/william-hunnicutt 133/139
127
7. REFERENCES
1. J.S. Dolado, M. Griebe, and J. Hamaekers, “A Molecular Dynamic Study of
Cementitious Calcium Silicate Hydrate (C-S-H) Gels,” Journal of the American
Ceramics Society 90 (2007): 3938-3942.
2. G.K. Sun, J.F. Young, and R.J. Kirkpatrick, “The role of Al in C-S-H: NMR, XRD, and
compositional results for precipitated samples,” Cement and Concrete Research 36
(2006): 18-29.
3. G.L. Kalousek , “Crystal chemistry of hydrous calcium silicates: I. Substitution of
aluminum in lattice of tobermorite,” Journal of the American Ceramics Society 40
(1957): 74-80.
4. S. Kwan, J. LaRosa, and M.W. Grutzeck, “Structures and phase relations of aluminum-
substituted calcium silicate hydrate,” Journal of the American Ceramics Society, 79
(1996): 967-971.
5. P. Faucon, T. Charpentier, A. Nonat, and J.C. Petit, “Triple-quantum two-dimensional
27Al magic angle nuclear magnetic resonance study of the aluminum incorporation in
calcium silicate hydrates,” Journal of the American Chemical Society 120 (1998): 12075-
12082.

7/17/2019 William Hunnicutt
http://slidepdf.com/reader/full/william-hunnicutt 134/139
128
6. M.D. Andersen, H.J. Jakobsen, and J. Skibsted, “Incorporation of aluminum in the
calcium silicate hydrate (C-S-H) of hydrated Portland cements: A high-field 27Al and 29Si
MAS NMR investigation,” Inorganic Chemistry 42 (2003): 2280-2287.
7. K.J.D MacKenzie and M.E. Smith, Multinuclear Solid-State NMR of Inorganic
Materials (Oxford: Pergamon, 2002), 50-74.
8. G. Engelhardt, “Silicon-29 NMR of Solid Silicates,” eMagRes, online (John Wiley
& Sons, Ltd., 2007)
9. K.J.D MacKenzie and M.E. Smith, Multinuclear Solid-State NMR of Inorganic
Materials (Oxford: Pergamon, 2002), 271-273.
10. I.G. Richardson, “The calcium silicate hydrates,” Cement and Concrete Research 38
(2008): 137-158.
11. X.D. Cong and R.J. Kirkpatrick, “29Si MAS NMR study of the structure of calcium
silicate hydrate,” Advanced Cement Based Materials 3 (1996): 144-156.
12. I.G. Richardson and G.W. Groves, “Models for the composition and structure of calcium
silicate hydrate (C-S-H) gel in hardened tricalcium silicate pastes,” Cement and Concrete
Research 22 (1992): 1001-1010.
13. H.F.W Taylor, “Proposed structure for calcium silicate hydrate gel,” Journal of the
American Ceramics Society 69 (1986): 464-467.

7/17/2019 William Hunnicutt
http://slidepdf.com/reader/full/william-hunnicutt 135/139
129
14. I.G. Richardson, “The nature of C-S-H in hardened cements,” Cement and Concrete
Research 29 (1999): 1131-1147.
15.
H.F.W Taylor and J.W. Howison, “Relationships between calcium silicates and
clay minerals,” Clay Minerals 3 (1956): 98-111.
16. H.G. Kurczyk and H.E. Schwiete, “Concerning the hydration productrs of C3S
and β-C2S,” Proceedings of the 4th International Symposium on the Chemistry of
Cement, 1 (1962): 349-358.
17. I.G. Richardson and G.W. Groves, “The incorporation of minor and trace
elements into calcium silicate hydrate (C-S-H) gel in hardened cement pastes,”
Cement and Concrete Research 23 (1993): 131-138.
18. I.G. Richardson, “Tobermorite/jennite- and tobermorite/calcium hydroxide-
based models for the structure of C-S-H: applicability to hardened pastes of
tricalcium silicate, β-dicalcium silicate, Portland cement, and blends of Portland
cement with blast-furnace slag, metakaolin, or silica fume,” Cement and Concrete
Research 34 (2004): 1733-1777.
19.
A. Nonat and X. Lecoq, “The structure, stoichiometry and properties of C-S-H
prepared by C3S hydration under controlled conditions,” in Nuclear Magnetic
Resonance Spectroscopy of Cement-Based Materials eds. P. Colombet, A.R. Grimmer,
H. Zanni, and P. Sozzani, 197-207. Berlin: Springer, 1998.
7/17/2019 William Hunnicutt
http://slidepdf.com/reader/full/william-hunnicutt 136/139
130
20. J.J. Chen, J.J. Thomas, H.F.W. Taylor, and H.M. Jennings, “Solubility and structure of
calcium silicate hydrate,” Cement and Concrete Research 34 (2004): 1499-1519.
21.
S. Komarneni, R. Roy, D. Roy, C. Fyfe, G. Kennedy, A. Bothner-By, J. Dadok, and A.
Chesnick, “27Al and 29Si magic angle spinning nuclear magnetic resonance spectroscopy
22. P. Faucon, J.C. Petit, T. Charpentier, J.F. Jacquinot, and F. Adenot, “Silicon substitution
for aluminum in calcium silicate hydrates,” Journal of the American Ceramics Society 82
(1999): 1307-1312.
23. P. Faucon, T. Charpentier, D. Bertrandie, A. Nonat, J. Virlet, and J.C. Petit,
“Characterization of calcium aluminate hydrates and related hydrates of cement
pastes by 27Al MQ-MAS NMR,” Inorganic Chemistry 37 (1998): 3726-3733.
24. M.D. Andersen, H.J. Jakobsen, and J. Skibsted, “Characterization of white Portland
cement hydration and the C-S-H structure in the presence of sodium aluminate by 27Al
and 29Si MAS NMR spectroscopy,” Cement and Concrete Research 34 (2004): 857-868.
25. P. Faucon, A. Delagrave, J.C. Petit, C. Richet, J.M. Marchand, and H. Zanni,
“Aluminum incorporation in calcium silicate hydrate (C-S-H) depending on their
Ca/Si ratio,” Journal of Physical Chemistry B 103 (1999): 7796-7802.
26. J. Schneider, M.A. Cincotto, and H. Panepucci, “29Si and 27Al high-resolution
NMR characterization of calcium silicate hydrate phases in activated blast-
furnace slag pastes,” Cement and Concrete Research 31 (2001): 993-1001.

7/17/2019 William Hunnicutt
http://slidepdf.com/reader/full/william-hunnicutt 137/139
131
27. P. Faucon, J.M. Delaye, J. Virlet, J.F. Jacquinot, and F. Adenot, “Study of the
structural properties of the C-S-H(I) by molecular dynamics simulation,” Cement
and Concrete Research 27 (1997): 1581-1590.
28. H. Manzano, J.S. Dolado, and A. Ayuela, “Aluminum incorporation to dreierketten
silicate chains,” Journal of Physical Chemistry B, 113 (2009): 2832-2839.
29. H. Manzano, J.S. Dolado, M. Griebel, and J. Hamaeker s, “A molecular dynamics study
of the aluminosilicate chain structure in Al-rich calcium silicate hydrated (C-S-H) gels,”
Physica Status Solidi A 205 (2008): 1324-1329.
30. M. Grutzeck, A. Benesi, and B. Fanning, “Silicon-29 magic angle spinning nuclear
magnetic resonance study of calcium silicate hydrates,” Journal of the American
Ceramic Society 72 (1989): 665-668.
31. I. Garcia-Lodeiro, A. Fernandez-Jimenez, I. Sobrados, J. Sanz, and A. Palomo, “C-S-H
gels: Interpretation of 29Si MAS- NMR spectra,” Journal of the American Ceramics
Society 95 (2012): 1-7.
32. F. Puertas, M. Palacios, H. Manzano, J.S. Dolado, A. Rico, and J. Rodriguez, “A
model for the C-A-S-H gel formed in alkali-activated slag cements,” Journal of the
European Ceramic Society 31 (2011): 2043-2056.
7/17/2019 William Hunnicutt
http://slidepdf.com/reader/full/william-hunnicutt 138/139
132
33. I. Garcia-Lodeiro, A. Fernandez-Jimenez, D.E. Macphee, I. Sobrados, J. Sanz, and
A. Palomo, “Stability of synthetic calcium silicate hydrate gels in presence of
alkalis, aluminum, and soluble silica,” Transportation Research Record: Journal of
the Transportation Research Board 2142 (2010): 52-57.
34. I. Garcia Lodeiro, A. Fernandez-Jimenez, A. Palomo, and D.E. Macphee, “Effect on
fresh C-S-H gels of the simultaneous addition of alkali and aluminum,” Cement and
Concrete Research 40 (2010): 27-32.
35. L. Black, C. Breen, J. Yarwood, K. Garbev, P. Stemmermann, and B. Gasharova,
“Structural features of C-S-H(I) and its carbonation in air – A Raman
spectroscopic study. Part II: Carbonated phases,” Journal of the American Ceramics
Society 90 (2007): 908-917.
36.
H.F.W Taylor, Cement Chemistry (London: Thomas Telford, 1997), 114-116.
37. G.W. Groves, A. Brough, I.G. Richardson, and C.M. Dobson, “Progressive
changes in the structure of hardened C3S cement pastes due to carbonation,”
Journal of the American Ceramics Society 74 (1991): 2891-2896.
38.
I. Garcia Lodeiro, D.E. Macphee, A. Palomo, and A. Fernandez- Jimenez, “Effect
of alkalis on fresh C-S-H gels. FTIR analysis,” Cement and Concrete Research 39
(2009): 147-153.
7/17/2019 William Hunnicutt
http://slidepdf.com/reader/full/william-hunnicutt 139/139
39. R. Alizadeh, J.J. Beaudoin, and L. Raki, “Viscoelastic nature of calcium silicate
hydrate,” Cement & Concrete Composites 32 (2010): 369-376.
40.
K.J.D MacKenzie and M.E. Smith, Multinuclear Solid-State NMR of Inorganic
Materials (Oxford: Pergamon, 2002), 146.
41. K.J.D MacKenzie and M.E. Smith, Multinuclear Solid-State NMR of Inorganic
Materials (Oxford: Pergamon, 2002), 207.
42. S. Komarneni, R. Roy, C.A. Fyfe, G.J. Kennedy, and H. Strobl, “Solid-state 27Al
and 29Si magic-angle spinning NMR of aluminosilicate gels,”Communications of
the American Ceramic Society 69 (1986): 42-44.