william w. thompson, phd immunization safety office office of the chief science officer centers for...
TRANSCRIPT

William W. Thompson, PhDImmunization Safety Office
Office of the Chief Science OfficerCenters for Disease Control and Prevention
Impact of Seasonal Influenza
in the US

Collaborators
• David Shay, CDC Influenza Branch
• Eric Weintraub, CDC, OCSO/ISO
• Lynnette Brammer, CDC Influenza Branch
• Nancy Cox, CDC Influenza Branch
• Joe Bresee, CDC Influenza Branch
• Keiji Fukuda, WHO

Impact of Seasonal Influenza in the US
• Describe variation in deaths in US– Seasonal Variation
– Age Variation
• Describe alternative models for estimating influenza-associated morbidity and mortality
• Compare alternative model estimates
• Review estimates of influenza impact– Deaths
– Hospitalizations
– Other morbidity

Seasonal Variation in Deaths
• Currently, there are approximately 2.4 million deaths in the United States annually– 65,000 Underlying Pneumonia and Influenza deaths
• No direct measure of impact of influenza
• Strong seasonal component in US deaths– Peaks typically occur in December and January
– Peaks tend to be associated with increases in influenza activity
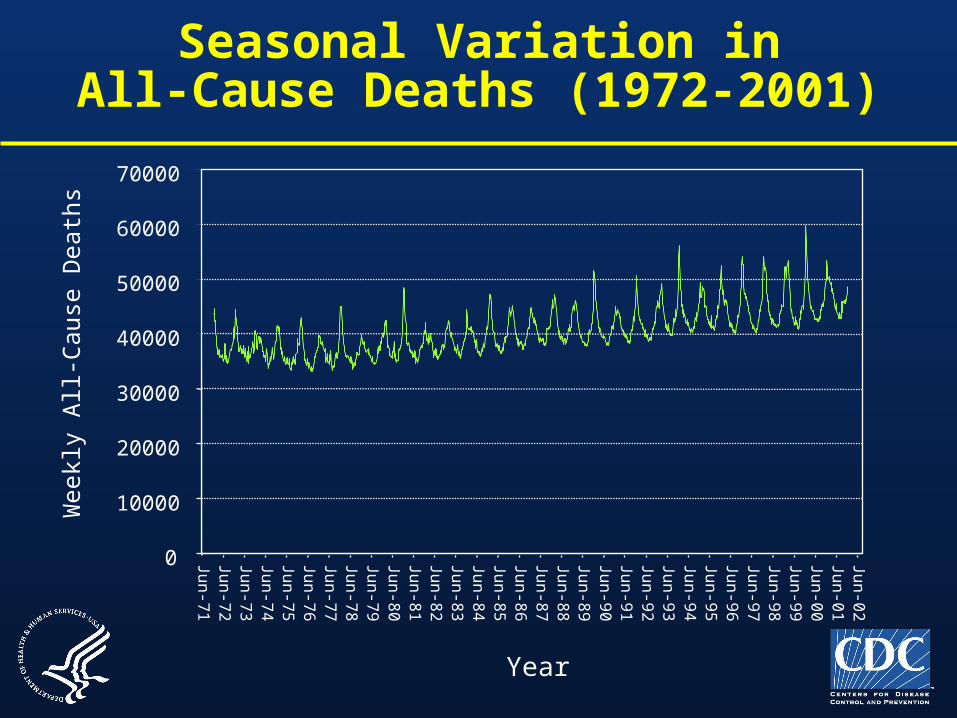
Seasonal Variation inAll-Cause Deaths (1972-2001)
0
10000
20000
30000
40000
50000
60000
70000
Jun
-71
Jun
-72
Jun
-73
Jun
-74
Jun
-75
Jun
-76
Jun
-77
Jun
-78
Jun
-79
Jun
-80
Jun
-81
Jun
-82
Jun
-83
Jun
-84
Jun
-85
Jun
-86
Jun
-87
Jun
-88
Jun
-89
Jun
-90
Jun
-91
Jun
-92
Jun
-93
Jun
-94
Jun
-95
Jun
-96
Jun
-97
Jun
-98
Jun
-99
Jun
-00
Jun
-01
Jun
-02
Year
Wee
kly
All-
Cau
se D
eath
s
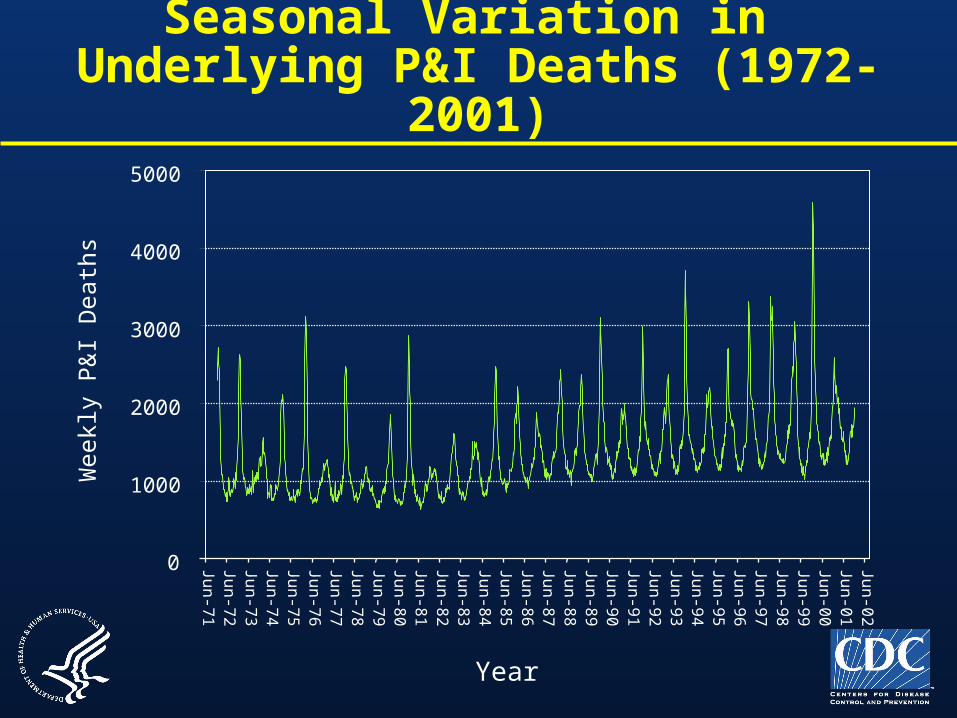
Seasonal Variation in Underlying P&I Deaths (1972-2001)
0
1000
2000
3000
4000
5000
Jun
-71
Jun
-72
Jun
-73
Jun
-74
Jun
-75
Jun
-76
Jun
-77
Jun
-78
Jun
-79
Jun
-80
Jun
-81
Jun
-82
Jun
-83
Jun
-84
Jun
-85
Jun
-86
Jun
-87
Jun
-88
Jun
-89
Jun
-90
Jun
-91
Jun
-92
Jun
-93
Jun
-94
Jun
-95
Jun
-96
Jun
-97
Jun
-98
Jun
-99
Jun
-00
Jun
-01
Jun
-02
Year
Wee
kly
P&
I D
eath
s

Population Growth in Urban Areas of the US 1970-2000
0
25
50
75
100
125
150
175
200
225
250
1970 1980 1990 2000
Year
Mill
ions

Population Growth in Numbersof Elderly in the US 1970-2000
Mill
ions
0.0
2.0
4.0
6.0
8.0
10.0
12.0
14.0
16.0
18.0
20.0
65-74 75-84 85+
Age Group1970 2000

Age Variation in Numbers of Deaths in the US 1970-2003
-
100,000
200,000
300,000
400,000
500,000
600,000
700,000
800,000
0-4 Yrs
5-14 Yrs
15-24 Yrs
25-34 Yrs
35-44 Yrs
45-54 Yrs
55-64 Yrs
65-74 Yrs
75-84 Yrs
85+ Yrs
Age Group
Dea
ths
1970 2003

RR of All-Cause Death Versus Underlying P&I Death (NCHS 2000)
1970 2003
59
83
147
93
58 62 5743
2413
0
20
40
60
80
100
120
140
160
0-4 years
5-14 years
15-24 years
25-34 years
35-44 years
45-54 years
55-64 years
65-74 years
75-84 years
85+ years
Age Group
RR
of
Dea
th d
ue
to
All
-Cau
se v
ersu
s P
&I

Alternative Models for EstimatingImpact of Influenza in US
• Simonsen et al. (1997)– Linear Regression Model
– Modeled National Center for Health Statistics (NCHS) weekly death data from 1972-1992
• Outcomes– Underlying P&I Deaths (Most specific)
– All-Cause Deaths (Least specific, most sensitive)
• Model
Yt = a + b*t +c*t2 + d*cos (2 t /52) + f*sin(2 t /52) + et

Simonsen et al. 1997 Model
0
500
1000
1500
2000
2500
3000
3500
4000
Jul-89 Jul-90 Jul-91 Jul-92 Jul-93 Jul-94 Jul-95
P&
I D
eath
s

Alternative Models for EstimatingImpact of Influenza in US
• Thompson et al. (2003)– Poisson Regression Model– Modeled National Center for Health Statistics (NCHS)
weekly death data from 1976-2000– Incorporated WHO Influenza Surveillance Data
• Outcomes– Underlying P&I Deaths (Most specific)– Underlying Respiratory & Circulatory Deaths– All-Cause Deaths (Least specific)
• Model
Yt = exp (a + b*t +c*t2 + d*cos (2 t /52) + f*sin(2 t /52) + g * A(H1N1)% + h * A(H3N2)% + i * B%)

Circulation of A(H3N2) Viruses and Underlying P&I Deaths
Year
P&
I D
eath
s P
er 1
00,0
00
A(H
3N2)
% P
ositi
ve
P&I Death Rate A(H3N2)%
0
10
20
30
40
50
60
70
80
90
100
110
19901991
19921993
19941995
19961997
1998
0%
10%
20%
30%
40%
50%
60%

Alternative Models for EstimatingImpact of Influenza in US
• Barker & Mullooly (1980;1982)
• Two Types of Baseline Rates
– Peri-Season Baseline Rate
• October through May when influenza is not circulating above 10%
– Summer Season Baseline
• June through September
• Excess Rate = (Flu Rate) – (Non Flu Baseline Rate)

Seasonal Variation in Underlying P&I Deaths
SummerBaseline
SummerBaseline
WinterBaseline
InfluenzaPeriod
InfluenzaPeriod
0
1000
2000
3000
4000
Jul-89
Sep-89
Nov-89
Jan-90
Mar-90
May-90
Jul-90
Sep-90
Nov-90
Jan-91
Mar-91
May-91
Jul-91
Sep-91
Nov-91
Jan-92
Mar-92
May-92
Jul-92

Influenza-AssociatedAll-Cause Deaths by Model
in the US (1976-2000)
Alternative Models
Ann
ual I
nflu
enza
-Ass
ocia
ted
Dea
ths
in U
S
31,467 29,473
43,958
73,635
35,463
0
10,000
20,000
30,000
40,000
50,000
60,000
70,000
80,000
Simonsen 97 Simonsen 05 Peri Summer Poisson
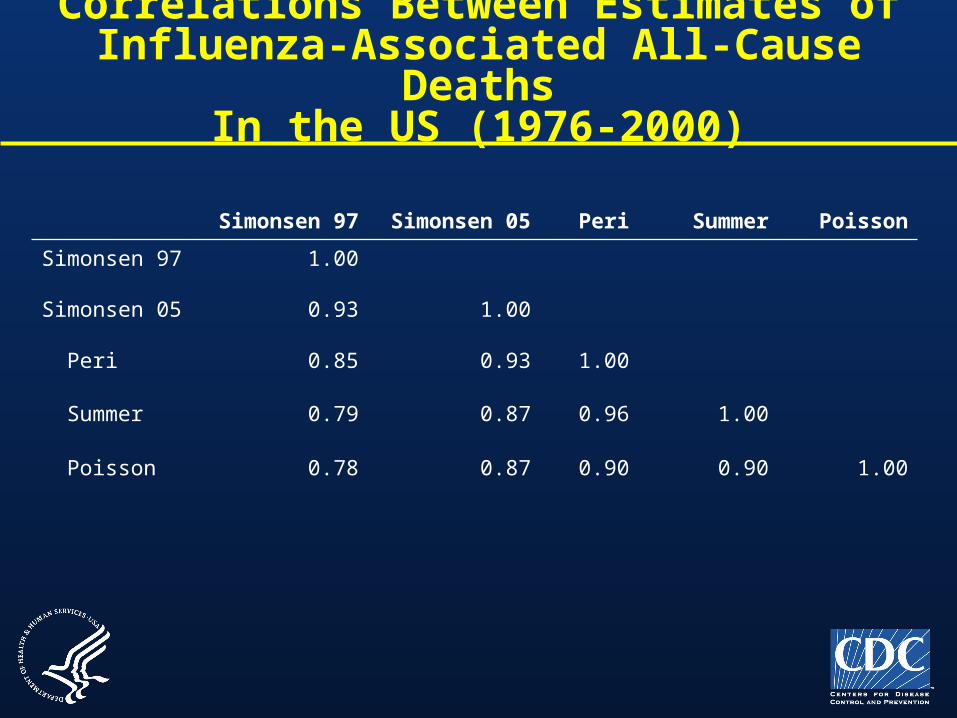
Correlations Between Estimates of Influenza-Associated All-Cause Deaths
In the US (1976-2000)
Simonsen 97 Simonsen 05 Peri Summer Poisson
Simonsen 97 1.00
Simonsen 05 0.93 1.00
Peri 0.85 0.93 1.00
Summer 0.79 0.87 0.96 1.00
Poisson 0.78 0.87 0.90 0.90 1.00

Correlation Between Estimates forSimonsen 2005 and Peri-Season Models
y = 1.3305x + 4744.5R2 = 0.8729
0
20000
40000
60000
80000
100000
120000
0 10000 20000 30000 40000 50000 60000 70000
Simonsen 2005 Estimates
Per
i Sea
son
Est
imat
es

Influenza-AssociatedUnderlying R&C Death Rates
by Age For Peri-Season Model
2.4 0.4 0.4 8.7 26.046.8
85.5
165.9
445.3
0
100
200
300
400
500
<1 1 - 45 - 49
50 - 64
65 - 69
70 - 74
75 - 79
80 - 84
>= 85
Age Group
Dea
ths
Per
100
,000
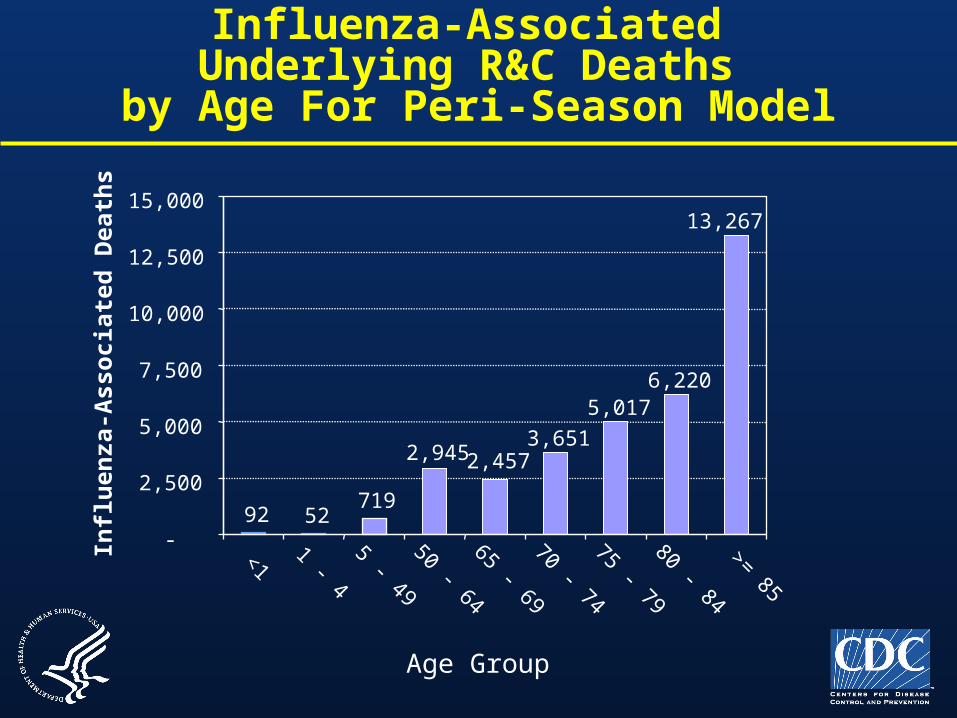
Influenza-Associated Underlying R&C Deaths
by Age For Peri-Season Model
Age Group
Infl
uen
za-A
sso
ciat
ed D
eath
s
92 52719
2,945 2,4573,651
5,0176,220
13,267
-
2,500
5,000
7,500
10,000
12,500
15,000
<1 1 - 45 - 49
50 - 64
65 - 69
70 - 74
75 - 79
80 - 84
>= 85

Surveillance of Influenza-Associated Deaths Among Children in the US
• 2003/2004 influenza season was severe compared to other recent seasons, especially among children
• CDC implemented surveillance of childhood deaths associated with influenza
• Reviewed case reports, medical records, autopsy reports

Surveillance of Influenza-Associated Deaths Among Children in the US
• Results– 153 deaths among children aged < 18 years
– 96 deaths among children aged < 5 years
– 29% of the children died within 3 days of onset of the illness
– 47% of the children had previously been healthy
• CDC made influenza deaths among children a national reportable condition in October 2004

Influenza-AssociatedHospitalizations
• Thompson et al (2004)
• National Hospital Discharge Survey
• Examined data from 1979-2001
• Incorporated WHO Influenza Surveillance data
• Outcomes – Primary P&I (Most Specific)
– Any Listed P&I
– Primary R&C
– Any-Listed R&C (Least Specific)
• ModelYt = exp (a + b*t +c*t2 + d*cos (2 t /12) + f*sin(2 t /12) +
g * A(H1N1)% + h * A(H3N2)% + i * B%)

Influenza-Associated Primary R&C Hospitalization Rates
By Age (1979-2001)
0
200
400
600
800
1000
1200
1400
< 5 Yrs
5-49 Yrs
50-64 Yrs
65-69 Yrs
70-74 Yrs
75-79 Yrs
80-84 Yrs
85+ Yrs
Age Group
Influ
enza
-Ass
ocia
ted
Prim
ary
R&
CH
ospi
taliz
atio
ns P
er 1
00,0
00

Influenza-Associated Primary R&C Hospitalizations
By Age (1979-2001)
Age Group
Influ
enza
-Ass
ocia
ted
Prim
ary
R&
CH
ospi
taliz
atio
ns
20,031
34,867
29,447
18,301
26,501 27,51628,578
40,813
-
10,000
20,000
30,000
40,000
50,000
< 5 Yrs
5-49 Yrs
50-64 Yrs
65-69 Yrs
70-74 Yrs
75-79 Yrs
80-84 Yrs
85+ Yrs

Influenza-Associated HospitalizationsAmong Children Aged < 5 Years
By Study
1.20.9
1.41.1
0.6
2.6
0.0
1.0
2.0
3.0
4.0
5.0
6.0
Barker(1982)
Neuzil(2000)
Izurieta(2000)
Neuzil(2002)
Thompson(2004)
Iwane(2004)
Study
Hos
pita
lizat
ions
Per
1,0
00P
erso
n Y
ears

Excess P&I Hospitalization RatesBy Risk Status
Barker & Mullooly (1980, 1982)
0
100
200
300
400
500
600
700
800
0 - 4 5-14 15-44 45-64 65+
Age (Years)
Exc
ess
P&
I H
ospi
taliz
atio
ns
Per
100
,000
Per
sons
Low Risk High Risk

Other Influenza-Associated Morbidity
• Nichol et al (1999) LAIV Trial Aged 18-64– Severe febrile illness
– Work days missed
– Doctors visits
– Antibiotic use
• Bridges at al (2000) TIV Trial Aged 18-64– Febrile illness
– Worked days missed
– Doctors visits

Summary and Recommendations
• Influenza infections are associated with substantial morbidity and mortality every year– Improve vaccine coverage for at-risk populations currently
recommended for annual influenza vaccination by ACIP
• The very elderly are at substantially increased risk for influenza-associated morbidity and mortality– Encourage development of vaccines with improved
immunogenicity for older adults
• The aging of the US population is leading to substantially more seasonal influenza-associated morbidity and mortality every year– Prepare public health officials for the increasing burden of disease
associated with seasonal influenza over the next decade