willis re 1st vie€¦ · below average pattern of natural catastrophe and man-made losses. ......
TRANSCRIPT

� of �7
willis re1sT view
Orderly sOfTening
1 January 2010
� of �7
TABle Of COnTenTsrEnEWaLS – 1 January 2010Introduction 3Casualty
Territory and Comments 4rates 6
Specialties Line of Business and Comments 7rates 9
PropertyTerritory and Comments 10rates 13rate Graphs 14
Capital Markets Comments 16 Workers’ Compensation
Territory and Comments 17rates 17
1ST VIEWThis thrice yearly publication delivers the very first view on current market conditions to our readers. In addition to real-time Event Reports, our clients receive our daily news brief, Willis Re Rise ’ n shinE, periodic newsletters, white papers and other reports.
WILLIS rEGlobal resources, local delivery For over 100 years, Willis Re has proudly served its clients, helping them obtain better value solutions and make better reinsurance decisions. As one of the world’s premier global reinsurance brokers, with 40 locations worldwide, Willis Re provides local service with the full backing of an integrated global reinsurance broker.
© Copyright 2009 Willis Limited / Willis Re Inc. All rights reserved: No part of this publication may be reproduced, stored in a retrieval system, or transmitted in any form or by any means, whether electronic, mechanical, photocopying, recording, or otherwise, without the permission of Willis Limited / Willis Re Inc. Some information contained in this report may be compiled from third party sources we consider to be reliable; however, we do not guarantee and are not responsible for the accuracy of such. This report is for general guidance only, is not intended to be relied upon, and action based on or in connection with anything contained herein should not be taken without first obtaining specific advice. The views expressed in this report are not necessarily those of the Willis Group. Willis Limited / Willis Re Inc. accepts no responsi-bility for the content or quality of any third party websites to which we refer. Willis Limited, a Lloyd’s broker is authorized and regulated by the Financial Services Authority.

� of �7
Orderly sOfTeningAs widely predicted, the 1 January 2010 renewal season has seen a softening in pricing, largely driven by three key factors: (1) 2009 is likely to close as one of the more profitable underwriting years the global reinsurance industry has enjoyed for a number of years. (2) Most reinsurers’ balance sheets have recovered from losses suffered in the second half of 2008, following the recovery in global investment markets during 2009. (3) The wide disparity between reinsurers’ results and that of their primary insurance company clients continues, as primary companies, whose underwriting performances are not exemplary, are struggling to obtain premium growth in the face of the global recession. This lack of premium growth is putting considerable pressure on primary companies’ expense ratios, particularly in mature markets, and this pressure is feeding through to their reinsurance cost budgets.
By and large, reinsurers have maintained a responsible underwriting attitude towards their own capital suppliers, as well as towards their clients’ requirements over the 1 January renewal season. The rate reductions they are supporting are reasonable, and in the majority of cases, maintain some relationship to the risk exposure they are accepting. This disciplined rating approach is underpinned by reinsurer concern that the excellent 2009 underwriting results are not so much due to attractive pricing, but to a below average pattern of natural catastrophe and man-made losses.
The main area of pricing inadequacy for most reinsurers, though, is long-tail classes, especially in the U.S. For the last three years, an increasing number of commentators have expressed concern that pricing is insufficient in the face of claims inflation, depletion of back-year reserve releases, low interest rates and the fear of general inflation following the recent fiscal governmental stimulus policies. We have not seen a turning point in pricing long-tail classes during this renewal season. Further, it is unclear whether the long-tail market will face another 12 to 24 months of slow drift or if one single market-changing event will occur to galvanize the market.
The catastrophe bond market is recovering, helped by a convergence in pricing between traditional reinsurance structures and catastrophe bonds, coupled with the recovery in global investment markets. During the fourth quarter of 2009, a number of new issues came to market, many well-oversubscribed, allowing larger limits to be placed. The total placed limits for catastrophe bonds in 2009 in aggregate is U.S. $3.4 billion compared to the 2008 figure of U.S. $2.73 billion. The increase in Lloyd’s overall 2010 capacity – in excess of 25% to a currently estimated figure of £22.8 billion – is yet another sign of increased capital. While a significant proportion of this capacity increase is rate-of-exchange driven, the ease with which Lloyd’s secured additional capital offers strong evidence both of the amount of freely deployable capital within the industry and of new investors’ willingness to invest fresh capital.
With the background of a continued softening together with replenished capital bases, the M&A and capital management trend which emerged in the second half of 2009 will likely accelerate during the first half of 2010. Various deals are rumored to be in advanced stages of negotiation, though many are likely to wait until full year 2009 figures are finalized. Similarly, share repurchasing and other capital management strategies, which some reinsurers have hinted they may undertake, are unlikely to be announced prior to finalizing 2009 accounts. In contrast, some voices of caution, in particular, A.M. Best, are warning the Bermudian Reinsurance Industry about the premature deployment of capital at a time when increased volatility of results may be expected, following premium rates’ continued erosion.
While the global reinsurance industry shares some concerns over future volatility and margin on their portfolios, we would be remiss to overlook the fact that over the preceding 12 months when many other financial markets were in turmoil, the industry managed to meet its client requirements in virtually every case. There is nothing, other than some potential compression in margin and increased volatility, to suggest that any of the actions undertaken by the reinsurance market in the 1 January 2010 renewals will undermine its ability to continue to provide clients with secure long-term capital in the years to come. As we start 2010 on a more positive note than twelve months ago, I very much hope that this restored confidence will allow you and your company to prosper.
Peter C. HearnChief Executive Officer, Willis Re31 December, 2009

� of �7
CAsuAlTyTErrITory and CoMMEnTSauSTraLIa
The renewal has been reasonably flat, with expiring rates being maintained in a number of cases. Any increased rates tend to have been from increased exposure. Original incomes are flat (aside from Professional Lines which are reducing). There have been some clients who have further increased retentions. Some improvements in reinsurance wordings.
EuroPEGenerally, a flat market. Some reductions available for claims-free accounts. Distressed business, or programs perceived as being historically cheap, seeing increased rates. Some resistance to providing cover for Environmental Liability Directive.
FranCE – MoTor and ProFESSIonaL IndEMnITyMajor restructuring and retention increases over the last few years allowed the market to achieve stable renewal.With reduction in kilometers per year per vehicle, some modest rate reductions achieved on excess of loss programs.Rating stability helped by additional capacity coming to market, including some Bermudian companies, European offices and Lloyd’s syndicates.Some new Professional Indemnity treaties placed, primarily driven by Solvency II impending requirements.Existing proportional treaties obtained some improvement for ceding companies.Professional Indemnity for construction risks renewed with flat terms and conditions. Significant reductions in projected premium due to reduced economic activity.
ITaLyGeneral Third Party Liability renewed on a flat basis.Increasing pressure from reinsurers to cover Medical Malpractice on a stand-alone basis.Medical Malpractice primary market severely hardening and leading to some cases of self-insurance.
nordIC CounTrIESLargely flat renewal.Reinsurers taking opportunity to push price increases on perceived historically underpriced programs.Major European professional reinsurers did not face any meaningful competitive pressure.
ProFESSIonaL LInES – FInanCIaL InSTITuTIonSImpact of sub-prime and Madoff starting to manifest on 2007 and 2008 underwriting years.Some sub-prime losses reaching settlement stage, but still too early for any Madoff-related claims.Original rates moving upwards in region of +25%, which allied to some modest increases in reinsurance pricing lead to a significant increase in premium received by reinsurers.Full impact on reinsurance pricing of sub-prime and Madoff losses being offset by virtually loss-free 2003 to 2006 underwriting years and overall positive balances still in reinsurers’ favor.
▀▀▀▀▀
▀▀▀▀
▀
▀
▀
▀
▀▀
▀▀▀
▀▀
▀
▀▀▀
▀

� of �7
unITEd STaTES – GEnEraL / ProFESSIonaL LIaBILITyFor well-performing placements, pricing is flat-to-somewhat reduced (lower rates and higher ceding commissions).Capacity levels have increased over last year .Non-economic terms and conditions are softening somewhat. New market entrants’ programs getting placed, but at more restrictive terms than existing placements (lower cedes, higher rates, loss caps, etc.). Distressed programs required to make meaningful economic concessions in order to get placed .Ceding companies net retentions are remaining fairly stable and there is little evidence of clients looking to increase their automatic capacity. Directors & Officers reinsurance capacity is expensive and contracting further as underlying pricing is again deteriorating. Errors & Omissions capacity remains robust with minor improvements in treaty terms still available.
unITEd KInGdoM – MoTor New excess of loss capacity has helped to minimize rate increases.Rating pressure on layers between £5 million and £25 million.
▀▀▀▀
▀▀
▀▀
▀▀

� of �7
raTES XL – no Loss XL – With Loss Pro rata Emergence EmergenceTErrITory Commission % Change % Change
australia – General /Employers’ / Professional Liability N/A 0% to -5% 0% to +5%
Central & Eastern Europe – Motor N/A -5% 0% to +5%
China N/A 0% N/A
France N/A 0% to -5% 0% to +10%
Germany– General /Employers’ / Professional Liability 0% 0% variable
Italy -2% 0% +10%
nordic Countries N/A 0% 0% to +5%
South africa – General / Employers’ / Professional Liability N/A +5% to +10% +15% to +20% Spain – Motor N/A 0% +0% to +5%
united Kingdom – General / Employers’ / Professional Liability N/A 0% 0%
united Kingdom – Motor N/A 0% to +5% +5% to +10%
united States – Motor -2.5% to +2% -5% to -10% +5% to +10%
united States – General / Employers’ / Professional Liability -2.5% to +2% -5% to -10% +5% to +10%

7 of �7
speCiAlTiesLInE oF BuSInESS and CoMMEnTSaEroSPaCE – GLoBaL
Following two quite significant loss events, Colgan Air and Air France, we have seen a firming in aviation reinsurance pricing. Loss-affected excess of loss layers have been subject to a greater degree of pricing adjustment. The attachment points of some major risk-exposed primary excess of loss layers have been subject to a limited amount of upward adjustment. Pricing levels applicable to typical middle-to-higher excess of loss layers, unaffected by loss activity, have largely remained unchanged. Underlying pricing of General Aviation business, protected by risk excess of loss, coverage is being subject to a greater degree of scrutiny from reinsurers. Greater reluctance from traditional markets to support proportional treaty placements given disappointing results and insufficient rating levels on underlying business.
EnGInEErInG – GLoBaLProportional treaty terms are softening with commission increases obtained for profitable accounts. Relaxation in treaty terms negotiated for 2010. Desire by reinsurers to increase their participations on expiring accounts when clients demonstrate their underwriting expertise and market cycle management. Clients obtaining price reductions of -10% to -15% on claims-free Engineering excess of loss programs. Renewed interest by reinsurers to expand into Engineering and Construction reinsurance. Economic stimulae packages expected to have a positive impact on new construction opportunities.
HEaLTHCarE – unITEd STaTESCalendar year combined ratios continue their downward trend and the medical professional liability sector continues to outperform the overall U.S. Property & Casualty industry.The good results are primarily driven by continual favorable loss development and supported by prior year reserve releases.Most commentators think that there is at least one more year of reserve releases to come.In light of the positive environment, underlying rates continue to fall.Reinsurance rates, on the whole, are flat – though achieved rates are still adversely affected by underlying base rate decreases.On the whole, frequency is flat and severity trend continues moderately upward.
MarInEOriginal premiums down on reduced economic activity, leading to reduced exposures.Increased available capacity leading to modest rate reductions on clean renewals.New capacity coming primarily from new Lloyd’s Syndicates that started in last couple of years.
MarInE – GLoBaL oFFSHorE EnErGyEx Gulf of Mexico renewals largely flat as reinsurers digest impact of two major losses, Montana West Atlas (U.S. $500 million) and Ekofisk Big Orange (U.S. $750 million).Market impact of Ekofisk Big Orange mitigated by large cession to energy mutual OIL. Montana West Atlas loss well spread in the market.Gulf of Mexico saw limited renewal activity at 1 January as buying moved to April / May to match inception dates of original policies.
▀
▀▀
▀
▀
▀
▀
▀▀
▀
▀▀
▀
▀
▀▀▀
▀
▀▀▀
▀
▀
▀
� of �7
MarInE – rETroCESSIonRetro market relatively firm, average 5% price reduction.Demand down, supply up, but generally retrocessionaires not competing heavily on price.Preference still to deploy peak catastrophe zone on direct catastrophe programs, but signing down on some large U.S. catastrophe programs may loosen market later in the year.
MEdICaL EXCESS – unITEd STaTESCapacity stable 2009 to 2010.A number of previously fringe markets getting more aggressive with rating 1 January 2010 business. Incumbent markets required to get close to expiring rates in order to retain the business.
non-MarInE – rETroCESSIonRetro market relatively firm, average 5% price reduction.Demand down, supply up, but generally not competing heavily on price.Preference still to deploy capacity on direct catastrophe, signings on big U.S. program may loosen the market.
PErSonaL aCCIdEnT / LIFE CaTaSTroPHE – unITEd STaTESVarious new entrants to the catastrophe market.Rates as expiring or slightly down.Buyers looking at increased limits. Specific pressure on nationwide U.S., full terror aggregate, an issue for a number of markets. Particularly acute on portfolios with California exposures.
PoLITICaL rISKIn terms of capacity, reinsurers’ appetite looks similar to last year, despite emerging market losses which are not linked to pure political risk events. Rates generally up by a minimum of 10%. A number of new reinsurers attracted by reinsurance rate increases. Reinsureds who previously wrote a blended book of Political Risk and Trade Credit may, due to loss experience from Trade Credit business, now focus on Political Risk and Contract Frustration; there already exists an overabundance of capacity and it, in turn, would force further reductions in original pricing.
SurETyOverall market pricing weakened due to continued favorable primary and reinsurance results. While uncertainty clouds future prospects, good underwriting results over the last four years drove a softening market environment. Competitive market conditions were further supported by a leveling off of exposures and stable portfolio credit quality. Market capacity expanded as new reinsurer interest in the class increased. Reinsurers aligned themselves, through the deployment of meaningful capacity, with cedants who demonstrate conservative underwriting and sound portfolio management. Cedants expect 2010 to be a challenging year with an expected increased frequency of loss.
TradE CrEdIT – GLoBaLMarket capacity for short-term business significantly higher with several new entrants (mostly Bermudian through European offices) offering both quota share and excess of loss support.Reduction in turnover reducing ceding company demand for increased limits.Capacity for single risk more restrained, reflecting significant increase in loss activity from emerging markets during 2009.Reinsurers cautiously optimistic about return to profitability in 2010 on quota share treaties with ceding commissions adjusted downwards to allow expected reinsurer margins in the region of 10% to 15%.Some underlying concern over possible second financial crisis during second half of 2010.For more volatile single risk business, commissions under pressure along with tighter risk eligibility definitions.Rate increases on excess of loss more modest following large increases at 1 January 2009. Additional increases at 1 January 2010 driven by perception of high level of risk, though to date, short-term programs remain loss free. Single risk excess of loss programs that suffered losses in 2009 relating to 2007 and 2008 underwriting years have seen substantial increases and tighter risk eligibility definitions.
▀▀▀
▀▀▀
▀▀▀
▀▀▀▀
▀
▀▀
▀
▀▀▀
▀
▀
▀▀▀
▀▀▀
▀

� of �7
raTES risk risk Cat Cat Pro rata Loss Free Loss Hit Loss Free Loss HitTErrITory Commission % Change % Change % Change % Change aerospace – Global +2% 0% +5% to +15% 0% N/A
Engineering 0 to +2.5% -10% to -15% N/A -10% to -15% N/A
Healthcare – u.S. N/A 0% 0% N/A N/A Marine 0% -5% to -7.5% various -5% to -7.5% N/A
Marine – Global offshore Energy +1.5% to +2.5% 0% 0% N/A N/A Marine – retrocession 0% 0% 0% 0% N/A
Medical Excess – u.S. N/A 0% to +5% +5% to +15% N/A N/A
non-Marine retro 0% -5% N/A -5% N/A
Personal accident / Life Catastrophe – united States 0% N/A N/A 0% to -5% N/A
Political risk 0% to -5% +10% to +25% N/A N/A N/A
Trade Credit -5% to -10% +20% to +25% +25% to +40% N/A N/A
�0 of �7
prOperTyTErrITory and CoMMEnTSaSIa
The supposed de-coupling of the Asian reinsurance cycle from that of Europe / U.S. may be the subject of ongoing debate, but there was little to distinguish the experience of both areas in the 1 January 2010 renewal. Catastrophe excess of loss buyers enjoyed significant risk-adjusted pricing reductions where aggregate has grown substantially, but considerable resistance to actual monetary reductions where aggregate has been more stable. Risk excess of loss pricing was as always more variable (as a function of recent experience), but there has been greater resistance to significant price reduction than many had anticipated in the wake of a passive pre-renewal message from reinsurers. The Singapore Reinsurance conference on the eve of the renewal season had conveyed a sense of unity in declining to signal competitive intent. This has been reflected in the modest excess of loss pricing reductions obtained by (loss-free) Asian buyers, and the ongoing tightening of proportional terms and conditions where margins have been narrowing or negative. Reinsurers continue to arrive in Singapore, drawn by regional growth stories and the need to be more proximate to the business to understand which strategies are appropriate. This migration (19% of global reinsurance capacity is now based in Asia) will continue to blunt any hardening momentum, although this year’s “flat-ish” renewal will be pointed to by reinsurers as evidence that the bottom is in sight.
CarIBBEan Some commission increases on pro rata treaties, especially for territories where the original rates have held up.Catastrophe excess of loss pricing varies by territory and client with larger reductions achieved on growing portfolios with substantial premium volumes.
CEnTraL & EaSTErn EuroPECatastrophe excess of loss pricing is “stable to - 5% reduction,” on programs with no loss activity and with stable exposure. Risk excess of loss pricing is stable on loss free programs even with increased exposure.Pro rata renewals unchanged terms.
CHInaVery late renewal as buyers confident of quick placement on back of good results.Pro rata treaties largely renewed unchanged with some movement from sliding scale commissions to flat commissions.Limited number of catastrophe excess of loss programs renew at 1 January, but those that did showed modest risk adjusted reductions on growing underlying portfolios.
CoLoMBIaPlenty of excess of loss capacity available. Capacity limited for pro rata treaty as event limits are not allowed by the Superintendency. Catastrophe excess of loss pricing zero movement to -5% depending on each case. Risk excess of loss pricing stable. Pro rata commissions unchanged, but minimum earthquake cessions rates down as much as -15% in some cases. Terrorism excess of loss a popular class for reinsurers as loss record excellent.
EuroPEPan European programs benefitted from slightly more capacity allowing modest risk adjusted rate reductions.On later single territory renewals, buyers’ more ambitious price reduction targets were countered by reinsurers maintaining pricing discipline.
▀
▀
▀
▀
▀
▀▀
▀▀▀
▀▀▀
▀▀▀▀▀▀
▀▀
�� of �7
FranCERenewal of natural catastrophe programs for local buyers completed faster than in earlier years with modest rate reductions on loss-free layers. Issue regarding the application of original deductibles on losses arising from simple risks in Storm Klaus.Absolute Nuclear Exclusion requested by leading reinsurers on property treaties.Property risk excess of loss priced largely on individual loss record. General results are worsening due to economic crisis, which has been reflected in overall price increase.Storm Klaus with a French market loss of €1.6 billion has triggered rate increases on loss hit lower catastrophe excess of loss layers. Other market losses, such a Storm Felix (€400 million) and various hailstorm losses, have impacted aggregate excess of loss.
GErManyIncreased purchasing due to stronger orientation towards Solvency II protection levels.Following last years’ reduction in catastrophe capacity, the market saw additional available capacity.Very benign loss year, helping to support modest rate reductions.
IndonESIaPricing on excess of loss treaties with good results held steady. Increases in pricing of risk excess of loss treaties with marginally unprofitable results. Proportional treaties are much more difficult to place, mostly because of poor results. Excess of loss new top layers are no longer possible below minimal rate on line of 1.0%. Catastrophe excess of loss treaties with poor results are being quoted at significantly higher pricing.
ITaLyHardening of conditions on pro rata business.Overall risk-adjusted softening for both risk and catastrophe excess of loss, despite Aquila Earthquake loss, some other natural perils events and increased exposures.
MIddLE EaSTLoss history is improving; fewer large risk losses in the markets. Recent flood loss in Jeddah will hit mainly Motor insurance portfolio (U.S. $40 million).
nordIC CounTrIESPro rata commissions closely linked to treaty results.Market maintained pricing discipline throughout renewal period with signs of later renewals being penalized.Limited new capacity due to comparative price issues with European countries.
PHILIPPInESSignificant pricing impact from Typhoon Ondoy (U.S. $250 million).Limited capacity for pro rata, including Natural Perils.Increased limits explored for Motor Own Damage.
SouTH aFrICaExcess of loss pricing is generally flat.Some reinsurers looked for larger increases, which ultimately the market did not carry.Most leads are insisting on additional restrictive cover by amending contractual documentation.
SPaInThe market is generally flat.There are some small increases in catastrophe excess of loss.
▀
▀▀
▀
▀▀▀
▀▀▀▀▀
▀▀
▀▀
▀▀▀
▀▀▀
▀▀▀
▀▀
�� of �7
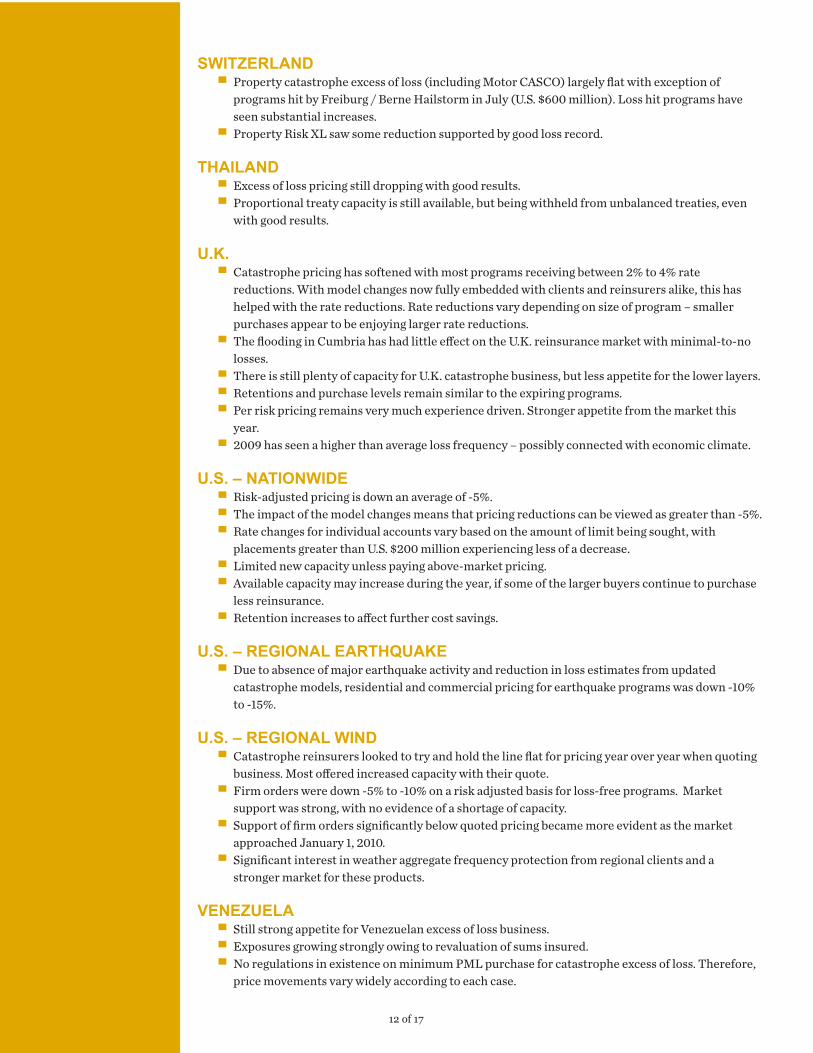
SWITzErLandProperty catastrophe excess of loss (including Motor CASCO) largely flat with exception of programs hit by Freiburg / Berne Hailstorm in July (U.S. $600 million). Loss hit programs have seen substantial increases.Property Risk XL saw some reduction supported by good loss record.
THaILandExcess of loss pricing still dropping with good results. Proportional treaty capacity is still available, but being withheld from unbalanced treaties, even with good results.
u.K.Catastrophe pricing has softened with most programs receiving between 2% to 4% rate reductions. With model changes now fully embedded with clients and reinsurers alike, this has helped with the rate reductions. Rate reductions vary depending on size of program – smaller purchases appear to be enjoying larger rate reductions. The flooding in Cumbria has had little effect on the U.K. reinsurance market with minimal-to-no losses. There is still plenty of capacity for U.K. catastrophe business, but less appetite for the lower layers. Retentions and purchase levels remain similar to the expiring programs.Per risk pricing remains very much experience driven. Stronger appetite from the market this year. 2009 has seen a higher than average loss frequency – possibly connected with economic climate.
u.S. – naTIonWIdERisk-adjusted pricing is down an average of -5%.The impact of the model changes means that pricing reductions can be viewed as greater than -5%.Rate changes for individual accounts vary based on the amount of limit being sought, with placements greater than U.S. $200 million experiencing less of a decrease.Limited new capacity unless paying above-market pricing.Available capacity may increase during the year, if some of the larger buyers continue to purchase less reinsurance.Retention increases to affect further cost savings.
u.S. – rEGIonaL EarTHquaKEDue to absence of major earthquake activity and reduction in loss estimates from updated catastrophe models, residential and commercial pricing for earthquake programs was down -10% to -15%.
u.S. – rEGIonaL WIndCatastrophe reinsurers looked to try and hold the line flat for pricing year over year when quoting business. Most offered increased capacity with their quote.Firm orders were down -5% to -10% on a risk adjusted basis for loss-free programs. Market support was strong, with no evidence of a shortage of capacity.Support of firm orders significantly below quoted pricing became more evident as the market approached January 1, 2010.Significant interest in weather aggregate frequency protection from regional clients and a stronger market for these products.
VEnEzuELaStill strong appetite for Venezuelan excess of loss business. Exposures growing strongly owing to revaluation of sums insured. No regulations in existence on minimum PML purchase for catastrophe excess of loss. Therefore, price movements vary widely according to each case.
▀
▀
▀▀
▀
▀
▀▀▀
▀
▀▀▀
▀▀
▀
▀
▀
▀
▀
▀
▀▀▀

�� of �7
raTES risk risk Cat Cat Pro rata Loss Free Loss Hit Loss Free Loss HitTErrITory Commission % Change % Change % Change % Change algeria +1.5% -10% N/A -10% N/A
Caribbean 0% to +0.5% -5% to -10% 0% to +10% 0% to -7.5% N/A
Central & Eastern Europe 0% 0% to -5% 0% to +10% 0% to -5% 0% to +10%
China 0% 0% 0% 0 % to -10% N/A
Colombia 0% 0% to -3% +5% to +10% 0% to -5% N/A
France N/A 0% to +10% +5% to +15% 0% to -5% +2% to +10%
Germany 0% 0% to -5% variable 0% to -5% N/A
Indonesia -2% 0% +10% to +15% 0% +30% to +60%
Italy -3% -5% +5% -10% +5%
Middle East 0% -5% +20% -10% +25% Morocco +2.5% -17.5% 0% 0% 0%
nordic Countries 0% 0% variable -5% to +5% N/A
Philippines +5% N/A +15% to +15% N/A +15% to +30%
South africa 0% 0% to +5% +5% to +10% 0% +5% to +10%
Spain 0% 0% to -10% 0% to +10% 0% to +10% 0% to +20%
Switzerland 0% to +3% 0% to -5% N/A 0% to -5% +10% to +40% Taiwan 0% 0% to -5% +10% to +25% 0% to -10% -5% to +5%
Thailand 0% -2.5% N/A -2.5% N/A
Turkey 0% 0% to -8% 0% to +10% 0% to -8% 0%
u.K. N/A +5% to -5% N/A 0% to -5% 0%
u.S. – nationwide 0% N/A N/A -5% 0%
u.S. – regional Earthquake N/A 0% N/A -10% to -15% N/A
u.S. – regional Wind N/A 0% to -5% 0% -5% to -10% 0% to +10%
Venezuela 0% 0% +5% +3 to -5% N/A

�� of �7
ProPErTy CaTaSTroPHE PrICInG TrEndS
CarIBBEan
The charts on this page display Estimated Year-to-Year Property Catastrophe Rate Movement.
FranCE
0100200300400500600
1990 92 94 96 98
2000 02 04 06 08 10
CoLoMBIa
0100200300400500600
1990 92 94 96 98
2000 02 04 06 08 10
0100200300400500600
1990 92 94 96 98
2000 02 04 06 08 10

�� of �7
unITEd STaTES – naTIonWIdE
0100200300400500600
1990 92 94 96 98
2000 02 04 06 08 10
0100200300400500600
1990 92 94 96 98
2000 02 04 06 08 10
unITEd KInGdoM
0100200300400500600
1990 92 94 96 98
2000 02 04 06 08 10
GErMany
0100200300400500600
1990 92 94 96 98
2000 02 04 06 08 10
VEnEzuELa
0100200300400500600
1990 92 94 96 98
2000 02 04 06 08 10

�� of �7
CApiTAl MArkeTsTErrITory and CoMMEnTS
The market conditions for catastrophe bond issuance in 2010 are expected to be very favorable.Insurance Linked Securities funds and multi-strategy investors are demonstrating abundant new and revitalized interest in this uncorrelated asset class; recent deals have been oversubscribed.The catastrophe bond market closed out 2009 with eighteen new P&C issuances, for a total of $3.4 billion in new catastrophe bond capacity; yet, demand continues to outpace supply.Catastrophe bond sponsors and investors are comfortable with new catastrophe bond collateral arrangements, many of which utilize government-guaranteed paper, and all of which include significantly increased transparency.
Attractive catastrophe bond pricing.Rate-on-Line equivalents are down well over 30% since mid-year.Reinsurance and Industry Loss Warranty price reductions, in combination with decreasing secondary ILS market spreads, presage continued price decreases for cat bonds into 2010.Narrowing spreads in the broader capital markets enhance the relative attraction of catastrophe bonds.Successful capital raises by insurance-linked securities funds will further increase the demand side.
Proliferation of sponsors, perils, and triggers anticipated in 2010.The environment is very favorable for U.S. earthquake transactions, given investor desire for diversification and recent catastrophe model changes.Pent-up demand for non-U.S. perils.Increased investor acceptance of indemnity-triggered cat bonds and introduction of creative hybrid triggers. New sponsor entrants will seek benefits of multi-year, collateralized catastrophe protection at attractive prices.
▀•
•
•
▀••
••
▀•
•••
�7 of �7
Contact us
Ingrid BoothWillis Group CommunicationsThe Willis Building51 Lime StreetLondon EC3M 7DQ+44 (0) 20 3124 [email protected]
Will Thoretz One World Financial Center 200 Liberty Street, 3rd Floor New York, NY 10281 United States +1 212 915 8251 [email protected]
u.s. wOrkers’ COMpensATiOnTErrITory and CoMMEnTS
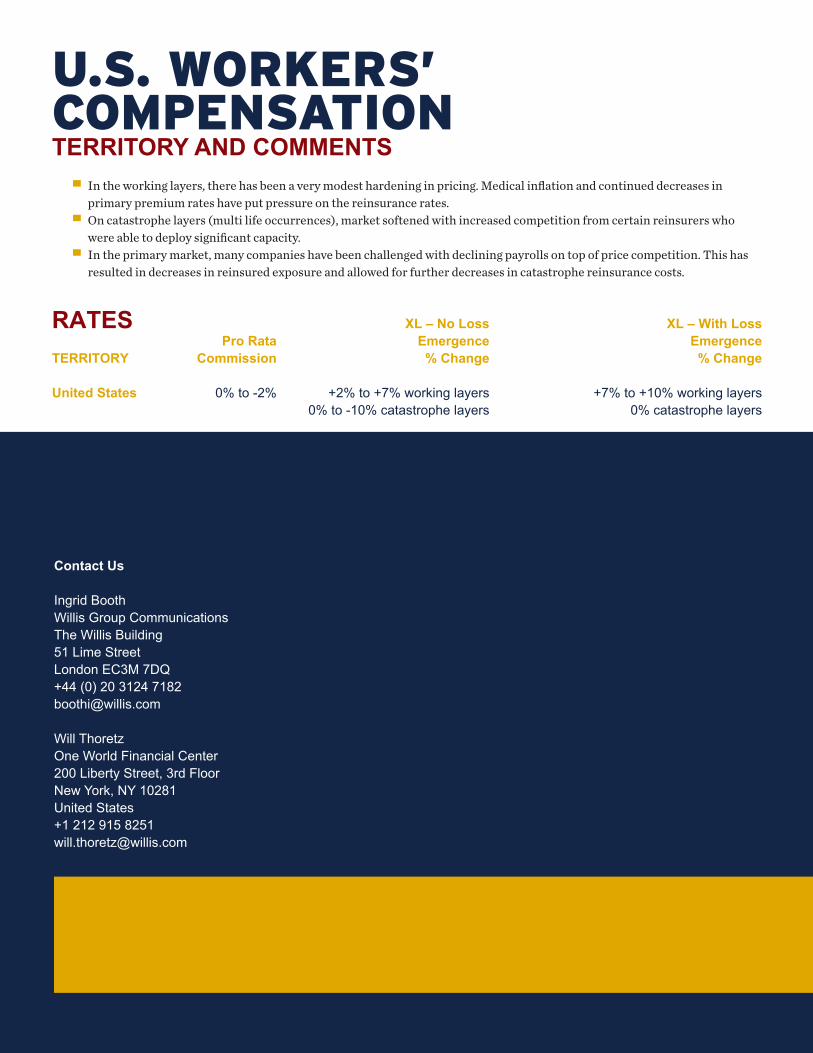
In the working layers, there has been a very modest hardening in pricing. Medical inflation and continued decreases in primary premium rates have put pressure on the reinsurance rates. On catastrophe layers (multi life occurrences), market softened with increased competition from certain reinsurers who were able to deploy significant capacity.In the primary market, many companies have been challenged with declining payrolls on top of price competition. This has resulted in decreases in reinsured exposure and allowed for further decreases in catastrophe reinsurance costs.
raTES XL – no Loss XL – With Loss Pro rata Emergence EmergenceTErrITory Commission % Change % Change
united States 0% to -2% +2% to +7% working layers +7% to +10% working layers 0% to -10% catastrophe layers 0% catastrophe layers
▀
▀
▀