w’illvrm!imriiport - nasa · material that is not essential ... (3.731 - #o.534 + 4.1.8fk) the...
TRANSCRIPT
.— . . .. ... . . . ..— —...— -—
COMMITTEE FOR AERONAUTICS
w’illvrm!imRIIPORTORIGINALLYISSUEDAuguet1944 ae
Advence ConfidentialReport
EWKE%YlON IJEHCOPTI!RHREUMANCE
xx moF’ILE-nRAG cHARAcTElmYrIcs
OF
OF
IAE05
MXUFICATIONS
RO!IDR-BLADE
JXUUOILSECTIONS
By F. B. &UIt8fStXl
LangleyMemrlti AeronauticalLaboratoryI=@ey Field,VEL.
.iSACA WARTLME REPORTS are re$rints of papers originally issued to pro&%$~ap~$&s?&bution ofadvance research results to an authorized group requiring them for the war effort. They were pre-viously held under a security status but are now unclassified. Some of these reports were not tech-nically edited. All have been reproduced without change in order to expedite general distribution.
●
☛“L - 26—
https://ntrs.nasa.gov/search.jsp?R=19930093589 2019-06-14T01:32:23+00:00Z

I—— — -—— .. —.-
. .
NACA ACR No. 4H05’ ~
NATIONAL ADVISORY COMMITTEE FOR AERONAUTICS
ADVANCE CONFIDFIJTIAL REPORT
EFFECT ON HELICOPTti PERFORMANCE OF MODIFICATIONS
IN PROFILE-DRAG CHARACTERISTICS OF ROTOR-BLADE
AIRFOIL SECTIONS . .
By F. B. Gustafson
SUMM?ARY
Performance calculations are presented for a typicalhelicopter rotor in which three types cf airfoil sectionwere successively used. The types represented are therough conventional, the smooth conventional, and thelaminar-flow or low-drag sections as developed for heli-copter use. The performance items covered are rotorthrust for fixed power in hoverinG, range and enduranceat cruising speed, and power required at a relativelyhigh forward speed. Contours showing the conditions ofoperation encountered by the blade section and weightingcurves sb.owingthe relative importance of the varioussection angles of attack for specified flight conditionsare included as an aid in the Interpretation of theresults.
The calculations indicated that the use of a smoothconventional section will result in marked performancegains throughout the flight range. Definite, thoughsmaller, additional gains in take-off weight and in~ange and endurance may be realized by the use of a low-fiag section. At high forward speeds or at moderateforward speeds and high loadings, however, losses areindicated for the low-drag sections in contrast with thesmooth conventional sections. It Is demonstrated that,if these losses are to be avoided, the low-drag sectionsmust be designed to avoid the extreme rise in drag coeffi=cient at the higher angles of attack wliich is character-istic or the low-drag sections now”available for use inhelicopters.
—---- .. . ..- -

2
INTRODUCTION
It 1s generally recognized that an Important partof the power required to operate a helicopter is absorbedby the profile drag of the blade elements; consequently,considerable interest has been shown in the possibilityof using lminar-flow, or low-drag, airfoil sections inhelicopter rotors. A recent report (reference 1) descrtiedthe characterlstios of several low-drag sections thatwere developed especially for use in helicopters. Pre-vious low-drag sections had either excessive pitching-moment coefficients or low drag only at extremely lowlift coefficients. The sections of reference 1 weredesigned to give the maximum lift-drag ratio (L/D)obtainable with zero pitching-moment coefficient, o?%an appropriate range of Reynolds number.
In order to indicate the magnitude of the performancegains that might result rrom the use of the new sectionsand to provide a guide for the development of additionalsections, an analysis has bean made for several condi-tions of flight for a helicopter of’assumed character-istics. The method of analysis ussd for hovering flightdiffers considerably from thnt used for forward fllght.The results for tinetwo flight conditions accordinglyare presented separately. Material that is not essentialto the analysis but provides substantial aid in under-standing the results has been incorporated in an appendix.
SYMBOLS
R rotor-blade radius
b number of blades
c blade chord
r radius of blade element
e pitch angle of blade element ~
‘1difference between hub and tip pitch angles (posi-
tive when tip angle is greater)

—
NACA ACR No. 4H05 ~ 3
blade pitch angle at x = 0.75
rotor angular velocity, radians per second
forward speed
tip-speed ratio ~ ~)
angle of attack of rotor disk
speed of axial flow through rotor disk (positiveupward )
section angle of attack (absolute)
section profile-drag coefficient
section lift coefficient
slope of’lift coefficient against section angle ofattack (radian maasure)
solidity; rat,io ofarea (bc/mR)
rotor thrust
thrust coeff’ioient
torque coefficient
power
power coeff’lcient
tohal blade area to swept-disk
(*)(Rotor tor ue
p&lR f)
(Rotor-shaft power input)
\ (3SPTrR7 )
lift coefficient
(“
otor lift
+“%# )
angle of attack of blade element from zero lift
angle of attack of blade element at tip
velocity component at blade element perpendicularto blade span and parallel to rotor disk
velocity component at blade elementto blade span and to u@R
— . —. . .
perpendicular
.— ..-—.— —--— .

4 NACA ACR No. 14H05
If blade azimuth angle measured from down wind indirection of rotation
w gross weight, pounds
‘fl/s rotor disk loading, pounds per square foot
i’ parasite-drag area, square feet
P air density
Subscripts:
i induced
o profile
HOV3RING FLIGHT
In order to indicate the effect of variation in air-foil section drag characteristics on the useful load thatcan be carried, the rotor thrust developed by a fixedshaft power was calculated for an assumed helicopterrotor in which three dlffersnt types of airfoil sectionwere successively used. The calculations were, in eachcase, carried out for a series of blade pitch settings.
Sample Helicopter Rotor
The sample helicopter was assumed to be in hoveringflight at sea level. The rotor characteristics weretak=n to be as follows:
Rotor radius, feet . . . . . . . . .Solidity. . . . . . . . . . . . . .Bladeplanform . . . . .: . . . .Bladetwlst . . . . . . . . . . . .Power available at rotor, horsepower
. . . . . . . . 20● ✎ ✎ ✎ ✎ ✎ ✌ 0.07.*. . Rectangular● . . . . . ● None99**.. . . 260

. ..—. .——. — . ..—-
!5
Airfoil Seotion Characteristics
- .. The-NACA 3-H-13.5-section was mhosen as -representa-tive of the new low-drag sections of’reference 1. TheNACA 23015 section, for which data are also given inreference 1, was included to permit comparison with asmooth conventional section. In order to permit compari-son with a conventional section in a condition believedto be typical of present-day rotors, a ‘trough”conven-tional section was Included; the drag curve for thissection is a composite of data from various sources.
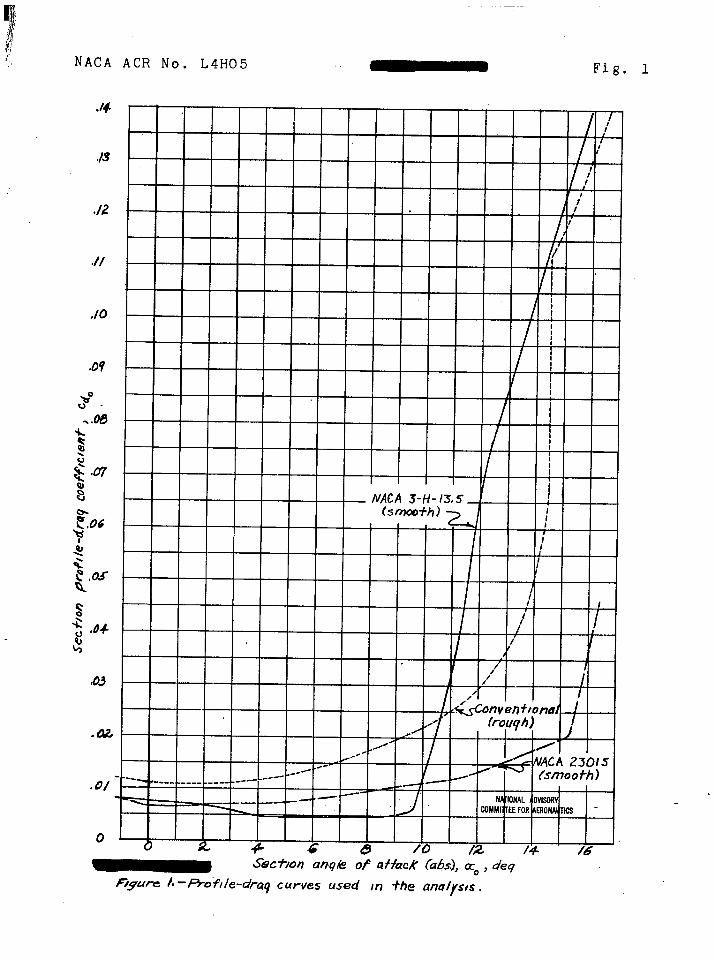
The curves of profile-drag coefficient agslnst ang19
of attack USOd for the three sections are shown in fig-ure 1. These curves are representative of Reynoldsnumbers co~’responding to ‘de ol~terpart of the rotor disQin which most of the profile-drng losses occur. As iSshown in the appendix the Reynolcisnumber, Mach number,and angles of’yaw encountered bj’ the rotor blade varyconsiderably over tho rotor disk. FToatter.ptwas madeto modify the curves of figure 1 to allow for thesevariations; the analysis is thus a comparison of’dragcurves representative of’certain types of airfoil s9ctlonrather than of specif’lcsections,
The profile-drag values avsllable for high anglescf’attack were lncomplcte, especially for the NACA3-H-13.5 gectlon. The dra~ data of reference 1 reachan ar.gle of attark d 1~~ for the NACA 23015 sectionand of 10° for tb.eNACA 3-H-13.5section. The followingrelat!on, wl.ich is based largely on a composite cf allthe data for high angles of attack of reference 1, wasused to axtcnd these data as necessary:
~Cdo = 0.25 (CZI - Cz)
whera
hcdo increment in profile-drag coefficient above valueat upper end of straight-line portion of liftcurve
Czl lift coefficient as given by extension of straight-line portion of lift curve
This method gives results that agree with the availablevalues for high angles of attack for the low-drag sectionsof reference 1 within about *2O percent. It Is also in
I-. -. . ...- .— --.-— — ——. . .

6 NACA ACR No. L4H05
approximate agreement with drag data for other airfoilsat angles of attack beyond the stall.
The slope of the airfoil section lift curve wastaken as 5.85 throughout the analysis.
Method of Calculation of Thrust for Fixed Horsepower
Thrust.- The rotor thrust T
T= wCT~~
or, for the assumed rotor,
T = 1195C#
The value of CT for a givenmay be obtained from equation (14)may be written
is
(1)
blade pitch settingof reference 2, which
(where
A= J()a2B +4;:
In order to obtain an expression for ~, the powerrequired and the power available may be equated as -
P= 260 hp = pnR%22 CQi & + pTrR%22cQo&
hence,
(2)
Induced torque coefficient.- The value of CQ1
for a given pitch setting may be obtained by using the

figura-of-meri.t equation of reference 2, tilch may bewritten
~T3/2
l!= o.707—CQ
henc 6,
.
Values of I’ for any specified value cf pitch may be31obtaln~d fro, f 9UW 17 of refer9nce 2. Tkw factor In
th~ above equation is 0.797 instead of 1/2 as in refer-ence 2 since p/2 was used in the definition of CTala c In reference 2, whereas p Is used in thedeflni%ions throuf--out the present report.
Profile torque coefficient.- In order to oblxin thei169$ra~ivalues 01
c%fcr a drag curve of arbitrary form,
it is IMcesesry first to CalCUlate the induc6d angle offlow at a series Gf radii for each of the specified pitchai@3s. This calculation was mdie by means of equa-tion (11) of reference 2, which may be.written
Vhere an upward inclination of the flow is associatedwith positive values of q; hence,
( )0“035 (3.731 - #o.534 + 4.1.8fk~= ~
The an[:16sof attack age tinenobtained i%om the relation
Scnple curves of angle of attack against fraction ofr~dius are shown in figure 2.
. . . . . . . . . .. .. . .. . . . ----- . . . . . ---— .- ..---- —.-.-, . . .
8 NACA ACR No. I)+H05
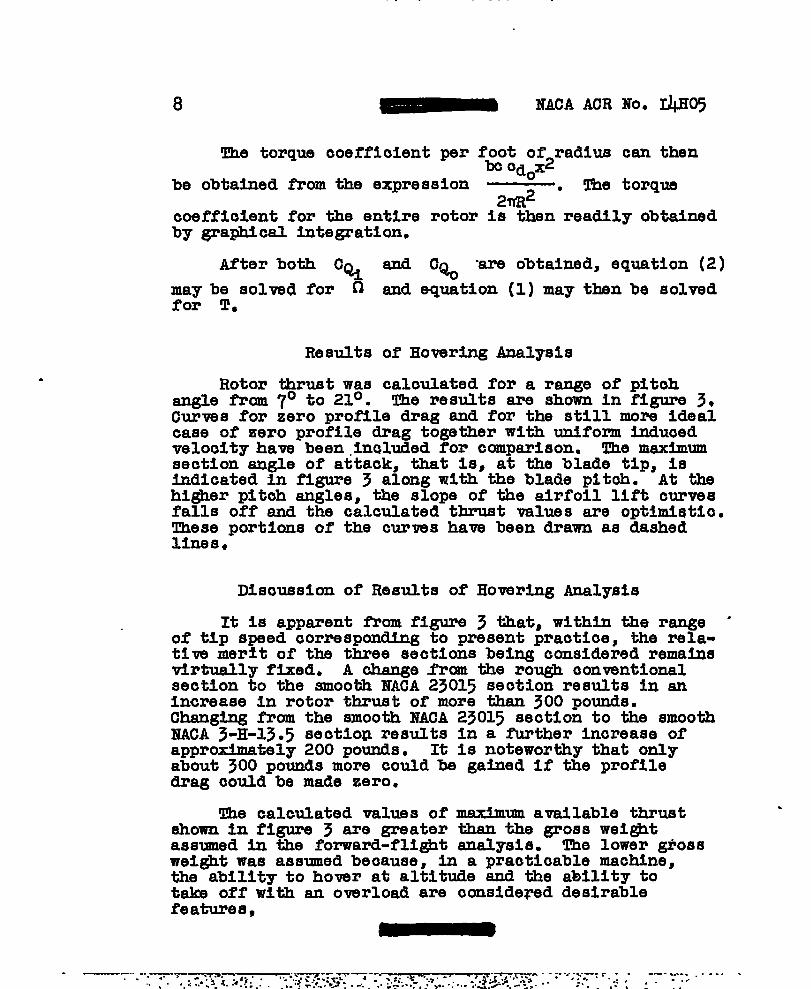
The torque eoeffioient per foot of radius can then~ ~dox2
be obtained from the expression —. The torque2~2
coefflolent for the entire rotor is then readily obtainedby graphical integration.
After both C%
may be solved for ~for T.
Results
Rotor thrust wasangle from 7° to 21°.
and C% “areobtained, equation (2)
and equation (1) may then be solved
of Hovering Analysis
calculated for a range of pitohThe results are shown In figure 3,
CtiveS for iero profile drag and for the still more idealcase of zero profile drag together with uniform inducedvelocity have been .lnQludedfor comparison. The maxlmmsection angle of attack, that 1s, at the blade tip, isindicated in figure 3 along with the blade pitoh. At thehigher pitoh angles, the slope of the airfoil Mft curvesfalls off and the calculated thrust values are optimiatio.These nortions of the turns have been drawn as dashedlines*-
Dlsousslon of Results of
It Is apparent from figure
Hovering AnalySiS
3 tha-t,within the range “of tlp speed corresponding to present practice, the rela-tive merit of the three sections being considered remainsvirtually fixed. A ohange from the rough conventionalsection to the smooth ?lACA23015 seotion results IQ anincrease h rotor thrust of more than 300 pounds.Changtng from the smooth NACA 23015 section to the smoothNACA 3-H-13.5 sectiop results in a further Inorease ofapproximately 200 pounds. It is noteworthy that onlyabout 300 pounds more could be gained If the profiledrag oould be made zero.
The calculated values of maximum available thrustshown in figure 3 are greater than the gross weightassumed In the forward-flight analysls. The lower @ossweight was assumed because, In a praotioable maohine,the ability to homr at altitude and the ability totake off with an ovsrload are mnside~d desirablefeatures,
v

9
FORWARD FLIGHT
Of the various perfozmmnce characteristics associatedwith forward flight, range and endurance seem ofgreatest Interest at the present time. Calculations ofrange and enduranoe at a particular airspeed (approxi-mately that for minimum power) consequently were madefor a sample helicopter lnwhich the three airfoil sec-tions previously described were used successively. Afuel load of’10 percent of the gross weight was assumedin each case. The power absorbed by all items otherthan the rotor, including coolhg fans and torque-capensatlng devices, was allowed for by assuming aspecific fuel consumption of 0.55 pound per rotorhorsepower-hour, which is approximately 15 to 20 percenthigher than the normal value for cruising power.
Because of the irregular shape of’the drag curve forthe low-drag airfoil, analytical treatments of the rotorprofile-drag losses, such as that of referenoe 3, werenot feasible and graphical methods were used.
Sample Helicopter and Assumed Conditions
The sample helicopter was assumed to be In levelflight at sea level and to be operating under the fol-lowhg conditions:
Forward speedFeetpersecond. . . . . . . . . . . . . . . . . 80Milesperhour . . . . . . . . . . . . . . . . . 55
Rotor tip speed, feet per second . . . . . . . . . . @oTip-speedratio . . . . . . . . . . . . . . . . . .0.2
The geometric characteristics assumed were asfollows:
Rotorradius, feet . . . . . . . . . . . . . . . . . 20Disk loading, pounds per sqpare foot . . . . . . . . 2.5(3rosswei@t, pounds . . . . . . . . . . . . . . . 3140Bladeplanform . . . . . . . . . . . . . . RectangularBlade twist . . . . . . . . . . . . . . . . . . . NoneSolidity . . . . . . . . . . . . . . . . . . ...0.07Parasite-drag area, square feet . . . . . . . . . . 15
.
. . . . . .-. .. - . ....... . . ----- . .. - . . . . . . -~.. - .- - ,.. - - -. - -..-

10 .~ NACA ACR ~{0. 4H05
Except where otherwise indicated, the foregoing .assumptions apply to all results presented for forwardflight. It will be noted that the geometric character-istics assumed for the rotor are the same-as those usedin the hovering analysis.
Method of Analysis
The power absorbed by the rotor may be consideredas the sum of tie power required to overcome the parasitedrag, the induced drag, and the rotor-blade profile drag.The power rewired to overcome-the parasite drag Is
= 16.6 horsepower
which is considered to be constant. The horsepowerrequired to overcome the induced drag is
(3pi=– Wvim
As explained in reference 3, the in@aced
k
D/L is simplyc 4* Because the change in weight is small, the use of
average weight is considered permissible, and theaverage induoed power Is then
Pi = 0.0783 x 2980 x
= 33.9 horsepower
The calculation of profile-drag losses is much morecomplex and is described In some detail.
Calculation of angles of attack.- Any graphicaltreatment of profile-drag losses requires knowledge ofblade section angle of attack at various points on therotor disk. In order to calculate the angle of attackof a blade element at any-given point, It is necessaryfirst to calculate the required blade pitch, the inflowvelocity, and the blade flapping coefficients. Thepitch and the inflow veloclty were determined by meansof the analysis described In reference 4. This analysis
.
——- ——- ,. . .+ .-’..-..m-.~: *‘“ :. G.rm. .>> ~..~~ -: . . ..-.. %-.”--+:.s : . . ‘ 4:;..- Fyyy--—.-’- -, -;, . - . -. . . .. . . . . . . --- . .... .~..:.. .,..:.
. ..— . . —.. --
r
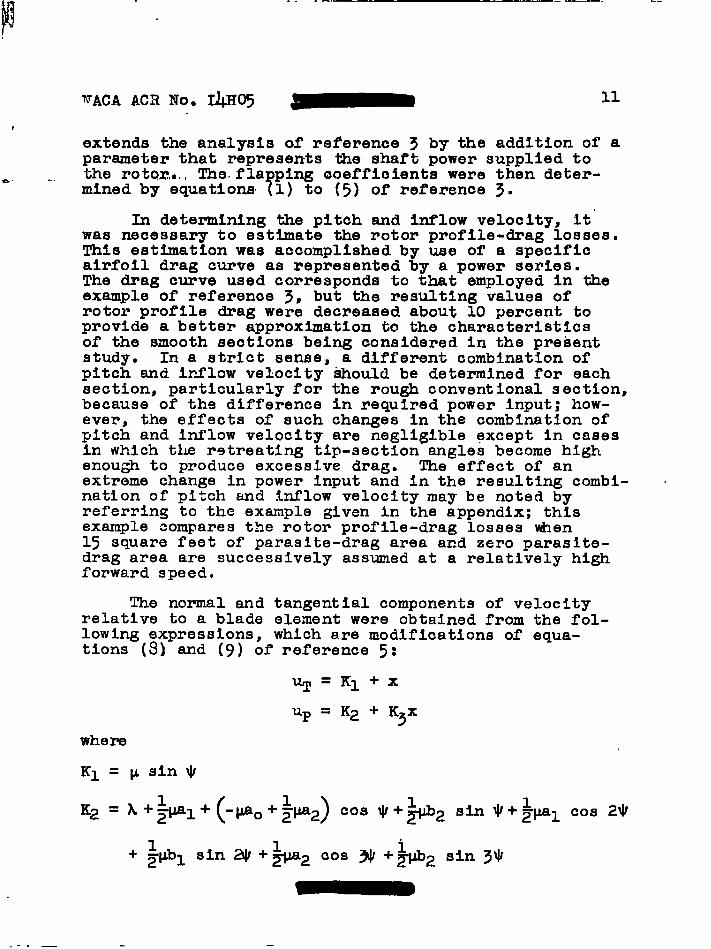
extends the analysis of reference 3parameter that represents the shaft
11
by the addition of apower supplied to
‘We rotQz,4,,The-flapping ooeffioients were then deter--. ..mined by equations (1) to (5) of reference 3.
In determining the pitch and inflow velocity, it”was necessary to estimate the rotor profile-drag losses.This estimation was accomplished by use of a specificairfoil drag curve as represented by a power series.The drag curve used corresponds to that employed In theexample of’reference 3, but the resulting values ofrotor profile drag were decreased about 10 percent toprovide a better approximation to the characteristicsof the smooth seotlons being considered in the presentStudy . In a strict sense, a different combination ofpitch and ir~low velocity &hould be determined for eachsection, particularly for the rough conventional section,because of the difference in required power input; how-ever, the effects of such changes in the combination ofpitch and inflow velocity are negligible except in casesIn which the retreating tip-section angles become highenough to produce excessive drag. The effect of anextreme change in power input and in the resulting combi-nation of pitch and itilow velocity may be noted byreferring to the example given in the appendix; thisexample compares the rotor profile-drag losses when15 square feet of parasite-drag area and zero parasite-drag area are successively assumed at a relatively highforward speed.
The normal and tangential components of velocityrelative to a blade element were obtained from the fol-lowing expressions, which are modifications of equa-tions (9) and (9) of reference 5:
%=K1+x
up = K2 + K3X
K2 = A +$q+ (-PO +5432 ) cos * +*2 sin *+ *pa~ cos 2*
+ +Pbl sin 4 +*2 cos X +*2 sin 3*

—
—-
12
.
.. . ..
I
NACA ACR EO. “I@5
- 2a2 sin w
and a.s al, a2”, b~~ and b2 represent coefficientsin the Fourier series expressing the blade flappingmotion,
In reference 6 the angle of attack
1s shown to be equal to e + tan-l ‘~
analysis, the tangent was assumed equalradians; hence, the angle in degrees is
Values of ~ were calculated at every
of an element %?
In the present
to the angle In
10° azimuth and
at intervals-of O.lR over ‘theblade radius, so thatvaluas were pr~vicied at a total of 36d points on therGtor disk.
~rofile.drag ower loss.- ‘The rate of profile-drag+bnerg~ssipat~oll or—a~de element of unit length i.s
the product of the drag and the relatlve velocity, or
()uT$)~ 2 f2RPo=*p— hoc% &Cos q
For the conditions of operation covered byanalysis, a negligible error Is introducedsion of Cos Q and the profile-drag powerof radius becomes
the presentby the omis-10ss per foot
P. = &(~]3 bc cd.
By using the assumed values of solidity, blade radius,and tip spged, there is obtained in foot-pounds persecond per foot o: radius
P. = 334soooq3c~ (3)
In order to obtain the total power for a given airfoil,the drag coefficient corresponding to the calculatedangle or attack at each point in the disk Is used succes-sively in equation (3). The aetalls of the integrationof the 360 values are omitted.
.— —-. -—.-- -— - 1

— ..-—
NACA ACR No.
In order
@05 1~) 13
to obtain curves of profile-drag power loss—against weight, calculations of angle of attack and energyloss were carried out for five values of
r0SS weight.
- .-.- Ths”rssultimg-AcurVeB are shmn in figure- . The valuesfor the rough airfoil obtained analytically are includedfor comparison with the values obtained graphically. In
I order to permit such calculations, the drag curve offigure 1 for the rough airfoil was made to have, up toan angle of’attack of 10°, the sme form as that of theexample given in reference 3; Iiha ordinates were, however,increased 28 percent in order to make the desired allowance
m for surface roughness. Values of D/L obtained asdescribed in reference 3 could thus be used after beingincreased 28 percent.
Calculation of Range and Endurance
By using the average profile-drag loss in horsepower,as given by figure 4, for the range of weight from3140 pOunds tO 2830 pounds, the average total rotor draglosses for each airfoil section may be evaluated asfollows:
Parasite 16.6 16.6Induced
t;.; 3399
Profile . 27.3
Total 97.8 77.8——
SmoothNACA 3-H-15.5
70.5
By assuming a specific fuel consumption of 0.55 poundper rotor horsepower-hour, the values of range andendurance are
xRange, milesEndura~ce,
hours
as follows:
Ro~hconventional
320
5.8
SmoothNACA 23015
793
—
*OO th.NACA 3-H-13.5
#
.—.
14 NACA ACR NO. J@05
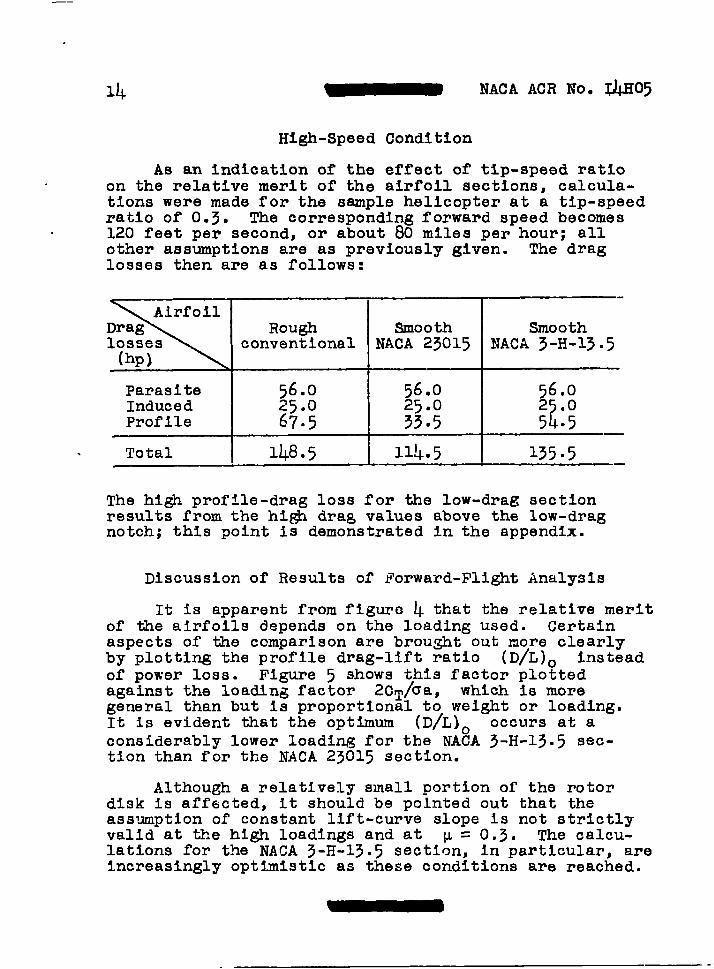
Hi@-Speed Condition
As an indication of the effect of tip-speed ratioon the relative merit of the airfoil sections, calcula-tions were made for the sample helicopter at a tip-speedratio of 0.3. The corresponding forward speed becomes120 feet per second, or about 80 miles per hour; allother assumptions are as previously given. The draglosses then are as follows:
Drag %UOOth Smoothlosses conventional NACA 23015 NACA 3-H-13.5(hp)
Parasite 56.0 56.0 26.:Induced 25.0 25.0Profile 67.5 3395 ?5 :5
. Total I 148.5 I 114.5 I 135.5
The high prof’lle-drag loss for the low-drag sectionresults from the hi@ drag values above the low-dragnotch; this point is demonstrated in the appendix.
Discussion of Results of Forward-Flight Analysis
It is apparent from figuro 4 that the relative meritof the airfoils depends on the loading used. Certainaspects of the comparison are brought out more clearlyby plotting the profile drag-lift ratio (D/L).of power loss.
insteadFigure 5 shows this factor plotted
against the loading factor 2CT/ua, which is moregeneral than but is proportional to weight or loading.It is evident that the optimum (D/L) occurs at aconsiderably lower loadin,gfor the NASA 3-H-13.5 sec-tion than for the NACA 23015 section.
Although a relatively small portion of the rotordisk is aff6cted, it should be pointed out that theassumption of constant lift-curve slope is not strictlyvalid at the high loadings and at p = 0.3. The calcu-lations for the NACA 3-H-13.5 section, in particular, areincreasingly optimistic as these conditions are reached.
.—-. — -—.-—
15
CONCLUSIONS
The effect of modifications in the airfoil sectiondrag characteristics, as indicated by the theoreticalperformance analysis made for the sample helicopter, maybe summarized as follows:
1. The use of the section characteristics taken asrepresentative of a smooth conventional section insteadof those taken as representative of a rough conventionalsection resulted in an increase of approximately 9 percentIn the rotor thrust available with fixed shaft power inhovering, an increase of 25 percent in range and endurance(with equal fuel load) at cruising speed, and a reductionof 23 percmt in the power required at a relatively highforward speed (8o mph; tip-speed ratio, 0.3).
..
2. The use of the section characteristics taken-as . .representative of the low-drag airfoils of NACA CBNo. 3113 instead of those for the smooth conventionalssction resulted in a further increas~ of approximately5 percent in the rotor thrust available with fixed shaftpower in hovering and an additional increase of 10 per-cent in range and endurance at cruising speed; however,at the high-speed condition, an increase of approximately18 percent in the power required was indicated.
3. If the losses shown for the low-drag section athigh speeds and at moderate speeds and high loadi~s areto be avoided, the low-drag section must be designed toprevent tke extreme rise in drag coefficient at thehighhr angles of ~ttack exhibited by the low-drag sectionsof NACA C13~0. 3113.
Langley Memorial Aeronautical LaboratoryNational Advisory Committee for Aeronautics
“Langley Field, Va.
-.

16 NACA ACR NO. I@@
APPENDIX
CONDITIONS OF’OPERATION ENCOUNTERED BY TBE BLADE
SECTION AND EFFECT OF VARIATIONS IN ASSUMPTIONS
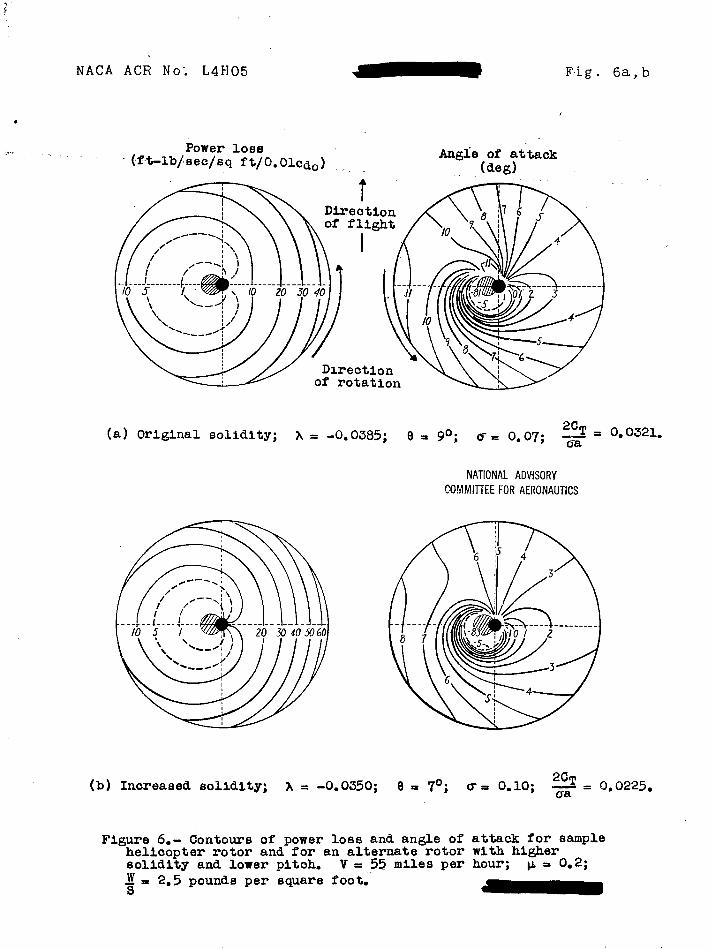
Contours of angle of attack and power loss.- In orderto make the reason for the results obtained in the forw_ard-flight analysis more evident, contours of ~L@e of attackand power loss were prepared. The source of tne valuesof section angle of attack has already been sufficientlyexplained. In order to show the relative importance ofa given increment in drag coefficient in the differentparts of tinerotor disk, the expression previously givenfor power loss per foot of radius was modified by dividingby the area of the anqulus at the appropriate radius; theresulting expression for tinepower loss in foot-poundsper second per square foot of disk area for a profile-dragcoefficient of 0.01 is
3P. = 26.60 +
Contours for the set of conditions initially assumedare shown in figure 6(a). Figure 6(b) shows the effecton the contours of’increasing the assumed value ofsolidity. Changes in loading produce similar effects,since the higher solidity 1s comparable with lowerloading. Contours for the original solidity but forv = 0.3 (v= 80 mph) instead of p = 0.2 (V = 55 mph)are shown in figure 7.
Weighting curves.- Th9 contours In figures 6 and 7indicate that a g!ven increment of profile-drag coeffi-cient is more lm.portant at low than at k.igh sectionangles of attack. It is difficult, however, to judgethe significance of certain factors - for example, theabrupt rise In drag coefficient at high angles of attackshown for the NACA 3-H-13.5 section (f’lg.1). In orderto permit more rapid quantitative judgement of suchfactors, the data may be combined for tie two sets ofcontours into a single curve showing the relative impor-tance of different parts of the curve of airfoil section,.profile-drag coefficient against section angle of attack.‘~ls weighting curve is de~lgned to
L
show th= amount by
.-—. — . .. ..-. —— .. . ,,, -..,.- , m 1

. . — —
-.
NACA ACR NO. 4H05 \~)
-which the power oonsumed in overcoming the profile dragof all the blade elements operating at any particularangle of attack is increased if the airfoil seotion dragcoefficient corresponding to that angle of attaok isincreased by some convenient increment, for example, 0.01.Suoh a curve has the further merit of permitting rapidcalculation of total power for any airfoil section; it Isnecessary only to multiply the ordinates of the curve ofprofile-drag coefficient against angle of attack charao-terlstio of the airfoil section by the ordinates of theweighting curve and obtain the area under the resultingcurve .
Ih order to obtain such a weighting curve, the range
a gz~n range of angle ~f atta$~ “ ‘0 ‘2) ~rowh which
(or ranges) of azimuth angle
!
ar)
~ tO ar2 was
maintained was determined for a gl en ~adlus by using aplot of anglo of attack against azimuth angle for thatradius. The process was repeated for successive rangesof angle of attac”~until the er.tire circumference wasaccounted for. The appropriate a~rage %%lue of uT3for each range of azimuth angle was then read from a
plot of um3 against azimuth angle. Ordinates for the
weig.htlng ~urve for the specified radius wereby means of tke expression for the energy perdegree angle of attack per foot of radius
where ~ IS the average value of W3 for
&hen obtabdsecond per
the rangefrom ~’ to *2. It wa8 found that increments of a~leof attack of 0.2° provided ample detail in the finalcur= ,
The process was repeated at intervals of O.lR overthe blade radius. The resulting weighting curves forrepresentative radii and the o-r-all weighting curveobtained by a summation of the curves at the variousradii are shown In figure 8 for p = 0.2. Values ofpower obtained by use of the curva of figure 8 and othervalues obtafnod from each of a number of other weightingcurves were checked against corresponding values obtainedby the more laborious point-by=polnt method alreadydescribed, and the answers agree within *0.5 horsepower.
L —. -—. -. — — -—. _-
18 NACA ACR No. 14H05
In order to permit ready application of the weightingcurves to rotors differing from the sample rotor in chor~radius, or airfoil section and likewise-to rotors oper-ating at different tip speeds and altitudes, the curveshave been plotted In nondimensional form. The use of’thecurves for calculation of the profile-drag loss for aparticular rotor and a particular airfoil section involvesthe following steps:
(1} Multiply the ordinates of’the weighting curveby the ordinates of the curve for airfoil section profile-drag coefficient
(2) Multiply the resulting ordinates by 100 to allowfor the fact that the weighting-curve ordinates were mgiven for
c%= 0.01
(3) Obtain the area under the result ing curve andthus obtain the total value of cp/r3
(4) Multiply the value of cp/u by the factor
#3*5
550
Steps (2) and (4) may of course be combined; the factorfor the sample rotor is then
100 X 0.07 X 0.002378 X (20)3 X ~ X (20)5 =550
2.43 X 10⁶
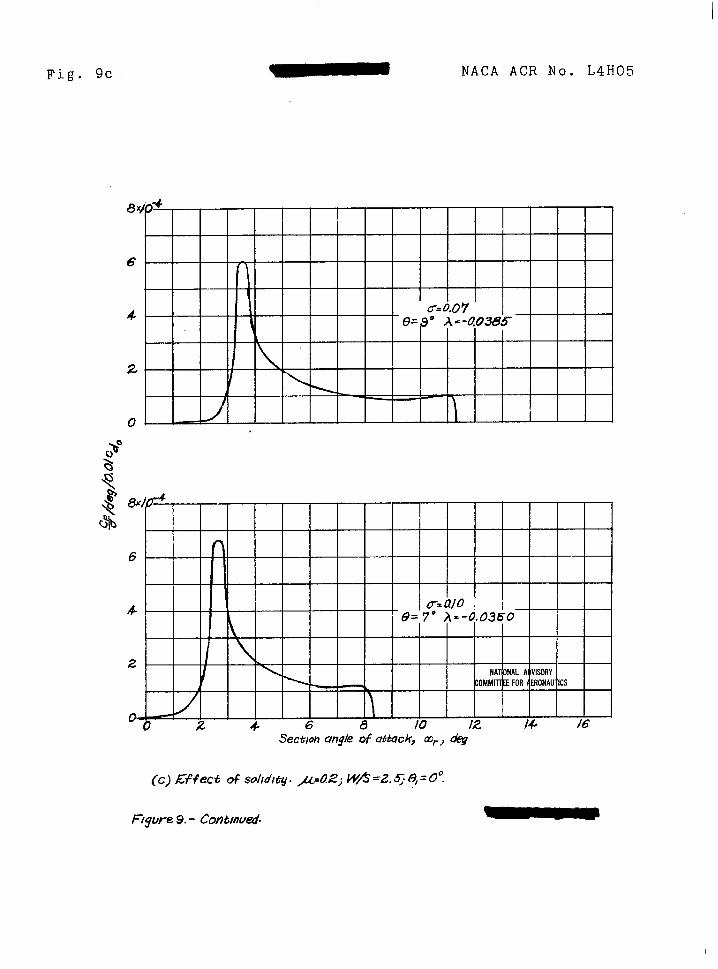
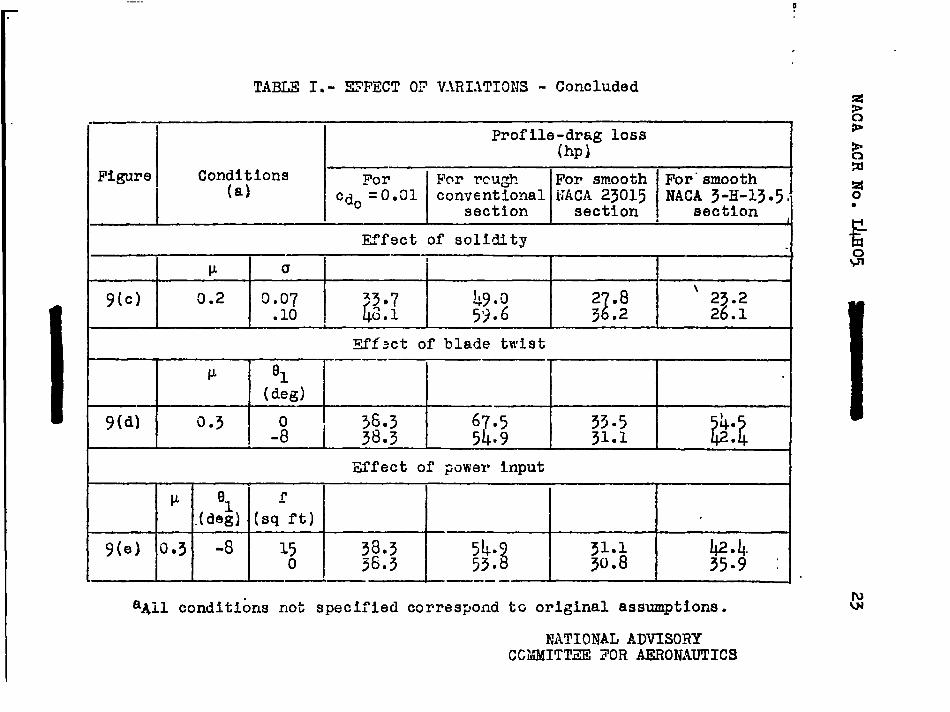
Effect of variations in helicopter characteristicsand flight conditions.- The weighting curves provide aconvenient means for indicating the effect of changes inassumptions on the airfoil requirements. The effects of’tip-speed ratio, loading, solidity, blade twist, and powerinput are thus indicated in figure 9. Correspondingprofile-drag losses for the drag curves under considera-tion are given in teble I.
Source of losses indicated for low-drag airfoil.-Comparison of the weighting curves of figure 9 with theprofile-drag curves of figure 1 shows that, for theconditions in which the low-drag airfoil shows lossesinstead of gains, these losses result from the extremelyhigh values of profile-drag coefficient at the high angles
.—.— .. . . .. .— .. . —.. —-— ..- —. - ,-

19
of attack. The point Is brought out more clearly in fig-ure 10, which shows the curves that result from mmltl-
- -. plying the drag curves-of--~iY
e l..by.~he .c.orreap~~dhgweighting curves of figure 9 a) for ~ = 0.3.
Preltilnary results (unpublished) of additional low- “drag airfoils intended to reduce these losses at high .angles of attack Indicate that considerable progress maybe expected.
Conditions of operation ignored in analysis.-Simpl~g assumptions or procedures, which have beenused in the analysis but have not been discussed and may-be suspected of endangering the validity of the compari-sons made, include:
(1) Use of statically measured section character-istics with no allowance for effects due to rotation
(2) Assumption of uniform inflow veloclty (forward-flight analysis only}
(3) USe of section charactgristlcs corresponding to .a single Reynolds number and a single Mach number asapplying at all points on the rotor disk
(LL]Neglect of’effect of’angles of yaw on sectioncharacteristics
Past experience indicates that airfoil sections usedin rotating blades exh~.bit characteristics similar totheir statically measured section characteristics. Pos-sible effects on the characteristics of the low-dragsections are conjectural.
The effect of nonuniformity of’inflow velocity wasexamined in reference 6, and It was concluded that thenet effect on the rotor forces was secondary.
T& method of analysis used would permit study ofitems (3) and (4), or even inclusion of the effects inthe analysis if such were deemed desirable and if suffi-cient section data were available. Although the data athand are insufficient to permit complete calculations,it is of interest to note the magnitude of the variationsof Reynolds number, Mach number, and angle of yaw. “
20
— —.
NACA ACR No. I@~
The Reyn?lds number, which was taken as approxi-
b in choosin the drag curves, actuallymately 3 x 10
varies from O to 4.5 x 10E in a typical case. The value
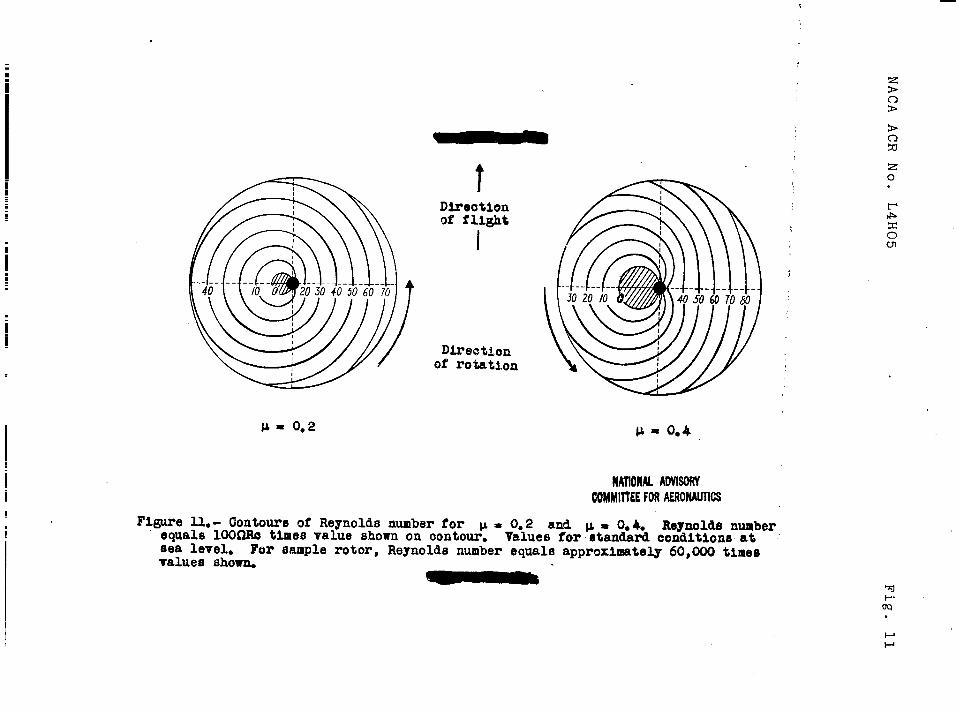
2.8 x 10⁶ corresponds to the mean value at x = 0.75wk.enthe number of blades is taken as three. Fibmre 11shows the variation of Reynolds number over the rotordisk for two tip-speed ratios. Radial components ofveloclty are ignored. Comparison with figures 6 and ‘~indicates the regions in which the greatest dif~erencesmight result if the drag tunes were varied with Reynoldsnwber.
The contours of figure 11 may also be used in esti-mating Mach numbers. For tiiispurpose, thg values shownon the contours should be multiplied by O.~OOOl@l. Forthe sample rotor in”forward flight, ~R = 400; hence,the Mach number is approximately equal to the value shownon the appropriate contour line times 0.0056. For= 0.2, the maximum tip Mach number is thus O.!@ at
;“ 900 and the minimum is 0.28 at W = 2700.
The variation of angle of yaw over the rotor diskat a tip-speed ratio oi’0.2 is shown in fig~re 12. ‘I’hesame contours can also be applied to any value of pabove 0.2 by placing a new outer boundary at a radiusequal to 0.2/p times the original radius; the tipcircle for v = O.~ has been drawn in as an example.It is of interest to note that the regions which appearin figures 6 and 7 to be the most critical - that is,the region of high pow~r loss per unit drag coefficienton the advancing side and the reg~on in which tip stallingis approached on the retreating side - include relativelylow an~les of’yaw.

NACA ACR No. L@05 “ \~~ 21
---REFERENCES
.,. . .
1. Tetervln, Neal: Tests in the NACA Two-DlmenslonalLow-Turbulerme Tunnel of Airfoil SectIons Des@nedto Have Small Pitching Moments and High Lift-DragRatloa. NACA CB No. 3113, 1943. .
2. Knight, Montgomery, and Hefner, .Ralph A.: StaticThrust Analysis of’the Lifting Ai.rscrew. NACA TNNo. 626, 1937.
3. Bailey, F. J., Jr.: A Simplified “Theoretical Methodof Determining the Characteristics of a LiftingRotor in Forward Flight. ?JACARep. NO. 716, 1941.
4. Bailey, F. J., Jr., and Gustarson, F. B.: Charts forEstimation of’the Characteristics of’a HelicopterRotor in Forward Flight. I - Profile Drag-LiftRatio f’GrUntwisted Rectangular Blades. NACA ACRNo. L4H07, 1944.
5. Wheatley, John B.: An Analytical and ExperimentalStudy of the Effect of’Feriodic Blade Twist on theThrust, Torque, ana Flappi~ Motion of an AutogiroRotor. NACA Rep. No. 591, 1937.
6. Wmatley, John B. : An Aerodynamic Analysis of’theAutogiro Rotor with a Comparison between Calculatedand Experimental Results. NACA Rep. No. 487, 1934.
\\

w
TABLE 1.- EFFECT OF VARIATIONS IN HELICOPTER CHARACTERISTICSAND FLIGHT CONDITIONS
Profile-drag loss(hp)
Fi@u% Conditions For For rough For smooth For smooth’(a) cdO=O.O1 Conv:v;:nal NA::c:~::5 NACA 3-H-13,5
sectionl
Effect of loading (hovering flight),
W/s(:) (d~g)
1“55 ‘79(al : ;. 3 13
30.2 33.’7 21.4 16.0
&;:.: 50.5 28.2 ll@
o . 19 G 94.2 42.3 204. i!
Eff’ectof tip-speed ratio
Wls NATIONAL ADVISORY(:) (d&) COMMITTEE W i AERONAUTIC
2.5
9(a) O:; ;.;10.3 30.2 40.6 23.
k8
l&233.7 9.0 27. 2.2.
. 38.3 7.5 33.5 i5 ●5
Effect of loadingI
P w/s
9(b) 0“2 ::;3397 f.: 25.
i18.2
33.7z
27. 2 .23.1 33.7 5 ;8 31.3 i5 93
aAll conditions not specified correspond to original assumptions.
k!
bAJl values given for = O are for tip speed of @O fps to pezmitcomparison with val~es for forward flight.

Ii—
TilBLE
1
I.- WTECT 0?
.——— —
VIRI.ITIOHS . C~~cl~ded
..—.—
Effect of p~~r~~~> input
III
P gl; f I
,(dsgj (sq ft)
t-
.—_ ...._
9(e) 0.3 Jj1 -_.1+.
i+- ~~.~-~”~$q 31.155.3 &. 3U.8 / 35:9 ~-— —-—— — .——.- —___——....--4...—.—...——_ —-
a~il conditions not specified correspond tc origlrial assumption .
NAT’10K4.LADVISORYCC?tiflI’TT2EFOR .A13RONiiUTICS
i,, NACA ACR No. L41-105 ,. Fig. I
.14
./2
.//
./0
.07
<03
.&
.0/
o
(smooth) I!r
/ 1’
//’
/ / /
///
/! I
/( I
) 1/ / I
I / I1
‘&oFo:;;yl 1I
. J..- “
.e-“a0-
.- -/
H4 NACA 230/5--------- ---- .~ 4 (smoofh)-- ----- --.-- ----- - 4“ —“ -
- NhrIONAL/OVISORV- -:
—
o 2 +G@fO /214 “/6’Sec+iona~qk of diack (u6s), a. , deq
F/9ure 1. ‘Boflle-draq curves used in the anqlp{s.

Fig. 2 NACA ACR No. L4H05
/6
/2
0
4
0
ang!e, @
(@g)
\
o .2 4“.6 .8 Lo L
F/guye
hekopfer

NACA ACR No. L4H05 Fig. 3
300 .3@ w 4?~ 460 300 K@ J&) 620~p spee~ fps
Fqure 3.- Rotor thrust fbr 260 SM horsepmw &wp4s hetjc~ber w iwermgflight .

I
Figs. 4,5 NACA ACR No. L4Ji05 -
Adi?ll! Y.lahQd
GqY%Caf+60 Ro~h convent?ona/ Amlytml
Smcvth IW43-H?5 Graphtcdj’ a- @ - /sqwth A!4C423015 Gra#vcti
E -
40s- / / 7
NATIONALADVISORYCOMMllTEEFORAERONAUTICS
&
$20 ,/ ‘
t
/ “
o/m 2(2W Z4@ Zm 3= 3@o 4om
(%-0ss weigM,lb
Figure 4.- R&cW, pro fde-drag A2SS for a nmge of gttm wwght.SatnpJe hdcqeter; p-az.
~/;Oi!;.;~.:;0::::;.16 )-9 2+2 2!5 2,8 3/ W/S (7b/.qf@
i! - J4,[email protected]
Q
1!
~ #Rough Convem%n%d- ~ _ - Rouqh conventmal
* )nc&h Nil CA 3-H-135
~ .08 -/smooth NACA 23015
k’+
\ ~
* NATIONALADVISORY* ~ . / COMMITTEEFORAERONAUTICS<.04
2a
,
0.020 .024 .028 ,032 .03’6 .040
Z CJua
/%th2d
Figure 5.- I&or @fj@ drq-hft ratio as affected by loQdIngSample hell~pt@Y POtOr j+=~. 2.
.
NACA ACR No”. L4H05 Fig . 6a, b
●
✞✍✌Power10ss
(ft-lb}sec/sqft/O.Olcdo) Angieof attack(deg)
(a) Original solldlty; A = -0.0385; 0=90; 6=0.07; q= 0.0321.
NATIONALADWSORYCOMMITTEEFOR AERONAUTICS
‘)~,/----:/ >,\
11 Y‘--y ]--/---.;-.. -----------
105{ 20 3040-5(iioj)‘\ ~,~-,,
\\ 1/
-.-_#.y
(b) Increased solidity; A e = 70;2CT
= -0.0350; 0-= 0.10; — = 0,02250csa
Figure 6.- Contours of power loss and angle of attack for samplehelicopter rotor and for an alternate rotor with highersolidity and lower pltoh. V = 55 milesPer hour; ~ = 0.2;w’_ . 2,5 pounds per square foot;3

Power lotifa(ft-lb/sec/sqft/O.Olcdo)
/Dlreetionof fllght
AngleOr attack(deg)
Dlreotionof rotation
NATIONALAOVISORYCOMMITTEEFORAERONAUTICS
Figure 7.- Contours of power loss and angle of attack for sample helicopter—w
rotor. V* 80 miles per hour; w = 0.3; ~ = 2.5 pounds per square foot.
A2CT
= -0.0695; 0= llO; c= %07; ~= O.ospl. zo.

NACANACR No. L4H05 ,.’ Fig. 8
h-. . .

“1
Fig. 9a NACA ACR No. L4H05
if” S%/o=+
4n
4/&L.u.23
e =9° A=”o.o 385 ‘~b 4
\,
2/
o-
6dd
\
J4=Q.3e =It” ~= -LM69 5
4
\2 1
\ NAIONALA[VISORY30MMlllEEFORAEN
A -— \
>
24 6 8 10 12 !4 16Sectwn angle of attach Wp, de.g
(i?] Effect of hlp-speedn?tio. W/S =2.5@=~.0% t?‘O! ~

. . .
.
NACA ACR No. L4H05 h Fig. 9b
,—
43*+
“-6n ,..,
\4
2
0
6xA74
nw/s =3./
4 e=m A~-0.o+69
\I
\NATONALM VISORV
20 YIMMIIT Z FORAXONAUICs
/
~. .
0 ?‘4 6 8 M )2 I% /6
SectIm ~/e of Uitac$ ~rj dq
(b) Ef feet of Awd.wg. #&G,Zi o=i20fi 6j =0?
Figure 9.- Contmuzd.
I
F’ig. 9C NACA ACR No. L4HO!5
$p We$$
P6
4 I c. (?/0@= 7° A=-o .03;0
11 wNAT3!IALA VISJ3RY
— — , COMMITIEEFOR!ERONAUw
4 6 8 to i2 14 /6Sec+lonangl? of otback~ c+, O@
I 1 [l I I I I 1
2
(c)Effect &soJldtty. ~=OZj Wb=z, qq=OO.
Figure 9.- Contmd. ~

NACA ACR No. L4H05
. ..
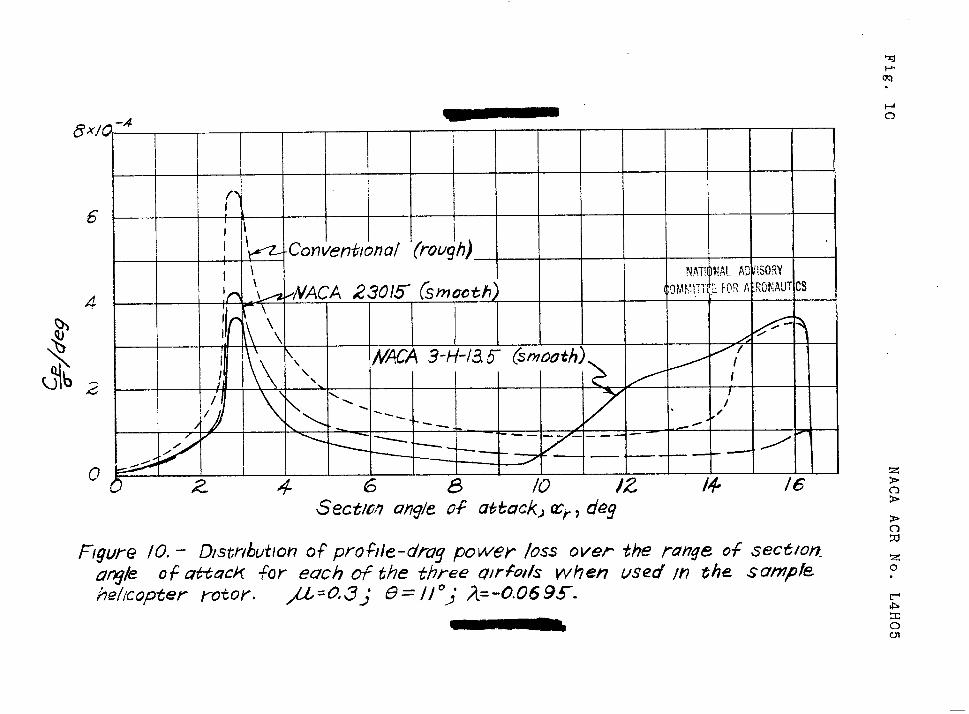
F/gut-e 10*- Dwributlon of pro ftie-drag power loss over the nwge of secewaqk of Qtt~c& +ar euch of the three arfds whefl used in the s umpfe
Akopter rotor. /U=O.3; 6=/j”; ~=-O.Q695.
zo.
I
iI:
NATIONALAOVISORY00MMHW FORAERONAUTICS
t
DiroutionOf fught
I
Figure 11.- Contoursof Reynoldsnumber for v = 0.2 and ~ = 0.4. Reynoldsnumberequals1000Rotimesvalueshownon oontoureValuesfor-standardcenditlonsatsealevel. For Bample rotor, Reynoldsnumber equalsapproximately69,000 tlrnesvaluea shown.
zo.
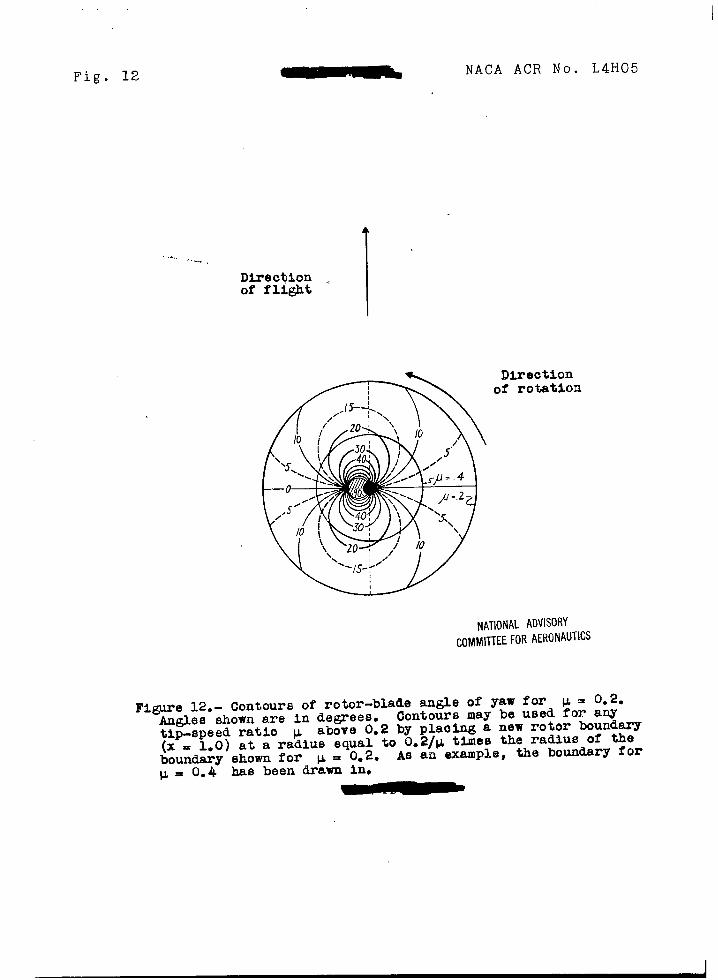
Fig. 12 NACA ACR No. L4H05
.-. ...
Direction .of flight
1’
Directionof rotation
NATIONALAD’IfisOR’f
COMMIHEE FOR AERONAUTICS
Figure 12. - Cent.oursof rotor-blade angle of yaw for w = 0.2.Angles shown are in degrees. Contours may be used for awtip-speed ratio w above 0.2 by placing a new rotor boundary(x = 1.0) at a radius equal to 0.2/M times the radius of theboundary shown for w = 0.2. AS an example, the bo~~ry for~= 0.4 has been drawn in.
.—..
.—.
Figure
TABLE OF V.IRI.ITIONS- Concluded
Profile-drag loss(hp)
Conditions For(a)
%’orrcugh For smooth For”smooth
cd. =Ooill conventional EACA 23015 NACA 3-H-13.5section section section,
I Ef@fectof solidity
~f~ct Of blade t~yist—— .
P’ ‘1(deg)
9(d] ~93-:
36.3 67.5 33=538.3 i-d
k“
5499 31.1 ●
Effect of Power input
1 P 91 f.(deg) (Sq ft)
I9(8) 0.3 -8 15 38.30 36.3
I31.1 I 4-2.4.30.8 3599 :
———— - I
specified correspond tG original assumptions.
g
xl
NATIONAL ADVISORYCC?&lITTZEFOR AERONAUTICS