wim record copy · 2012-11-18 · traveltime curve and crustal velocity model for southern nevada ....
TRANSCRIPT

WIm RECORD COPY
-* ~~~~~~~UNITED STATES DEPARTMENT OF THE INTERIOft
GEOLOGICAL SURVEY
'A SEISMIC STUDY OF YUCCA MOUNTAIN AND VICINITY, SOUTHERN NEVADA;DATA REPORT AND PRELIMINARY RESULTS
BY
Lynn R. Hoffman and Walter D. Mooney
Prepared by the;
U.S.GEOLOGICAL SURVEY
for theNEVADA OPERATIONS OFFICE,
US-DEPARTMENT OF ENERGY
(Interagency Agreement DE-AI08-78ET44802)
OPEN-FILE REPORT 83-588ThIs report (map) Is preliminary and has not been reviewed for conformity with
U.S.Geological Survey editorial standards (and tratigraphic homenclature).Any use of trade names Is for descriptive purposes only and does not mply
endorsement by the U.S.G.S.Menlo Park. Caifornia
1984

UNITED STATES DEPARTMENT OF THE INTERIOR
GEOLOGICAL SURVEY
A seismic Study of Yucca Mountain and Vicinity, Southern Nevada;Data Report and Preliminary Results
Lynn R. Hoffmanl and Walter D. ooney2
Open-File Report 83-588
Prepared in cooperation with the Nevada Operational OfficeU.S. Department of Energy
(Interagency Agreement DE-AI08-78ET44802)
The report is preliminary and has not been reviewed for conformity with U.S.Geological Survey editorial standards and stratigraphic nomenclature.
1. U.S.G.S., Pasadena, CA 911252. U.S.G.S., Menlo Park, CA 94025
1984

CONTENTS
PageAbstract ....................................................... 0.......... 3Introduction .................. ....... a................................ 4Acknowlegments .......... .... ............ *...... 7Instrumentation and Field Operations ............... ........... 8
Seismic Recorders ............ .. .............................................. 8Deployment ...................................................... 8Data Reduction ...... .............................. ............ 8Logistics .......... ............................................. 9
Observations ............ .... .... 0............... .................. 10Seismic Profiles ........................ . .24.................. .. 10Traveltime Delays ........ ....................................... 16Rock Velocities ................................................ 16
Interpretation .eis.i..ec.rder Locati ............ .......... 1P-wave Delay Data ............................................... 19Shot Point 4 Profile .. . ... .. .. . ...... ...................... . ........... 21Shot Point 3 East Profile ............... .......... ............ 24Summary .................................................. ............ 24
References ................................................................ 25Appendix A: Seismic Recorder Locations .................................................. 26Appendix B: Master Shot List and Team-Shot Data Sheets with
Tape Grade Scale .......................................... ..... ...... 32Appendix C: First Arrival Times B ....................................... # ............ 45
ILLUSTRATIONS
Figure1. Recorder and shot locations for nuclear event deployments ... .... 52. Recorder and shot locations for shot point 4 deployment ......... 63. Nevada Test Site shot point 1 - Normalized record sections ...... 114. Nevada Test Site shot point 2 - Normalized record sections ...... 125. Nevada Test Site shot point 3 - Normalized record sections .. o... 136 T-X/6 (sec) traveltimes for shot points 1 and 3 with 10 mgal
Bouguer gravity contours (2.67) reduction velocity .............. 147. Nevada Test Site shot point 4 - Filtered 2-10 Hz record section . 158. Velocity model for P-wave delay data ............................ 179. Ray diagram for shot point 4 data .............. .............. 20
10. Velocity model for shot point 4 data ........................... 2211. Traveltime curve and crustal velocity model for southern Nevada . 23
TABLE
Table 1: Density-velocity relationship . ............................. 19
PLATE
Plate 1: Nevada Test Site numbered recorder site locations
2

3
ABSTRACT
From 1980 to 1982, the U.S. Geological Survey conducted seismicrefraction studies at the Nevada Test Site to aid in an investigation of theregional crustal structure at a possible nuclear waste repository site nearYucca Mountain. Two regionally distributed deployments and one north-southdeployment recorded nuclear events. First arrival times from thesedeployments were plotted on a location map and contoured to determinetraveltime delays. The results indicate delays as large as 0.5 s in the YuccaMountain and Crater Flat areas relative to the Jackass Flats area. A fourtheast-west deployment recorded a chemical explosion and was interpreted using atwo-dimensional computer raytracing technique. Delays as high as 0.7 s wereobserved over Crater Flat and Yucca Mountain. The crustal model derived fromthis profile indicates that Paleozoic rocks, which outcrop to the east atSkull Mountain and the Calico Hills, and to the west at Bare Mountain, lie ata minimum depth of 3 km beneath part of Yucca Mountain. These results confirmearlier estimates based on the modeling of detailed gravity data. Amid-crustal boundary at 15 + 2 km beneath Yucca Mountain is evidenced by aprominent reflection recorded beyond 43 km range at 1.5 s reduced time. Othermid-crustal boundaries have been identified at 24 and 30 km and the totalcrustal thickness is 35 km.

4
INTRODUCTION
During the spring of 1980 and 1981, the U.S. Geological Survey conductedpreliminary seismic refraction studies in the vicinity of Yucca Mountain,Nevada. The purpose of the study was to determine variations in thenear-surface velocity structure of the upper crust which will aid in assessingthe feasibility of nuclear waste storage in this area. These variationsconsist of changes in depth to a prevolcanic (pre-Tertiary) surface and in thethickness of near-surface lithologic units. In combination with othergeophysical data, these variations can be used to derive cross sections of theuppermost crust that are important to structural, tectonic, and hydrologicanalysis of the area.
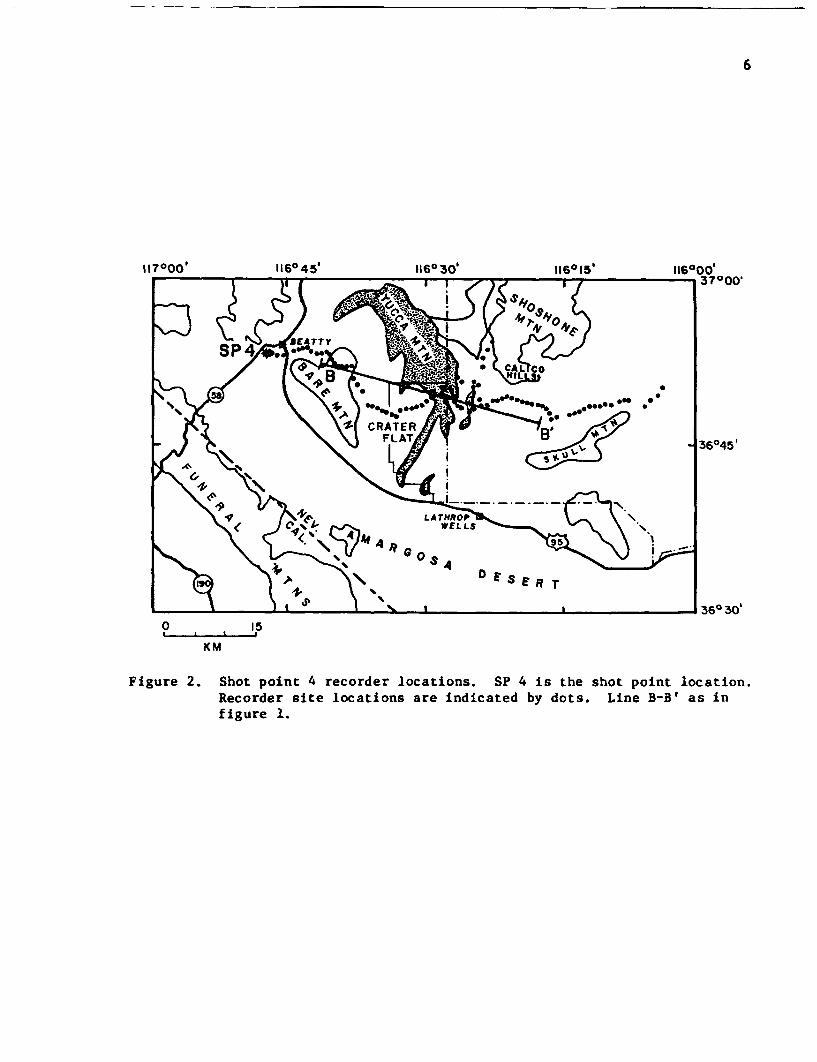
Portable seismographs were deployed near Yucca Mountain and threeseparate nuclear events were recorded. Figure 1 shows the locations of therecording equipment and the nuclear events that were used as seismic sources.To better constrain the velocity structure of the uppermost crust anddetermine field parameters for a future detailed study, an east-west profilewas deployed in April 1982. It extended from a shot point southeast ofBeatty, Nevada, across Yucca Mountain to the Skull Mountain area of the NevadaTest Site. Figure 2 shows the recording locations and the shot point for thisadditional deployment. Data with clear first arrivals and a high signal tonoise ratio were recorded from all four sources. P(compressional)-wavearrival times can be determined on the records to an accuracy of 0.02 s.

116 045'
Figure 1. Recorder and shot locations for nuclear event deployments.Recorder site locations are indicated by dots, nuclear events bystars, selected drill holes by triangles, and shallow seismicrefraction profiles by double circles. B-B' indicates thereferenced gravity study of Snyder and Carr (1982).
6
117000'
KM
Figure 2. Shot point 4 recorder locations. SP 4 is the shot point location.Recorder site locations are indicated by dots. Line B-B' as infigure 1.

7
ACKNOWLEDGMENTS
This investigation was initiated by J. H. Healy; we are grateful to himfor his encouragement throughout all stages. We wish to express our appreci-ation to S. K. Gallanthine, W. M. Kohler, W. J. Lutter, J. N. Roloff, V. D.Sutton, A. W. Walter, and S. S. Wegener for their diligent work in recordingdata from the nuclear events. Thanks are extended to J. M. Bonomolo, E. E.Criley, R. P. Meyer Jr., R. M. Kaderabek and G. A. Molina for their field workin connection with the fourth deployment. A. L. Boken's graphical ray tracingand R. 0. Colburn's two-dimensional computer raytracing of the Beatty-SkullMountain line is greatly appreciated. H. W. Oliver and D. B. Snyder providedvaluable advice and assistance in planning the field work at the Nevada TestSite, and have suggested improvements to the text.

8
INSTRUMENTATION AND FIELD OPERATIONS
SEISMIC RECORDERS
One hundred portable seismic recorders, each weighing approximately 40pounds and powered by two 6-volt rechargeable batteries, recorded the data inFM-analog form on 30-minute cassette tapes. The instruments were divided intofive sets of 20 units each. Five observers were responsible for the mainte-nance, deployment and accurate site location for each of the 20 units in theirdesignated set.
These seismic recorders allow much flexibility in deployment. They donot record continuously but are preprogrammed with up to ten recording times.The recording time window can vary depending on how many times the unit is torecord for each thirty-minute side of tape. Instrument electronics beginwarming up ten minutes prior to each recording time. Prior to the expectedenergy arrival time, the unit will perform a geophone release, anamplification check and a calibration sequence of , 10, 100 and 1,000 mv,with a 10 Hz signal. These are recorded on the cassette and can be referencedduring data processing for the evaluation of performance quality of theinstrument. Following the calibration sequence, the unit begins to recorddata. The geophone is a vertical-component velocity transducer with a naturalresonance frequency of two cycles per second and a motor constant of one voltper cm/s. Three data channels are used, each with a different, pre-setamplifier gain. Maximum gain is approximately 104 db; minimum gain is db.In addition, IRIG-E time signals from the internal chronometer and WWVB radiotime signals are recorded (Healy and others, 1982).
DEPLOYMENT
Since nuclear events do not always occur as scheduled, it was necessaryto program several large recording windows at estimated event times. Theseestimated times were essentially guesses based on a combination of thescheduled time of the event and experience from past recording attempts. Dueto the limited amount of tape in each recorder and the lack of field mobilityduring times of probable nuclear events, two units were placed at eachlocation with alternating recording times. This limited the data coverage tofifty locations, but resulted in the successful recording of the first twonuclear events. Continuous reprogramming of the equipment and added mobilityin the field area made it possible to occupy 100 sites to record the thirdevent.
A second complication resulting from the nuclear event delays was thatthe batteries on the recorders would run down, often causing instrumentmalfunctions. Where normally 100 sites are occupied with a 90% data recovery,the data return for these nuclear event recordings was less than 70X.
The shot time for the fourth deployment was selected by the seismicexperiment field staff and the recorders were programmed accordingly. A2,480-pound charge of ammonium nitrate was fired below the water table at alocation southeast of Beatty, Nevada. Data recovery in this instance was 85%.

9
DATA REDUCTION
Following each deployment, recording units were retrieved and severalpreliminary data processing steps were taken. All information pertaining tothe operation of the seismographs was entered on the team-shot data sheets(Appendix B). Shot information for the nuclear events was obtained throughpersonal communication with the Nevada Test Site Control Point. The shot timefor shot number four was picked from the shot record, a paper tape showingshot time and shot detonation. Recorder locations and elevations were deter-mined from the topographic maps. Chronometer corrections were calculated inorder to adjust for the clock drift at shot time. These data were enteredinto various computer files and used in conjunction with recorder informationfor digitizing. Following accuracy checks for errors in timing and sitelocations, the cassette tapes were digitized. Calibration settings were usedto compare data channels while digitizing and performance quality of therecorder was graded (Healy and others, 1982). Trace normalized recordsections were plotted using the standard reduction velocity of 6 km/s. (Intrace normalized plots, all seismograms in a record section have their maximumamplitude set to an equal trace width, thus producing a uniform appearance.)Some data from shot points I and 2 were plotted as fan shots with the firststation as zero distance and successive stations as a function of distancefrom that point. All lines are unreversed in that a shot was not fired fromthe opposite direction. Data from shot point 4 were filtered to remove somehigh frequency noise, and the data from some sites were omitted due tooverlapping traces.
LOGISTICS
When this project was initiated, very few roads penetrated the YuccaMountain area, making adequate coverage of the proposed repository sitedifficult. As the Yucca Mountain investigations continued more roads wereconstructed. By the 1982 deployment, the area could be covered fairly welland the east-west deployment line across the mountain was possible.
Due to this continuous road construction, the indicated roads ontopographic maps for Yucca Mountain and vicinity are very outdated. Recorderstations could not be as easily located as in normal field operations. Manysites had to be located using a Brunton compass, which tends to reduce theaccuracy in determining the location of the site. Where normally stationlocations are accurate to 25 feet, those along the unmapped roads have alarger error margin of 50 to 100 feet. All locations are indicated on Plate1, which is at a scale of 1:250,000. Location numbers on this plate are alsoindicated on the record sections.

10
OBSERVATIONS
SEISMIC PROFILES
Data for the first nuclear event, shot point 1, were collected in a shortnorth-south line and an extended east-west fan array (Figure 3). The secondnuclear event, shot point 2, resulted in a northeast-southwest line of dataand an east-north-east to west-southwest fan array (Figure 4). These data areof greatest value presented as delay time observations for apparent velocityanalysis.
Some of the most useful data from the nuclear event recordings wereobtained from the third nuclear event, shot point 3. Two lines deployed tothe east and west of Yucca Mountain provide the closest data to the proposedrepository (Figure 5). The distance from the source at Pahute Mesa to YuccaMountain is approximately 50 km, and at this distance all first arrivals arebasement (Pg) arrivals. The eastern profile, from Yucca Mountain to DeathValley Junction, was recorded at a distance of 48 to 110 km. Significanttraveltime variations in the first-arrival curve suggest delays in near-surface rocks that amount to 0.5 s in the Yucca Mountain area. In addition,clear reflections from the mantle and midcrust indicate layering within thecrust beneath Yucca Mountain. The western profile for shot point 3, fromYucca Mountain to the Amargosa Desert, was recorded in the distance range of52 to 86 km. The data along this profile also indicate 0.5 s delays in theYucca Mountain area and the northern data show a lower dominant frequency thanthose taken further south. This is due to the greater seismic attenuation atthe sites above thicker sections of tuff.
First arrival times (Appendix C) for shot points 1 and 3 were plotted ona location map in order to contour the reduced traveltimes in the area ofYucca Mountain. Some recorder locations were occupied for both events whichput better constraints on the traveltime correlation by enabling comparison ofarrival times from the two events. The larger delay times in the vicinity ofYucca Mountain and Crater Flat are interpreted to be due to the thicker sectionof low velocity layers (e.g., ash-flow tuffs and Cenozoic volcanic layers) inthat area . Figure 6 illustrates these delays and compares them with theBouguer gravity anomalies (Healey and others, 1980). Traveltime delays of 1.2
s or larger generally correlate with Bouguer gravity values of -140 to -170mgal, indicating that both the seismic and gravity data were affected by lowvelocity, low density volcanic material.
Data for shot point 4 (Figure 7), the chemical explosion near Beatty,Nevada, were recorded to a distance of 65 km from the shot point. Averagestation spacing along this profile was 1 km. The first arrivals are delayedover Crater Flat and Yucca Mountain by as much as 0.7 s relative to BareMountain. In addition to clear first arrivals, a prominent reflected(secondary) arrival was recorded beyond 40 km range.

NEVADA TEST SITE- SHOT POINT 1 NORMALIZED RECORD SECTIONS
_ Ntlo* t 0 N 9 I ( -0 0 0 0 0000 -O O 2 O °A'o- ON Cy N N cm N CY"1) r va fa@ 0 % 1
C.)wC,)
N.
xI-
5.0
4.0
3.0
2.0
.
0.0
DISTANCE (KM) FROM SHOT POINT 10 '0
Mt
000 o0 …o… 0 = 0 0 0 …N N N Y N NNCNN NN
0 N N0 I -CM N C4 = N - - 00 0 0
N - I
(I,
IDI-
- 5.0
- 4.0
3.0
2.0
1.0
0.0.0
0 10ml
DISTANCE (KM) FROM SITE 201
Figure 3. Nevada TestTop:Bottom:
Site - Shot point 1 normalized record sections.North-south line.Fan plot with recorder location 201 set at zerodistance and successive stations as distance from site201.

NEVADA TEST SITE- SHOT POINT 2 NORMALIZED RECORD SECTIONS
c0 40( aft e Oeco _ V v> *'I* 01'V. e I *I
in 40 400 0* *tv*I
Li.0
0
C,)
D
X-
0 10ml
DISTANCE (KM) FROM SHOT POINT 2
.
-
(n
CD
"I.x
0 s0ml
DI STANCE (KM) FROM SITE 490
Figure 4. Nevada TestTop:Bottom:
Site - Shot point 2 normalized record sections.Northeast-southwest line.Fan plot with recorder location 490 set at zerodistance and successive stations as distance from site
qAn
P.-t')

NEVADA TEST SITE - SHOT POINT 3 NORMALIZED RECORD SECTIONS
wU)
I-
5.0
4.0
3.0
2.0
1.0
0.0 .'0 10
ml
DISTANCE (KM) FROM SHOT POINT 3
Nn 9 N P U 40
It -t1* 1
e0 4040 40s.l' V)
N g 0.0 In 6 8 kN In In _ _ el = 0 0 o
n 0 0n 2
C)wC,)
CDN11
xI-
DISTAN C E (KM) FROM SHOT POINT 3
Figure 5. Nevada estTop:Bottom:
Site - Shot point 3 normalized record sections.Western line - Yucca Mountain to Amargosa Desert.
Eastern line - Yucca Mountain to Death Valley Junction.Expanded plots reveal emergent arrivals.

14
116e45' 1160037'r j i i - 1 I I / 7 I I 3700'
Figure 6. T-X/6 (sec) traveltimes for shot points 1 and 3 with 10 mgalBouguer gravity contours, 2.67 reduction density (Healey andothers, 1980).

NEVADA TEST SITE - SHOT POINT 4 FILTERED 2-10 HZ RECORD SECTIONBARE
BEATTY MTN.
1 * W 0 _, NOW Wl 0°
CRATERFLAT
in (0 P0(0(0(0(0ato (D j to V F {0 0 zDS 0 t0 r- N P-
YUCCA JACKASSMTN. FLATS
S ' '029 ; OC F ° N-N N - 0 C N N_ ONLD
SKULLMTN.
e' I n = 0 * M0 000 N
(d 0t5.0
-D
X
5.0
4.0
3.0
2.0
1.0
DISTANCE (KM) FROM SHOT POINT 4
Figure 7. Nevada Test Site - Shot point 4 Filtered 2-10 Hz record section.East-west line extending from Beatty, Nevada, to the Skull Mountainarea of the Nevada Test Site. Dots indicate first arrivals.
0

16
TRAVELTIME DELAYS
Since all of the P-wave arrivals are from a nearly horizontal refractor,the velocity structure between that depth and the recording stations willlargely determine the relative difference in traveltime between neighboringstations. For example, considering neighboring stations at identical distancesfrom the source, the station located on outcropping Paleozoic rocks will recordsignificantly shorter traveltimes than one located on a thick sequence of ash-flow tuff due to the lower intrinsic velocity of the latter rocks relative tothe former. These differences in traveltimes can be clearly seen in thecontour map of reduced traveltimes in the study area (Figure 6).
Since the magnitude of the delay is proportional to both the depth of thehorizontal refractor and the thickness of low velocity layers beneath a givenstation, we can estimate this thickness by combining the observed delay timeswith other geophysical data. We have found that the observed delay times fallinto three groups:
1) 1.4 to 1.2 s, large delays over Crater Flat and Yucca Mountain2) 1.2 to 0.8 s, moderate delays over Jackass Flats3) 0.8 to 0.4 s, small delays over Skull and Bare Mountains
These three groups correspond to the presence of thick low velocity layers,moderately thick low velocity layers and a very thin to nonexistent lowvelocity layer, respectively (Figure 8).
Rock Velocities
Some knowledge of the velocities of the rocks within the study area isrequired in order to make use of the P-wave delay times to infer the near-surface structure. Four sources of information were used to estimate the rockvelocities: local geologic studies, seismic refraction surveys, boreholemeasurements, and the subsurface density distribution as inferred frommodeling of detailed gravity data.
The local geology (Christiansen and others, 1977; Snyder and Carr, 1982)indicates that at least three main rock types must be considered: Precambrianand Paleozoic clastic, metamorphic, and sedimentary rocks; Cenozoic ash-flowtuffs; and Cenozoic volcanics and alluvium. The velocities of these types ofrocks are known to vary from about 1.0 km/s to over 6.0 km/s and this widerange of velocities is reflected in the one-second spread in the values of thebserved P-wave delay times in the study area (Figure 8). Seismic refractionsurveys that have been conducted in the areaprovide important information onthe velocities of individual rock types (L. W. Pankratz, 1982; figure 1).These profiles at the easternmost end of this study show velocities in thealluvium of from 1.0 to 2.2 km/s, while the ash-flow tuffs are characterizedby a velocity of 2.6 to 3.2 km/s. A layer presumed to be altered argillitehas a velocity of from 3.8 to 4.5 km/s and the lowest layer has a velocity of4.4 to 5.1 km/s. The lowest layer detected is presumed to be the top of agranitic body in the profile area. The velocity in the basement refractor at

10000
I
0
-J
41
0hiW
601
B I I I __ B CALCULATED AND OBSERVED RESIDUAL GRAVITY (D.sn =dww;iHoflcomwm.,t282B
:~~~~~~~~~~~~~~~~~ i:
x CALCULATED0-8-OBSERVED
201
0
-20 L.
I small I larae I moderate I_ small II
I delays I delays I delays I delays I
Z; 1.4 - P-WAVE DELAY -___-_ -
1.2
* to __-_
la °o6 OBSERVED'0 0 CALCULATED
1.4,1.2
.o-0.8
0.6
0.4
CALCULATION- POINT
2
2-II
wi-2-J
hi
BARE MTN
_ =
CRATER FLAT YUCCA MTNA
P 2.3
JACKA5 FLAT /v SKULL NTN.
iR , 13 3.a =_
- .--.-.. =~'2.6 .. 7- - - -
I
2
0
-l
-2
F_ 2.4 v: =4.6
0 I v:=6.1 ,I
0 10 20
DI S TAN CE K M)
30 40
Figure 8. Crustal section odified from Snyder and Carr (1982) with layerdensities and velocities (Table 1), observed and calculatedtraveltime delays for P-wave arrivals from nuclear sources, andcalculated and observed residual gravity. Observed and calculateddelay times agree well, except over Crater Flat where the observeddelay is 0.2 s larger than that calculated (see text). Drill holesare projected onto the profile.

18
about 4 km depth is estimated to be 6.0 to 6.15 km/s based on the refractionprofiles reported by Johnson (1965) and confirmed by the profiles reported
here (Figures 3, 4, 5, and 7).
Additional information has been obtained from borehole velocity measure-ments made at two 1,830 m (6,000 ft)-deep holes on the eastern flank of Yucca
Mountain. The velocity measurements in holes G and HI (Figure 1) show
velocities in the range of 3.3 to 4.2 km/s in the 400 to 1,830 m (1,300 to
6,000 ft) interval. Furthermore, it was determined that the one-way traveltime
to the bottom of H is 0.6 s, an average velocity in the hole of 3.0 k/s (D.C. Muller, written communication, 1982).
Whereas the typical velocities of the various rock types have been
determined from the foregoing seismic measurements, the distribution of rock
types was estimated by modeling of the regional gravity (Ponce, 1981; Snyderand Carr, 1982). These comprehensive studies have proposed crustal structures
in the study area which are unlikely to be significantly improved upon untiladditional deep drilling or seismic refraction work is done. In choosing rockvelocities, therefore, care has been taken to use values which are reasonablefor the densities shown in the gravity models.

19
INTERPRETATION
The upper crustal structure in the Yucca Mountain area has been inferredfrom both the seismic P-wave delays (Figures 3, 4, and 5) and the unreversedrefraction profile from shot point 4 (Figure 7). Since the present seismicdata alone is insufficient for deriving the crustal structure in thisgeologically complex region, we have relied heavily on existing models andhave modified these to obtain new, closely related models in agreement withthe seismic observations. The results provide new details on the structure inthe study area, and have been used to define the need for further seismicinvestigations.
P-WAVE DELAY DATA
The seismic P-wave delay data from Crater Flat to Skull Mountain havebeen interpreted using the B-B' crustal density section of Snyder and Carr(1982; Figure 9) as a basis. Since the P-wave data reaches as far as SkullMountain (i.e., beyond section B-B', figure 2), their model was extrapolatedan additional 15 km to the east. The densities in their model were convertedto velocities with close reference to the available seismic information, asshown in Table 1.
TABLE IDENSITY - VELOCITY RELATIONSHIP
Density Velocity(g/c3) (km/s)
1.8 2.02.0 2.22.3 3.22.4 4.62.6 5.72.7 5.8--- 6.1
The P-wave delay times associated with this velocity model were calculatedby raytracing critically refracted rays through the model. A velocity of 6.1km/s was used for the refracting medium located at a depth of 2.3 km below sealevel (3.6 km below the surface; Figure 8). The comparison of observed andcalculated delay times indicates that the velocity model is a reasonable one;the observed delay times clearly confirm the greater depth to the pre-volcanicrocks beneath Crater Flat and Yucca Mountain. The main discrepancy betweenthe observed and calculated values occurs on Crater Flat where the observeddelay is greater than that predicted by the model. This indicates a westwardincrease in either the depth of the pre-volcanic layer or in the amount of lowvelocity near-surface materials. We note on the contour map of Figure 6 thatthe maximum delay time on Crater Flat, 1.4 s, is matched by an equal delaytime on Yucca Mountain at a location 5 km north of the profile line B-B'.This suggests that local variations in thickness of the low velocity tuffs isthe cause of the 1.4 s delay on Crater Flat, rather than a systematic westwarddeepening of the pre-volcanic layer.

2.C
0
-JtJ0
I.-
.c
0.C
D IlI I I I
,4 ~ f - a
* OBSERVED,- CALCULATED
, I I I I I-1.
0 20 40 60
w
-J
-
0-
0
0 20 40 60
D I S T A N C E (K M)Figure 9. Crustal model, ray paths, and a comparison of observed and
calculated arrival times for shot point 4 data. The calculation ofray paths through the velocity model provides the model traveitimes(solid line, top) which ave been adjusted to fit the observedtimes (open circles). Reflected, refracted, and diffracted rayshave been considered. The final model was obtained by iterativelyadjusting velocities and boundary depths in the starting modelderived from the crustal density section ot Snyder and Carr(1982). Model parameters are given in Figure IO.
0
21
Shot Point 4 Profile
The refraction profile from shot point 4 (near Beatty) to Skull Mountaindemonstrated the feasibility of recording clear refracted arrivals to adistance of 65 km in an area considered to be in a "bad data" region forseismic reflection profiling. Since the profile is unreversed, a unique modelcannot be derived with the present information, despite the high signal-to-noise ratio of the data. The data does, however, give additional control onthe existing density model of the upper crust obtained from the interpretationof gravity data.
The method of interpretation used for shot point 4 data was similar tothat applied to the P-wave delay data; the B-B' crustal section of Snyder andCarr (1982) was converted into a velocity model and traveltimes ofcompressional waves were calculated through this model, in this case bytwo-dimensional computer raytracing. A comparison of observed and theoreticaltraveltimes (Figure 9) shows that the velocity model provides a close fit tothe data, the error being +0.05 s in most places. The ray diagram shows thatthe arrivals to stations on Crater Flat and Yucca Mountain reach theirbottoming points beneath Bare Mountain, and the arrivals to Jackass Flatsbottom beneath Yucca Mountain. The diagram also makes clear that additionalshot points at 20, 40, and 60 km on the distance scale would provide excellentseismic reversal coverage along the refracting and reflecting horizons. Thetraveltimes of the prominent secondary phase recorded on this profile (Figure7) is fit by reflections from a boundary at a depth of 15 + 2 km below sealevel.
The velocities and layer boundaries used to compute the theoreticaltraveltimes in two alternative models are shown in Figure 10. In consideringthis diagram, it should be understood that the method of computation requiresthat boundaries be included wherever a change in velocity or velocity gradientis desired. Since the depth to a boundary can often be traded off againstvelocity at that boundary, the depth to some boundaries is non-unique, andsome boundaries are included only to allow a change in the velocity gradient(e.g., the boundary at a depth of 5 km in Figure 10). To distinguish theboundaries with first order geologic importance from those that are mainly theproduct of the analysis method, the former boundaries are shown as heavy solidlines and the latter by light solid lines. The two heavy lines correspond tothe volcanic/pre-volcanic boundary and to the major mid-crustal boundary at adepth of 15 + 2 km. The depth estimates to pre-volcanic rocks are 3.2 km(10,500 ft) beneath eastern Crater Flat and 1.1 km (3,650 ft) beneath JackassFlats. Whereas the gravity model of Snyder and Carr (1982) shows a singleeast-dipping contact between Bare Mountain and Crater Flat, located 3 km eastof outcropping Paleozoic rocks on Bare Mountain, the velocity model shows adistinct 2.5 km-wide bench (down-dropped block?) at a depth of 1.6 km (5,250ft). The apparent velocity of the pre-volcanic layer increases from about 5.7to about 6.0 km/s or higher within the first two kilometers. The absolutevelocity of the basement remains uncertain with the present unreversed seismicdata. A north- south reversed profile within Crater Flat is planned in orderto resolve this uncertainty and to confirm the velocity-depth structure.

5
10-_
6.35
15 - (655)
0
Figure 10.
DI ST AN C E (K M )
Crustal velocity model derived from shot point 4 data. Averagelayer velocities are indicated in km/s. Solid lines are layerboundaries, and dashed lines are alternative boundary depthscalculated for the average layer velocities in parentheses. Theheaviy solid line above a depth of 5 km is the volcanic/pre-volcanic boundary. The mid-crustal boundary below 15 km isindicated by a heavy line where the depth is controlled bythe seismic data (c.f., Figure 9). The depth to pre-volcanicrocks (velocity greater than 5.0 km/s) is 3.2 km (10,500 ft)beneath eastern Crater Flat.

NTS SHOT POINT 3 EAST PROFILE 23
5
wC,,
Io
I-
4
3
2
1
0
DISTANCE (KM)
0
10
X
0
20
30
40
Figure 11. TraveltimeTop:
2 4 6 8VELOCITY (KM/SEC)
curve and crustal velocity model for southern NevadaObserved (solid dots) and calculated (solid lines)traveltimes for shot point 3 profile from YuccaMountain to Death Valley Junction (Figure 5).Definitions: Pg is the "seismic basement" refractor;PiPl is the first intracrustal reflector (24 km);PiP2 is the second intracrustal reflector (30 km);PmP is the mantle reflector.
Bottom: Interpreted compressional-wave velocity structure ofthe crust. Velocity boundaries in the upper crust maynot have been detected since the minimum source-recorder range was 47 km. Asterisks indicate estimatedvelocities.

24
SHOT POINT 3 EAST PROFILE
Further evidence for the deep crustal structure beneath the study area isprovided by the clear secondary arrivals observed on the easternmost profilefrom shot point 3 (Figure 5). This profile recorded a crust-mantle and twointra-crustal reflections.
In view of the lack of reversal on this profile, the crustal modelderived from it was constrained by the other seismic profiles in the area. Anaverage velocity of 3.0 km/s has been used for the near-surface layer, and of6.0 km/s for the basement (Pg) refractor. The first arrivals along thisproifle show considerable scatter (Figure 11), but an average line throughthese points gives a depth to basement of 1.5 km. The first intracrustalreflection is most clearly observed at a reduced time of 2.6 s and a range of93 to 97 km (Figure 5). These arrivals can be fit by a pre-criticalreflection from a boundary at 24 km depth where the velocity increases from6.0 to 6.35 km/s (Figure 11). The second reflection occurs at a reduced timeof 3.15 to 3.55 s and a range of 86 to 97 km. These arrivals have been fit bya second pre-critical reflection from a boundary at 30 km depth where thevelocity increases from 6.35 to 6.6 km/s. Finally, the mantle reflectionsbetween 3.4 and 4.5 s and 81 to 109 km have been fit with a reflection fromthe crust-mantle boundary at a depth of 35 km. A mantle velocity of 7.8 km/shas been used based on the work of Johnson (1965). This structure isillustrated in the velocity-depth plot of Figure 11.
SUMMARY
Seismic refraction data from nuclear and chemical explosions have beenused to calculate the crustal velocity structure in the vicinity of YuccaMountain, southern Nevada. A contour map of P-wave delay times and anunreversed refraction profile have been used in conjunction with gravitymodels to estimate the configuration of pre-volcanic surface between outcropsat Bare Mountain and Skull Mountain. The models have been constrained bygeologic and geophysical information, including geologic mapping, shallowseismic refraction surveys, borehole measurements and the subsurface densitydistribution as inferred from modeling detailed gravity data. The greatestdepth to basement (somewhat more than 3 km) is beneath eastern CraterFlat-western Yucca Mountain, where a graben-like structure exists in thedeeper rocks.
The total crustal thickness has been calculated from an unreversedprofile from a nuclear shot at Pahute Mesa. The crust is 35 km thick andcontains intracrustal boundaries at 24 and 30 km; an additional boundary at15 km depth has been identified on the east-west profile across Yucca Mountain.
25
REFERENCES
Christiansen, R. L., Lipman, P. W., Carr, W. J., Byers, F. M., Jr., Orkild, P.P., and Sargent, K. A., 1977, Timber Mountain-Oasis Valley caldera complexof southern Nevada: Geological Society of America Bulletin, v. 88, p.943-959.
Healey, D.L., Wahl, R.R., and Oliver, H.W., 1980, Complete Bouguer gravity mapmap of Nevada, Death Valley sheet: Nevada Bureau of Mines and Geology Map68, scale 1:250,000.
Healy, J.H., Mooney, W.D., Blank, H.R., Gettings, M.E., Kohler, W.M., Lamson,R.J. and Leone, L.E., 1982, Saudi Arabian Seismic Deep-RefractionProfile: Final Project Report: U.S. Geological Survey Open-File Report02-37, 429 pp.
Johnson, L.R., 1965, Crustal Structure between Lake Mead, Nevada and MonoLake, California: Journal of Geophysical Research, v. 70, No. 12, p.2863-2872.
Pancratz, L.W., 1982, Reconnaissance Seismic Refraction Studies at CalicoHills, Wahmonie, and Yucca Mountain, Southwest Nevada Test Site, NyeCounty, Nevada: U.S. Geological Survey Open-File Report 82-478, 25 pp.
Ponce, D. A., 1981, Preliminary gravity investigations of the Wahmonie Site,Nevada Test Site, Nye County, Nevada: U.S. Geological Survey Open-FileReport 81-522, 64 pp.
Snyder, D. B., and Carr, W. J., 1982, Preliminary results of gravity investi-gations at Yucca Mountain and vicinity, southern Nye County, Nevada: U.S.Geological Survey Open-File Report 82-701, 36 pp.
Spengler, R. W., Muller, D. C., and Livermore, R. B., 1979, Preliminary reporton the geology and geophysics of drill hole UE25A-1, Yucca Mountain,Nevada Test Site: U.S. Geological Survey Open-File Report 79-1244, 43 pp.

26
APPENDIX A
Seismic Recorder Locations
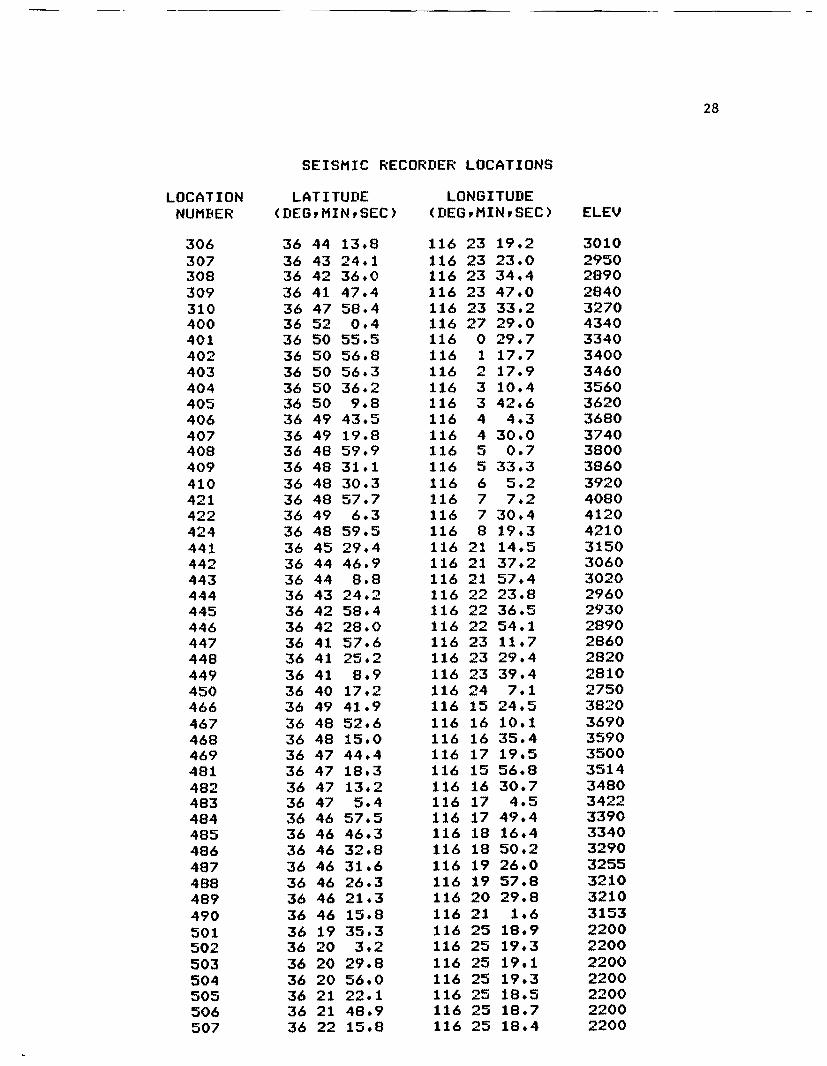
Appendix A is a listing of all recorder sites that were used for thisexperiment. "Location Number" is the reference number for the site which isused on all maps and record sections. Other information in this appendix isthe latitude, longitude, and elevation in feet of each recorder location.

27
SEISMIC RECORDER LOCATIONS
LOCATIONNUMBER
LATITUDE(DEGMINSEC)
234
101102103104105106107108109110111112113114115116117118119120121201202203204205206207208209210211212213214215216217218219220301302303304305
37 14 54.337 6 6.737 18 12.236 53 20.736 48 21.036 50 55.536 50 54.936 50 11.336 48 30.336 49 4.236 49 7.336 48 42.236 48 41.136 48 31.O36 48 29.636 48 31.136 48 15.636 48 0.336 47 52.136 47 44.936 47 34*536 47 18.636 46 19.836 45 28.436 46 26,836 51 59.236 51 47.534 51 36.136 51 5.O36 50 38336 50 36.736 50 9.536 49 21.136 49 6.336 48 51.236 48 47.436 48 55.236 49 3.536 49 11.836 49 20.236 49 12.236 48 54*536 48 45.136 48 37.736 48 23.736 48 28.036 47 33.936 46 38.536 45 51.636 45 2.1
LONG I TUDE(DEGYMINSEC)
116 25 20.6116 0 14.6116 19 32.1116 47 19.2116 0 42.6116 0 29.7116 2 20.8116 3 40.7116 6 5.2116 7 50.2116 8 45.0116 9 32.4116 10 0.2116 10 38.3116 11 7.7116 11 43.2116 12 20.9116 12 53.6116 13 23.8116 13 58.9116 14 46.5116 15 56.4116 15 42.3116 15 29.0116 15 44.2116 27 26.4116 27 5.9116 26 55.1116 26 24.0116 25 44.0116 24 35.8116 23 50.8116 23 59.4116 23 47.8116 23 33.4116 22 56.6116 22 26.9116 21 56.6116 21 25.7116 20 53.0116 20 19.5116 18 54.2116 18 6.8116 17 28.0116 16 13.2116 23 42.0116 23 32.2116 23 25.6116 23 24.9116 23 22.5
ELEV
62734385696036803210335534603620392541704280430342704200415041104010391038453750365035143500349535004320420041303940375035403432334032973550334033903445351035803578353535753600362033103240318031283070
-
28
SEISMIC RECORDER LOCATIONS
LOCATIONNUMBER
306307308309310400401402403404405406407408409410421422424441442443444445446447448449450466467468469481482483484485486487488489490501502503504505506507
LATITUDE(IIEGMINYSEC)
LONGITUDE(DEGYMINPSEC)
3636363636363636363636363636363636363636363636363636363636363636363636363636363636363636363636363636
44 13.843 24.142 36.041 47.447 58.452 0.450 55.550 56.850 56.350 36.250 9.849 43.549 19.848 59.948 31.148 30.348 57.749 6.348 59.545 29.444 46.944 8.843 24.242 58.442 28.041 57.641 25.241 8.940 17.249 41.948 52.648 15.047 44.447 18.347 13.247 5.446 57.546 46.346 32.846 31.646 26.346 21.346 15.819 35.320 3.220 29.820 56.021 22.121 48.922 15.8
116 23116 23116 23116 23116 23116 27116 0116 1116 2116 3116 3116 4116 4116 5116 5116 6116 7116 7116 8116 21116 21116 21116 22116 22116 22116 23116 23116 23116 24116 15116 16116 16116 17116 15116 16116 17116 17116 18116 18116 19116 19116 20116 21116 25116 25116 25116 25116 25116 25116 25
19.223.034.447.033.229.029.717.717.910.442.64.3
30.00.7
33.35.27.2
30.419.314.537.257.423.836.554.111.729.439.47.1
24.510.135.419.556.830.7
4.549.416.450.226.057.829.81.6
18.919.319.119.318.518.718.4
ELEV
30102950289028403270434033403400346035603620368037403800386039204080412042103150306030202960293028902860282028102750382036903590350035143480342233903340329032553210321031532200220022002200220022002200

29
SEISMIC RECORDER LOCATIONS
LOCATIONNUMBER
508509510511512513514515516517518519520521522523524525526527528529530541542543544545546547548549550551552553554555556557558559560561562563564565566567
LAT I TUDE(DEGMINYSEC)
LONG I TUDE(tEGMINSEC)
36 2236 2336 2336 2436 2436 2536 2536 2636 2636 2736 2736 2736 2836 5336 5336 5236 5236 5136 5136 5136 5036 5036 5036 4436 4536 4536 4536 5336 4636 4636 4736 5336 4836 4836 5236 4936 4936 5136 4936 5036 5136 5136 5236 3536 3536 3636 3636 3736 3736 38
42.28.6
34.90.9
26.620.145.811.837.7
4.126.456.423.221.8
8.751.417.854.440.812.842.837.025.352.013.228.447.236.927.254.532.712.67.9
36.913.26.3
26.625.158.028.4
6.943.440.230.656.622.749,314.240.2
5.05
116116116116116116116116116116116116116116116116116116116116116116116116116116116116116116116116116116116116116116116116116116116116116116116116116116
2525252525252525252525252527272726262625252524383837373436363634363634353534353434343442424242424242
18.218.118.118.117.016.516.015.915.415.114.815.114.846.917.44.1
48,831.810.258.954.6
7.93.8
26.813.433.112.44.5
56.046.934.512.123.213.827.239.520.142.3
2.453.749.939.122.253.347.245.441.436.433.129.8
ELEV
22002200220022002200220022002200220022002200220022005160494048004500429039203810379036203470278028402951292136403800297030203533307937203420313031953500358032603300335734703260300029602780270026802660

30
SEISMIC RECORDER LOCATIONS
LOCATION LATITUDE LONGITUDENUMBER (DEGYMINSEC) (DEGPMINvSEC) ELEV
568 36 38 32.1 116 42 25.3 2620569 36 38 56.2 116 42 22.5 2610570 36 39 35.7 116 42 2.3 2590571 36 40 10.9 116 41 47.2 2610572 36 40 46.2 116 41 33.3 2620573 36 41 29.0 116 41 14.9 2628574 36 42 2.5 116 40 57.8 2640575 36 42 36.3 116 40 40.1 2650576 36 43 11.6 116 40 19.2 2660577 36 43 38.6 116 39 47.7 2670578 36 44 4.9 116 39 16.2 2680581 36 40 14.4 116 24 7.1 2750582 36 39 42.6 116 24 13.2 2720583 36 39 11.6 116 24 12.7 2690584 36 38 38.6 116 24 13.2 2660585 36 38 6.9 116 24 3.9 2630586 36 37 36.7 116 24 9.2 2610587 36 37 4.9 116 24 15.0 2580588 36 36 34.7 116 24 20.5 2560589 36 36 4.3 116 24 25.8 2540590 36 35 33.0 116 24 31.1 2520591 36 35 2.8 116 24 36.9 2490592 36 34 31.9 116 24 42.1 2470593 36 '34 1.3 116 24 47.4 2450594 36 33 30.0 116 24 53.2 2420595 36 32 59.6 116 24 58.2 2400596 36 32 28.4 116 25 1.2 2380597 36 31 58.2 116 25 4.6 2360598 36 31 27.4 116 25 7.6 2340599 36 30 56.0 116 25 10.6 2310600 36 30 25.1 116 25 13.2 2300619 36 49 32.3 116 4 12.7 3700620 36 50 14.4 116 3 36.8 3600621 36 50 16.3 116 24 42.1 3580622 36 52 0.9 116 23 41.5 3640623 36 54 23.7 116 22 31.2 3800624 36 53 36.2 116 22 58.8 3750625 36 52 51.4 116 23 35.2 3720629 36 48 14.4 116 24 29.5 3300630 36 47 58.3 116 25 4.3 3400631 36 48 17.5 116 25 58.5 3560632 36 48 31.9 116 26 19.8 3680633 36 48 55.1 116 26 37.2 3780634 36 49 29.5 116 26 46.9 3960635 36 49 58.2 116 27 2.4 4200636 36 50 3.1 116 27 15.5 4360637 36 50 9.6 116 27 36.7 4620638 36 50 16.3 116 28 5.7 4951639 36 49 36.1 116 28 1.4 4840640 36 48 49.0 116 27 46.7 4680

31
SEISMIC RECORDER LOCATIONS
LOCATIONNUMBER
642643644646647648649650651652653654655656657658659660661662663664665666667668669670671672673674675676677678681682683686687688694
LATITUDE(DEGYMINPSEC)
LONG I TUDE(DEG.MINSEC)
36 5336 5336 5336 5336 5336 5336 5336 5336 5336 5336 5336 5336 5236 5236 5236 5236 5236 5236 5036 5036 4936 4836 4836 4836 4836 4736 4736 4736 4836 4836 4836 4836 4836 4936 4936 4936 4736 4736 4836 4836 4836 4936 48
19.34.64.2
34.239.744.744.929*217*517.324.1
7.644.019.9
5.04.22.23.4
56.126.553.337.027.215.95.8
55.744*833.1
6.615.215.229.238.5
0.219.550.825.754.131.751.357.43.6
38.8
116116116116116116116116116116116116116116116116116116116116116116116116116116116116116116116116116116116116116116116116116116116
46464544434342424141404040393939383737373636353534343333323231303029292915161618191923
52.013.238.5
55.023.151.625.954.121.644.328.313.654.231.6
2.635.257.456.529.951.215.541.110.640.212.640.612.639.6
6.830.956.117.346.011.42.7
25.96.1
54.8389410.141.68.2
ELEV
3380340033203400352036803808400042004310453346804966472044004320416040403780362034603195318031703170314031603160326033403440352036003720382041003565356036103550355035603320

32
APPENDIX B
Master Shot List and Team-Shot Data Sheetswith Tape Grade Scale
The "Master Shot List" (page 33) is a table containing all importantinformation pertaining to each recorded shot or nuclear event. Most of theinformation is self-explanatory. "Shot Point" refers to the location numberfor that particular shot. For this experiment, the shot point and shot numberare the same. Additional information and the size of the shot are listed tothe right of the data.
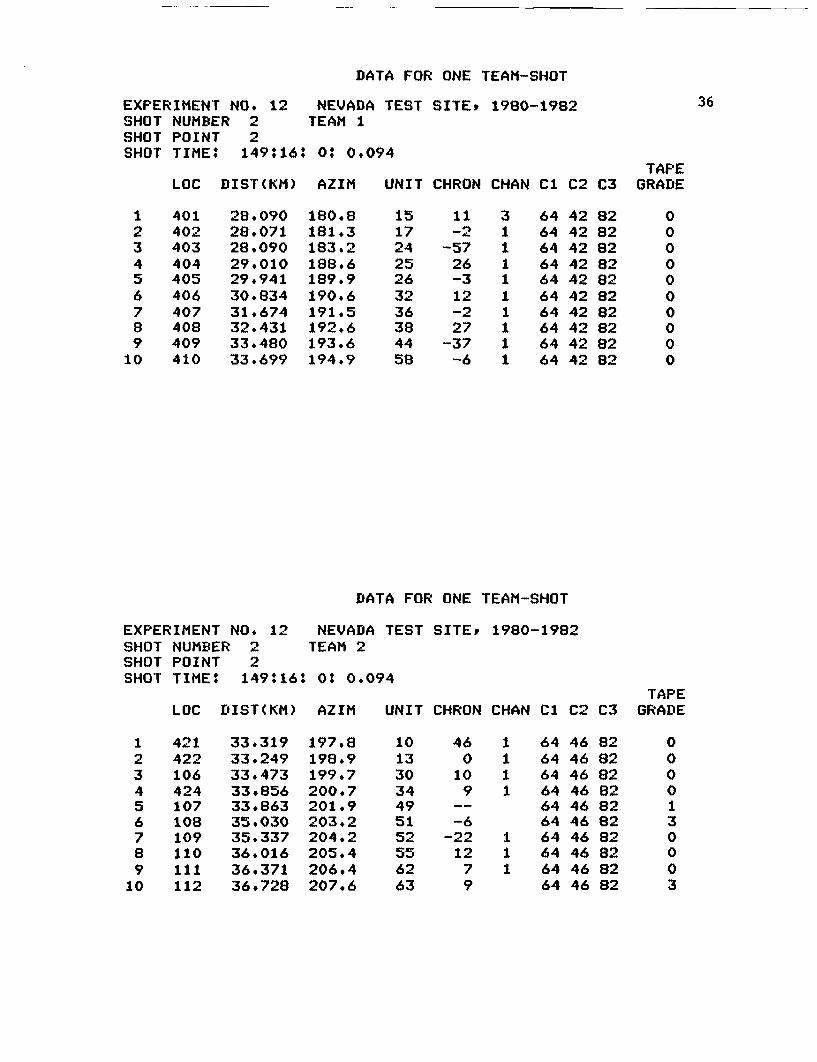
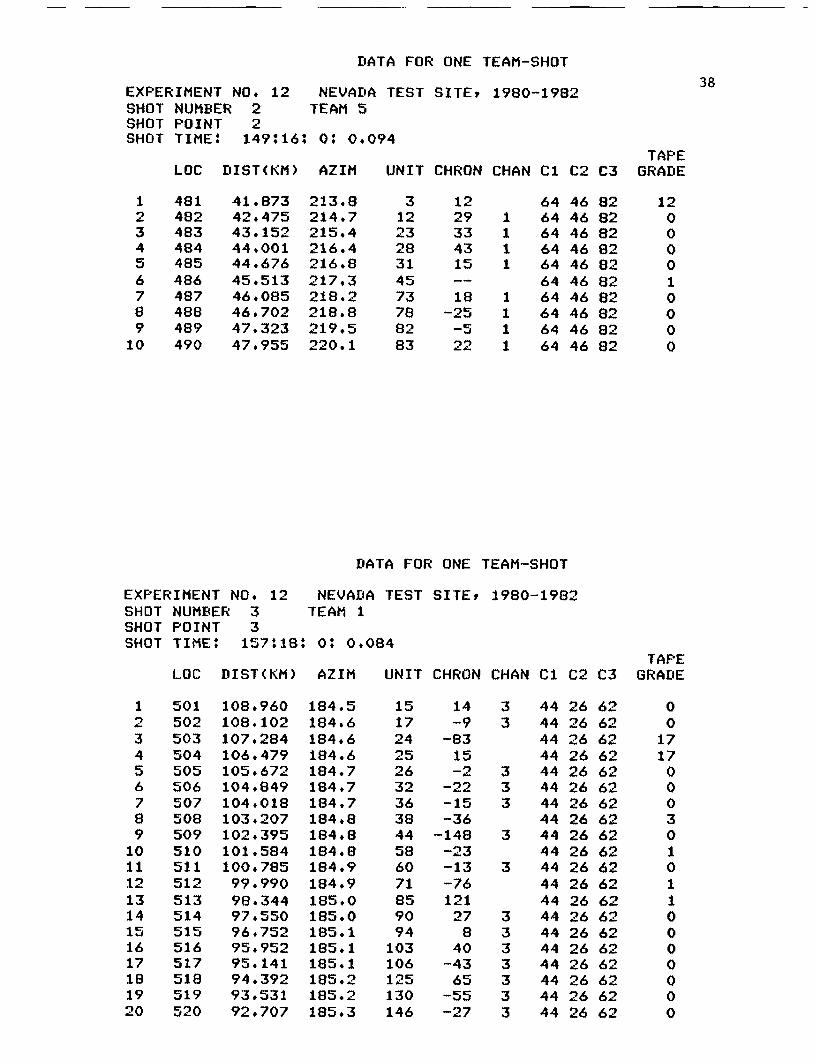
The "Team-Shot Data Sheets" (pages 34-49) contain all of the informationrelated to the seismic recorders. Each set of 20 recorders is given adesignated team number under which data is stored and referenced. Each "Datafor One Team-Shot" contains shot number, team number, shot point, and shottime. Column headings for the table are explained below:
Loc - location number from the seismic recorder locationfile (Appendix A)
Dist (km) - distance in kilometers from the shot point to therecorder location
Azim - azimuthal projection from the shot point to therecorder location
Unit - I.D. number of the recording unit
Chron - chronometer correction for the recorder at shot time(calculated from the total clock drift)
Chan - channel number (1, 2, or 3) which was selected to bedigitized by the computer
C1, C2, C3 - amplifier gain setting (db) for each data recordingchannel
Tape Grade - value used to rate the performance quality of theseismic recorder (see Tape Grade Scale, following)
Additional information relevant to analysis of the data is listed to the rightof the data columns.
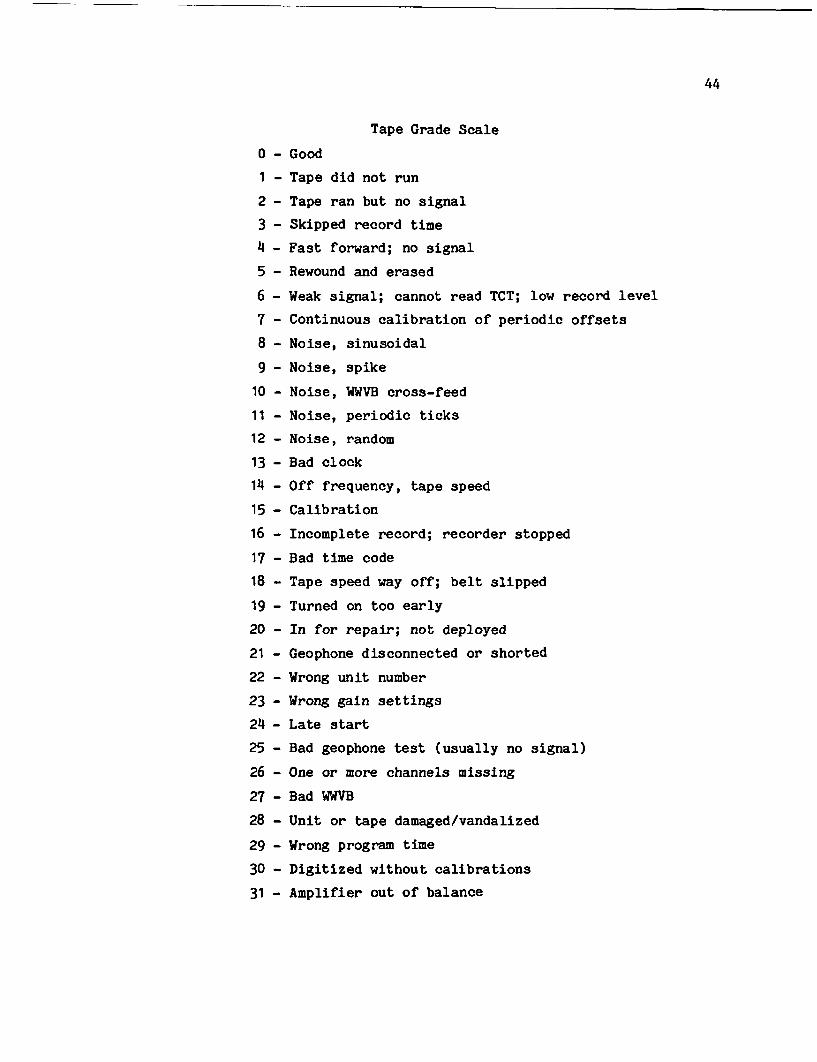
The "Tape Grade Scale" (page 44) is a listing of all tape grade numbersused on the Team-Shot Data Sheets. Each number corresponds to a specificproblem with the recording unit.

MASTER SHOT LIST
EXPERIMENT NO. 12 NEVADA TEST SITE, 1980-1982
SHOTNUMBER
SHOTPOINT LATITUDEDATE LONGITUDE SHOT TIME
1 APR 26, 19802 MAY 29, 19813 JUN 6, 19814 APR 28, 1982
1 37 14.90572 37 6.11113 37 18.20384 36 53.3450
116 25.3440116 0.2438116 19,5358116 47.3204
117 17149 16157 18119 4
0 0.0830 0.0940 0.0840 0.014
COLWICK - APPROX. 120 KT.ALIGOTE - APPROX. 20 KT.HARZER - APPROX. 120 KT.BEATTY - 2480 LBS.

DATA FOR ONE TEAM-SHOT
EXPERIMENT NO. 12 NEVADASHOT NUMBER 1 TEAM 1SHOT POINT 1SHOT TIME: 117:17: 0: 0.OE
LOC DIST(KM) AZIM
TEST SITE, 1980-1982 34
TAPEGRADEUNIT CHRON CHAN C C2 C3
123456789
10111213
120121118220219218217216215114115116117
56.36854.53252.91250.86549. 98549 .54749.02448.11747,75353. 07253.05452.98252.924
165.0164.9164.7164.6166.5167.5168.8171 * 1172.0159.6160.5161.5162.8
103322638
12513060909415172425
0-4-203
-5
-322
-2-S
3 443 443 443 443 443 44
443 443 44
4444
3 4444
26262626262626262626262626
62626262626262626262626262
000
0/ 6/300/ 6
0100
6/17/2410
18
DATA FOR ONE TEAM-SHOT
EXPERIMENT NO. 12 NEVADA TEST SITE,SHOT NUMBER 1 TEAM 2SHOT POINT 1SHOT TIME: 117:17: 0 0.083
1980-1982
TAPEGRADELOC DIST(KM) AZIM UNIT CHRON CHAN C C2 C3
123456789
101112
211210301310302303304305306307308309
48.43348.26048.96249. 88450. 64052. 35453.79955.32556.81758. 34259.80961.294
175.8176.9177.1176.9177.0176.9177.0177.0177.0177.1177.5177.8
62976311811033525112410410530
010-3-40
-80
-7041
44 263 44 263 44 263 44 263 44 263 44 263 44 263 44 263 44 263 44 263 44 263 44 26
626262626262626262626262
17/18/25000000000
0/ 6/300

DATA FOR ONE TEAM-SHOT
EXPERIMENT NO. 12 NEVADA TESTSHOT NUMBER 1 TEAM 3SHOT POINT 1SHOT TIME: 117:17: 0 0.083
SITE, 1980-1982 35
TAPEGRADELOC DIST(KM) AZIM UNIT CHRON CHAN C C2 C3
1
34
67
910111213
101102103104105106107108109110111112113
61. 21457.64255.96155.87656.61354.38253.66453.83453.56953.46053.20852.82252. 917
143.4140.3142.5144.9149.7151.5152.7154.2154.9155.9156.7157.5158.6
181
434076759889
113112143133101
0033
-4201
-22
-241
-2
3 443 44
444444
3 443 443 443 44
4444
3 443 44
26 6226 6226 6226 6226 6226 6226 6226 6226 6226 6226 6226 6226 62
00
17/25110
0/ 6/110011
0/ 6/300
DATA FOR ONE TEAM-SHOT
EXPERIMENT NO. 12 NEVADASHOT NUMBER 1 TEAM 4SHOT POINT 1SHOT TIME: 117:17: 0 0.OE
LOC DIST(KM) AZIM
TEST SITE, 1980-1982
UNIT CHRON CHAN C C2 C3
123456789
101112
214213212209208207206205204203202201
47. 90448.07348.25447. 77747.30845.82644.94744.88744.09043.16642.83142.503
173.0174.0174.9177.2177.6177.2178.6180.7182.0183.1183.5184.2
141939
1215356666970727793
0-4
1151220210
3 443 443 443 443 443 443 44
443 443 443 443 44
26 6226 6226 6226 6226 6226 6226 6226 6226 6226 6226 6226 62
TAPEGRADE
0000000
12/17000
0/12
DATA FOR ONE TEAM-SHOT
EXPERIMENT NO. 12 NEVADA TEST SITEP 1980-1982SHOT NUMBER 2 TEAM 1SHOT POINT 2SHOT TIME: 149:16: 0 0.094
LOC DIST(KM) AZIM UNIT CHRON CHAN C1 C2 C3
36
TAPEGRADE
I2345678910
401402403404405406407408409410
28.09028 .07128.09029.01029.94130.83431.67432.43133.48033.699
180.8 15 11 3 64 42181.3 17 -2 1 64 42183.2 24 -57 1 64 42188.6 25 26 1 64 42189.9 26 -3 1 64 42190.6 32 12 1 64 42191.5 36 -2 1 64 42192.6 38 27 1 64 42193.6 44 -37 1 64 42194.9 58 -6 1 64 42
DATA FOR ONE TEAM-SHOT
82828282828282828282
0000000000
EXPERIMENT NO. 12 NEVADA TEST SITEP 1980-1982SHOT NUMBER 2 TEAM 2SHOT POINT 2SHOT TIME: 149:16: 0* 0.094
LOC DIST(KM) AZIM UNIT CHRON CHAN C1 C2 C3TAPE
GRADE
123456789
10
421422106424107108109110111112
33.31933.24933.47333.85633 .86335.03035. 33736.01636 .37136.728
197.8198.9199.7200.7201.9203.2204.2205.4206.4207.6
10 4613 030 1034 949 __51 -652 -2255 1262 763 9
1 641 641 641 64
6464
1 641 641 64
64
46 8246 8246 8246 8246 8246 8246 8246 8246 8246 82
0000130003

DATA FOR ONE TEAM-SHOT
EXPERIMENT NO. 12SHOT NUMBER 2SHOT POINT 2SHOT TIME: 149:16:
LOC DIST(KM)
NEVADA TEST SITE, 1980-1982TEAM 3
0: 0.094
AZIM UNIT CHRON CHAN C C2 C3
37
1 4502 4493 4484 4475 4466 4457 4448 4439 44210 441
59. 49457.80457.25456.19355.18254.17253. 35451,86750.63649.262
216.6217.0217.1217.4217.6217.8218.1218.4218.8219.3
118F2235404365747576
39014
-401415-33017
-13
1 642 641 641 641 641 64
641 641 641 64
46 8246 8246 8246 8246 8246 8246 8246 8246 8246 82
TAPEGRADE
000000
25000
DATA FOR ONE TEAM-SHOT
EXPERIMENT NO. 12 NEVADA TEST SITEP 1980-1982SHOT NUMBER 2 TEAM 4SHOT POINT 2SHOT TIME: 149:16: O: 0094
LOC DIST(KM) AZIM UNIT CHRON CHAN C C2 C3
1 1132 1143 1154 1165 1176 4667 4678 4689 469
37. 58838.39438.98239,61640 * 50637.79039.68440.98942.397
208.6209.3210.1211.0212.2216.6216.6216.3216.7
141939485356666970
-8-35
54204
-331011
1 641 641 641 641 641 641 641 641 64
46 8246 8246 8246 8246 8246 8246 8246 8246 82
TAPEGRADE
000000000
DATA FOR ONE TEAM-SHOT
38EXPERIMENT NO. 12 NEVADA TEST SITE, 1980-1982SHOT NUMBER 2 TEAM 5SHOT POINT 2SHOT TIME: 149:16: 0: 0.094
LOC DIST(KM) AZIM UNIT CHRON CHAN C C2 C3
1234
6789
10
481482483484485486487488489490
41. 87342.47543. 15244o00144.67645.51346.08546.70247. 32347.955
213.8214.7215.4216.4216.8217,3218.2218.8219,5220.1
3122328314573788283
1229334315
18-25-522
641 641 641 641 64
641 641 641 641 64
46 8246 8246 8246 8246 8246 8246 8246 8246 8246 82
TAPEGRADE
12000010000
DATA FOR ONE TEAM-SHOT
EXPERIMENT NO. 12SHOT NUMBER 3SHOT POINT 3SHOT TIME: 157:18:;
LOC DIST(KM)
NEVADA TEST SITE, 1980-1982TEAM 1
0: 0084
1
34
6789
1011121314151617181920
501502503504505506507508509510511512513514515516517518519520
108.960108.102107.284106.479105.672104.849104.018103.207102.395101.584100.78599. 99098.34497.55096.75295.95295. 14194.39293.53192. 707
AZIM
184.5184.6184.6184.6184.7184.7184.7184.8184.8184.8184.9184.9185.0185.0185.1185.1185.1185.2185.2185.3
UNIT CHRON CHAN C C2 C3
151724
2632363844586071859094103106125130146
14-9
-8315-2
-22-15-36
-148-23-13-76121278
40-4365
-5-27
3 443 44
4444
3 443 443 44
443 44
443 44
4444
3 443 443 443 443 443 443 44
2626262626262626262626262626262626262626
6262626262626262626262626262626262626262
TAPEGRADE
0017170003010110000000

DATA FOR ONE TEAM-SHOT
39EXPERIMENT NO. 12SHOT NUMBER 3SHOT POINT 3SHOT TIME: 157:18:
LOC DIST(KM)
NEVADA TEST SITE, 1980-1982TEAM 2
0: 0.084
AZIM UNIT CHRON CHAN C C2 C3
1
34
67891011121314151617181920
521522523524525526527528529206530207209301302303304444446448
47.54347.75248.19249.11749. 73050. 03450. 82851. 71651. 69551.58251.82252.26554.19155.34756.97958.66260.09964.50766.28668. 288
194.9193.9193.4192.7192.0191.3190.8190.5189.2188.4187.4187.0186.7186.4186.0185.6185.5183.8184.3184.9
101330344951525562636497104105110118124137142145
42-26
810
-49-821614171626619
-108-32-44-7549-2
3 643 643 643 64
643 643 64
646464
3 646464
3 6464
3 643 643 641 64
64
4646464646464646464646464646464646464646
8282828282828282828282828282828282828282
TAPEGRADE
00003003330171703000017
DATA FOR ONE TEAM-SHOT
EXPERIMENT NO. 12 NEVADASHOT NUMBER 3 TEAM 3SHOT POINT 3SHOT TIME: 157:18: 0: 0.OE
LOC DIST(KM) AZIM
SITE. 1980-1982
UNIT CHRON CHAN C C2 C3
123456789
1011121314151617181920
541542543544545546547548549550551552553554555556557558559560
67,73967. 00766.17165.43350.32264.14263 .27962. 08051.08160.97360. 06252.90058.88858.12154 .40457.05856.11654.99353.85852.093
204.5204.4203.8203.6205.3203.7203.8204.0205.2204.2204.3204.7203.9203.8204.4203,8203.9204.3204.6205.0
118223540436574757679878998
100101112113133143
373215
855
226125
116-228885837
-48-1619
-59
3 643 643 64
64646464
3 6464
3 6464
3 643 643 643 64
643 64
643 643 64
4646464646464646464646464646464646464646
8282828282828282828282828282828282828282
TAPEGRADE
0001
1717290170170000170
1700

DATA FOR ONE TEAM-SHOT
40EXPERIMENT NO. 12 NEVADASHOT NUMBER 3 TEAM 4SHOT POINT 3SHOT TIME: 157:18: 0 0.08
LOC DIST(KM) AZIM
SITE, 1980-1982
UNIT CHRON CHAN C C2 C3
1
34
6789
1011121314151617181920
561562563564565566567568569570571572573574575
576577578
86.34785.55284.79584. 00483.25082.48681. 73980.94680. 24078.83177.68876. 55775. 16974 05572.924
71.71970. 63469.568
203.7203.8204.0204.2204.3204.5204.7204.8205.0205.1205.2205.3205.4205.4205.5
205.5205.2204.9
14193948535666697072779396115119121122132134139
-556978
-13-63192
-11-35
1-19
131319
1 6464
1 641 643 64
643 58
641 643 64
643 643 643 643 64
6464
3 643 643 64
52 8246 8246 8246 8246 8246 8246 8246 8246 8246 8246 8246 8246 8246 8246 8246 8246 8246 8246 8246 82
TAPEGRADE
0100030
170030000
20200
0/170/30
DATA FOR ONE TEAM-SHOT
EXPERIMENT NO. 12SHOT NUMBER 3SHOT POINT 3SHOT TIME: 157:18:
LOC DIST(KM)
NEVADA TEST SITE, 1980-1982TEAM 5
0: 0.084
123456789
1011121314151617181920
581582583584585586587588589590591592593594595596597598599600
70.54571.53572.48573.49974.45175.39076.37977.31878.26479.23680. 33081.29382 .24783.22084.16785.13486.07187.02687.99988. 952
AZIM
185*5185.6185.5185.4185.2185.2185*3185.3185.3185.4185.4185.4185.5185.5185.5185.5185.5185.5185.5185.5
3122328314573788283889299
107108120128129131136
UNIT CHRON CHAN C C2 C3
1339
-1855311147
-23-19273820
-78-165
447
294135
-133
646464
1 641 641 64
6464646464
1 6464
1 64646464
1 6464
1 64
4646464646464646464646464646464646464646
8282828282828282828282828282828282828282
TAPEGRADE
3317000
17171717170301731030

DATA FOR ONE TEAM-SHOT
41EXPERIMENT NO. 12 NEVADA TEST SITEY 1980-1982SHOT NUMBER 4 TEAM 1SHOT POINT 4SHOT TIME: 119: 4: 0: 0.014
1234
6789
1011121314151617181920
LOC DIST(KM) AZIM
409 62.722 98.2410 61.945 98,3421 60.301 97.7422 59.697 97.5106 59.218 97.7424 58.526 97.9107 57.862 97.8108 56.812 98.7109 56.137 98.8110 55.254 99.3111 54.543 99.5112 53.667 99.6113 52.831 100.3114 52.124 100.9115 51.439 101.4116 50.631 101.8117 49.545 102.4408 63.400 97.3619 64.459 96,3620 65.211 95.1
UNIT CHRON CHAN C1 C2 C3
151724252632363844586071859094103106125130146
119
-10-12
2
-2
-2
-6
-2.
-30994
-4-77
-6
1 24 64224 6 4224 6 42
1 24 6422 24 6421 24 642
24 6 421 24 6422 24 6422 24 6422 24 6422 24 6421 24 6422 24 6422 24 6422 24 642
24 6 421 24 642
24 6 422 24 642
TAPEGRADE
01
120001000000000
250120
DATA FOR ONE TEAM-SHOT
EXPERIMENT NO. 12 NEVADA TEST SITE, 1980-1982SHOT NUMBER 4 TEAM 2SHOT POINT 4SHOT TIME: 119: 4: 0 0.014
TAPEGRADELOC DIST(KM) AZIM UNIT CHRON CHAN C C2 C3
1 640 30.233 106.12 639 29.506 103.63 638 29.132 101.24 637 29.880 101.45 636 30.434 101.56 635 30.782 101.77 634 31.349 103.18 633 31.840 104.99 632 32.448 105.910 631 33.079 106.411 630 34.536 106.712 629 35.225 105.513 625 35.275 91.514 624 36.164 89.215 623 36.894 87.016 622 35.197 94.017 621 34.094 99.618 528 32.190 98.719 204 31.369 97.720 201 29.647 94.9
101330344951525562636497
104105110118124137142145
18 2 54 18 24-4 1 24 6 422 1 24 6 422 1 24 6 422 1 24 6 426 1 24 6 422 1 24 6 422 1 24 6 422 24 6 422 1 24 6 423 1 24 6 423 1 24 6 423 1 24 6 426 2 24 6 428 1 24 6 420 1 24 6 42
-3 1 24 6 420 1 24 6 42
-13 1 24 6 426 1 24 6 42
00000000
130
0/17/3000
0/17/30000000
VABM
UE25A-1

DATA FOR ONE TEAM-SHOT
42EXPERIMENT NO. 12 NEVADA TEST SITE, 1980-1982SHOT NUMBER 4 TEAM 3SHOT POINT 4SHOT TIME: 119: 4 0: 0.014
TAPEGRADELOC DIST(KM) AZIM UNIT CHRON CHAN C C2 C3
1 42 6423 6434 6445 6456 6467 6478 6489 649
10 65011 65112 65213 65314 65415 65516 65617 65718 65819 65920 660
0.000 180.00.676 93.71.708 106.82.544 101.5
4.296 84.45.089 83.45.894 82.86.669 83.67.269 87.98.051 90.78.855 90.79.779 89.410.183 92.310.601 96.111.180 99.611.813 101.412.524 100.913,201 100.614.116 99.7
1 -- 64 46 8218 1 3 64 46 8222 9 3 64 46 8235 -32 1 44 26 6240 -- 44 26 6243 -18 1 44 26 6265 2 1 24 6 4274 -8 3 24 6 4275 11 3 24 6 4276 -18 3 24 6 4279 -5 3 24 6 4287 9 3 24 6 4289 9 3 24 6 4298 -19 1 24 6 42100 5 1 24 6 42101 15 3 24 6 42112 -10 1 24 6 42113 -5 3 24 6 42133 11 3 24 6 42143 6 1 24 6 42
10001000000000000000
BAD LOC
DATA FOR ONE TEAM-SHOT
EXPERIMENT NO. 12 NEVADA TEST SITE, 1980-1982SHOT NUMBER 4 TEAM 4SHOT POINT 4SHOT TIME: 119: 4: 0 0.014
TAPEGRADELOC IST(KM) AZIM UNIT CHRON CHAN C C2 C3
1 661 14.634 107.72 662 15.555 110.23 663 16.819 112.34 664 18.626 118.05 665 19.520 117.66 666 20.351 117.57 667 21.164 117.38 668 21.914 117.29 669 22.772 117.0
10 670 23.556 117.111 671 23.847 114.012 672 24.491 112.613 673 25.312 111.814 674 25.962 110.315 675 26.770 109.016 676 27.300 107.117 677 27.955 105.418 678 27.924 103.41920
14 20 3 24 6 4219 14 3 24 6 4239 5 24 6 4248 8 1 24 6 4253 1 1 24 6 4256 0 1 24 6 4266 -10 1 24 6 4269 4 1 24 6 4270 6 1 24 6 4272 7 1 24 6 4277 0 1 24 6 4293 7 3 24 6 4296 -22 3 24 6 42115 3 1 24 6 42119 -9 24 6 42132 6 24 6 42134 14 1 24 6 42139 5 24 6 42
00
250000
0/3000
0/300/11
00
25250
25
TRUNCATED

DATA FOR ONE TEAM-SHOT
43EXPERIMENT NO. 12 NEVADA TEST SITE, 1980-1982SHOT NUMBER 4 TEAM 5SHOT POINT 4SHOT TIME: 119: 4: 0 0.014
LOC DIST(KM) AZIM
1 118 47.969 103.52 681 48.654 103.03 682 47.490 102.24 468 46.644 101.75 683 46.069 101.26 219 45.225 101.17 218 44.238 101.18 686 43.434 101.09 687 42,625 101.010 688 41.823 100.911 216 40.851 100.812 215 39.989 100.713 214 39.243 101.314 213 38.545 101.915 212 37.866 102.516 694 36.985 103.617 301 36.252 104.418 209 35.836 102.619 530 34.984 98.920 206 34.148 98.5
UNIT CHRON CHAN Cl C2 C3
3122328314573788283889299107108120128129131136
21
-55300
12-25633
-18411121
1 24 6422 24 6421 24 6422 24 6421 24 6421 24 6421 24 6421 24 642
24 6 421 24 6421 24 6422 24 6421 '' 6421 24 6421 24 6421 24 6421 24 6421 24 6421 24 6421 24 642
TAPEGRADE
00000000100000000000
44
Tape Grade Scale
0 - Good
1 - Tape did not run
2 - Tape ran but no signal
3 - Skipped record time
4 - Fast forward; no signal
5 - Rewound and erased
6 - Weak signal; cannot read TCT; low record level
7 - Continuous calibration of periodic offsets
8 - Noise, sinusoidal
9 - Noise, spike
10 - Noise, WWVB cross-feed
11 - Noise, periodic ticks
12 - Noise, random
13 - Bad clock
14 - Off frequency, tape speed
15 - Calibration
16 - Incomplete record; recorder stopped
17 - Bad time code
18 - Tape speed way off; belt slipped
19 - Turned on too early
20 - In for repair; not deployed
21 - Geophone disconnected or shorted
22 - Wrong unit number
23 - Wrong gain settings
24 - Late start
25 - Bad geophone test (usually no signal)
26 - One or more channels missing
27 - Bad WWVB
28 - Unit or tape damaged/vandalized
29 - Wrong program time
30 - Digitized without calibrations
31 - Amplifier out of balance

45
APPENDIX C
First Arrival Times
Appendix C is a listing of the first arrival times picked from the recordsections. Included are: shot point number, recorder site location, travel-time picks in both real and reduced (T-X/6) times, and distance (km) andazimuth of the recorder from the shot point.

46TRAVEL TRAVEL
SHOT RECORDER TIME TIMEPOINT LOCATION (REAL) (T-X/6) DISTANCE AZIMUTH
1 301 9.185 1.025 48.962 177.1471 310 9.319 1,005 49.884 176.9491 302 9.470 1.030 50.640 176.9651 303 9.726 1.000 52.354 176.8861 304 9.906 0.940 53.799 176.9501 305 10.116 0.895 55.325 176.9741 306 10.335 0.865 56.817 176.9701 307 10.584 0.860 58.342 177.1421 309 11.151 0.935 61.294 177.8341 308 10.938 0.970 59.809 177.4811 120 10.195 0.800 56.368 164.9591 121 9.994 0.905 54.532 164.8511 118 9.729 0.910 52.912 164.7171 219 9.356 1.025 49.985 166.4851 218 9.313 1.055 49.547 167.5011 216 9.155 1.135 48.117 171.1001 215 9.104 1.145 47.753 172.0361 116 9.700 0.870 52.982 161.4541 220 9.493 1.015 50.865 164.5731 210 9.133 1.089 48.260 176.8521 101 10.757 0.555 61.214 143.3581 102 10.122 0.515 57.642 140.2861 106 9.509 0.445 54.382 151.4851 107 9.424 0.480 53.664 152.7051 108 9.417 0.445 53.834 154.1911 109 9.368 0.440 53.569 154.8681 113 9.595 0.775 52.917 158.6401 112 9.409 0.605 52.822 157.5111 214 9.109 1.125 47.904 173.0381 213 9.187 1.175 48.073 173.9781 212 9.107 1.065 48.254 174.8941 208 8.905 1.020 47.308 177.5661 209 9.008 1.045 47.777 177.2451 207 8.738 1.100 45.826 177.2241 206 8.566 1.075 44.947 178.5861 204 8.513 1.165 44.090 182.0351 202 8.384 1.245 42.831 183.4831 201 8.394 1.310 42.503 184.1931 203 8.424 1.230 43.166 183.099
2 482 7.299 0.220 42.475 214.6552 483 7.497 0.305 43.152 215.3872 484 7.574 0.240 44.001 216.3832 485 7.681 0.235 44.676 216.8122 487 7.781 0.100 46.085 218.1892 488 7.949 0.165 46.702 218.8242 489 8.132 0.245 47.323 219.4532 490 8.457 0.465 47.955 220.0512 421 5.763 0.210 33.319 197.8392 422 5.772 0.230 33.249 198.918

47TRAVEL TRAVEL
SHOT RECORDER TIME TIMEPOINT LOCATION (REAL) (T-X/6) DISTANCE AZIMUTH
… … _ _ _ - - - - - - -
2 106 5.764 0.185 33.473 199.6782 424 5.878 0.235 33.856 200.7402 109 6.074 0.185 35.337 204.2022 110 6.188 0.185 36.016 205.3692 111 6.302 0.240 36.371 206.3742 401 5.182 0.500 28.090 180.7582 402 5.038 0.360 28.071 183.1852 403 5.112 0.430 28.090 186.1992 404 5.325 0.490 29.010 188.6172 405 5.460 0.470 29.941 189.8932 406 5.579 0.440 30.834 190.6182 407 5,669 0.390 31.674 191.5042 408 5.575 0.170 32,431 192.6042 409 5.875 0.295 33.480 193.6212 410 5.827 0.210 33.699 194.9132 448 10.387 0.845 57.254 217.0952 447 10.245 0.880 56.193 217.3542 446 10.082 0.885 55,182 217.5822 113 6.680 0.415 37,588 208.5572 114 6.809 0.410 38.394 209.2802 115 7.052 0.555 38.982 210.0572 116 6.943 0.340 39.616 210.9852 117 7.111 0.360 40.506 212.1822 466 6.708 0.410 37.790 216.5542 467 6.989 0.375 39.684 216.5592 468 7.121 0.290 40.989 216.2992 469 7.296 0,230 42.397 216.7352 441 9.028 0.818 49.262 219.2662 442 9.286 0.846 50.636 218,8222 443 9.384 0.739 51.867 218.4412 445 9.968 0.939 54.172 217.8202 449 10.488 0.854 57.804 216.9952 450 10.798 0.882 59.494 216.601
3 522 9.364 1.405 47.752 193.9223 561 15.341 0.950 86.347 203.7033 521 9.289 1.365 47.543 194.8933 524 9.511 1.325 49.117 192.6843 523 9.432 1.400 48.192 193.3923 526 9.509 1.170 50.034 191.3343 527 9.581 1.110 50.828 190.8343 530 9.747 1.110 51.822 187.4413 301 10.194 0.970 55.347 186.4063 303 10.707 0.930 58.662 185.6453 304 10.936 0.920 60.099 185.4923 446 11.828 0.780 66.286 184.3203 444 11.526 0.775 64.507 183.7733 563 15.082 0.950 84.795 204.0183 564 14.951 0.950 84.004 204.1833 565 14.825 0.950 83.250 204.320

48
SHOTPOINT_3
3333333333333333333333333333333333333333333
RECORDERLOCATION
567569570572573574575576577578542541543548550553554557555559560552505506507509515517518520584585586592598600519516514511502501594
TRAVELTIME
(REAL)
14.55314.25814.11813.80513.65313.52313. 28913. 09312. 88212. 64512.20312. 34512 .05911.54211.38711.09511.00710.72310.50710.42110.10710.24718.74718.39018.09117.98617.28516.83716. 56716.29113.11513.35813,43014.36715.35115.74316. 46416.79617 .04817.58018.98519.05614. 645
TRAVELTIME
(T-X/6)
0.9300.8850.9801.0451.1251.1801.1351.1401.1101.0501.0351.0551.0301.1951.2251.2801.3201.3701.4401.4451.4251.4301.1350.9150.7550.9201.1600.9800.8350.8400.8650.9500.8650.8180.8460.9180.8750.8040.7890.7820.9680.8960.775
DISTANCE
81.73980.24078.83176.55775.16974.05572.92471.71970.63469.56867.00767.73966.17162.08060.97358.88858.12156.11654.40453.85852.09352.900
105.672104.849104.018102.39596.75295.14194.39292.70773.49974.45175.39081.29387.02688.95293,53195.95297 .550
100.785108.102108.96083.220
AZIMUTH
204.672205.018205.062205.263205.376205.420205.461205.460205.177204.881204.432204.458203.813204.014204.187204.187204.187203,934204.409204.578204.958204.702184.668184.708184.741184.812185.059185.132185.169185.262185.428185.181185.216185.425185.486185.457185 .220185.094185.018184.888184.575184.533185.490
444444
642643644646647648
0.2950.4240.5280.8701.0451.207
0.1820.1390.1040.1540.1960.225
0.6761.7082.5444.2965.0895.894
93.697106.839101.497
84. 43083.39982.779

49
SHOTPOINT_ _ _
RECORDERLOCATION
TRAVELTIME
(REAL)_ _ _ _ _
TRAVELTIME
(T-X/6)_ _ _ _
DISTANCE AZIMUTH- -_ _ _ _ _
4 6494 6504 6514 6524 6534 6544 6554 6564 6574 6584 6594 6604 6614 6624 6644 6654 6664 6674 6684 6694 6704 6714 6724 6734 6744 6774 6384 6394 2014 6374 6404 6364 6354 6334 5284 6314 6304 5304 2094 2124 2134 2144 2154 2044 6344 6214 2064 6224 6294 625
1.3581.4861.6311 .7791.9552.0152.0852.2032.2222.4552.5252.6562.7712.9893.6083.8004.0024.2094,4994.5424.6444.7284.9425.1295.2095.4995.8165.8435.8665.9055.9075*9475.9635.9966.1546.1106.3246.4346.7196.9076.9637.0807.2406.1396.1356.2936.3526.5416.5036.504
0.2460.2750.2890.3040 .3250.3180.3180.3390.2540.3680.3250.3040.3320.3960.5040.5460.6110.6820.8460.7460.7180.7540.8610.9110.8820.8390.9610.9250.9250.9250.8680.8750.8320.6890.7890.5960.5680.6040.7460.5960.5390.5390.5750.9110.9110.6110.6610.6750.6320.625
6.6697.2698.0518.8559,779
10.18310.60111.18011.81312.52413.20114.11614.63415.55518.62619.52020.35121,16421.91422.77223 .55623. 84724.49125,31225.96227.95529.13229.50629.64729 .88030.23330.43430.78231.84032.19033. 07934. 53634.98435. 83637.86638. 54539.24339.98931. 36931.34934.09434.14835.19735.22535.275
83 .57187.94490.70590.67989.38592428096.12599. 645
101.401100.858100.56099.720
107. 739110.200118.008117,610117.492117.298117.203117.045117.055113.955112.617111.845110.251105.422101.249103 .56994.859
101.372106.081101.544101.702104.90098.696
106,412106.725
98 .891102.642102.481101.871101,275100.685
97. 663103. 14099 .59598 .51394. 007
105,54991.466

soTRAVEL TRAVEL
SHOT RECORDER TIME TIMEPOINT LOCATION (REAL) (T-X/6) DISTANCE AZIMUTH
… … _ _ _ -------
4 624 6.595 0.568 36.164 89.2444 301 6.681 0.639 36.252 104.4124 623 6.845 0.696 36.894 86.9844 694 6.754 0.589 36.985 103.5914 116 8.978 0.539 50.631 101.7974 115 9.077 0.504 51.439 101.3564 114 9.184 0.496 52.124 100.9234 113 9.252 0.446 52.831 100.2534 112 9.362 0,418 53.667 99.5744 111 9.444 0,354 54.543 99.4704 110 9.555 0.346 55.254 99.3024 109 9.745 0,389 56.137 98.8324 108 10.258 0,789 56.812 98.6924 424 10.108 0.354 58.526 97.9064 106 10.095 0.225 59.218 97.6724 422 10.417 0.468 59.697 97.5484 409 11.029 0.575 62.722 98.1824 408 11.027 0.461 63.400 97.2844 620 11.522 0.654 65.211 95.0524 216 7.412 0.604 40.851 100.8074 688 7.595 0.625 41.823 100.9244 686 7.821 0.582 43.434 101.0234 218 7.934 0.561 44.238 101.0704 219 8.098 0.561 45.225 101.1204 683 8.499 0.821 46.069 101.1514 468 8.573 0.799 46.644 101.6554 682 8.663 0.748 47.490 102.2384 118 8.726 0.731 47.969 103.4564 681 8.797 0.688 48.654 102.996
GPO 787-042/117

THIS PAGE IS ANOVERSIZED DRAWING OR
FIGURE,
THAT CAN BE VIEWED AT THERECORD TITLED:
"NEVADA TEST SITE NUMBEREDRECORDER SITE LOCATION BY LYNN
R. HOFFMAN & WALTERD.MOONEY."
WITHIN THIS PACKAGE.
D-01