wind application guide - baker hughes digital solutions | inspection… · 2018-11-30 · 3 of 17...
TRANSCRIPT

Bently Nevada* Asset Condition Monitoring
Wind Application Guide
1 PurposeTo provide a single document outlining the best practices in condition monitoring solutions (CMS) for the wind turbine power generation industry with Bently Nevada products, services, and capabilities from Baker Hughes, a GE company.
2 ScopeThis document describes the wind turbine monitoring and diagnostics objectives, business case and ROI justification, and other related information to achieve a well-qualified and successful customer implementation and outcome. This document will help the reader understand different needs and how a suitable successful solution to meet customer technical, operational, and commercial needs can be implemented.
bhge.com

2 of 17 Wind Application Guide
3 Contents1 Purpose 1
2 Scope 1
3 Table of Contents 2
4 Wind Turbine Condition Monitoring 34.1 General 34.2 Mechanical Overview 34.3 Wind Turbine Reliability 54.4 Wind Farm Lifetime and Costs 64.5 Bently Nevada Monitoring System 74.6 Transducer Selection 8
5 ADAPT.Wind 105.1 Remote Support 105.2 Exception Report 115.3 Monthly Report 13
6 Complementary Wind Turbine Technology/Solutions 146.1 Remote Visual Inspection – Borescope 146.2 Remote Visual Inspection – Robotic Crawler 156.3 Remote Visual Inspection – Advanced Technology 156.4 SmartSignal 16

3 of 17 Wind Application Guide
4 Wind Turbine Condition Monitoring4.1 General
Wind farm owner/operators seek to achieve the optimum availability and power generation from their wind farm throughout the predicted 20 to 25 year life expectancy. These objectives are aligned to various operational, availability and financial targets to meet power purchase agreements (PPAs) or supply agreements.
Bently Nevada’s objective is to provide customers with the insight and foresight to be able to identify issues and trends and convert this into actionable information. Enabling customers to transition from traditional time-based maintenance activities to more proactive-performance based maintenance will significantly reduce asset risk and escalating Operations and Maintenance (O&M) costs.
The primary purpose of implementing an online Condition Monitoring System (CMS) solution in a wind turbine is to provide early detection of issues, to identify trends and to ultimately mitigate the risk of catastrophic failures.
Wind turbines are complex machines based on a drive train containing several critical components. By their very nature, they often operate in hostile environments and are subject to significant variable environmental factors, such as heat, icing, and aerodynamic and mechanical forces. Nacelles, which house the drive train, often weigh in excess of 60 tons and are elevated over 100 m above ground level (AGL). Many of the drive train components (main bearing, gearbox and generator) are susceptible to various known failure modes. Undertaking up-tower condition based proactive maintenance substantially reduces avoidable up-tower repairs.
Bently Nevada’s primary focus and current capability is creating solutions that provide early detection of deterioration and potential failure within the drive train. This is achieved with sophisticated vibration measurement technology that detects, alarms and notifies operators on changes of state.
Complementary solutions are available from GE that address other areas of the turbine, or specific service activities. The detail of these solutions is outside the scope of this document; however, references will be made so the reader has an appreciation of related GE capabilities.
4.2 Mechanical Overview
Wind turbines transfer wind energy into electrical power. They consist of 3 main parts: the tower, blades, and nacelle.
The Pitch Motors adjust the blade angles to compensate for wind speeds. Blades remain at full attack (maximum wind capture) until max rpm is achieved. Therefore, rpm is variable. At wind speeds above max rpm, blades begin to feather (shed wind) as needed to maintain max rpm. When wind speed decreases below the minimum required to maintain speed, rotor speed will drop.
The nacelle typically contains major components such as the main bearing(s), the gearbox, and the generator. All three of these components benefit from a condition monitoring program. A brief description is provided below:
Main Bearing(s): Carries the load of the main shaft, which is carrying the mass of the hub and blades along with transmitted aerodynamic forces.
Gearbox: Increases the speed of the main shaft from about 18 rpm to about 1440 rpm. It also acts as a torque reducer.
Generator: Converts the rpm from the high speed shaft into AC electricity.
Other components of the nacelle include the bedplate, which carries the load of all nacelle components; Top Box, which houses all electrical/communication components; and the pitch and yaw motors, which are used to align the blades and nacelle into the prevailing wind.
Typical modern industrial sized wind turbines generate 1.5 MW and above. Technical advances in blade, drivetrain, and tower design will continue to increase output to well above 5MW. A wind farm can consist of a single turbine or up to several hundred wind turbines.
Turbine development continues to advance at a rapid rate. Generally, no two wind farms are the same, because OEMs design the layout and configuration of their turbines to suit the environment in which they will operate. This will include tower height, blade lengths and redesigned components based on existing field experience. Many OEMs will source gearboxes, generators and bearings from a variety of suppliers and therefore it cannot be assumed that a particular turbine model number will all be configured with the same components.

4 of 17 Wind Application Guide
The following table outlines the different components of wind turbines and what condition monitoring solutions are available:
Component Problems
AD
AP
T.W
ind
Smar
tSig
nal
Insp
ecti
on
Tech
nolo
gies
Gearbox (if present)
Rolling element bearing failures
Cracked/missing teeth
Oil debris/particle detection (requires sensor)✔ ✔
GeneratorRolling element bearing failures
Stator/Rotor electrical and mechanical faults ✔ ✔
Main Bearing Rolling element bearing failures ✔ ✔
Main Shaft Shaft crack ✔
Tower Tower sway ✔ ✔
Supporting StructureCracking
Soft foot ✔ ✔
CouplingMisalignment
Looseness ✔ ✔
Electrical System Electrical faults ✔
Electronic Control Electrical faults ✔
Sensors Electrical and mechanical faults ✔ ✔
Hydraulic System Performance, leakage ✔
Yaw System Performance ✔
Rotor/Main Shaft Cracking ✔ ✔
Mechanical Break Performance ✔
Rotor Hub Performance ✔

5 of 17 Wind Application Guide
4.3 Wind Turbine Reliability
Wind farms and turbines are typically designed and modeled to operate for a 20 to 25 year lifecycle. Once commissioned, the turbines are typically supported by the turbine vendor under a warranty program for the first 2-5 years. Turbine vendors are particularly sensitive to disclosing faults encountered during this period. However, as the industry has matured, significant evidence now exists that issues are encountered in the early life which may be considered as design flaws. As the turbine matures, wear and operational issues are encountered, and it is forecast that fatigue issues will become evident as the turbine ages.
Unfortunately, experience throughout the industry shows the drive train life span is much shorter than planned for, or anticipated. Many vendors have performed highly accelerated life tests (HALT)
and other measures to predict the anticipated life expectancy. However, real life field experience is demonstrating that major components are failing well in advance of their anticipated failure rate. This is partly because these power generation assets are not located in environmentally protected areas and are subjected to large temperature variations, rain, ice, lightning, heat and high winds. Furthermore, unless appropriate maintenance is performed in a timely manner, turbines may incur even more serious failures.
The following reliability bath tub graph is well understood by reliability engineers who recognize that all electro-mechanical devices transition through various phases and failures modes throughout the asset predicted life.
As the wind industry is in its relative infancy compared to other power generation industries, more emphasis has been placed by the turbine manufacturers and major component OEMS on the infant mortality phase. This is primarily for two reasons—firstly to ensure that turbines are designed well, optimized for the environment they are intended to be operated in, and that the turbines are manufactured and assembled to the highest quality standards. The second reason is to mitigate potential warranty liabilities. Manufactures and OEMs place significant emphasis on Weibull analysis for estimating the probability of failures at a specific time, the mean life, and the failure rate.
It is known that some suppliers are more overly optimistic with Weibull analysis than the turbine owners themselves who have real life experience of operating their assets. It is also known that not all turbines are manufactured, or constructed as well as was intended. This leads to significant unforeseen failures. In fact, there is well documented evidence of turbine manufacturers ceasing to exist to due to warranty liabilities for blade and gearbox remediation’s.
As the turbine transitions from the warranty phase/infant mortality phase, reliability becomes more influenced by environmental factors such as wind consistency and temperature fluctuations. However, the most significant factor is the quality and frequency of the maintenance applied to the turbine. Many different maintenance strategies exist, from run to failure, corrective, predictive to the latest and most optimal method of APM (asset performance management).
Maintenance strategy
• Asset performance management
• Preventative/scheduled
• Corrective
• Proactive
• Time based
• Run to failure
The final phase is the wear out phase and the industry has not experienced many MW class turbines in this stage of their life,

6 of 17 Wind Application Guide
therefore it is unable to provide specific field evidence of how reliable these larger turbine classes will be. This stage will be extremely site specific and proportional to how the turbines have been operated and maintained in the preceding 10 to 15 years.
Already we have started to experience fatigue issues, such as main rotor cracking and foundation cracking.
As new technology advances through digital transformation, there will be a desire to upgrade turbine control systems, major components, and other areas to drive more power and availability. These factors will place further load on the turbine. Questions and evaluations must be answered and performed to understand and qualify if upgrades can be applied and (or if) the wind farm life can be extended. Having historical data on the reliability and maintenance of the wind farm will enable more informed decisions to be made and to operate the wind farm in the most optimized way. It is possible to envisage a scenario of a 100-turbine wind farm, where certain turbines are healthy enough to be upgraded, or even life extended, whereas other turbines may have to be de-rated to achieve their expected and forecast lifespan.
Owner/operators need to be considering a maintenance strategy as early as possible to be able to mitigate against rising O&M costs, de-risking their wind farm from potential unplanned failures, and/or mitigating against reducing availability which would result in the wind farm being less competitive that those that have an integrated APM culture.
Typically, Bently Nevada uses vibration based technologies to determine wind turbine drive train anomalies and failures. This has been determined through extensive cost benefit analysis and research. The industry continues to place significant focus on reducing turbine costs and achieving improved LCOE (levelized cost of energy). For this reason, vibration monitoring has become the accepted norm within the wind industry. However, there are several other techniques and technologies the can also be used for specific issues. The following graph indicates the different technique, technologies, and advance detection capabilities.
4.4 Wind Farm Lifetime and Costs
In the Wind industry, the main driver for condition monitoring is avoiding downtime of the unit and mitigating unplanned costs. The average yearly production loss of a 2.5 MW unit is only around 2500 USD. The main cost is on the operations and maintenance work that is needed and especially the mobilization of costly tools. The cost to hire a crane per day is around $56,000 USD, and, when unplanned, the average time to get a crane to a site is around 6 weeks. This makes early problem detection highly desirable, since it may allow an up-tower repair before a non-recoverable defect occurs or, if detected early enough, bring the unit back into a healthy condition.
Early detection also may allow scheduled use of crane time for multiple turbines. There are now a number of qualified up-tower gearbox repairs that can be performed when detected early.
When an early potential failure has been detected, dependable knowledge of the wind turbine condition may enable continued operation and revenue generation until the maintenance work can be performed. When a defect is not significant, online monitoring mitigates the risk of run to failure, an unplanned outage or catastrophic event. Additional benefits of early detection of gearbox faults include the additional “core value” of a lightly damaged gearbox and being able to run at a de-rated condition until repairs/replacements are made.
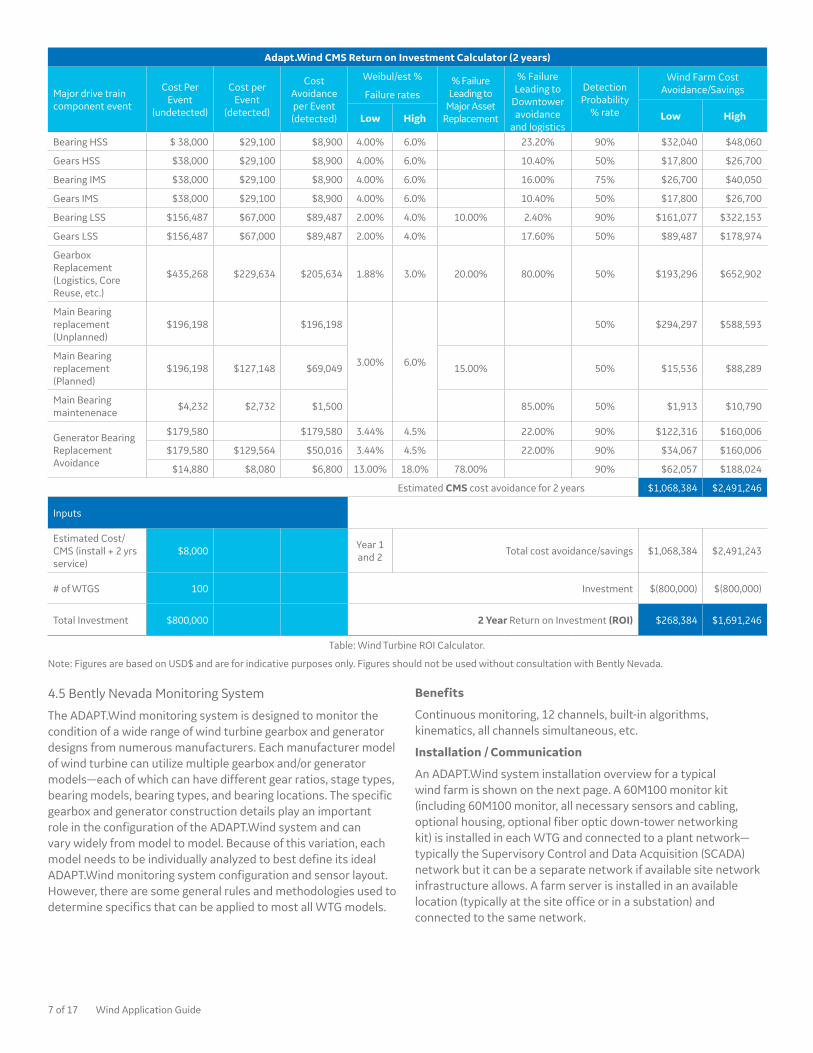
From a maintenance point of view the biggest impact is on rotating components, especially the gearbox. A Wind Turbine ROI calculator has been developed (as follows) which allows customers to estimate potential savings that could be achieved with proper condition monitoring. The calculator entries can be modified based upon customer and industry experience with the failure rate of different components and associated relative costs. The ROI calculator is very much a working model that breaks down the typical failure modes of the drive train. It then allows the customer to input their variables, such as the cost they incur for repairs, their Weibull estimates within high and low ranges, followed by the probability detection rate. We recognize that every wind farm is different from design, environment, topography, and operational age. Maintenance and services agreements may further complicate this, as well as the effectiveness of self-performers. The purpose of the calculator is to provide a tool that enables customers considering condition monitoring to model their costs and potential benefits.
7 of 17 Wind Application Guide
Adapt.Wind CMS Return on Investment Calculator (2 years)
Major drive train component event
Cost Per Event
(undetected)
Cost per Event
(detected)
Cost Avoidance per Event (detected)
Weibul/est %
Failure rates% Failure
Leading to Major Asset
Replacement
% Failure Leading to
Downtower avoidance
and logistics
Detection Probability
% rate
Wind Farm Cost Avoidance/Savings
Low HighLow High
Bearing HSS $ 38,000 $29,100 $8,900 4.00% 6.0% 23.20% 90% $32,040 $48,060
Gears HSS $38,000 $29,100 $8,900 4.00% 6.0% 10.40% 50% $17,800 $26,700
Bearing IMS $38,000 $29,100 $8,900 4.00% 6.0% 16.00% 75% $26,700 $40,050
Gears IMS $38,000 $29,100 $8,900 4.00% 6.0% 10.40% 50% $17,800 $26,700
Bearing LSS $156,487 $67,000 $89,487 2.00% 4.0% 10.00% 2.40% 90% $161,077 $322,153
Gears LSS $156,487 $67,000 $89,487 2.00% 4.0% 17.60% 50% $89,487 $178,974
Gearbox Replacement (Logistics, Core Reuse, etc.)
$435,268 $229,634 $205,634 1.88% 3.0% 20.00% 80.00% 50% $193,296 $652,902
Main Bearing replacement (Unplanned)
$196,198 $196,198
3.00% 6.0%
50% $294,297 $588,593
Main Bearing replacement (Planned)
$196,198 $127,148 $69,049 15.00% 50% $15,536 $88,289
Main Bearing maintenenace
$4,232 $2,732 $1,500 85.00% 50% $1,913 $10,790
Generator Bearing Replacement Avoidance
$179,580 $179,580 3.44% 4.5% 22.00% 90% $122,316 $160,006
$179,580 $129,564 $50,016 3.44% 4.5% 22.00% 90% $34,067 $160,006
$14,880 $8,080 $6,800 13.00% 18.0% 78.00% 90% $62,057 $188,024
Estimated CMS cost avoidance for 2 years $1,068,384 $2,491,246
Inputs
Estimated Cost/CMS (install + 2 yrs service)
$8,000Year 1 and 2
Total cost avoidance/savings $1,068,384 $2,491,243
# of WTGS 100 Investment $(800,000) $(800,000)
Total Investment $800,000 2 Year Return on Investment (ROI) $268,384 $1,691,246
Table: Wind Turbine ROI Calculator.
Note: Figures are based on USD$ and are for indicative purposes only. Figures should not be used without consultation with Bently Nevada.
4.5 Bently Nevada Monitoring System
The ADAPT.Wind monitoring system is designed to monitor the condition of a wide range of wind turbine gearbox and generator designs from numerous manufacturers. Each manufacturer model of wind turbine can utilize multiple gearbox and/or generator models—each of which can have different gear ratios, stage types, bearing models, bearing types, and bearing locations. The specific gearbox and generator construction details play an important role in the configuration of the ADAPT.Wind system and can vary widely from model to model. Because of this variation, each model needs to be individually analyzed to best define its ideal ADAPT.Wind monitoring system configuration and sensor layout. However, there are some general rules and methodologies used to determine specifics that can be applied to most all WTG models.
Benefits
Continuous monitoring, 12 channels, built-in algorithms, kinematics, all channels simultaneous, etc.
Installation / Communication
An ADAPT.Wind system installation overview for a typical wind farm is shown on the next page. A 60M100 monitor kit (including 60M100 monitor, all necessary sensors and cabling, optional housing, optional fiber optic down-tower networking kit) is installed in each WTG and connected to a plant network—typically the Supervisory Control and Data Acquisition (SCADA) network but it can be a separate network if available site network infrastructure allows. A farm server is installed in an available location (typically at the site office or in a substation) and connected to the same network.

8 of 17 Wind Application Guide
ADAPT.Wind System Installation Overview
Each monitored drivetrain has its own 60M100 monitor. Vibration data and alarm statuses are transmitted to the farm server for storage, using the SCADA Network. Data communication between the monitors and the farm server is maintained below 1 Mbps to avoid congestion on the SCADA network, which is typically a 100 Mbps fiber optic loop for a large wind farm.
60M100 Adapt.Wind Monitor installed in turbine control unit/top box
60M100 Adapt.Wind mounted in an optional housing/enclosure
The Farm Client application can be accessed onsite through local workstations connected to the network. It can also be accessed remotely over a Wide Area Network (WAN), through a firewall that maintains security of the SCADA network. If network communication is interrupted for any reason, the monitor will continue to store historical data in its internal non-volatile memory for up to two weeks. When communication is restored, the farm server will retrieve the stored data from each of the monitors in the network.
4.6 Transducer Selection
Typically, 6 acceleration sensors are used to monitor WTGs with 1 main bearing (and 7 acceleration sensors are used to monitor WTGs with 2 main bearings). These accelerometers have a mounted resonant frequency (under ideal mounting conditions) of >25 kHz and typical bias voltage range of -10.5 Vdc to -13.0 Vdc. Following is a list of general guidelines used to determine proper sensor placement within a typical WTG.

9 of 17 Wind Application Guide
Typical Sensor Layout for 1.5 MW Class WTGs
Typical Sensor Layout for 2.0 MW Class WTGs

10 of 17 Wind Application Guide
5 ADAPT.WindThe ADAPT.Wind solution is an intuitive, user friendly and easily expandable system that is tailored specifically to meet wind turbine monitoring needs. The following screenshot provides a view of the wind farm status with turbines color coded with condition alarm status.
Features and functionality of ADAPT.Wind solution include:
• Trending of data
• Charting
• Trending and alarming along operating stages
• Filters data and reports alarms
• Automated Alarm notification
• Alarm status indication with different colors
• Allows sharing of data to a SCADA or DCS system
• RPM, numeric data and Alarm condition is updated ‘live’ to ensure the most recent information is available
5.1 Remote Support
Bently Nevada recognizes that not all owners/operators have the skills set, or capacity to perform deeper diagnosis beyond the initial alarm management. Therefore, Bently Nevada can offer a remote monitoring service where highly skilled Level 3 vibration analysts monitor and report on the turbine health at regular frequencies. The following examples of exception reports and monthly reports provide operators with actionable information for operating and maintaining their turbines.

11 of 17 Wind Application Guide
5.2 Exception Report
SSA Exception ReportAlarm & Event Management
Customer: ACME LLC Site: High Ridge, Texas
Wind Turbine: WTG 121 Comp: HSIS DnWind
Report Date: XX-XXX-XX
Report: http://libraries.ge.com/systemfiledownload
Case #: n/a
Author: RMC Engineer Email: [email protected] Phone: 775-XXX-XXXX
RMC: Minden, NV Email: [email protected] Phone: 775-XXX-XXXX
Condition:
This document represents a preliminary assessment of a potential issue or change of operating conditions.
Any conclusions and/or recommendations are subject to change following additional MDS work and review upon request.
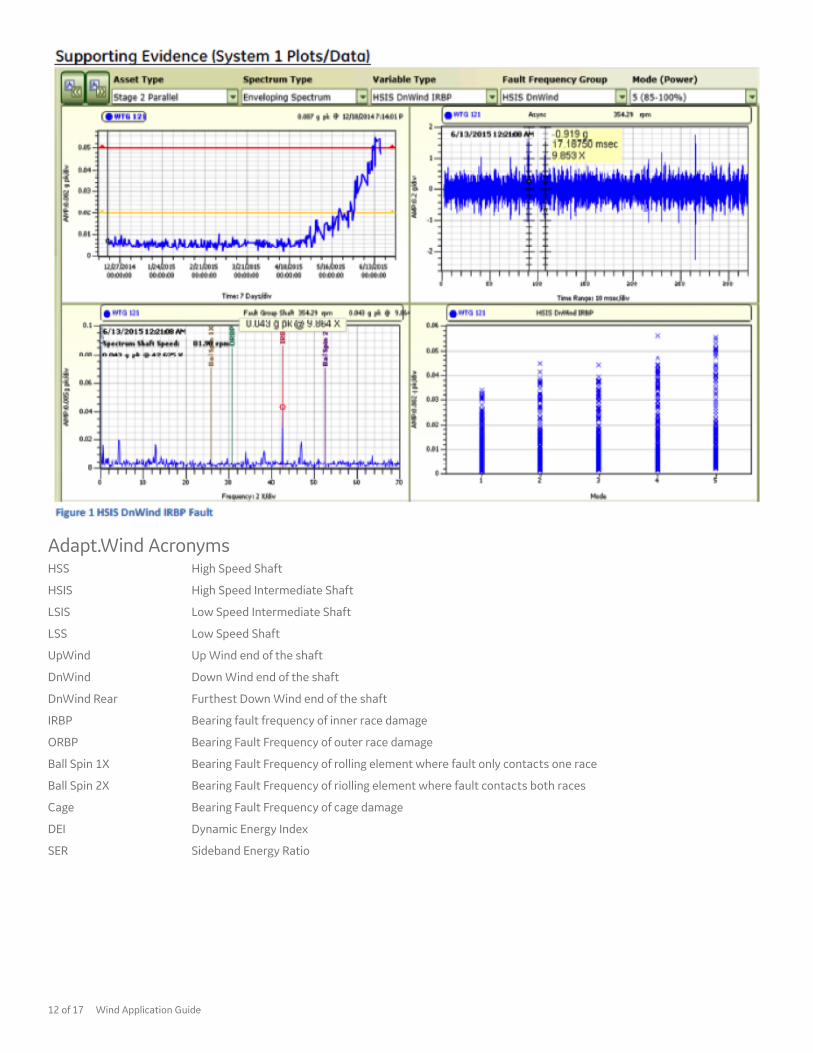
1. The HSIS DnWind IRBP fault has exceeded its Alert Setpoint. (XX-XXX-XX)
Details of Findings:
The HSIS DnWInd IRBP fault frequency has exceeded its Alert setpoint and triggered an alarm. The HSIS DnWind IRBP fault frequency is steadily increasing. The waveform modulation is also clearly evident. {figure 1 on following page}
12 of 17 Wind Application Guide
Adapt.Wind AcronymsHSS High Speed Shaft
HSIS High Speed Intermediate Shaft
LSIS Low Speed Intermediate Shaft
LSS Low Speed Shaft
UpWind Up Wind end of the shaft
DnWind Down Wind end of the shaft
DnWind Rear Furthest Down Wind end of the shaft
IRBP Bearing fault frequency of inner race damage
ORBP Bearing Fault Frequency of outer race damage
Ball Spin 1X Bearing Fault Frequency of rolling element where fault only contacts one race
Ball Spin 2X Bearing Fault Frequency of riolling element where fault contacts both races
Cage Bearing Fault Frequency of cage damage
DEI Dynamic Energy Index
SER Sideband Energy Ratio

13 of 17 Wind Application Guide
5.3 Monthly Report
Monthly Adapt.Wind Site Summary
Customer: ACME LLC
Site: High Ridge, Texas
Report Date: XX-XXX-XX
Author: RMC Engineer Email: [email protected] Phone: 775-XXX-XXXX
RMC: Minden, NV Email: [email protected] Phone: 775-XXX-XXXX
Notes:
As of XX-XXX-XX the site's turbine parameters have been updated to continue running the turbines up to 25 m/s wind speed instead of the normal 20 m/s.
Starting to see several Stage 3 SER Pinion in power mode 5, might be due to higher cutoff speed. Will need to continue to monitor (turbines 94, 98, 121).
Several main bearings have shown an increase in temperatures, inspection found low grease levels. (High main bearing temps found on 1, 23, 34, 71, 92, 141, 153, high vibs on: 088, 141, 153, 156)
Site Overview:
Turbine Priority Status Description Recommended Action
WTG 007 Urgent The HSIS DnWind IRBP fault has exceeded its Alert setpointImmediate inspection of gearbox.
WTG 057 -Stage 3 SER alarm pinion fault alarm. 10x HSS also is having harmonics w/ 1x sideband. See Figure 2.
Quick inspection.
WTG 104 -Stage 3 Parallel sensor indicating an electrical noise issue. See Figure 3 for examples. Techs tightened sensor connections on 10/24. Still appears to be an electrical noise issue.
Customer advisement.
Closed Items:
Turbine Date Description
WTG 021 XX-XXX-XX Generator Inboard sensor appears to be disconnected, or the sensor or wiring may be damaged. Issue fixed on XX-XXX-XX
WTG 122 XX-XXX-XXMain bearings experienced a significant increase starting on XX-XXX-XX, it appears that the upwind main bearing is the cause of the increase. The incrase does not appear to be consistently high. See Figure 4, Vibrations have reduced to normal levels.
WTG 157 XX-XXX-XXMain bearings experienced a significant increase starting on XX-XXX-XX. The increase does not appear to be consistent high. Vibrations decreased on 30DEC2014 to normal levels. See Figure 5 - vibrations have reduced to normal levels.

14 of 17 Wind Application Guide
6 Complementary Wind Turbine Technology/SolutionsGE's Inspection Technologies business offers a comprehensive selection of non-destructive testing (NDT) remote visual inspection (RVI) equipment—from basic borescopes and fiberscopes to measurement capable digital video borescopes, and pan-tilt-zoom (PTZ) camera systems and robotic crawler systems. GE's Inspection Technologies business has the right NDT visual inspection equipment for your needs for any industry. Our systems are portable and ruggedly built, to survive the rigors of industrial environments.
6.1 Remote Visual Inspection – Borescope
For inspection of gearbox internals, bearings, etc., a borescope is a useful tool. Ideally it should be portable and practical.
GE's XL Go+* Videoprobe* is one of the most portable and versatile video borescopes on the market today and—with new XpertSuite* features like enhanced steering responsiveness, improved probe light output, a sunlight readable LCD and optional external
monitor—provides excellent quality of defect information.
Offering a wide spectrum of features designed to make inspections easier, the XL Go+ VideoProbe system provides superior portability, image quality and ruggedness.
Large crack found on HSS bearing

15 of 17 Wind Application Guide
XL Go+ VideoProbe
6.2 Remote Visual Inspection – Robotic Crawler
ROVVER® 125 robotic crawler inside blade
Photo of damage from inside blade
For the visual inspection of turbine blades, a robotic crawler can be useful. Typically, the blade would be oriented horizontally (3 o’clock or 9 o’clock) and the crawler can be sent down the length of the blade while the technician operates the camera from a safe location.
The ROVVER® 125 robotic crawler is an example of a portable and versatile inspection crawler. It is ideal for many applications due to its modular design and ability to inspect inside pipes with diameters ranging from 150 mm (6 in.) to 900 mm (36 in.). As the smallest crawler in its class, the ROVVER can pass through restricted pipe, large offsets, and protruding pipe taps. The ROVVER crawler features a remote pendant to control focus and lighting and to steer the crawler when obstacles, such as debris or offsets, are present.
6.3 Remote Visual Inspection – Advanced Technology
For other remote visual inspection applications, the use of a power pan-tilt-zoom camera may be necessary. If a blade could be oriented vertically (6 o’clock), the camera could be lowered into it for a visual inspection of the inside. Or if the camera were strong enough, one could also inspect the outside remotely.
The Everest Ca-Zoom® 6.2 system is the world’s most advanced industrial pan-tilt-zoom camera system. The system features still image or full-motion video capture, CompactFlash® removable storage media, an available laser measurement system, and PC remote control and re-measurement software. The PTZ140 camera head can be deployed through 140 mm (5.5 inch) diameter openings, and features a high-performance 36x-optical and 12x-digital zoom capability, high-powered halogen lighting, and advanced camera setup features with our exclusive iVIEW* image management platform.

16 of 17 Wind Application Guide
6.4 SmartSignal
SmartSignal is a statistical modeling software package capable of providing automated and accurate early warning of a wide range of plant asset abnormalities by utilizing vibration and process data collected either from DCS/Data Historians and Bently Nevada monitoring systems.
With these early warnings, users can then take a “deeper-dive” into diagnostic and analytical techniques using the ADAPT software packages. Process data needed for adequate modeling includes, but is not limited to load, temperature, speed, vibration, etc. Benefits include:
• Early detection and diagnosis
• Immediate localization
• High true positives
• Ideal for applications where fixed warning/alarms levels are yet to be established
• Finds sensor issues to reduce doubt about your data
• Fast implementation using engineered templates personalized with your data
• Finds impending equipment issues early and with confidence
bhge.com
*Trademark of Baker Hughes, a GE company.
© 2017 Baker Hughes, a GE company, LLC – All rights reserved.
BHGE reserves the right to make changes in specifications and features shown herein, or discontinue the product described at any time without notice or obligation. Contact your BHGE representative for the most current information. The BHGE logo is a trademark of Baker Hughes, a GE company, LLC. Baker Hughes, a GE company and the GE monogram.
GEA33342 08/2017
Should you require any further information about Bently Nevada products, services, or solutions, you can get more information at https://www.gemeasurement.com/condition-monitoring-and-protection
If you are interested in a discussing any aspect of this document further, or if you would like a quotation please contact:
Stephen Donovan Global Wind Sales Leader – Baker Hughes, a GE Company Bently Nevada, Digital Solutions
[email protected] Cell: +44 (0)7584 557226 Office: +44 (0)1344 460500
2 The Arena, Downshire Way Berkshire, UK, RG12 1PU